welcome to distant learning for biology! students are
TRANSCRIPT

St. Louis Public Schools Continuous Learning for Students High School Biology
For questions related to this instructional plan, please contact: Valentina Bumbu Jeremy Resmann, Zachary Rhodes Science Curriculum Specialist Biology Teacher Leaders [email protected], [email protected], [email protected]
Welcome to Distant Learning for Biology! Students are encouraged to maintain contact with their home school and classroom teacher(s). If you have not already done so, please visit your child’s school website to access individual teacher web pages for specific learning/assignment information. If you cannot reach your teacher and have elected to use these resources, please be mindful that some learning activities may require students to reply online, while others may require students to respond using paper and pencil. In the event online access is not available and teacher cannot be reached, responses should be recorded on paper and completed work should be dropped off at your child’s school. Please contact your child’s school for the dates and times to drop off your child’s work.
If you need additional resources to support virtual learning, please visit: https://www.slps.org/extendedresources
To access all pdf files in this document go HERE
Lesson Objective What will you know and be able to do at the end of this lesson?
Instructional Activities What needs to be done in order to learn the material?
Resources What print and electronic resources are available to support your learning?
Assessment How will you show your teacher that you learned the material?
1. Use a model to describe the function of eukaryotic organelles and compare and contrast plant and animal cells.
1. Read Cells or watch the video on Introduction to Cells or engage with Cell Animation 2. Complete the Cell Organelles Task Sheet
Electronic Reading: Cells Video: https://www.youtube.com/watch?v=8IlzKri08kk&list=PLwL0Myd7Dk1F0iQPGrjehze3eDpco1eVz&t=0s Cell Animation: https://www.cellsalive.com/cells/cell_model.htm Print: Cell Organelles Task Sheet
Complete the Organelles task sheet.
2. Explain the steps of cellular respiration and fermentation.
1. Read Cellular Respiration or watch Cellular Respiration Video and Fermentation Video 2. Complete the worksheet Additional Resource: Simulation Photosynthesis and Cellular Respiration Simulation, Stage 1
Electronic Reading: https://www.khanacademy.org/science/biology/cellular-respiration-and-fermentation/overview-of-cellular-respiration-steps/a/steps-of-cellular-respiration Videos: https://www.youtube.com/watch?v=4Eo7JtRA7lg&list=PLwL0Myd7Dk1F0iQPGrjehze3eDpco1eVz&t=0s https://www.youtube.com/watch?v=YbdkbCU20_M&list=PLwL0Myd7Dk1F0iQPGrjehze3eDpco1eVz&index=25 Print:
Complete all parts of the Cellular Respiration task sheet

St. Louis Public Schools Continuous Learning for Students High School Biology
For questions related to this instructional plan, please contact: Valentina Bumbu Jeremy Resmann, Zachary Rhodes Science Curriculum Specialist Biology Teacher Leaders [email protected], [email protected], [email protected]
Respiration and Fermentation task sheet Simulation: Photosynthesis and Cellular Respiration https://my.hrw.com/sh2/sh07_10/student/flash/virtual_investigations/hst/act/hst_act_vi.html
3. Use a model to explain the process of photosynthesis and compare and contrast photosynthesis and cellular respiration.
1. Read Photosynthesis or watch the Video or engage with Simulation: Photosynthesis and Cellular Respiration Simulation, Stage 1 3. Complete Photosynthesis Worksheet 4. Review Cellular Respiration Video or reading 5. Complete Photosynthesis and Cellular Respiration Comparison worksheet
Electronic Reading: https://www.khanacademy.org/science/biology/photosynthesis-in-plants/introduction-to-stages-of-photosynthesis/a/intro-to-photosynthesis Photosynthesis Video: https://www.youtube.com/watch?v=uixA8ZXx0KU&list=PLwL0Myd7Dk1F0iQPGrjehze3eDpco1eVz&t=2s Simulation: Photosynthesis and Cellular Respiration https://my.hrw.com/sh2/sh07_10/student/flash/virtual_investigations/hst/act/hst_act_vi.html Print: Photosynthesis Worksheet Photosynthesis and Cellular Respiration Comparison Worksheet
Complete the photosynthesis worksheet Complete the comparison worksheet.
4. Use a model to describe the flow of matter (carbon and nitrogen) through the ecosystem.
1. Watch Carbon and Nitrogen Cycle Video 2. Engage in sense making with Nutrient Cycle POGIL
Video: https://www.youtube.com/watch?v=NHqEthRCqQ4&list=PLwL0Myd7Dk1F0iQPGrjehze3eDpco1eVz&t=0s Print: Nutrient Cycle POGIL
Complete all parts the nutrient cycle POGIL.
5. Use a model to describe and apply ecological relationships within food webs.
1. Read Watch Food Webs, Energy Pyramids and Biodiversity or watch Video 2. Complete Food Webs, Energy Pyramids and Biodiversity worksheet
Electronic Reading: https://www.khanacademy.org/science/biology/ecology/intro-to-ecosystems/a/food-chains-food-webs Video: Food Webs, Energy Pyramids and Biodiversity https://www.youtube.com/watch?v=-oVavgmveyY Print: Reading Watch Food Webs, Energy Pyramids and Biodiversity Food Webs, Energy Pyramids and Biodiversity Worksheet
Complete the worksheet using information from the video.

St. Louis Public Schools Continuous Learning for Students High School Biology
For questions related to this instructional plan, please contact: Valentina Bumbu Jeremy Resmann, Zachary Rhodes Science Curriculum Specialist Biology Teacher Leaders [email protected], [email protected], [email protected]
6. Analyze and interpret the biotic and abiotic factors population ecology
1. Watch Population Ecology: The Texas Mosquito Mystery Video (10 min) 2. Complete the Graphs Task sheet 3. Complete Logistic vs Exponential Model sheet
Video: https://www.khanacademy.org/science/biology/crash-
course-bio-ecology/crash-course-ecology-2/v/crash-course-
ecology-02
Print: Interpreting Population Ecology Graphs Task sheet Logistic vs. Exponential Model sheet
Analyze and interpret graphs of both sheets using information from the video.
7. Analyze and evaluate changes in the environment caused by human activity.
1. Watch 3 short videos: TED Ed Guide to Energy of the Earth (4 min) 5 Human Impacts on the Environment (10 min) Climate Change: Earth's Giant Game of Tetris (2 min) 2. Use the Ecology Videos Human Impact sheet for sense-making
Video 1: https://ed.ted.com/lessons/a-guide-to-the-energy-of-the-earth-joshua-m-sneideman#watch Video 2: https://www.youtube.com/watch?v=5eTCZ9L834s Video 3: https://ed.ted.com/lessons/climate-change-earth-s-giant-game-of-tetris-joss-fong Print: Ecology Videos Human Impact Student Guided Inquiry Sheet
Complete the Ecology Videos Human Impact student Guided Inquiry Sheet
8. Design a new invention that will improve damaged ecosystems.
1. Watch videos Lionfish Robot Zapper Hits the Open Water (40 sec) New Robot to Zap ‘Darwin’s Nightmare The Invasive Lionfish (5 min) 2. Read the Robot Zapper Article 3. Complete Stop Invasive Species Invention Proposal task sheet
Videos on Lionfish Robot Zapper: https://www.youtube.com/watch?v=gA2pFBE3ToM&feature=youtu.be https://www.youtube.com/watch?v=44GaC-YsAtQ&feature=youtu.be Electronic Article Robot Zapper: https://www.pbs.org/newshour/science/lionfish-zapper-hits-open-seas Print: Stop Invasive Species Invention Proposal task sheet
Use the worksheet to research a local invasive species and find a potential solution to bring back biodiversity in an ecosystem.
9. Apply population models to data sets and determine carrying capacity from population data
1. Engage with Modeling African Lion Population Computer Simulation (20 slides) 2. Complete the Transfer Task
Simulation: https://learn.concord.org/resources/102/african-lions-modeling-populations Print: Modeling Lion Populations Transfer Task
After completion of simulation slides do Modeling Lion Population transfer task.

St. Louis Public Schools Continuous Learning for Students High School Biology
For questions related to this instructional plan, please contact: Valentina Bumbu Jeremy Resmann, Zachary Rhodes Science Curriculum Specialist Biology Teacher Leaders [email protected], [email protected], [email protected]
10. Predict the positive or negative effects an organism has on an ecosystem.
1. Use the Click and Learn on Exploring Trophic Cascades 2. Watch Exploring Trophic Cascades Video 3. Complete the Exploring Trophic Cascades task sheet
Interactive Animation: https://media.hhmi.org/biointeractive/click/trophiccascades/ Video: https://www.biointeractive.org/classroom-resources/some-animals-are-more-equal-others-keystone-species-and-trophic-cascades Print: Exploring Trophic Cascades task sheet
Complete the Trophic Cascades task sheet.
11. Obtain, evaluate, and communicate information on tracking the spread of viruses throughout populations and calculating important epidemiological values.
1. Watch Virus Hunter Video 2. Read Nipah Article 3. Complete the Epidemiology activity sheet
Video: https://www.biointeractive.org/classroom-resources/virus-hunter-monitoring-nipah-virus-bat-populations Print: Nipah Article Epidemiology activity sheet
Complete the Epidemiology of Nipah Virus activity sheet
12. Summarize the purpose of a scientific study and explain the concepts to a general audience.
1. Read the electronic Research Article 2. Read “Scientists Can Now Repaint Butterfly Wings” Article 3. Complete the Student HO Winging It Activity
Electronic Article: https://www.pnas.org/content/114/40/10707
Print: Scientists Can Now Repaint Butterfly Wings Article Student HO Winging It Activity
Use the two articles to complete the ‘analyzing a scientific paper’ activity
13. Analyze and interpret scientific data in order to make informed decisions.
1. Watch Interpreting Scientific Data Video (8 min) 2. Complete the POGIL sheet
Video: https://www.youtube.com/watch?v=9NkT-oYPkOA Print: Analyzing and Interpreting Scientific Data (POGIL)
Apply the instructions from video to the POGIL activity.
14. Describe how scientists use ELISA to test for the presence of diseases.
1. Engage with the HHMI Immunology virtual lab 2. Complete the Immunology Lab student sheet
Simulation: https://media.hhmi.org/biointeractive/vlabs/immunology/index.html Print: Immunology Lab student sheet
Complete the accompanying virtual lab worksheet.
15. Explain, compare, and contrast survey methods that scientists
1. Engage with Click & Learn Survey Methods with Elephants case
Click and Learn Simulation: https://media.hhmi.org/biointeractive/click/elephants/survey/ Print: Elephants Survey Worksheet
Complete the elephant survey worksheet.

St. Louis Public Schools Continuous Learning for Students High School Biology
For questions related to this instructional plan, please contact: Valentina Bumbu Jeremy Resmann, Zachary Rhodes Science Curriculum Specialist Biology Teacher Leaders [email protected], [email protected], [email protected]
use to study large populations in nature.
2. Complete the Elephants Survey Worksheet

Biology Name:
Date:
Period:
Cell Organelles Worksheet Complete the following table by writing the name of the cell part or organelle in the right hand column that matches the structure/function in the left hand column. A cell part may be used more than once.
Structure/Function Cell Part
1. Stores material within the cell
2. Closely stacked, flattened sacs (plants only)
3. The sites of protein synthesis
4. Transports materials within the cell
5. The region inside the cell except for the nucleus
6. Organelle that manages or controls all the cell functions in a eukaryotic cell
7. Contains chlorophyll, a green pigment that traps energy from sunlight and gives plants their green color
8. Digests excess or worn-out cell parts, food particles and invading viruses or bacteria
9. Small bumps located on portions of the endoplasmic reticulum
10. Provides temporary storage of food, enzymes and waste products
11. Firm, protective structure that gives the cell its shape in plants, fungi, most bacteria and some protests
12. Produces a usable form of energy for the cell
13. Packages proteins for transport out of the cell
14. Everything inside the cell including the nucleus
15. Site where ribosomes are made
WS - Cell Organelles.doc

Put each of the following organelles into one of the four columns, based on their role in metabolism. Lysosomes Mitochondria Plasma membrane Vacuoles
!Put a check in the appropriate column(s) to indicate whether the following organelles are found in plant cells, animal cells or both.
16. The membrane surrounding the cell
17. Provides support for the cell, has two “subparts”
18. Name for the collection of DNA in the nucleus of eukaryotic cells
19. Consist of hollow tubes which provide support for the cell
20. Small hair-like structures used for movement or sensing things
21. Composed of a phospholipid bilayer
22. Longer whip-like structures used for movement
Ingestion Digestion Respiration Excretion
Organelle Plant Cells
Animal Cells
Cell Wall
Vesicle
Chloroplast
Chromatin
Cytoplasm
Cytoskeleton
Endoplasmic reticulum
Golgi apparatus
Lysosome
Mitochondria
Nucleolus
Nucleus
Plasma membrane
Central vacuole
Ribosome
Vacuole
Organelle Plant Cells
Animal Cells
Page !2

Name _______________________________________ Date ______________ Period _______
Worksheet: Cellular Respiration & Cell Energy B I O L O G Y
Directions: Answer the following questions using your class notes and textbook. Chemical Energy and Food 1. What is a calorie? 2. How many calories make up 1 Calorie? 3. Cellular respiration begins with a pathway called ______________________________ . 4. Is the following sentence true or false? Glycolysis releases a great amount of energy. T / F 5. What is cellular respiration? 6. What is the equation for cellular respiration, using chemical formulas? 7. Label the three main stages of cellular respiration on the illustration of the complete process. 8. Where does glycolysis take place? 9. Where do the Krebs cycle and electron transport take place?

10. What is glycolysis? 11. How does the cell get glycolysis going? 12. If the cell uses 2 ATP molecules at the beginning of glycolysis, how does it end up with a net gain of 2 ATP molecules? 13. What is NAD+ ?
14. What is fermentation? 15. How does fermentation allow glycolysis to continue? 16. Because fermentation does not require oxygen, it is said to be __________________________ . 17. What are the two main types of fermentation? 18. Because the final stages of cellular respiration require oxygen, they are said to be ___________________________. 19. Why is the Krebs cycle also known as the citric acid cycle? 20. What is the total number of ATP molecules formed during cellular respiration?

Name___________________________________________________ Date_____________ Period_______
Photosynthesis: Making Energy Objective:____________________________________________________________________________________________________________________________________________________________________________
Chloroplasts
Photosynthesis is a process in which sunlight energy is used to make
glucose. The site of photosynthesis is in the chloroplast – an organelle
found in the leaves of green plants. The main functions of chloroplasts are
to produce food (glucose) during photosynthesis, and to store food
energy. Chloroplasts contain the pigment, chlorophyll. Chlorophyll absorbs
most of the colors in the color spectrum, and reflects only green and
yellow wavelengths of light. This is why we see leaves as green or yellow –
because these colors are reflected into our eyes.
1. What is photosynthesis? ______________________________________________________
_________________________________________________________________________
2. Where does photosynthesis occur? ______________________________________________
3. What are chloroplasts and where are they found? ___________________________________
_________________________________________________________________________
4. What are the two main functions of chloroplasts? ___________________________________
5. Why doe most leaves appear green? _____________________________________________
6. What is the primary pigment found in the chloroplast? ________________________________
Photosynthesis
Glucose is another name for sugar. The molecular formula for glucose is C6H12O6. Plants make sugar by
using the energy from sunlight to transform CO2 from the air with water from the ground into glucose.
This process, called photosynthesis occurs in the chloroplast of the plant cell. During this process,
oxygen (O2) is created as a waste product and is released into the air for us to breath. The formula for
photosynthesis is:
(reactants) (products)
CO2 + H2O + sunlight ----> C6H12O6 + O2
This formula says that carbon dioxide + water molecules are combined with the energy from sunlight to
produce sugar and oxygen. The reactants in photosynthesis (what is used) are CO2, water and sun. The
plant gets water from the ground through its roots. The plant collects carbon dioxide from the air. Much
of the carbon dioxide comes from living organisms that exhale (breath it out) it, but some also comes
from factory smokestacks and car fumes.
7. What is the formula for photosynthesis? __________________________________________

Name___________________________________________________ Date_____________ Period_______
8. What three things are used to make glucose in photosynthesis? _________________________
_________________________________________________________________________
9. Where does the water come from? ______________________________________________
10. Where does the water enter the plant? ___________________________________________
11. Name 3 some sources of CO2. _________________________________________________
12. What type of energy does the plant use to convert CO2 and H2O into sugar? ________________
The products are glucose and oxygen. The glucose produced is used by the plant for energy and growth.
We also use this glucose by eating plants. The oxygen produced is released into the air for us to breath.
Photosynthesis is essential for all life on earth, because it provides food and oxygen. Plants are
considered autotrophs because unlike us humans, they can make their own food using this process.
13. What is produced in photosynthesis? _____________________________________________
14. What is the glucose used for? __________________________________________________
15. What is the oxygen used for? __________________________________________________
16. Here are three different ways to visualize the photosynthesis reaction: Is it easier for
you to understand the reaction by using pictures, words, or symbols (see above)? Why?
_____________________________________________________________________
_____________________________________________________________________
Photosynthesis in pictures Photosynthesis in words Photosynthesis in symbols
Carbon dioxide and
water combine with
sunlight to create
oxygen and glucose.
light
CO + H2O → C6H12O6 + O2
Essential Question: Describe, using scientific terms, how plants turn sunlight into energy? Make
sure to refer to the chemical equation to photosynthesis and discus the reactants and products.
___________________________________________________________________________
___________________________________________________________________________
___________________________________________________________________________
___________________________________________________________________________
___________________________________________________________________________
___________________________________________________________________________
AMOEBA SISTERS: VIDEO RECAP PHOTOSYNTHESIS AND CELLULAR RESPIRATION COMPARISON
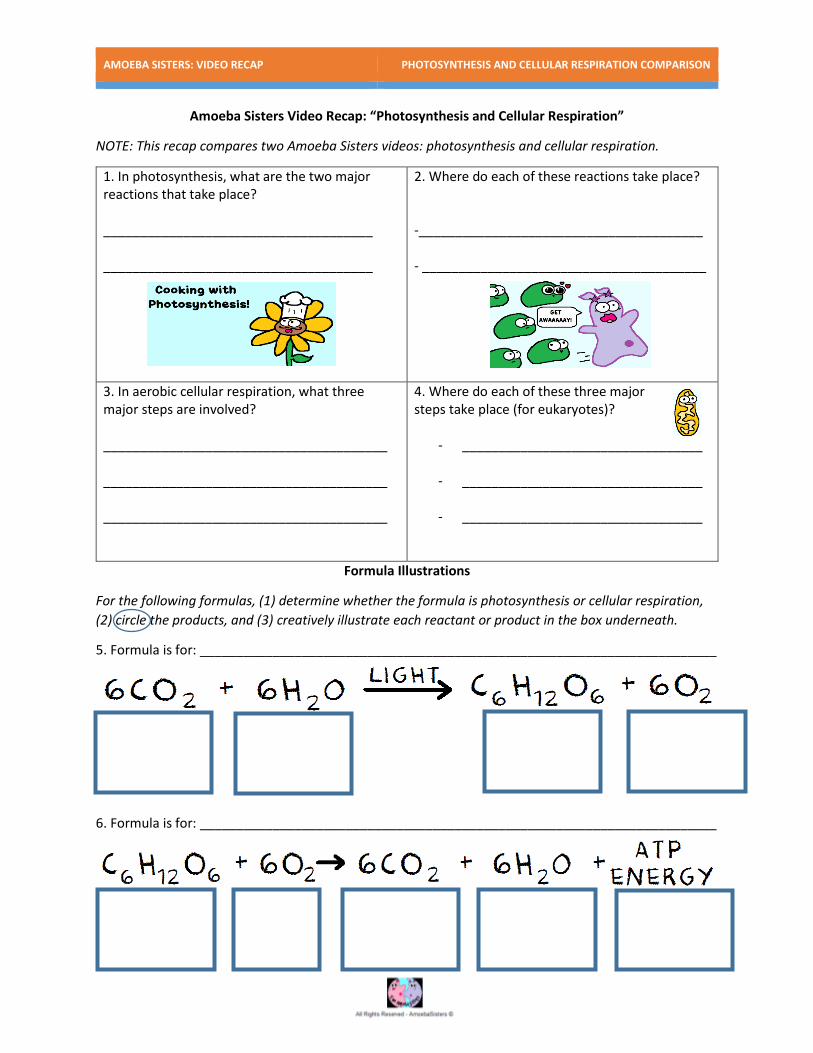
Amoeba Sisters Video Recap: “Photosynthesis and Cellular Respiration”
NOTE: This recap compares two Amoeba Sisters videos: photosynthesis and cellular respiration.
1. In photosynthesis, what are the two major reactions that take place? _____________________________________ _____________________________________
2. Where do each of these reactions take place? -_______________________________________ - _______________________________________
3. In aerobic cellular respiration, what three major steps are involved? _______________________________________ _______________________________________ _______________________________________
4. Where do each of these three major steps take place (for eukaryotes)?
- _________________________________
- _________________________________
- _________________________________
Formula Illustrations
For the following formulas, (1) determine whether the formula is photosynthesis or cellular respiration,
(2) circle the products, and (3) creatively illustrate each reactant or product in the box underneath.
5. Formula is for: _______________________________________________________________________
6. Formula is for: _______________________________________________________________________
AMOEBA SISTERS: VIDEO RECAP PHOTOSYNTHESIS AND CELLULAR RESPIRATION COMPARISON
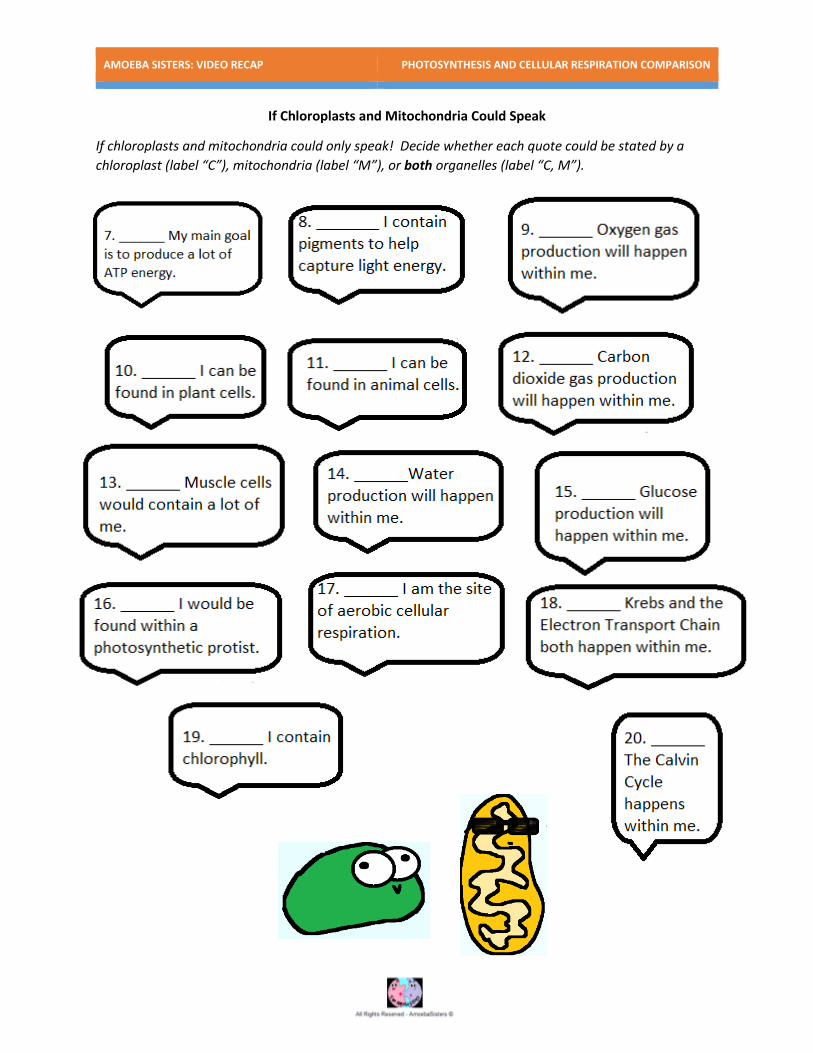
If Chloroplasts and Mitochondria Could Speak
If chloroplasts and mitochondria could only speak! Decide whether each quote could be stated by a
chloroplast (label “C”), mitochondria (label “M”), or both organelles (label “C, M”).
Why?
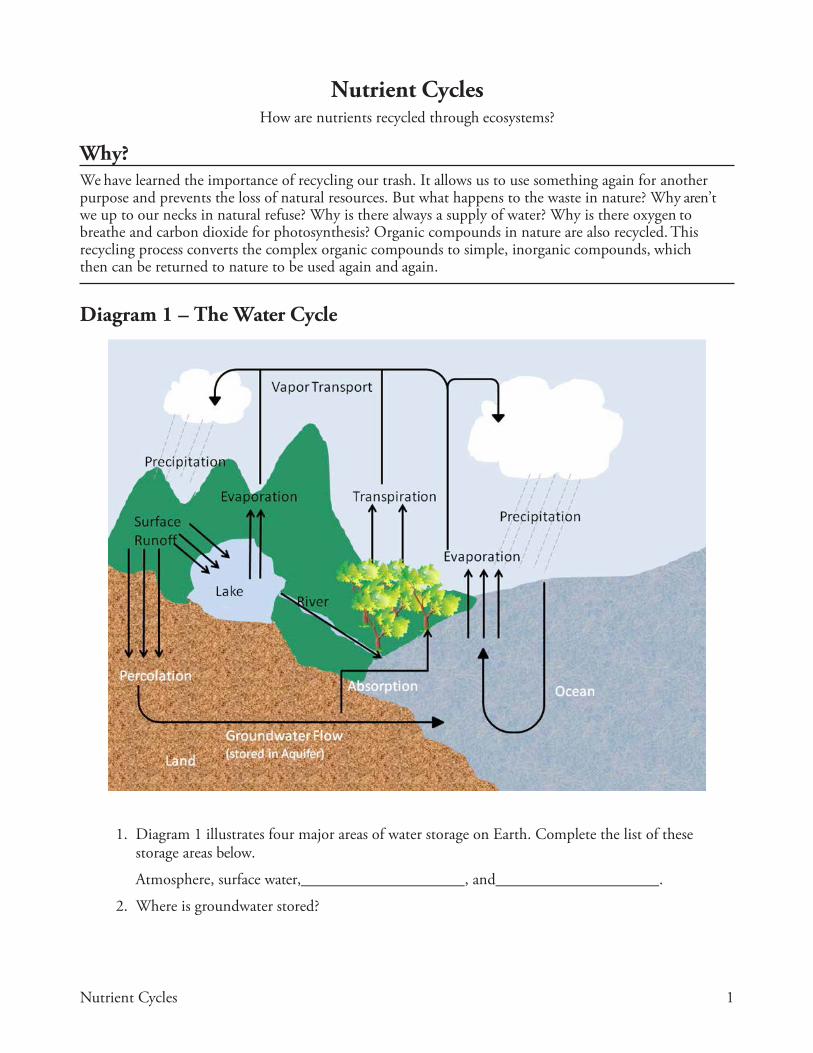
Nutrient Cycles How are nutrients recycled through ecosystems?
We have learned the importance of recycling our trash. It allows us to use something again for another purpose and prevents the loss of natural resources. But what happens to the waste in nature? Why aren’t we up to our necks in natural refuse? Why is there always a supply of water? Why is there oxygen to breathe and carbon dioxide for photosynthesis? Organic compounds in nature are also recycled. This recycling process converts the complex organic compounds to simple, inorganic compounds, which then can be returned to nature to be used again and again.
Diagram 1 – The Water Cycle
1. Diagram 1 illustrates four major areas of water storage on Earth. Complete the list of these storage areas below.
Atmosphere, surface water, , and .
2. Where is groundwater stored?
Nutrient Cycles 1

3. Name two processes in Diagram 1 in which water is converted to vapor.
4. Describe two methods by which water on land (in lakes and rivers) returns to the oceans.
5. Which process(es) of the water cycle—precipitation, evaporation, condensation, runoff, percolation or transpiration—might contribute to the addition of pollutants to rivers, lakes, and oceans? Why?
6. Which of the processes associated with the water cycle might be responsible for helping to clean or filter the water?
Diagram 2 – The Carbon Cycle
D Atmospheric
CO2
C
B
Respiration A Wastes
Death
Auto and factory emissions
Decay (by decomposing fungi, bacteria, and worms)
Carbon Sink (coal, oil, peat, natural gas)
7. Name two ways that carbon (usually in the form of CO2) enters the atmosphere.
Com
busti
on
Res
pira
tion
POGIL™ Activities 2

8. Process D on the diagram uses CO2 from the atmosphere.
a. Label D on the diagram in Model 2 with the name of this process.
b. Which of the following organisms carry out the process identified in part a (plants, animals, anaerobic bacteria)?
9. Wastes and dead organisms must be broken down in order for their components to be used again.
a. What organisms in the cycle carry out this process?
b. What would happen if decomposition did not occur?
Nutrient Cycles 3
10. Not all dead organisms are acted on by decomposers. Instead of being immediately recycled, the carbon from some organisms is kept in a type of long-term storage, or carbon sink. Using
Diagram 2, answer the questions below about this long-term storage. a. List four materials that contain this stored carbon.
b. What is the collective term for these four materials?
c. How do humans use the materials in the carbon sink?
d. What is the scientific name for the process listed in part c?
11. List five examples of combustion in your everyday life.
12. How is the majority of electricity generated in the area where you live? Does the process involve the combustion of coal? Check with your teacher if you are not sure.
13. Many of the carbon-based fuels are categorized as fossil fuels because they formed from decayed organisms over millions of years. List as many examples of fossil fuels as you can.
14. How does our use of these carbon stores affect the amount of CO2 in the atmosphere?
Read This!
Carbon dioxide (CO2) is one of the so-called greenhouse gases. These gases hold heat energy in the atmosphere, which raises the overall temperature of the Earth. This helps maintain the Earth’s biosphere, but also has led to environmental concerns. The more CO2 in the atmosphere, the higher the Earth’s average temperature will be.
15. What is another way besides the burning of fossil fuels in which human activity is increasing the amount of atmospheric CO2, and what are potential global effects of these changes in CO2 levels?
POGIL™ Activities 4

Diagram 3 – The Nitrogen Cycle
Further nitrification by nitrifying bacteria
Nitrites Nitrates
Denitrification by denitrifying bacteria
Nitrates in soil
Atmospheric
Nitrogen (N2)
Absorption by roots of non- legume plants
Feeding
Lightning
Decomposition (by fungi, bacteria, and worms)
N-fixing bacteria (Found in root nodules of legumes and in the
soil)
Ammonia and other N-containing compounds in soil
N-fixing bacteria
16. Diagram 3 illustrates how nature recycles what natural resource?
17. Name three types of bacteria involved in the nitrogen cycle.
Read This!
Nitrification is a process by which specific bacteria convert different forms of N-containing compounds (like ammonia, NH3) in the soil to nitrites (NO2) and nitrates (NO3). This process is important since the only forms of nitrogen that are usable by plants to build their proteins are the nitrates.
18. In what ways is N2 gas removed from the atmosphere?
19. By what process are animal wastes and dead organisms converted to other nitrogen-containing compounds?
Death
Nitr
ifica
tion
by
nitr
ifyin
g ba
ceria
Nitr
ogen
fixa
tion
Nitr
ogen
fixa
tion
Nutrient Cycles 5

20. What is the only form of nitrogen that plants can take in and use?
21. Why do legume plants such as beans and peas have an advantage in nitrogen-poor soil?
22. What do the denitrifying bacteria do during the denitrifying process?
23. If the number of nitrifying bacteria decreased, what effect would this have on the nitrogen cycle and what type of compounds would accumulate as a result?
Extension Questions
24. Plants and animals are part of all of the nutrient cycles through the foods they eat and what eats them (food chains and food webs). Name the four classes of organic compounds (containing carbon) and explain how the carbon cycle and nitrogen cycle contribute to the usable supplies of these macromolecules.
25. In order to continually use the same area of land for agriculture, some farmers apply fertilizers to improve the level of nitrates in the soil. An alternative to this intensive use of fertilizer is to plow the roots of the leguminous plants back into the soil and leave the area unplanted for a season. Why would a farmer use this alternative method and what would be the benefit of turning over the soil and leaving the old plant roots?
POGIL™ Activities 6

Nutrient Cycles 7

AMOEBA SISTERS: VIDEO RECAP FOOD WEBS, ENERGY PYRAMIDS, AND AN INTRODUCTION TO BIODIVERSITY
Amoeba Sisters Video Recap: Food Chains, Food Webs, and an Introduction to Biodiversity
1. For the food chain on the right, please draw in
three arrows to represent the correct direction of
energy flow. Then use this food chain to answer the
below questions.
2. For the grass, please circle any of the below alphabetized words in this box that correctly describe this organism. Note: You will have more than one word circled. Autotroph Producer Decomposer Secondary Consumer Heterotroph Tertiary Consumer Primary Consumer
3. For the frog, please circle any of the below alphabetized words in this box that correctly describe this organism. Note: You will have more than one word circled. Autotroph Producer Decomposer Secondary Consumer Heterotroph Tertiary Consumer Primary Consumer
4. Please arrange the organisms from the food chain into an energy pyramid. After drawing your energy pyramid below with the labeled organisms inside, please label it with the following words: 1st trophic level, 2nd trophic level, 3rd trophic level, and 4th trophic level. 5. If the grass in this example had 25,000 Kcal of energy, approximately how much would you expect of that energy to be stored in trophic level 4? ___________________Kcal
6. Fungus is an organism not drawn in the above food chain although it has a very important role. Describe an important role of organisms such as fungi and bacteria: _________________________________________________ _________________________________________________ _________________________________________________ _________________________________________________ _________________________________________________ 7. Circle any applicable words below that could correctly identify the organism above: Autotroph Decomposer Heterotroph Producer

AMOEBA SISTERS: VIDEO RECAP FOOD WEBS, ENERGY PYRAMIDS, AND AN INTRODUCTION TO BIODIVERSITY
8. For the food web below, please draw in arrows to represent the correct direction of energy flow.
Please use the above food web to determine whether there is an increase, decrease, or no change for each organism
type in the chart below based on the given scenario. When filling in the empty boxes, please explain why you
determined an increase, decrease, or no change. Two boxes have been filled in for you!
Scenario Frogs Grasshoppers Snakes Producers
There are types of pathogenic fungi that can attack living amphibians (such as frogs). One of these types of fungi is known as the Chytrid fungus. For each of the following organisms in the table, describe how each organism population might be affected by a Chytrid fungus infestation.
Decreasing due to infestation of Chytrid fungus, which is harming frog population.
9. 10. 11.
Grasshoppers can be extreme pests for farmers as they can damage crops. For each of the following organisms in the table, describe how each organism population might be affected by a significant grasshopper population increase such as a visiting locust swarm.
12.
Increasing due to visiting locust swarm.
13. 14.
15. Which of the following contributes more to ecosystem sustainability: the food web on this page or the food chain
on the other page? Explain your answer in terms of biodiversity.

Name _______________________________________ Date _____________ Period ________
Lab: Population Ecology Graphs ECOLOGY
Introduction: The ability to interpret graphs and tables is a necessary skill in science but also finds use in everyday life. In articles or textbooks you are likely to find graphs and tables. Understanding the article’s message depends heavily on being able to interpret many different types of graphs and tables. In science tables are used to provide information. Frequently one quantity in a table depends upon or is related to another. Data from tables can be graphed to aid interpretation. Graphs give a visual representation of the data that helps to reveal regularities and patterns. Procedure: Answer the following questions regarding the graphs below. I. Bacteria reproduce by splitting in half. It takes about 20 minutes, under ideal conditions, for a bacteria population to double.
Analysis Questions 1. Describe what is happening to the population of bacteria.
2. Is the rate of population growth constant or variable?
3. What do we call this type of growth?
II. White pine became extinct in northern Minnesota during the last period of glaciation, although it remained in southern climates such as Virginia. Once the glaciers began to retreat, the white pine began to expand northward again; it reappeared in northern Minnesota about 9400 years ago, this is time 0 in the graph

Analysis Questions 1. What happens to the population growth after 110 years? 2. What is the carrying capacity of white pine in this ecosystem? 3. What factors would affect the carrying capacity of white pines? 4. How is it possible that the white pine population reached 462 individuals at year 110? What happen to the population from 110 years to 140 years?
III. Ecological Studies of Wolves and Moose on Isle Royale Isle Royale is the largest island located in Lake Superior. The island is approximately 45 miles in length and 9 miles wide. Isle Royale consists of Isle Royale (main island) and multiple smaller islands. Isle Royale is about 12 miles south of Canada, 20 miles Southeast of Grand Portage, Minnesota and 53 miles north of Copper Harbor, Michigan. Isle Royale National Park was established in 1940, designated a wilderness area in 1976 and an International Biosphere Reserve in 1980. Isle Royale is a remote island, the only mode of transportation available is by boat or seaplane. Moose first arrived at Isle Royale around 1900. The moose population tends to increase in years with mild winters, early spring green-up, abundant winter forage, low wolf numbers and low levels of tick infestation. Wolves first arrived at the island on an ice bridge from Canada in 1940. Disease has also influenced the wolf population. Between 1980 and 1982, the wolf population declined from 50 to 14, due to canine parvovirus. The Isle Royale wolves and moose have been studied since 1959. This Isle Royale wolf-moose study is unique because it entails just a single predator (the wolf) and a single prey (the moose)

on a small island with very little human influence. This is the longest continuous study of a predator and its prey.
Analysis Questions
1. What is the greatest moose population?
What year did that occur? What was the wolf population when the moose population the greatest?
2. What would happen to the moose population if the wolf population decreases? 3. What would happen to the wolf population if the moose population decreases? 4. What would happen to the moose population if the wolves were removed from Isle Royale? 5. Describe the pattern between the wolf population in relation to the moose population. 6. Identify a factor, other than moose population, that has influenced the wolf population in Isle Royale.

7. Identify two factors, other than the wolf population, that may influence the moose population.
IV. A population pyramid, also called an age structure diagram, is a graphical illustration that shows the distribution of various age groups in a human population (typically that of a country or region of the world), which ideally forms the shape of a pyramid when the region is healthy. It typically consists of two back-to-back bar graphs, with the population plotted on the X-axis and age on the Y-axis, one showing the number of males and one showing females in a particular population in five-year age groups (also called cohorts). Males are conventionally shown on the left and females on the right, and they may be measured by raw number or as a percentage of the total population. Population pyramids are often viewed as the most effective way to graphically depict the age and sex distribution of a population, partly because of the very clear image these pyramids present. The age-structure diagram shown above was prepared for China. Answer the following questions based on these data. Analysis Questions
1. Normally, healthy populations produce graphs that are pyramidal in shape. What do you think caused the base of this pyramid to “shrink”? 2. If you were an importer of goods to China, what age group(s) do you think you would focus on the most? Why? 3. What is the youngest group that shows more males than females? 4. At what age did it appear that females again outnumbered males?


Zapping the Invasive Lionfish: Invent Your Own Device
(Adapted from PBS “Killer Robots Battle Invasive Species”
Overview:
Indo-Pacific lionfish believed to have been imported as aquarium pets in the 80s and 90s are attacking the region’s coral
reefs. The result is an invasive species that has extended its range to Brazil and is eating its way through local fish
populations, changing the reef ecology.
While some interesting management practices such as putting them on restaurant menus have helped a little, scientists
–until recently — had been at a loss as to how to prevent the invasion from spreading further. The lionfish robot
invention hit the open seas in June 2017. Check out the video below where the robot can be seen zapping and
vacuuming up about 10 lionfish before resurfacing.
Warm up activity:
1. What does the term invasive species mean?
2. Jot down what steps they think went into making the lionfish zapper. How did it go from an idea in someone’s
head to hitting the open seas?
3. What do you think makes up the invention process?
Main Activity 1: What makes a species invasive?:
4. Fill out the blank map and colored pencils and have the students identify the regions where lionfish come from
and where they are now “invading.”

5. From your interpretation of the video fill in the following boxes:
What was the problem? What were the solutions? What will the future look like?
6. You are now going to research an invasive species found in Missouri or in the United States. Fill out the
following boxes according to the example of the lionfish and the robot zapper.
Invasive Species Unique Traits Device Invention Mechanism
Video example: Lionfish unique trait = gills Zapper addresses unique trait = temporary paralysis of respiratory system
Your research
**You can choose one of these examples: Zebra Mussels, Kudzu, Asian Carp, Emerald Ash Borer,
Burmese Python
7. Ethics alert: Do you think invasive species should be protected/transferred or eradicated? Explain.
Main Activity 2: Design your own invention to combat an invasive species
8. Use the invasive species that you chose in #7 and create or adapt a new invention to combat it. Write a half-
page pitch or proposal of an invention along with a sketch of a model or prototype that could help slow down
the invasive species or eradicate it altogether.
Name: __________________________________ Block: _______
Ecology Videos
Ted-Ed A Guide to the Energy of the Earth
1. Energy is a physical quantity that cannot be ______________or destroyed.
2. Where does most of the US electricity come from (primary source)?
3. How do energy choice impacts the quality of an individual and society?
4. What are some examples of energy decisions you make every day?
5 Human Impacts on the Environment: Crash Course Ecology #10
1. Explain the four categories of services that healthy ecosystems provide.
Support Services
Provisioning Services
Regulating Services
Cultural Services
2. Why is biodiversity important?
Mendenhall - Biology 1 / 2

3. What makes an ecosystem resilient?
4. Explain the 5 human impacts the video discusses.
Deforestation
Desertification
Global Warming
NonNative Species
Overharvesting
Ted-Ed Climate Change: Earth's Giant Game of Tetris
1. How does the greenhouse effect influence the climate on Earth?
2. How much has CO2 increased in the atmosphere since 1750?
3. What role does the ocean play in the carbon cycle?
4. Does melting ice cause Earth to warm even further?
5. How have humans altered the carbon cycle?
6. What are some of the effects of climate change?
Mendenhall - Biology 2 / 2


Name:________________________________________________
Trophic Cascades Click and Learn http://www.hhmi.org/biointeractive/exploring-trophic-cascades
1. What is a “trophic cascade”?
2. How is a trophic cascade (top down regulation)
different from the traditional trophic pyramid
(bottom up regulation)?
3. Describe the use of the symbols + and - when
characterizing a trophic cascade.
4. Using the glaucous winged gull or the bald eagle
as an example, explain how the diet of each is
affected by the otter’s disappearance.
Case Study #1: Arctic Tundra
5. Use the pattern below to describe the trophic cascade. Use the drawing below to either type or write in the boxes the
resulting trophic cascade.
6. What indirect effect does the predator have on the soil nutrients in the ecosystem? How does this affect the
landscape?
Case Study #2: Midwestern Lake
7. Use the pattern below to describe the trophic cascade. Use the drawing below to either type or write in the boxes
the resulting trophic cascade.
8. How does the bass predator control the amount of carbon dioxide dissolved in the lake?

9. Speculate on how an increase of carbon dioxide and a decrease of oxygen might affect the pond ecosystem.
10. How would adding a predator of the bass alter the trophic cascade? Draw your own model below. If using a digital
copy, click Insert then Drawing.
Case Study #3: African Savanna
11. Use the pattern below to describe the trophic cascade. Use the drawing below to either type or write in the boxes
the resulting trophic cascade.
12. Describe in your own words how the trophic cascade is regulated by the direct and indirect control of Rinderpest.
13. Why would fire frequency be changed is Rinderpest was eradicated through vaccination?
Case Study #4: Venezuelan Jungle
14. Use the pattern below to describe the trophic cascade. Use the drawing below to either type or write in the boxes
the resulting trophic cascade.
15. How would the loss of predators contribute to deforestation in the jungle?
16. How would you design an experiment to test the effects of this trophic cascade? Your design should include a control
and a manipulated variable as well as how you would measure your results.
17. Keystone Species In the models above, are there any examples of organisms considered to be a keystone species? If
so, justify your choices.

Pathogens & Disease Revised July 2019 www.BioInteractive.org Page 1 of 3
Epidemiology of Nipah Virus
Activity Student Reading
WHAT DO EPIDEMIOLOGISTS DO? Epidemiologists monitor diseases in populations. To monitor infectious viral diseases, they identify infected individuals (including animals) in three ways: (1) by noting the presence of classic symptoms of the disease, (2) by sequencing viral genomes in samples collected from infected individuals, and (3) by detecting antibodies to specific viral peptides in the individual’s blood using enzyme immunoassay (EIA).
For example, in the Nipah virus outbreak of 1998-1999 in Malaysia, epidemiologists suspected that pigs were the source of the human outbreak because most patients were pig farmers and the viruses isolated from samples from sick pigs and patients with encephalitis (a swelling of the brain and a result of the Nipah infection) had identical nucleotide sequences. To stop the outbreak, the sick pigs were killed and buried. The outbreak ended, supporting the conclusion that the pigs had indeed been the source of this outbreak.
Identifying viral genetic material in an individual’s blood sample indicates that the individual is currently infected, and sequencing the genetic material can reveal the identity of the virus. Although EIA requires knowing the identity of the virus, it will indicate whether the individual was infected at some point in their life, even if they have already cleared the virus. EIA involves coating a cell culture plate with a specific antigen: a portion of a viral protein that is recognized by an antibody. A sample of an individual’s blood is next added to the plate. If the individual has produced antibodies to the virus, the virus-specific antibodies will bind to the viral antigen on the plate. A second antibody that binds to all of the patient’s antibodies is then added. This second antibody is linked to an enzyme that changes the substrate into a colored product. A change of color in a given well following the addition of substrate indicates that patient’s blood sample contained antibodies to the viral antigen.
Epidemiology is a growing field that ranks #3 in U.S. News’ 2017 “Best Science Jobs,” with a median salary of $69,450 and a 1.9% unemployment rate. Epidemiologists tend to have a Bachelor of Science (BS) undergraduate degree and a Master of Public Health (MPH) degree.
Figure 1: EIA method for detection of Nipah virus antibodies.

Virus Hunter: Epidemiology of Nipah Virus
Pathogens & Disease Revised July 2019 www.BioInteractive.org Page 2 of 3
Activity Student Reading
Some epidemiologists are especially focused on detecting and monitoring emerging diseases. An emerging disease is one that is either new within a population or is rapidly increasing with respect to the number of cases or the geographic range affected. Epidemiologists are concerned with an emerging disease’s potential to become an epidemic (also known as an outbreak), which refers to the sudden spreading of the disease over a wide but isolated area, or a pandemic, which refers to an epidemic that spreads worldwide. To assess the potential risk of a disease becoming an epidemic or pandemic, epidemiologists need to understand various characteristics of the disease, including its incubation period, how it spreads, and the risk factors involved in acquiring the disease. They need to collect data on the disease’s incidence, prevalence, morbidity, mortality, case fatality ratio, and basic reproductive number. These terms are described briefly below.
Incidence is the number of new cases of an infection within a specified period; it is typically measured as number of cases per thousand or million individuals per time period (week/month/year). Those infected do not necessarily exhibit symptoms. For example, in 2014 an estimated 30,500 cases of hepatitis C virus (HCV) infection were reported in humans in the United States, making the incidence 30,500 new cases/309 million people/1 year, or about 101 cases per million people per year.
Prevalence is the percentage of total cases of infected individuals in a particular population. It’s important to measure both incidence and prevalence, because a highly lethal disease may have a high incidence but a low prevalence because many of the infected individuals have died. Conversely, diseases that persist may have a high prevalence but a low incidence (many people are infected, but there are relatively few new infections per year). For example, in 2015, approximately 3.5 million people in the U.S. were infected with HCV out of a population of approximately 309 million, meaning nearly 1% of Americans are infected.
Morbidity is the percentage of infected people who display symptoms. For example, only 20% of people infected with West Nile virus have any symptoms; therefore, the morbidity rate is 20%. Morbidity values depend on the interplay between viral fitness and host health and immunity. For most viruses, symptoms tend to be worse in the very young and very old or those with otherwise compromised immune systems. Furthermore, individuals who were infected with a larger dose of virus (the viral load) are more likely to exhibit symptoms.
Mortality is the percentage of people infected who die as a result of the infection. Mortality is calculated by dividing the number of deaths by the total number of cases of infection, including those who do not display clinical symptoms. For example, 1 in 10,000 people infected with mumps virus dies. If left untreated, nearly everyone who becomes infected with rabies dies, giving the virus a 100% mortality rate. Mortality rate is typically expressed as a percentage or as number of deaths per 1000 cases per year.
Case fatality ratio (CFR) is the percentage of people with symptoms of infection who die as a result of the infection. For instance, the severe acute respiratory syndrome outbreak in China in 2003 resulted in 8,422 individuals reporting symptoms, of which 916 died, or a CFR of about 11%.
Basic reproductive number (R0) is the number of secondary infections in a population of susceptible hosts expected to occur from interactions with a single infected individual (i.e., the index case); it is a measure used to determine the likelihood of a virus becoming an epidemic. The calculation to determine R0 takes several factors into account.
Ro is calculated using the formula Ro = C × P × D C = the number of contacts the index case makes per unit time (day, week, month, etc.) P = the probability of transmission per contact with the infectious person D = the duration that the infected person is infectious to others

Virus Hunter: Epidemiology of Nipah Virus
Pathogens & Disease Revised July 2019 www.BioInteractive.org Page 3 of 3
Activity Student Reading
The R0 calculation for HCV is 1-3; for measles, 12-18; for mumps, 4-7; and for the Ebola outbreak of 2014 it was 1.5-2.67. If R0 is greater than 1, an epidemic is considered likely, because the number of cases likely to occur after the index case is high. If R0 is less than 1, it is less likely that an epidemic will occur because it should be possible to eradicate the infectious agent before it spreads to too many people.
Epidemiologists must identify the infectious agent, understand how it is transmitted, and be able to summarize complex sets of data and effectively communicate them to agencies like the Centers for Disease Control and Prevention and the World Health Organization to help determine what type of intervention, if any, is necessary.
In this activity, you will examine some of the data collected by epidemiologists studying a Nipah virus outbreak. You will perform the relevant calculations, make claims about whether the Nipah outbreak in Malaysia will become an epidemic, and determine the natural reservoir for Nipah virus.
REFERENCES Centers for Disease Control and Prevention’s (CDC) National Notifiable Diseases Surveillance System (NNDSS). https://wwwn.cdc.gov/nndss/, n.d. Web. 07 Jan. 2017.
West Nile virus and other arboviral diseases—United States, 2012. MMWR Morb Mortal Wkly Rep. 2013 https://www.cdc.gov/mmwr/preview/mmwrhtml/mm6225a1.htm, Jun 28. 62(25):513-7.
"World Health Organization." World Health Organization. World Health Organization, n.d. Web. 26 Sept. 2016.
"Rabies Fact Sheet." World Health Organization. World Health Organization, Mar. 2016. http://www.who.int/rabies/en/ Web. 02 Nov. 2016.
Basic Reproductive Rate. Michigan Center for Public Health Preparedness. https://practice.sph.umich.edu/micphp/epicentral/basic_reproduc_rate.php n.d. Web. 05 June. 2017.
Althaus C.L. Estimating the Reproduction Number of Ebola Virus (EBOV) During the 2014 Outbreak in West Africa. PLOS Currents Outbreaks. 2014 Sep 2. http://currents.plos.org/outbreaks/article/estimating-the-reproduction-number-of-zaire-ebolavirus-ebov-during-the-2014-outbreak-in-west-africa/ Edition 1. doi: 10.1371/currents.outbreaks.91afb5e0f279e7f29e7056095255b288.
Flint, S. Jane, V. Racaniello R., Glenn Rall F., Anna Skalka M., and L. Enquist W. Principles of Virology. 4th ed. Vol. 2. Washington, D.C.: ASM, 2015. Print.

Pathogens & Disease Revised July 2019 www.BioInteractive.org Page 1 of 4
Epidemiology of Nipah Virus
Activity Student Handout
INTRODUCTION In this activity, you will be exploring cases of Nipah virus infection as an epidemiologist would, by collecting evidence and making calculations and predictions, based on scientific data.
Nipah virus infection is a newly emerging zoonosis, a disease that can be transmitted from animals to humans. This infection in humans causes highly variable symptoms, ranging from an asymptomatic infection to fatal encephalitis, an inflammation of the brain. A vaccine for Nipah virus does not exist, and the primary treatment for humans is limited to intensive supportive care.
Do you have what it takes to be an epidemiologist?
PROCEDURE 1. Complete Parts 1–3 below and read the questions in Part 4. 2. Watch the video Virus Hunter: Monitoring Nipah Virus in Bat Populations. 3. Complete Parts 4 and 5.
MATERIALS • access to the video • “Student Reading” handout • calculator
PART 1: Looking for Patterns and Making Predictions Clusters of Nipah virus infections were detected at different locations in Malaysia from September 1998 through May 1999. One area of Malaysia that was studied extensively during this time was the Port Dickson district, which is located in the state of Negeri Sembilan on the west coast of peninsular Malaysia. Epidemiologists recognized a higher prevalence of Nipah infection among pig farmers in this area. In one study, they decided to collect data from people living and working on farms in Port Dickson in order to understand the source of the infection. They collected the data from two groups: 1. patients: individuals with encephalitis and evidence of Nipah infection from lab studies 2. controls: individuals who did not have any evidence of disease and came from farms that had some cases of
Nipah virus infection but no reports of encephalitis
Table 1. Occupations* and living arrangements for people in the Port Dickson study Variable Patients (n = 97) Controls (n = 147) Pig Farmer/Owner 86 142 Housewife 3 1 Student 9 10 Lived on a pig farm 72 113 Worked on a pig farm 91 147
*Occupations were not mutually exclusive. Source: D. Umesh et al. “Case-Control Study of Risk Factors for Human Infection with a New Zoonotic Paramyxovirus, Nipah Virus, during a 1998–1999 Outbreak of Severe Encephalitis in Malaysia.” The Journal of Infectious Diseases 181, 5 (2000): 1755–1759.

Epidemiology of Nipah Virus
Pathogens & Disease Revised July 2019 www.BioInteractive.org Page 2 of 4
Activity Student Handout
Table 2. Percentage of people in this study who reported illness among other animals on their farm Variable Patients Controls Dogs 87% 76% Cats 64% 62% Rats 80% 77% Chickens 78% 73% Bats 19% 19%
Table 3. Percentage of infected people in this study who reported an increase in sick/dying animals on their farm Variable Patients Controls Pigs 59% 24% Dogs 25% 8% Cats 12% 9% Rats 9% 5% Chickens 11% 2% Bats 0% 0%
1. Using the data in Table 1, make a prediction about the source of the Nipah virus outbreak in Port Dickson, Malaysia. Summarize the data that support your prediction.
2. What actions might you take to prevent further spread of this disease?
3. Which animal species in this study would you test for Nipah virus antibodies? Why?
4. Based on the data above, which animal species was least affected by Nipah virus infection? Explain your answer using the data. Can you think of a reason why this might be?
PART 2: Reading Read the background information in the “Student Reading” handout to gain a better understanding of epidemiology and the necessary vocabulary and calculations to complete the rest of the activity.
PART 3: Practicing Calculations and Making Claims As Nipah virus spread from September 1998 through May 1999 in Malaysia, 265 patients were diagnosed with encephalitis, and 105 of these patients died. An additional 110 individuals were found to have antibodies to Nipah virus but did not have any clinical symptoms. Of those infected, 224 were from Port Dickson, which has a population of about 97,800 people.

Epidemiology of Nipah Virus
Pathogens & Disease Revised July 2019 www.BioInteractive.org Page 3 of 4
Activity Student Handout
1. Using this information and the calculations described in the “Student Reading” handout, calculate the following values for this Nipah outbreak:
a. Incidence in Port Dickson, Malaysia: ____ new cases/______ people in the population/_____ months
b. Prevalence in Port Dickson, Malaysia: ___________%
c. Morbidity nationwide for Malaysia: ___________%
d. Mortality nationwide for Malaysia: ____________%
e. Case fatality ratio nationwide for Malaysia: _____________%
2. The R0 of Nipah virus is estimated to be 0.48. Based on this information, make a claim about whether the outbreak in Malaysia is likely to have become an epidemic.
PART 4: Nipah Virus Reservoir Watch the video Virus Hunter: Monitoring Nipah Virus in Bat Populations. This video focuses on a Nipah outbreak that occurred in Bangladesh in 2004. In the video, Dr. Jon Epstein, an epidemiologist, tracks the transmission of the virus from bat populations to humans. Using the information you learned in the film, answer the questions below.
1. What human behavior was the cause of the Nipah virus outbreak in Bangladesh? How did scientists determine this?
2. Scientists determined that bats are a natural reservoir for Nipah virus in Bangladesh. a. In your own words, explain what a reservoir animal is.
b. What evidence suggested bats were the reservoir for Nipah virus?
3. Which of the following methods, as described in the video and reading, is used to monitor Nipah virus in bat populations? Select all that apply: a. monitoring symptoms b. sequencing viral genomes c. detecting antibodies to specific viral peptides in an individual’s blood
4. How can monitoring bat populations in this way help with human health?

Epidemiology of Nipah Virus
Pathogens & Disease Revised July 2019 www.BioInteractive.org Page 4 of 4
Activity Student Handout
PART 5: Putting It All Together 1. Bats are natural reservoirs for Nipah virus and do not die from the infection. Knowing this information,
would it be more valuable to report data for the incidence or prevalence of Nipah virus in bats (assuming that you also report the total number of bats in the population)? Explain your choice.
2. Why would you need to calculate morbidity and mortality in humans but not bats? In your answer, show that you understand the definition of each of these terms.
3. Looking back at the data in Part 1 on the Malaysia outbreak of 1998–1999, what evidence suggests that the bats, not the pigs, may have been the original source of the virus?
4. Explain why killing pigs may have stopped the outbreak (as described in the “Student Reading”), even if the original source of infection was bats.
5. Write a succinct statement (encompassing information from the entire activity) informing the Centers for Disease Control and Prevention (CDC) and the World Health Organization (WHO) about Nipah virus and how it spreads and provide recommendations for how to control it.

Experimental Design Published February 2020 www.BioInteractive.org Page 1 of 4
Activity Student Handout
Winging It: Analyzing a Scientific Paper
INTRODUCTION
In 2017, biologists Linlin Zhang, Anyi Mazo-Vargas, and Robert Reed published the landmark scientific paper “Single master regulatory gene coordinates the evolution and development of butterfly color and iridescence.” The authors used CRISPR-Cas9, a tool for gene editing, to explore how inactivating certain genes affects colors and patterns in the wings of many butterflies. They communicated their findings in a scientific journal so that others in the scientific community could know about their claims, evaluate the evidence, repeat the experiments, and use the information to design new experiments. Learning to interpret scientific research papers is a critical skill. In this activity, you will analyze a portion of this colorful scientific paper.
PROCEDURE
Open the scientific paper Zhang et al. (2017). Read the “Abstract” (the first paragraph, written in bold font if the paper is downloaded as a PDF) and the “Introduction” (the next two paragraphs).
1. The goal of the “Abstract” is to provide a brief summary of the paper. Most abstracts present the research question, the methods used, the results, and the significance of the findings. In your own words, describe the research question for this study.
2. The goal of the “Introduction” is to help readers understand why the research question is important. To do this, scientists often briefly summarize what is and is not known about the research question, as well as what they did to address the question. They may also describe the structure of the rest of the paper.
a. What argument do the authors make for why their research is important?
b. What do the authors say is known and not known about the genetics of butterfly wing patterns?
c. How do the authors prepare readers for reading the rest of the paper? Consider the entire “Introduction” in your response.
3. You will now make a concept map of the information in the “Introduction.” A concept map is a diagram that shows the relationships among different concepts.
Create your concept map using the following terms as your concepts. Connect related terms with a line and label each line with a brief phrase describing the relationship between the terms.

Winging It: Analyzing a Scientific Paper
Experimental Design Published February 2020 www.BioInteractive.org Page 2 of 4
Activity Student Handout
Cas9-mediated targeted deletion wing conjugation scales wing pattern development knockout studies red ommochrome color pattern optix blue structural iridescence adaptive hotspot adaptive geographic variation
Read the article “Scientists Can Now Repaint Butterfly Wings,” which may be provided by your instructor or viewed online. This article describes the butterfly study to a more general audience.
4. Create a diagram or cartoon to illustrate the experimental design described in this article. Your illustrationcan be fairly general but should show how the scientists did the overall experiment.
Return to the scientific paper. Read the first three paragraphs of the “Results” and the caption for Figure 1.
5. What were the controls and experimental manipulations in this experiment? Give specific examples of eachfrom Figure 1.
6. Annotate the copy of Figure 1 at the end of your handout by following the instructions below. Writeeverything in your own words and in a way that a general audience would understand.
a. Add a title for the overall figure.

Winging It: Analyzing a Scientific Paper
Experimental Design Published February 2020 www.BioInteractive.org Page 3 of 4
Activity Student Handout
b. Write a simple driving question for each part of the figure labeled with a letter (A, B, C, etc.). In other words, what question did the scientists try to answer in each part?
c. Write a simple summary of what is shown by each part of the figure labeled with a letter (A, B, C, etc.). Your goal is to annotate the entire figure so that a reader could understand it without reading the caption.
7. Create a new diagram or cartoon to illustrate the experimental designs of the experiments from Figure 1 only. Make sure to include how the scientists used controls. Refer to the “Materials and Methods” section of the paper as needed to clarify the experiment. (Note you do not need to read this section in-depth. Many scientists don’t either, unless they have a specific question about the procedure or want to do a similar experiment.)

Winging It: Analyzing a Scientific Paper
Experimental Design Published February 2020 www.BioInteractive.org Page 4 of 4
Activity Student Handout
Figure 1. optix determines wing scale color identity and morphology in H. erato and A. vanillae. (A) optix mosaic knockouts in H. erato result in conversion of red ommochrome color patterns to black melanin. The comparisons shown are left-right asymmetrical knockout effects from single individual injected butterflies. (B) Detail of mutant clone highlighted in the mutant in A showing red replaced by black in a proximal red “dennis” pattern of the dorsal forewing. (C’–C”) optix knockout mosaics showing transformation of pointed wing conjugation scales to normal wing scales. Each panel in the series shows successive detail. (D) optix replaces orange and brown ommochromes in A. vanillae with melanins, resulting in a black and silver butterfly. Arrows highlight presumptive clone boundaries discussed in the text. (E) Detail of a knockout clone boundary highlighting the switch between red and black pigmentation in the ventral forewing from D. (F) Ventral view of black spots in optix knockout mutant showing a phenotype similar to WT. (G and G’) Wing conjugation scales in WT (G) and optix knockout mutant (G’) demonstrating a role for optix in determining A. vanillae scale morphology. Source: Zhang et al. (2017).

S C I E N C E
Scientists Can Now Repaint Butterfly Wings Thanks to CRISPR, scientists are studying animal evolution in ways that were previously thought to be impossible.
ED YONG SEPTEMBER 18, 2017
The wings on the left belong to a normal Gulf fritillary butterfly, and the ones of the right belong to one whose optix gene has been deleted. (ROBERT REED)
When the butterfly emerged from its pupa, Robert Reed was stunned. It was a Gulf fritillary—a bright-orange species with a few tigerlike stripes. But this butterfly had no trace of orange anywhere. It was entirely black and silver. “It was the most heavy-metal butterfly I’ve ever seen,” Reed says. “It was amazing to see that thing crawl out of the pupa.”
Reed’s team at Cornell University had created the metal butterfly by deleting just one of its genes, using the revolutionary gene-editing technique known as CRISPR. And by performing the same feat across several butterfly species, the team showed that this one gene, known as optix, controls all kinds of butterfly patterns. Red becomes black. Matte becomes shiny. Another gene, known as WntA, produces even wilder variations when it’s deleted. Eyespots disappear. Boundaries shift. Stripes blur.
These experiments prove what earlier studies had suggested—that optix and WntA are “paintbrush genes,” says Anyi Mazo-Vargas, one of Reed’s students. “Wherever you put them, you’ll have a pattern.”
Biologists have long been smitten by butterflies, and not just for their pretty colors. These insects are perfect subjects for addressing two of the most fundamental questions in the study of evolution. First, where do new things come from? Butterflies all evolved from a moth ancestor, so how did a presumably dull-winged insect give rise to a kaleidoscopic dynasty of

some 18,000 species, each with a distinctive pattern of colors and shapes plastered on its wings? Also, what are the genes behind these patterns? How did a limited set of DNA come to produce patterns of such astonishing diversity and often-baffling complexity? Many scientists, Reed included, have addressed that second question. By carrying out painstaking cross-breeding experiments, and by working out where in the wings various genes are active, they identified a handful of pattern-defining genes, with colorful names like optix, doublesex, and cortex. “It was convincing but we didn’t know exactly what these genes were doing,” says Reed. Without the ability to delete the genes, and see if their absence changed the butterfly wings, “we didn’t have the final proof. There’s been this frustrating wall that I’ve banged my head against.”
CRISPR changed everything. This technique, used by bacteria for billions of years and harnessed by scientists in the last five, allows researchers to cut and edit DNA far more easily and precisely than ever before. As I’ve argued before, the oft-cited concerns that CRISPR will usher in a dystopic era of designer babies are overblown. But scientists are already exploiting it, to do experiments that would have been impossible a decade ago. They’ve used CRISPR to probe the weaknesses of cancer cells, study how bodies are built, and to learn how our feet evolved from fishy fins. And Reed has used it to finally do the gene-deleting experiments that had long eluded him.
By deleting the optix gene in a wide variety of butterflies, team member Linlin Zhang showed that red parts of the wing consistently turn black. The Gulf fritillary transforms from a vivid orange insect into a dark inky one. The small postman loses the vivid red streaks on its hind wings. And the painted lady loses its complex psychedelic patterns and becomes almost monochrome. “They just turn grayscale,” says Reed. “It makes these butterflies look like moths, which is pathetically embarrassing for them.”
Painted lady wings: normal (left) and with optix deleted (right) (Robert Reed)
These results reveal another side to CRISPR’s power: It’s so versatile that scientists can quickly manipulate the same genes in many species, including those that aren’t standard parts of laboratory life. For years, scientists have relied on a few handfuls of “model systems”—species that they can easily breed, study, and manipulate in laboratories. But CRISPR “fully unlocks butterflies as a model system,” says Wei Zhang from the University of Chicago, who published the first study that used the technique on butterflies.
These butterfly experiments reveal evolution’s penchant for both conformity and innovation. For example, optix does the same thing in species that have been separated by at least 80 million years of evolution. “It acts like a color/grayscale switch across the whole wing—quite incredible,” says Chris Jiggins from the University of Cambridge. But different species deploy it in different ways to produce their own distinctive patterns. If optix is a paintbrush, then other genes act as the painter’s hands, determining where the brush will go, and yet other genes act as the paints, determining which colors the brush eventually lays down. All of this can be easily rewired, producing a wide kaleidoscope of patterns from the same basic toolkit.
“This is the stuff of evolution—it’s very unpredictable what each species might do with the same gene,” says Antónia Monteiro from Yale-NUS college in Singapore, who also studies butterfly patterns.
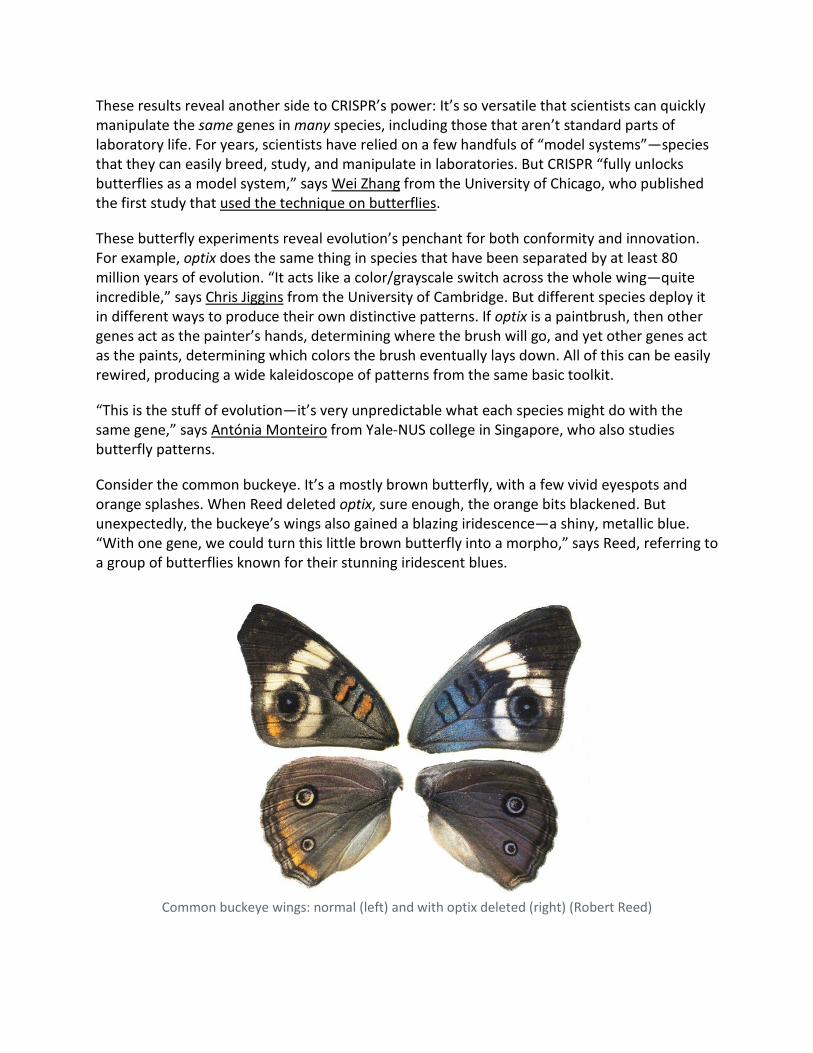
Consider the common buckeye. It’s a mostly brown butterfly, with a few vivid eyespots and orange splashes. When Reed deleted optix, sure enough, the orange bits blackened. But unexpectedly, the buckeye’s wings also gained a blazing iridescence—a shiny, metallic blue. “With one gene, we could turn this little brown butterfly into a morpho,” says Reed, referring to a group of butterflies known for their stunning iridescent blues.
Common buckeye wings: normal (left) and with optix deleted (right) (Robert Reed)

That was a huge surprise. There are no blue pigments in the wings of the altered buckeyes. Instead, their iridescence is the work of microscopic layers in the wings, which collect, reflect, and amplify blue light, so that it’s especially vivid from certain angles. That’s an entirely different way of producing colors than the red and black pigments that optix typically governs.
It seems that buckeyes have all the right ingredients for making glossy wings, but optix typically restrains this potential in favor of a matte finish. Perhaps the same is true for other butterflies like morphos and pipevine swallowtails, which have independently evolved blue iridescence. “We haven’t tested this hypothesis yet but it’s plausible that simply altering this one gene is sufficient to produce this pattern again and again,” says Reed.
The team, including Mazo-Vargas and Arnaud Martin from George Washington University, also deleted a different gene called WntA in various butterflies—and found an even wider range of effects. In the painted lady and common buckeye, it looked like someone had taken an eraser to the middle of the wing, removing the splotches and spots that normally live there. In two species—the small postman and the Sara longwing—black parts of the wing recede while red and yellow regions expand to fill the void. In the Gulf fritillary, some silver spots disappear, and in the monarch, white scales emerge amid the usual tiger colors.
WntA “is more of a tinkerer,” says Jiggins. Rather than deploying particular colors, like optix seems to do, it merely sets boundaries that other genes fill in with colors and shapes. And just like optix, different species have repurposed it to govern their own particular patterns.
The details are still unclear though. How do these gene networks get rewired? When did they take on their roles as master regulators of wing patterns? Why have only a few genes done so? Did butterflies recruit these genes to paint their wings once during their evolution, or many times independently? A decade ago, these would have been fanciful questions. But in the CRISPR era, it suddenly seems possible to answer them.
“CRISPR is a miracle,” Reed says. “The first time we tried it, it worked, and when I saw that butterfly come out ... the biggest challenge of my career had just turned into an undergraduate project.”
© 2017 The Atlantic Monthly Group LLC
This article was originally published on the website TheAtlantic.com and is republished here with The Atlantic’s permission.
Link to the original article: https://www.theatlantic.com/science/archive/2017/09/the-genes-that-paint-butterflies/540159/

Analyzing and Interpreting Scientific Data 1
Analyzing and Interpreting Scientific DataHow can analyzing and interpreting scientific data allow scientists to make informed decisions?
Why?During scientific investigations, scientists gather data and present it in the form of charts, tables or graphs. The data must be properly collected, analyzed, and interpreted to allow scientists to make informed decisions regarding the validity of their study and any further work that may be necessary to achieve their objectives. The ability to present and use data charts, tables, and graphs correctly is essen-tial for good scientific practice and also prevents unnecessary or inappropriate work and misinterpreta-tion of the data.
Model 1 – Graphs and Charts of Classroom Measurement Data Pie Chart Bar Graph
Line Graph
Percentage of Males and Females by Height
Females>175 cm
Females<175 cm
Males>175 cm
Males<175 cm
Comparing Male and Female Average Values200
180
160
140
120
100
80
60
40
20
0
Male
Hand Length KnucklesHeight
Len
gth
in c
enti
met
ers
Female
Distribution of Height in Males and Females
Male
Female
146-
150
151-
155
156-
160
161-
165
166-
170
171-
175
176-
180
181-
185
186-
190
Height in centimeters
Num
ber
of I
ndiv
idua
ls
9
8
7
6
5
4
3
2
1
0

2 POGIL™ Activities for High School Biology
1. According to the data in Model 1, how many females fall within the range 146–155 cm tall?
2. According to the data in Model 1, how many males are 181 cm or above in height?
3. Using the graph(s) in Model 1, determine the approximate average height of males and of females.
4. Refer to the data in Model 1.
a. How many males are taller than 175 cm and approximately what percentage of the total is that?
b. Which graph(s)/chart(s) illustrate the answer to the previous question?
5. Which type of graph or chart in Model 1 shows a side by side comparison of data?
6. Which type of graph or chart in Model 1 shows trends in data across an entire data set?
7. Describe two trends in male and female height using the line graph.
8. Use complete sentences to compare the presentation of height data in the three graphs. Discuss any information that is located on more than one graph, and any unique information that is available on each.
9. If you wanted to see if a correlation exists between the height of an individual and his/her hand length, what would be the best type of graph/chart to make? Explain your reasoning.
10. What conclusions can you draw comparing the height, hand length, and knuckle width of males and females? State your conclusions in complete sentences.
Analyzing and Interpreting Scientific Data 3
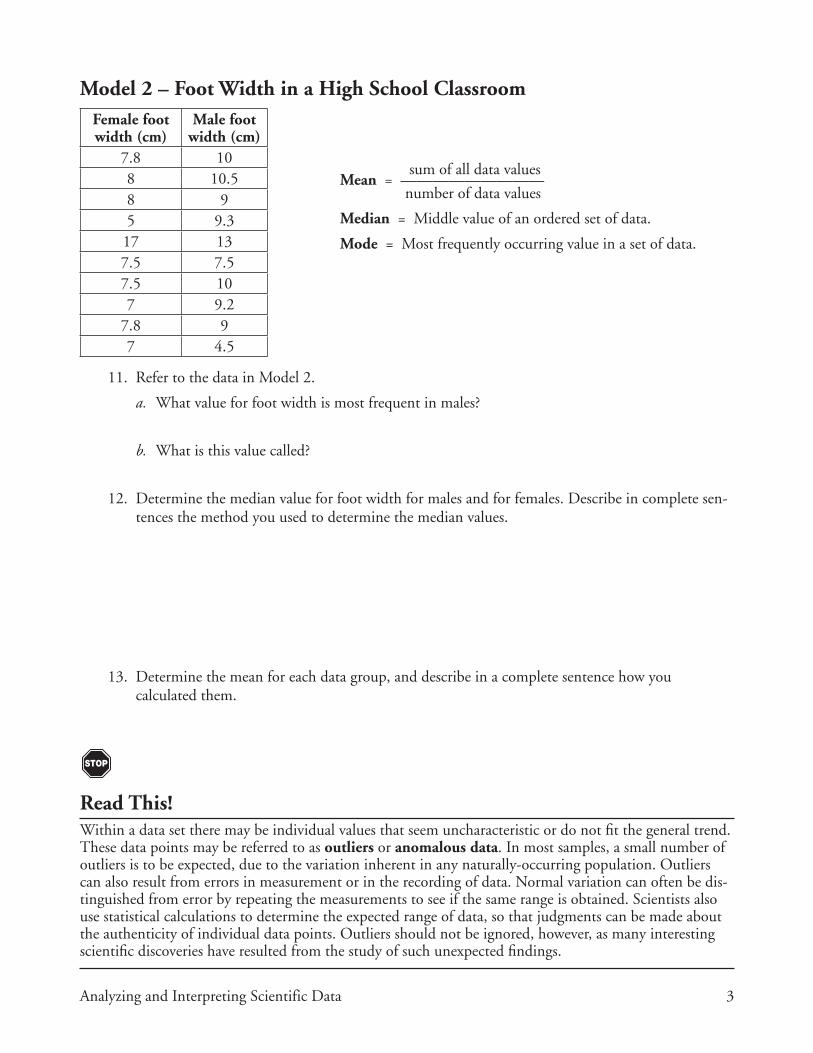
Model 2 – Foot Width in a High School ClassroomFemale foot width (cm)
Male foot width (cm)
7.8 108 10.58 95 9.317 137.5 7.57.5 107 9.2
7.8 97 4.5
11. Refer to the data in Model 2.
a. What value for foot width is most frequent in males?
b. What is this value called?
12. Determine the median value for foot width for males and for females. Describe in complete sen-tences the method you used to determine the median values.
13. Determine the mean for each data group, and describe in a complete sentence how you calculated them.
Read This!Within a data set there may be individual values that seem uncharacteristic or do not fit the general trend. These data points may be referred to as outliers or anomalous data. In most samples, a small number of outliers is to be expected, due to the variation inherent in any naturally-occurring population. Outliers can also result from errors in measurement or in the recording of data. Normal variation can often be dis-tinguished from error by repeating the measurements to see if the same range is obtained. Scientists also use statistical calculations to determine the expected range of data, so that judgments can be made about the authenticity of individual data points. Outliers should not be ignored, however, as many interesting scientific discoveries have resulted from the study of such unexpected findings.
sum of all data valuesMean = ————————— number of data values
Median = Middle value of an ordered set of data.
Mode = Most frequently occurring value in a set of data.
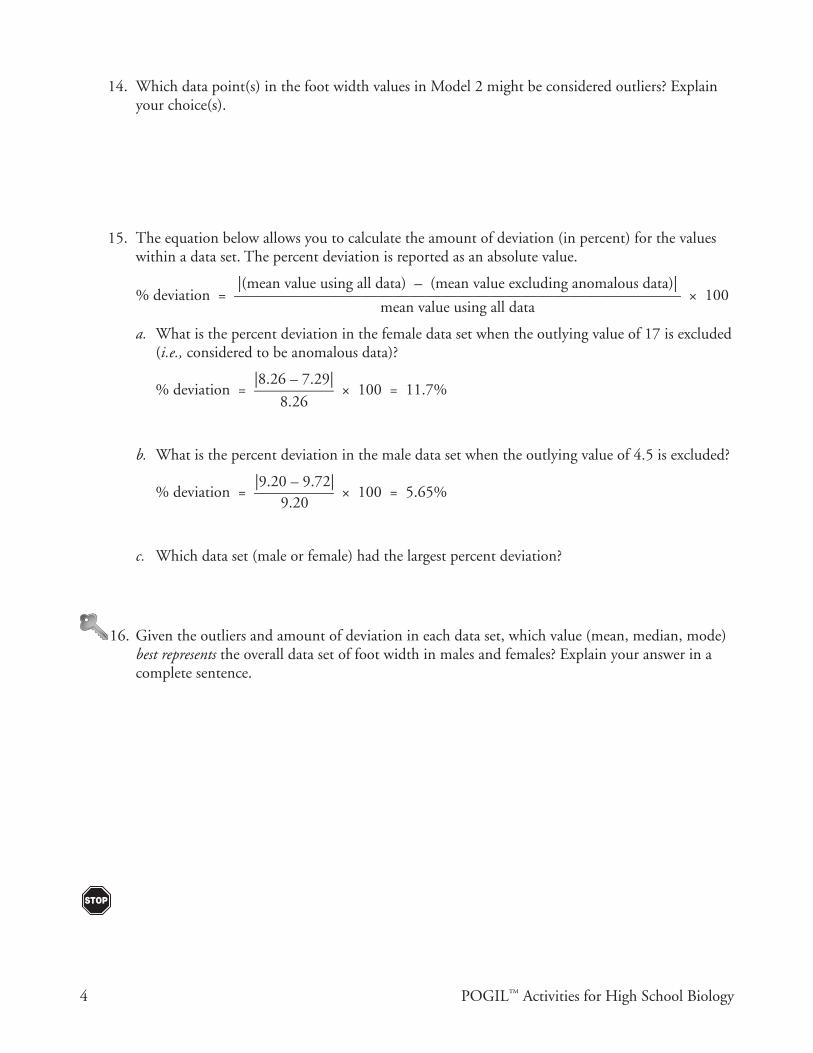
4 POGIL™ Activities for High School Biology
14. Which data point(s) in the foot width values in Model 2 might be considered outliers? Explain your choice(s).
15. The equation below allows you to calculate the amount of deviation (in percent) for the values within a data set. The percent deviation is reported as an absolute value.
|(mean value using all data) – (mean value excluding anomalous data)| % deviation = ———————————————————————————— × 100 mean value using all data
a. What is the percent deviation in the female data set when the outlying value of 17 is excluded (i.e., considered to be anomalous data)?
|8.26 – 7.29| % deviation = ————— × 100 = 11.7% 8.26
b. What is the percent deviation in the male data set when the outlying value of 4.5 is excluded?
|9.20 – 9.72| % deviation = ————— × 100 = 5.65% 9.20
c. Which data set (male or female) had the largest percent deviation?
16. Given the outliers and amount of deviation in each data set, which value (mean, median, mode) best represents the overall data set of foot width in males and females? Explain your answer in a complete sentence.

Analyzing and Interpreting Scientific Data 5
Extension Questions17. With your group, discuss the issues below relating to data analysis and scientific ethics, and
record your answers in complete sentences.
a. What could you do to determine whether the outliers in Model 2 are authentic measurements?
b. Under which circumstances would it be appropriate to remove outlying data points from the analysis and conclusions in a scientific study?
c. If you were to decide to remove outlying data points from your analysis, what are two ways you could indicate this in your report to ensure you are being honest about your data analysis?

www.BioInteractive.org
Published January 2015
Page 1 of 6
Student Worksheet Virtual Lab The Immunology Virtual Lab
IMMUNOLOGY VIRTUAL LAB WORKSHEET
INTRODUCTION Go to http://www.hhmi.org/biointeractive/immunology-virtual-lab. Start the Virtual Lab and maximize the screen if you wish. Answer the following questions in the spaces provided.
DIAGNOSIS 1. Where are antibodies found?
_____________________________________________________________________________________ _____________________________________________________________________________________
2. How can they be used in the laboratory?
_____________________________________________________________________________________ _____________________________________________________________________________________
3. What does ELISA stand for?
_____________________________________________________________________________________ _____________________________________________________________________________________
4. What are ELISA assays used for in labs?
_____________________________________________________________________________________ _____________________________________________________________________________________
5. What are the three important limitations of an ELISA? Explain each.
Limitation Explanation

www.BioInteractive.org
Published January 2015
Page 2 of 6
Student Worksheet Virtual Lab The Immunology Virtual Lab
BACKGROUND 1. What test can be used to determine whether a patient has an infectious or autoimmune disease?
_____________________________________________________________________________________ _____________________________________________________________________________________
2. What does a positive result indicate?
_____________________________________________________________________________________ _____________________________________________________________________________________
3. The watery fluid of the blood is called ____________________.
4. What is allowed to react with the target antigen?
_____________________________________________________________________________________ _____________________________________________________________________________________
5. Detection is possible when _________________________________________________.
6. Once isolated, the secondary antibody can be ____________________________________
___________________________________________________________________
7. What is the signaling system?
_____________________________________________________________________________________ _____________________________________________________________________________________
8. What happens when the appropriate chemical (substrate) is added?
_____________________________________________________________________________________ _____________________________________________________________________________________
9. How is the test quantified?
_____________________________________________________________________________________ _____________________________________________________________________________________
10. What does the amount of color reflect?
_____________________________________________________________________________________ _____________________________________________________________________________________

www.BioInteractive.org
Published January 2015
Page 3 of 6
Student Worksheet Virtual Lab The Immunology Virtual Lab
LAB NOTEBOOK Proceed through the entire lab simulation protocol. Be sure to read the captions below the pictures (left side) and the information in the lab notebook (right side). Be sure to "start over" to begin the lab. You CANNOT skip any steps. Answer the following questions as you proceed.
1. What is systemic lupus erythematosus (SLE)?
_____________________________________________________________________________________ _____________________________________________________________________________________
2. From Figure 1 (click on it), what are the four steps of an ELISA protocol?
a. ___________________________________________________________
b. ___________________________________________________________
c. ___________________________________________________________
d. ___________________________________________________________
3. In step 1, you centrifuge the samples. What does a centrifuge do?
_____________________________________________________________________________________ _____________________________________________________________________________________
4. What are you preparing in step 2? Why are there three different solutions?
_____________________________________________________________________________________ _____________________________________________________________________________________
5. In steps 3 and 4, you prepare an ELISA plate. What has the ELISA plate been pretreated with? Why?
_____________________________________________________________________________________ _____________________________________________________________________________________
a. What is the positive control? (Step 4)
_____________________________________________________________________________________ _____________________________________________________________________________________
b. What is a primary antibody? Please define.
_____________________________________________________________________________________ _____________________________________________________________________________________

www.BioInteractive.org
Published January 2015
Page 4 of 6
Student Worksheet Virtual Lab The Immunology Virtual Lab
c. What is the negative control? (Step 4)
_____________________________________________________________________________________ _____________________________________________________________________________________
d. Why is it necessary to have a positive and a negative control? (Step 4)
_____________________________________________________________________________________ _____________________________________________________________________________________
6. Why incubate the plate in step 5?
_____________________________________________________________________________________ _____________________________________________________________________________________
7. Next, in step 6, the plate is washed. Why wash the plate?
_____________________________________________________________________________________ _____________________________________________________________________________________
8. In step 7, a secondary antibody is added. What is a secondary antibody? Please define.
_____________________________________________________________________________________ _____________________________________________________________________________________
a. What is the attached enzyme in this assay? (Step 7)
_____________________________________________________________________________________ _____________________________________________________________________________________
b. What is the specific substrate for HRP? What color does it produce? (Step 7)
_____________________________________________________________________________________ _____________________________________________________________________________________
9. How can the yellow color be quantitatively measured? At what wavelength? (Step 10, in "why")
_____________________________________________________________________________________ _____________________________________________________________________________________

www.BioInteractive.org
Published January 2015
Page 5 of 6
Student Worksheet Virtual Lab The Immunology Virtual Lab
10. Record your results. Indicate on this page and on the computer which boxes turned color.
A B C + (positive) – (negative)
1:2
1:10
1:100
11. Did you complete the ELISA correctly? (Yes/No) __________
If yes, proceed to #12 and #14.
If no, proceed to #13 and #14.
12. What do the results indicate about:
Patient A:
_____________________________________________________________________________________
Patient B:
_____________________________________________________________________________________
Patient C:
_____________________________________________________________________________________
13. Explain what you did wrong and what you will need to do next time. For more information, check your printable summary page. Did your incorrect procedure provide you any results? Explain what went wrong.
_____________________________________________________________________________________ _____________________________________________________________________________________ _____________________________________________________________________________________ _____________________________________________________________________________________ _____________________________________________________________________________________ _____________________________________________________________________________________

www.BioInteractive.org
Published January 2015
Page 6 of 6
Student Worksheet Virtual Lab The Immunology Virtual Lab
14. This virtual lab was testing for lupus. How is this same test used to test for the presence of HIV? If the results for an HIV test were the same as in this exercise, what would they indicate about the three patients?
_____________________________________________________________________________________ _____________________________________________________________________________________ _____________________________________________________________________________________ _____________________________________________________________________________________ _____________________________________________________________________________________ _____________________________________________________________________________________
AUTHOR Prepared by Ann Brokaw, Rocky River High School. Edited by Susan Dodge and Laura Bonetta, HHMI; copyedited by Linda Felaco.

!
www.BioInteractive.org Published December 2016
Page 1
Student Handout Click and Learn Survey Methods
ABOUT THIS WORKSHEET
This worksheet complements the Click and Learn “Survey Methods” (http://www.hhmi.org/biointeractive/survey-methods). PROCEDURE
As you proceed through the interactive, follow the instructions and answer the questions in the spaces provided. 1.! Read the “Why Study Elephants” page and answer the following questions:
a.! Elephants are considered to be a keystone species. What does that mean?
b.! Name three elephant activities or functions that justify the term “keystone species” and describe how the activity changes African ecosystems.
c.! Why have elephant populations been declining for the past several decades?
Elephant activity Change in ecosystem

!
www.BioInteractive.org Published December 2016
Page 2
Student Handout Click and Learn Survey Methods
2.! Biologists weigh the advantages and disadvantages of survey methods before choosing the appropriate approach. Read through each of the survey methods within the “Where are They” and “How Many” sections and use the table below to organize your thoughts.
Survey Type Information
Gathered Methods used Type of count
(Total or Sample/Direct or Indirect)
Advantages Disadvantages
Species Range
N/A
Individual Range
N/A
Aerial Survey

!
www.BioInteractive.org Published December 2016
Page 3
Student Handout Click and Learn Survey Methods
Individual Registration
Acoustic Surveys
Dung Transects

!
www.BioInteractive.org Published December 2016
Page 4
Student Handout Click and Learn Survey Methods
3.! Read the “Population Change” section, watch the video and explore the map, then answer the
following questions: a.! Turn on the 1979 and 2007 range layers on the map. Describe the change in the range. Where
did the elephant range decrease, increase, or stay about the same?
b.! In 1979, the estimated elephant population was 1.3 million and in 2007 it was 640,000. By approximately what percentage did the elephant population decline over this time period? (Show your work.) How does this compare to the change in range over this same time period?
c.! Turn off the 1979 and 2007 range layers and turn on the 2016 trends layers. Based on the area surveyed, where are the major hotspots of elephant decline? Where are elephant populations stable or increasing?