welcome to iu13
DESCRIPTION
Welcome to IU13. Governance. IU Board members elected for three-year terms Public meeting 2nd Wednesday of each month, unless otherwise advertised. IU 13 is governed by board representatives from 22 districts. Pennsylvania’s Intermediate Units. IU 13 Serving 22 School Districts. - PowerPoint PPT PresentationTRANSCRIPT

Welcome to IU13

Governance
IU Board members elected for three-year terms
Public meeting 2nd Wednesday of each month, unless otherwise advertised
IU 13 is governed by board representatives from 22 districts.

Pennsylvania’s Intermediate Units

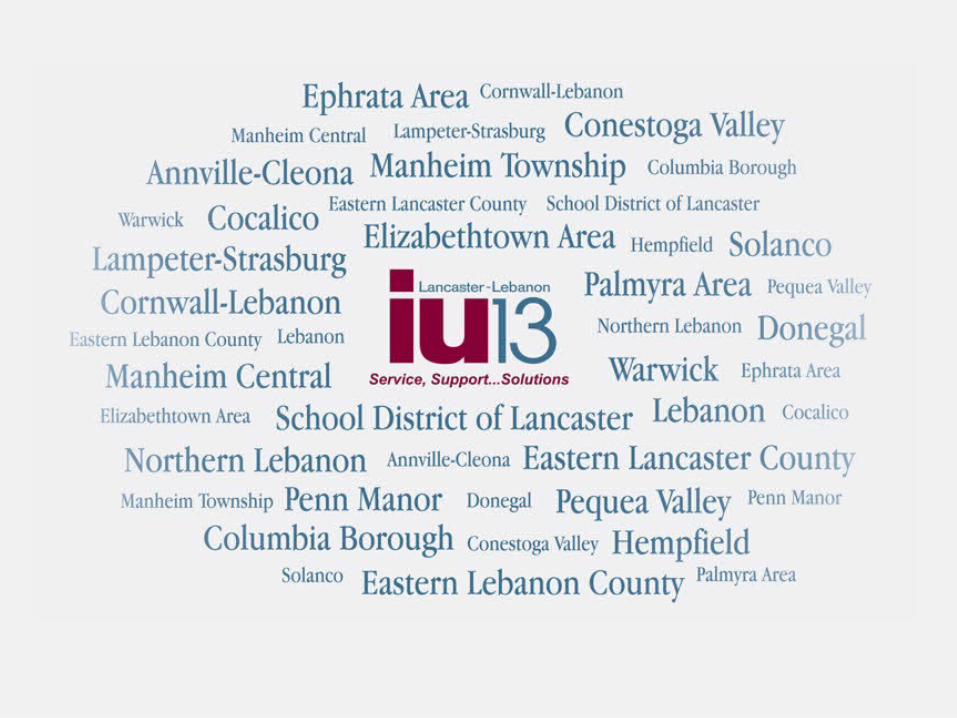
IU 13 Serving 22 School Districts
School Districts: 22
Public School Enrollment: 89,000
Nonpublic Total Enrollment: 17,000

History of IUs
1971
• 29 IUs established• Replace 67 County Offices• State funded
1991
• IUs’ role restructured by legislation• Limited subsidy• Districts purchase services from IUs
2011
• State subsidy eliminated
2012 and beyond
• IUs must be entrepreneurial• IU boundaries opened

GovernanceIU 13 Organizational Chart
DirectorHuman Resources
ServicesFlip Steinour
DirectorInstructional
ServicesPam McCartney
DirectorPATTAN-HarrisburgAngela Kirby-Wehr
DirectorEarly Childhood and
Special Education Services
Sherry Zubeck
DirectorTechnology
ServicesTimothy Laubach
IU 13 Board of School Directors
Executive DirectorDr. Brian Barnhart
Chief Financial Officer (CFO)/Assistant to the Executive
DirectorGina Brillhart

IU 13 is an education service agency dedicated to delivering
irresistible services and programs to our school districts and communities
across the state.
IU 13 Mission Statement
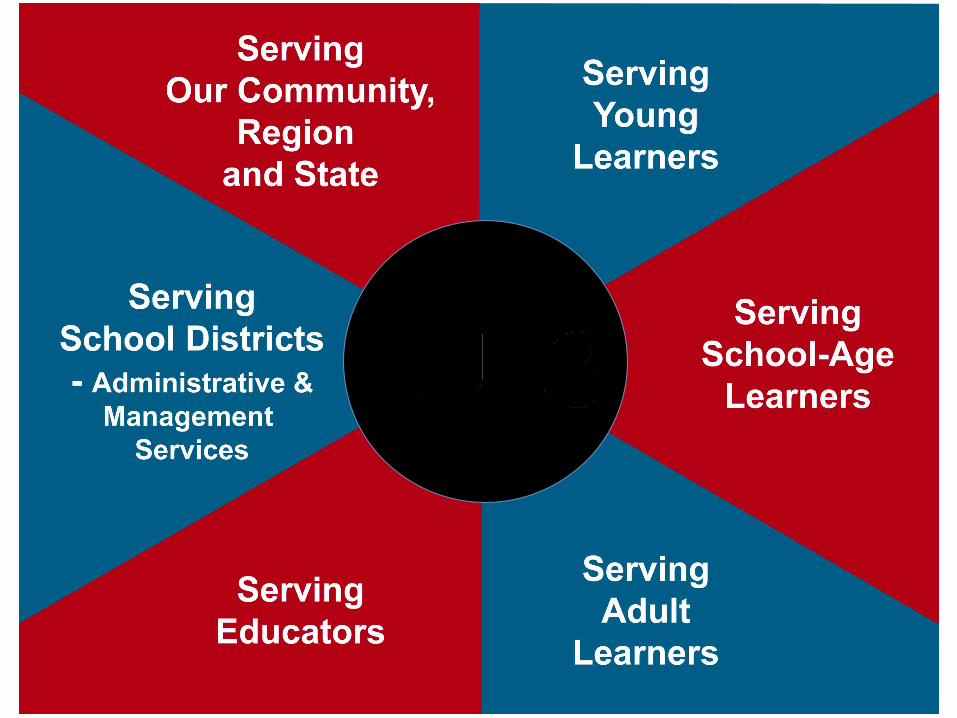

Serving Young Learners
Early Intervention Program• 3000 Pre-K children served
Lebanon County Head Start• 500 children served• 400 families served

Serving School-Age Learners
Sensory Impaired (6 classes)
Learning Support (2 classes)
School to Work (9 classes)
Regular Ed-Turning Point (1 class)
Special Education Services
Autistic Support (21 classes)
Emotional Support (33 classes)
Life Skills/Multiple Disabilities (22 classes)
94 classrooms -755 students

Serving School-Age LearnersSpecial Education Services
Itinerant services• Autistic Services • Hearing Services • Occupational Therapy Services• Physical Therapy Services• Speech/Language Services• Vision Services
Residential Programs • Lebanon County Prison
3,088 students

Serving School-Age Learners
• Classes and Seminars for Gifted Students• AP Calculus and Statistics Simulations• Summer Enrichment Camps• College Fair for Students with Disabilities• Computer Fair (secondary students)• Organ and Tissue Donation Awareness
(OTDA)
General Education Services

Serving Adult Learners
Adult Education• 3,000 students served• Spanish/English translation services• On-site classes for local businesses
General Education Development Program (GED)
English as a Second Language Instruction
Prison Programs

Serving Educators
Professional Development • Superintendents• Assistant Superintendents/
Curriculum Coordinators• Principals• Special Education Administrators• Technology Administrators• Teachers
Conference Center Services (420,800 attendees and 18,330 events)

Serving School Districts - Administrative & Management Services
• Joint Purchasing• Discounted Use of Conference Center• Electricity, Gas, & Bulk Fuels Procurement• Employee Health Care Cooperative• Insurance Pools• Assistive Technology• Online Learning• Wide Area Network (WAN) Consortium • Substitute Teacher Procurement• Office Supply Procurement• Environmental Regulatory Compliance• Supplemental Disposables Program• Public Relations and Communication Services• Statewide Software Program

Regional Leadership and Partnerships
• Lancaster & Lebanon County Businesses (700)• Lancaster and Lebanon Chambers of Commerce• Microsoft, Inc.• School Improvement Partnerships• Bill & Melinda Gates Foundation• Lancaster Hourglass Foundation• Pennsylvania Department of Education• Lebanon VA, Willow Valley Associates, LGH• Keystones to Opportunity

Business Plan Guiding Principles
Efforts must support the compelling purpose
Leverage federal, state and marketplace revenue streams to fund research and development
Maintain a diversified portfolio of services and funding sources
Enter into entrepreneurial ventures with the explicit intention to enrich and benefit the programs offered to our 22 member districts
Actively seek the “voice of the customer” through the collection and use of qualitative and quantitative data regarding the value of current products and services, and potential future initiatives
Plan will be a living document and will be revisited biannually
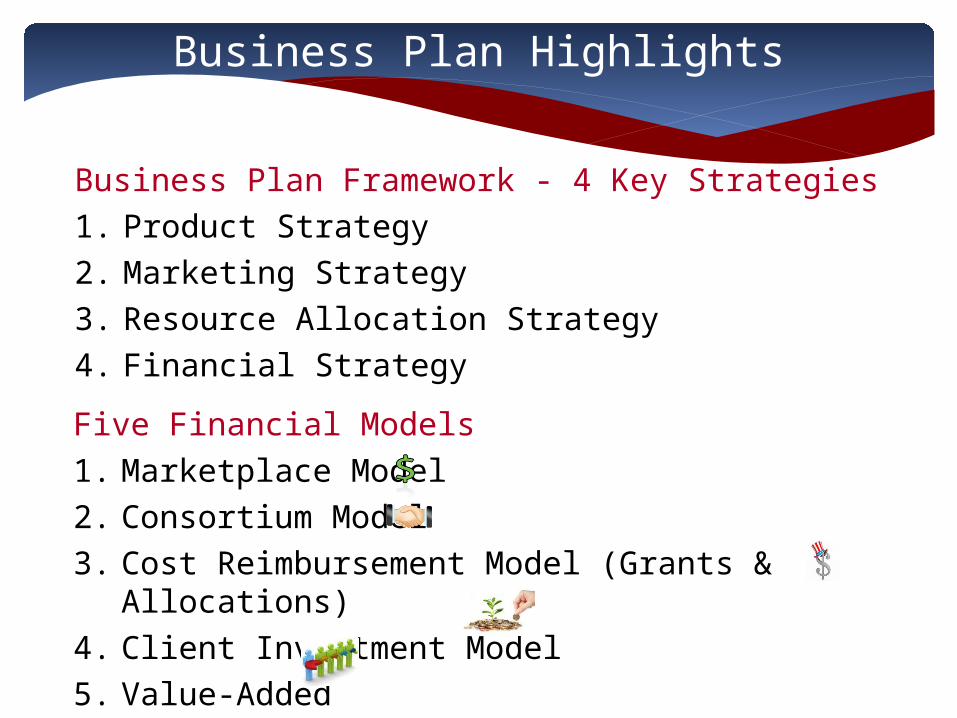
Business Plan Highlights
Five Financial Models1. Marketplace Model
2. Consortium Model
3. Cost Reimbursement Model (Grants & Allocations)
4. Client Investment Model
5. Value-Added
Business Plan Framework - 4 Key Strategies 1. Product Strategy
2. Marketing Strategy
3. Resource Allocation Strategy
4. Financial Strategy

Unit # Unit Name2011-12Actual
2012-13
Actual2013-14 Budget
001 Administrative and Management Services $6,202,244 $6,870,593 $7,411,472002 Adult Education $2,817,097 $2,649,688 $3,163,478003 Conference Center Services $749,947 $736,663 $813,861004 Education Improvement Services $6,789,868 $9,521,265 $9,996,198005 Early Learners $17,822,914 $18,825,886 $18,945,015007 Nonpublic School Services $6,478,906 $6,838,872 $7,358,686011 Special Education Classroom Services $30,338,328 $26,492,337 $26,206,344012 Itinerant Solutions $15,282,842 $15,586,677 $16,225,681014 Pass-thru Funds Administration $21,773,599 $15,731,094 $16,155,885015 Statewide Initiatives $16,190,723 $13,586,910 $20,240,309016 Regional Technology Solutions $9,087,635 $9,928,673 $8,998,208
Subtotal SBUs $133,534,103 $126,768,658 $135,515,137
013 Operations and Infrastructure $14,052,200 $14,031,221 $14,840,993
018 Internal Service Funds for Employee Benefits $14,932,165 $13,845,967 $17,365,565Subtotal SSUs $28,984,365 $27,877,188 $32,206,558
Total All Units $162,518,468 $154,645,846 $167,721,695
Historical Expenditures

How is IU 13 funded?
LOCAL45%
STATE20%
FEDERAL35%
Fed-eral Allo-
cations/
Grants29%
State Allo-
cations/
Grants25%
Mar-ket-
place Rev-enue21%
School-age Spe-cial Edu-
cation Con-sortia Rev-enue22%
Other Consortia Revenue3%

$40,026,500Federal Sources
$2,045,851
$1,737,696
$1,629,615
$1,066,958
Indirect RevenueSupporting Operations
$38,837,153Federal Sources
$28,177,974Special Education
Consortia
$29,822,683Local
Sources
$31,855,217State
Sources
IU 13 Business Model
Funding
Indirects Marketplace Revenue