welcome to the hgs online investment club - hgsi … on material from "trading for a...
TRANSCRIPT


3 Part “Now That I Am Bored in Retirement” Series Part 1 – Basics – designed for those new to HGSI or
those wanting a refresher of our unique indicator set
Part 2 – Putting the Tools to Use – My standard 1 hour Top Down Investing Weekend Review
Part 3 – Tuesday at 2PM

Disclaimer This session is for educational purposes only. Any
recommendations are in the spirit of education and not investment advice
I am a doctor not a broker. Most physicians lose money with their investments
I am not affiliated with any software vendor or trading company. The tools demonstrated are those that I use in my daily trading. I have paid for all of the tools I will be demonstrating

My Background Born to be in sales.. However, born to a Jewish mother so had to go to
medical school first Built large independent practice in Georgia with 47
docs and 27 offices, got bored Started series of Healthcare Services Companies
Sold 2 to ABC Sold last one to CAH
“Retired” 6.30.13 Now “trade” for a living Started my trading hobby in early 90s when exposed to
Telescan and AIQ and a genius named Ian Woodward

My Approach to Trading I have segregated my accounts, some are more long term, others
actively traded I swing trade stocks and options. My time frame is typically measured
in 1-2 weeks but some may last much longer I day trade Futures and their derivatives. I will also day trade stocks
when my swing trades do poorly – when my stops hit after launch My favorite setup is to find stocks in a longer term uptrend that have
pulled back for support I am a sucker for EPS growth which is great until my stocks miss
earnings Once I find a stock that is meeting my criteria for a setup, I look for
specific momentum indicators to trigger a trade I know my target and stop when I place the trade I own and have tried almost every software program on market. I use a
handful of them.

Top Down vs. Bottoms UpTop Down Bottoms Up
Overall market conditions will account for up to 70% of price action
Sector / Industry may be up to 20% of price driver
Thus stock picking is great but may account for as little as 10 – 20% of an individual equity movement
I like to find wolfpacks –groups of stocks in leading industries breaking out at same time
Even in a bad market / sector there are stocks that are leaders to the upside
This approach fishes from a broader basket of stocks
Might allow me to catch movement earlier
May find same stocks as Top Down
Higher risk of failure if market and industry group are moving against me

What I need on my Desert Isle besides High Speed Internet Real Time Charting and Trading Platform of Choice
TradeStation Think or Swim
Stock / Market / Group Analysis HighGrowthStock Investor - HGSI EdgeRater / ETF Bandit Seasonal Analysis MarketSmith
What I have learned from my “Gurus”

“Be Your Own Guru”Key influences on my style …
www.candlestickforum.com - Bigalowwww.chartsnchat.com – Elliott, Bigalowwww.effectivevolume.com - Pascalwww.highgrowthstock.com – Ian, Ron…http://www.rongroenke.com - Groenke

Stock Patterns Are Cyclical HGS stocks do fall like
rocks You must know what
Stage a Stock is in before you buy
All stocks go thru this patter over time
A similar pattern occurs within each stage
May be easier seen on weekly charts

Do not fight the Trend
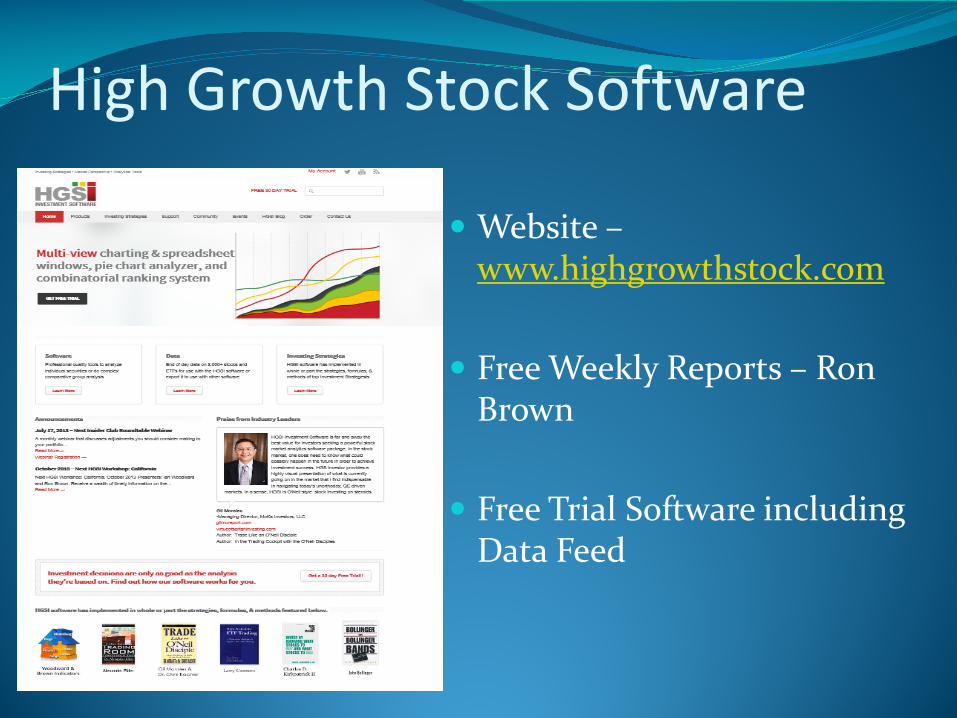
High Growth Stock Software
Website –www.highgrowthstock.com
Free Weekly Reports – Ron Brown
Free Trial Software including Data Feed
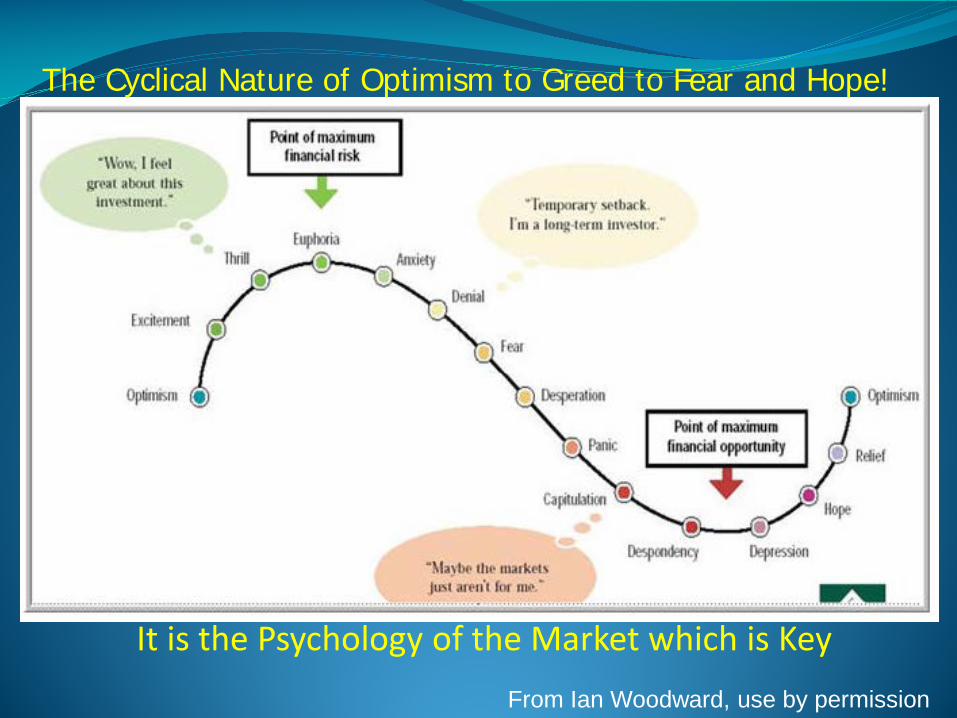
The Cyclical Nature of Optimism to Greed to Fear and Hope!
It is the Psychology of the Market which is KeyFrom Ian Woodward, use by permission


Hindenburg Omen Signaled Top in 2007Did you know it fired on Tuesday?One is not enough but a series should get you out.

Plotting The Hindenburg Omen with EdgeRater
Since 10/11, this only fired one other time ~ 4.15.12


May The Force Be With You Force Index = Volume Today * (Close Today - Close Yesterday) The Force Index Rules By John A. Sarkett, Developer, Option Wizard Seven Trading Rules
#1 Buy when a 2-day EMA of Force Index turns negative during uptrends. #2 Sell short when a 2-day EMA of Force Index turns positive in downtrends. #3 Buy when prices fall to a new low while Force Index makes a more shallow
bottom. #4 Sell when prices rally to a new high while Force Index traces a lower second
top. #5When a 13-day EMA of Force Index is above the centerline, bulls control the
market, and when it is below the centerline, bears control it. When this indicator flutters near its centerline, it identifies a trendless market -- a warning not to use trend-following trading
#6 A new peak in the 13-day EMA of Force Index shows that a rally is likely to continue.
#7 A new low in the 13-day EMA of Force Index shows that a downtrend is likely to continue.
http://option-wizard.com/features/force.shtml
based on material from "Trading for a Living" by Dr. Alexander Elder


All Clear Signaled By Series of Bingos followed by Eurekas

Pocket Pivots – Morales & Kacher
A Trigger in a Position Candidate that Meets other Criteria above. These are hardcoded in HGSI and can be coded for and observed RT in multiple platforms

Buyable Gap Up – M/K

Ian’s High Jump Baraka our own personal ATM machine
A simple tool that tells me how extended a stock is today compared to the past. When combined with a RCH I find some interesting shorting candidates. By itself I use this as a setup to potentially short or exit a long position. Smart programmerscan take this RT to other tools. I still look for a trigger as I have learned that extendedstocks can get more extended given more time

Green Candle Low and Red Candle High – From David Elliott adopted by George Lea
I use these to scan for failed new low and failed new highs. David Elliott taughtus that these could be powerful reversal signs. The RCL and GCL are setups nottriggers. They alert me to a possible change in trend direction and potential beginningof a Wave 3 move. The script can easily be programmed into TOS, Tradestation and
your favorite programs for RT scanning and is now part of HGSI

Squeeze – From George Lea
There are numerous definitions of a squeeze. This represents a nice setup.I look for candidate positions to break above or below from a squeeze

MOBO BO / BD from Elliott / Lea can be a nice trigger

Buy List vs. Setup The Market will likely dictate the performance of a stock or list The sector will add to the market as the leading driver of a stock
performance If the market and the sector are pointing in the same direction as my
stock the wind is behind my back A setup is a specific change related to some derivative of price
movement and volume that increases my odds of success A Buy list helps me work with an enriched group of stocks that meet
my criteria for setup Triggers help me pick what and when to buy or sell Multiple time frames are very useful in my setups and triggers I buy or sell short when a stock on my buy list triggers a trade I automate many of my setups and triggered in TradeStation and TOS
using indicators from MarketGauge.com, Never Loss Trading and others
Inclusion in my Buy List does not mean I Buy at Open……

HGSI is a great tool for swing and position trading stocks and ETFs
Great Software tool HGSI
2 Brilliant Minds
Active Community of
Traders

Do not miss the upcoming Seminar in Sunny PV
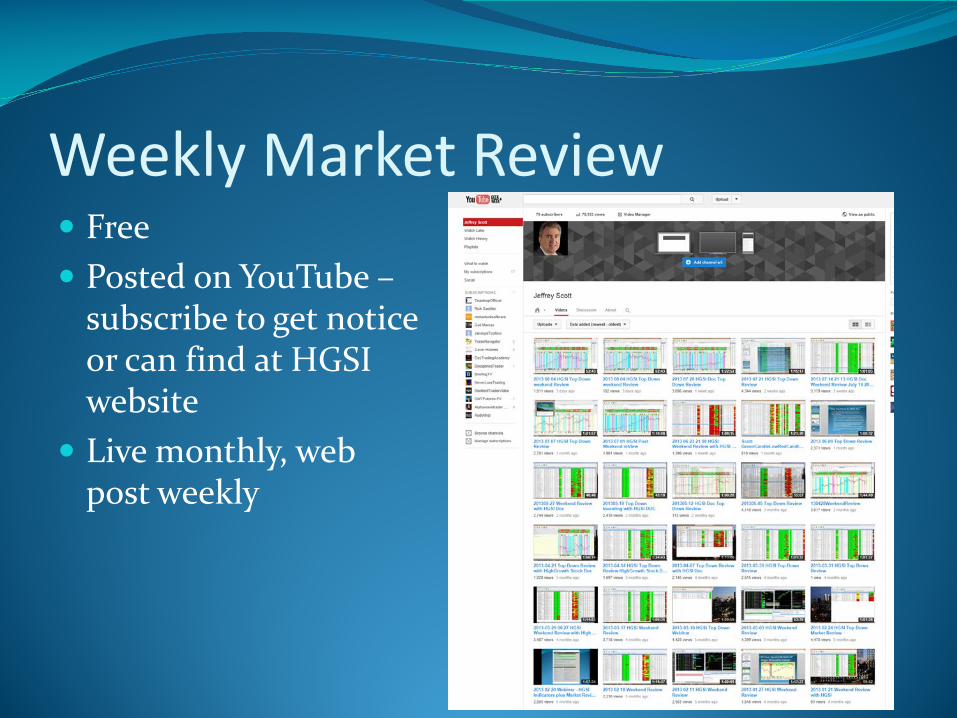
Weekly Market Review Free Posted on YouTube –
subscribe to get notice or can find at HGSI website
Live monthly, web post weekly

Parting Message Be Your Own Guru
Investing is a business make sure you have the right employees – tools and software
Continuing Education matters
Trade The Market We Have not The One You Think We Should Have