weldability of ni-co-cr-si superalloy : hr-160 alloy library/events/2002/materials/edwards... ·...
TRANSCRIPT

Weldability of Ni-Co-Cr-Si Superalloy : HR-160 alloy
I.S. Maroef CWJCR, Colorado School of Mines, 1500 Illinois St, Golden, CO 80401
E-mail: [email protected] ; Telephone: (303) 273-3788; Fax: (303) 273-3795 M.D. Rowe
Haynes International Inc., 1020 west Park Ave, Kokomo, IN 46904 E-mail: [email protected] ; Telephone: (303) 273-3788; Fax: (303) 273-3795
G.R. Edwards CWJCR, Colorado School of Mines, 1500 Illinois St, Golden, CO 80401
E-mail: [email protected] ; Telephone: (303) 273-3773; Fax: (303) 273-3795
Manuscript
The purpose of this study was to investigate the effect of silicon and iron on the weldability of HAYNES HR-160 * alloy. HR-I60 alloy is a solid solution strengthened Ni-Co-Cr-Si alloy. The alloy is designed to resist corrosion in sulfidizing and other aggressive high temperature environments. Silicon is added (~2.75%) to promote the formation of a protective oxide scale in environments with low oxygen activity. HR-160 alloy has found applications in waste incinerators, calciners, pulp and paper recovery boilers, coal gasification systems, and fluidized bed combustion systems. HR-160 alloy has been successfully used in a wide range of welded applications. However, the alloy can be susceptible to solidification cracking under conditions of severe restraint. A previous study by DuPont, et al. [1] showed that silicon promoted solidification cracking in the commercial alloy. In earlier work conducted at Haynes, and also from published work by DuPont et al., it was recognized that silicon segregates to the terminal liquid, creating low melting point liquid films on solidification grain boundaries. Solidification cracking has been encountered when using the alloy as a weld overlay on steel, and when joining HR-160 plate in a thickness greater than19 mm (0.75 inch) with matching filler metal. The effect of silicon on the weldability of HR-160 alloy has been well documented, but the effect of iron is not well understood. Prior experience at Haynes has indicated that iron may be detrimental to the solidification cracking resistance of the alloy. Iron does not segregate to the terminal solidification product in nickel-base alloys, as does silicon [2], but iron may have an indirect or interactive influence on weldability. A set of alloys covering a range of silicon and iron contents was prepared and characterized to better understand the welding metallurgy of HR-160 alloy. Some of the results relating to the solidification cracking susceptibility of the experimental alloys described here were also published in the proceedings of the “Trends in Welding Research Conference” held in Pine Mountain, GA in April 2002. Repair of commercial HR-160 alloy after prolonged high temperature use is also a critical issue for the application of this alloy. To respond to this concern, a hot ductility study of aged commercial HR-160 alloys has been initiated and is still in progress. Two aging schedules were selected: 760 oC and 870 oC for 4000 hrs. The aged material at 870 oC, expected to perform the worst, has been tested, while the material aged at the lower temperature will be evaluated to get a better understanding of the effect of aging on the hot ductility of this alloy.
* HAYNES and HR-160 are trademarks of Haynes International Inc.

Materials and Experimental Procedures Materials For this study, four HR-160 type experimental alloys with different target levels of silicon (2.3 and 3.9 %) and iron (0.10 and 4.0 %) were prepared. The experimental heats represent a 2 x 2 matrix of high and low silicon and iron. The heat 8727- 7- 7506 was included in this study to represent the standard commercial alloy. The chemical compositions of the experimental and commercial alloys are given in Table 1. The experimental alloys were vacuum melted, cast into electrodes, then electroslag remelted into 102-mm (4-inch) diameter ingots. The ingots were forged to 44.5 millimeters (1.75 inches), further hot-rolled to 12.5 mm (0.5 inches) plate. The materials for varestraint testing were prepared by hot rolling at 1021 oC to 9.5-mm (0.375-inch) plate. The alloys were annealed at at 1021 oC for 20 min. and subsequently water quenched. Sigmajig specimens were taken from the hot rolled 12.5-mm (0.5-inch) thick plate to be hot rolled to 2 millimeters (0.080 inches), then cold rolled to 1 millimeters (0.04 inches), followed by an anneal at 1100 oC.
Table 1. Chemical compositions of the HR-160 type experimental and commercial alloys (wt %)
Haynes Heat # 27 29 8727-7-7506 28 30
Nominal Si & Fe 2.3% Si 2.3% Si 2.8% Si 4.0% Si 4.0% SiContent 0.10% fe 4.0% Fe 0.10 % Fe 0.10% Fe 4.0% feSource Exp. Exp. Comm. Exp. Exp.Element
C 0.062 0.061 0.05 0.062 0.065Cb <.01 0.01 <.050 0.01 0.01Co 30.01 29.99 30.1 29.99 29.74Cr 27.61 27.88 27.80 27.60 27.68Fe 0.08 4.01 <0.10 0.09 3.96Mn 0.55 0.53 0.46 0.54 0.52Ni 38.65 34.40 37.11 36.72 33.04P 0.002 <.002 0.002 0.005 0.006S <.001 <.001 0.007 <.001 <.001Si 2.34 2.24 2.81 4.09 4.11Ti 0.5 0.49 0.46 0.5 0.44
Solidification Cracking Tests Longitudinal varestraint tests were undertaken with a welding heat input of 2.2 kJ/mm and augmented strain of 1%. Each experimental alloy was tested in triplicate. Five replicate samples of the commercial HR-160 alloy were tested. The total crack length and maximum crack length were taken as indicators of the cracking susceptibility. Cracks were measured in the as-welded condition with a stereoscopic microscope. Sigmajig testing of 50-mm × 50-mm coupons was also performed. As an indicator of cracking susceptibility, a threshold stress for crack initiation was measured. To determine the threshold stress, the sigmajig test was performed over a range of applied stress, and the threshold stress was taken as the minimum stress to produce cracking. Hot cracks that formed in the fusion zone were measured under a stereoscopic microscope. Quantitative metallography Metallographic samples were taken from welded specimens to analyze resulting microstructures. Samples were electrolytically etched at 6 volts using a solution of 5 grams oxalic acid dissolved in 95ml hydrochloric acid. The weld microstructures were initially analyzed using light optical microscopy. The volume percent of interdendritic eutectic constituent was measured metallographically using image analysis software. The average of 20 fields analyzed at 200x magnification was reported. Area percent on a metallographic cross-section was considered to be representative of the bulk volume percent.

Differential Thermal Analysis Differential thermal analysis (DTA) was performed with a Netsch Thermal Analyzer STA 409, using alumina as a reference. This analysis was intended to provide some thermodynamic basis to explain the trends in solidification cracking susceptibility of the different alloys. As a parameter for solidification susceptibility, the solidification temperature range (STR) assessed from DTA was determined. Alumina crucibles and lids, designed for differential scanning calorimetry (DCS), were used to increase sensitivity of the analysis. With these crucibles, a sample mass of 150 mg ± 20 mg was found sufficient for easy detection of reaction peaks. On-heating rate was determined to be 0.083 oC/s (5 oC/min) to obtain near equilibrium solidus and liquidus temperatures. On the other hand, a rate of 0.33 oC/s (20 oC/min) was selected for on-cooling analysis. In this way, reaction temperatures associated with non-equilibrium solidification can be measured. Heat Affected Zone (HAZ) Hot Cracking Tests Initial observation of the heat-affected zone cracking was taken from the varestraint tested samples. The varestraint test is primarily meant to measure the resistance of alloys to solidification cracking in the fusion zone. However, heat-affected zone (HAZ) cracks will often be found in varestraint test specimens of alloys that are susceptible to this type of cracking. Susceptible alloys, identified in the varestraint tests, were tested for hot ductility response with a Gleeble 1500 thermo-mechanical simulator. In addition, the commercial HR-160 alloy, aged at 870 oC for 400 hrs, has been evaluated to assess a preliminary understanding of the effect of aging to the HAZ hot cracking of the commercial HR-160 alloy. The Gleeble test subjects a sample to a simulated weld thermal cycle, which is immediately followed by rapid tensile loading (65 mm/s) during either the heating cycle or during cooling cycle heating to a peak. For the on-cooling test, the peak temperature was that where the on-heating stress to fracture was zero, or the nil stress temperature (NST). It has been reported that tests utilizing the NST as a peak temperature discriminated to a greater degree than did those tests using a lower maxium temperature, e.g. NDT (nil ductility temperature). NST was determined by imposing a slight tensile load on a sample and ramping up the temperature to 15 oC above the NDT. If the specimen cracks, that temperature is taken as the NST; otherwise the test is to be repeated at another peak temperature 15 oC higher than the last one. Details of test followed the procedure proposed by Lundin et al. [3 ]. In this procedure, the prescribed thermal cycle corresponds to that in 38 mm (1.5 inches) thick stainless steel welded with a heat input of 2.8 kJ/mm. A stabilizing time of 0.5 second was assigned in the thermal program before tensile loading, during both the heating and the cooling cycle. No annealing time was allowed at the peak temperature during on-cooling tests. Hot ductility was evaluated as the percent reduction in area. The ratio of ductility recovery (RDR) proposed by Lundin [4] was used as the indicator of HAZ susceptibility to hot cracking. The RDR is defined as the ratio of areas under the curve for on-cooling versus on-heating, measured from the on-heating peak ductility temperature to the NDT.
Results Solidification Cracking Results of the varestraint and the sigmajig testing are plotted as a function of the silicon concentration in Fig. 1. Data points of iron-rich samples are filled with black color to show the effect of iron for a given silicon concentration. Two criteria of solidification cracking, the average total crack length (TCL) and the maximum crack length (MCL) are presented in Fig. 1. The MCL provides both a rapid quantitative means of assessing hot-cracking sensitivity and an indication of the relative hot-cracking temperature range. MCL has also been shown to correlate well with sigmajig threshold stresses and solidification temperature ranges (STR) [1,4,5]. Therefore to discuss the solidification cracking susceptibility in the light of thermodynamic parameters such as the STR, MCL is the selected criterion. On the other hand, TCL is based on measurement of all cracks in a given sample and may provide additional information on the solidification cracking susceptibility of the alloy under investigation. The results showed that both the varestraint MCLs and sigmajig threshold stresses were in reasonable agreement, indicating the predominantly detrimental effect of silicon over that of iron. Both types of data showed that the cracking susceptibility increased with an increase in silicon content up to approximately the commercial HR-160 alloy’s concentration (2.3% Si).

Then, the susceptibility leveled off at higher levels of silicon, within this test matrix. The detrimental effect of iron was considered significant at a low level of silicon, but was apparently overshadowed by silicon at a higher level of silicon. In contrast to the MCL data, the TCL data showed that cracking susceptibility continuously increased with an increase in silicon, within the concentration established by the test matrix. Also, in contrast to the observation from the MCL and sigmajig criteria, the detrimental effect of iron on the susceptibility was increased at high silicon concentration when the TCL criterion was used.
Threshold Stress(M
pa )Av
erag
e M
axim
um
Cra
ck L
engt
h (m
m)
Average Total
11.5
22.5
33.5
4 10
20
30
40
50Varestraint Test1 % augmented strain
Varestraint Test1 % augmented strain
0
20
40
60
80
2 2.5 3 3.5 4 4.5
: 4.0 % Fe: 0.10 % Fe
Threshold Stress(M
pa )Av
erag
e M
axim
um
Cra
ck L
engt
h (m
m)
Average Total C
rack Length (mm
)
11.5
22.5
33.5
4 10
20
30
40
50Varestraint Test1 % augmented strain
Varestraint Test1 % augmented strain
0
20
40
60
80
2 2.5 3 3.5 4 4.5Silicon Concentration (wt %)
: 4.0 % Fe: 0.10 % Fe
Sigmajig Test
Threshold Stress(M
pa )Av
erag
e M
axim
um
Cra
ck L
engt
h (m
m)
Average Total
11.5
22.5
33.5
4 10
20
30
40
50Varestraint Test1 % augmented strain
Varestraint Test1 % augmented strain
0
20
40
60
80
2 2.5 3 3.5 4 4.5
: 4.0 % Fe: 0.10 % Fe
Threshold Stress(M
pa )Av
erag
e M
axim
um
Cra
ck L
engt
h (m
m)
Average Total C
rack Length (mm
)
11.5
22.5
33.5
4 10
20
30
40
50Varestraint Test1 % augmented strain
Varestraint Test1 % augmented strain
0
20
40
60
80
2 2.5 3 3.5 4 4.5Silicon Concentration (wt %)
: 4.0 % Fe: 0.10 % Fe
Sigmajig Test
Fig. 1. Solidification Cracking Susceptibility of the HR-160 type alloys with different silicon and iron concentration.
The crack morphologies of three varestraint tested weld metals are shown in Fig. 2 to Fig. 4. One can see that the commercial HR-160 alloy weld metal had an appreciably wider crack opening than that found for the two high-Si HR-160 alloy weld metals. There are larger numbers of cracks in the high-Si HR-160 alloys, suggesting that cracks can be initiated more easily in the high-Si alloys than in the low-Si alloys. Cracks are smaller and more numerous in the high-Fe,high-Si alloy than those in the low-Fe,low-Si alloy. The effect of iron in the high-Si alloy appeared to be that of increasing the crack initiation sites, a phenomenon that might be associated with microstructure of the solidifying weld metal, such as the terminal liquid distribution along the grain boundaries. Quantitative Metallography Fig. 5. shows the volume fraction of interdendritic eutectic as a function of the silicon concentration, both from the varestraint and the sigmajig tested samples. The amount of eutectic product appears to be directly proportional to the silicon content of the alloy. Addition of iron at the levels tested had no measurable effect on the amount of eutectic liquid. In general, at small volume fractions of eutectic, hot cracking susceptibility increases with increasing eutectic product due to an increase in the networking of terminal liquid that wets the grain boundaries. Above a threshold volume fraction (10 to 20 %), there is usually enough liquid to back-fill and heal a formed hot crack, leading to a reduction of susceptibility. From the sigmajig and MCL data, the high-Si alloys may be approaching the quantity of eutectic product required for backfilling, but further data would be required to confirm this. Also, the TCL data tends to indicate that the eutectic volume fraction is still smaller than the threshold value.

3 mm3 mm3 mm
Fig. 2. Longitudinal varestraint-induced solidification cracks in a commercial heat of HR-160 alloy
3 mm3 mm3 mm
Fig. 3. Longitudinal varestraint-induced solification cracks in a 4.0% Si and 4.0% Fe HR-160 type
experimental alloy.
3 mm3 mm
Fig. 4. Longitudinal varestraint-induced solification cracks in a 4.0% Si and 4.0% Fe HR-160 type experimental alloy.
: 4.0 % Fe: 0.10 % Fe : 4.0 % Fe: 0.10 % Fe
0.00
2.00
4.00
6.00
8.00
10.00
12.00
14.00
2 2.5 3 3.5 4 4
Volu
me
Perc
ent
Inte
rden
driti
cEu
tect
ic
.5
VarestraintSigmajig
: 4.0 % Fe: 0.10 % Fe : 4.0 % Fe: 0.10 % Fe
0.00
2.00
4.00
6.00
8.00
10.00
12.00
14.00
2 2.5 3 3.5 4 4
Silicon Concentration (wt %)
Volu
me
Perc
ent
Inte
rden
driti
cEu
tect
ic
.5
VarestraintSigmajig
: 4.0 % Fe: 0.10 % Fe : 4.0 % Fe: 0.10 % Fe
0.00
2.00
4.00
6.00
8.00
10.00
12.00
14.00
2 2.5 3 3.5 4 4
Volu
me
Perc
ent
Inte
rden
driti
cEu
tect
ic
.5
VarestraintSigmajig
: 4.0 % Fe: 0.10 % Fe : 4.0 % Fe: 0.10 % Fe
0.00
2.00
4.00
6.00
8.00
10.00
12.00
14.00
2 2.5 3 3.5 4 4
Silicon Concentration (wt %)
Volu
me
Perc
ent
Inte
rden
driti
cEu
tect
ic
.5
VarestraintSigmajig
Fig. 5. The quantity of interdendritic eutectic product in the weld metal of HR-160 type alloys with different silicon and iron concentrations, as measured from varestraint and sigmajig specimens.
Differential Thermal Analysis Fig. 6 exhibits the DTA results for the commercial HR-160 alloy, containing both the on-heating and on-cooling thermogram curves. During heating, the sample exhibits a solidus temperature of approximately 1300 oC (determined as the onset of a detectable difference in the endothermic part of the curve) and reaches the liquidus temperature at 1370 oC (determined as the peak of the endothermic reaction). The near equilibrium melting range was 70 oC, similar to the result reported earlier by DuPont [1]. Upon solidification, the alloy exhibited a large exothermic peak at an under-cooled temperature of 1340 oC, which corresponded to the formation of the primary dendrites. Such an undercooling also occurred at the analyses for the other HR-160 experimental alloys. Solidification was completed with a terminal liquid exothermic reaction at 1150 oC. Due to this large undercooling, the solidification temperature ranges (STR) for the alloys were taken as the difference between on-heating liquidus temperature and on-cooling terminal liquid reaction temperature. When considering the epitaxial growth of weld metal solidification, one could expect that the required undercooling to be much smaller. For the HR-160 commercial alloy, the STR was 220 oC. Table 2 lists the reaction temperatures and the STR of the alloys.

As shown in Fig. 7, the melting and solidification temperatures of the two low-Si alloys were similar. An apparent difference in the DTA curves is associated with a larger undercooling that occurred with the low-Si,low-Fe alloy. The terminal liquid reactions were not detected with the test parameters used in the current DTA. The amount of interdendritic eutectic in these alloys, shown in Fig. 5, might be too small for the samples to give sufficient thermal fluctuation to the DTA apparatus. The final solidification temperature could not be accurately determined because standard procedure to determine a finish temperature of a reaction in DTA usually applies only to single-temperature exothermic or endothermic reactions. However, a reduction in STR due to lower silicon concentration could be observed. In addition, there was no measurable effect caused by the different concentration of iron within the two low-Si alloys. However, the observed increase in the susceptibility of solidification cracking, both from the varestraint and the sigmajig data, implied that STR was not the only factor to cause higher susceptibility to solidification cracking in the high-Fe-low-Si HR-160 alloy with low silicon concentration. The DTA curves from the high-Si alloys were also similar, as shown in Fig. 8, with their terminal liquid reactions easily detected. The fact that the STR of both alloys, 209 and 213 oC, were not significantly different was consistent with the small difference in the MCL and the sigmajig threshold stress of the two alloys.
-1
-0.8
-0.6
-0.4
-0.2
0
0.2
0.4
1000 1100 1200 1300 1400
Temperature (oC)
DSC
(mW
/mg)
2.8% Si, 0.10 % Fe
endothermic
exothermic
On Heating
On Cooling
1371 oC
1152 oC
-1
-0.8
-0.6
-0.4
-0.2
0
0.2
0.4
1000 1100 1200 1300 1400
Temperature (oC)
DSC
(mW
/mg)
2.8% Si, 0.10 % Fe
endothermic
exothermic
On Heating
On Cooling
1371 oC
1152 oC
-1
-0.8
-0.6
-0.4
-0.2
0
0.2
0.4
1000 1100 1200 1300 1400
Temperature (oC)
DSC
(mW
/mg)
2.8% Si, 0.10 % Fe
endothermic
exothermic
On Heating
On Cooling
1371 oC
1152 oC
Fig. 6. DTA thermogram of commercial HR-160 alloys during melting at 5 oC/min and solidification at 20 oC/min.
DSC
(mW
/mg)
-3.5
-2.5
-1.5
-0.5
0.1
0.2
0.3
0.4
0.5
1000 1100 1200 1300 1400
Temperature (oC)
1376 oC
1378 oC
2.3 % Si, 0.10 % Fe
endothermic
exothermic
2.3 % Si, 4.0 % Fe
On Heating
On CoolingDSC
(mW
/mg)
-3.5
-2.5
-1.5
-0.5
0.1
0.2
0.3
0.4
0.5
1000 1100 1200 1300 1400
Temperature (oC)
1376 oC
1378 oC
2.3 % Si, 0.10 % Fe
endothermic
exothermic
2.3 % Si, 4.0 % Fe
On Heating
On Cooling
Fig. 7. DTA thermogram of low-Si HR-160 type experimental alloys during melting at 5 oC/min and solidification at 20 oC/min.
-2.5
-1.5
-0.5
0.2
0.4
0.6
1000 1100 1200 1300 1400
Temperature (oC)
DSC
(mW
/mg) endothermic
1341 oC
1340 oC
1134 oC1127 oCexothermic
4.0 % Si, 0.10 % Fe4.0 % Si, 4.0 % Fe
On Heating
On Cooling
-2.5
-1.5
-0.5
0.2
0.4
0.6
1000 1100 1200 1300 1400
Temperature (oC)
DSC
(mW
/mg) endothermic
1341 oC
1340 oC
1134 oC1127 oCexothermic
4.0 % Si, 0.10 % Fe4.0 % Si, 4.0 % Fe
On Heating
On Cooling
Fig. 8. DTA thermogram of high-Si HR-160 type experimental alloys during melting at 5 oC/min and solidification at 20 oC/min.
Table 2. Results of Differential Thermal analysis
207 ± 51134 ± 51341 ± 54.0%Si, 4.0%Fe
213 ± 51127 ± 51340 ± 54.0%Si, 0.10%Fe
219 ± 51352 ± 51371 ± 52.8%Si, 0.10%Fe
NDND1376 ± 52.3%Si, 4.0%Fe
NDND1378 ± 52.3 %Si, 0.10% Fe
Solidification Temperature Range
(oC)
Terminal Liquid
Temperature (oC)
Liquidus Temperature
(oC)Alloy
207 ± 51134 ± 51341 ± 54.0%Si, 4.0%Fe
213 ± 51127 ± 51340 ± 54.0%Si, 0.10%Fe
219 ± 51352 ± 51371 ± 52.8%Si, 0.10%Fe
NDND1376 ± 52.3%Si, 4.0%Fe
NDND1378 ± 52.3 %Si, 0.10% Fe
Solidification Temperature Range
(oC)
Terminal Liquid
Temperature (oC)
Liquidus Temperature
(oC)Alloy
ND = Not Detected
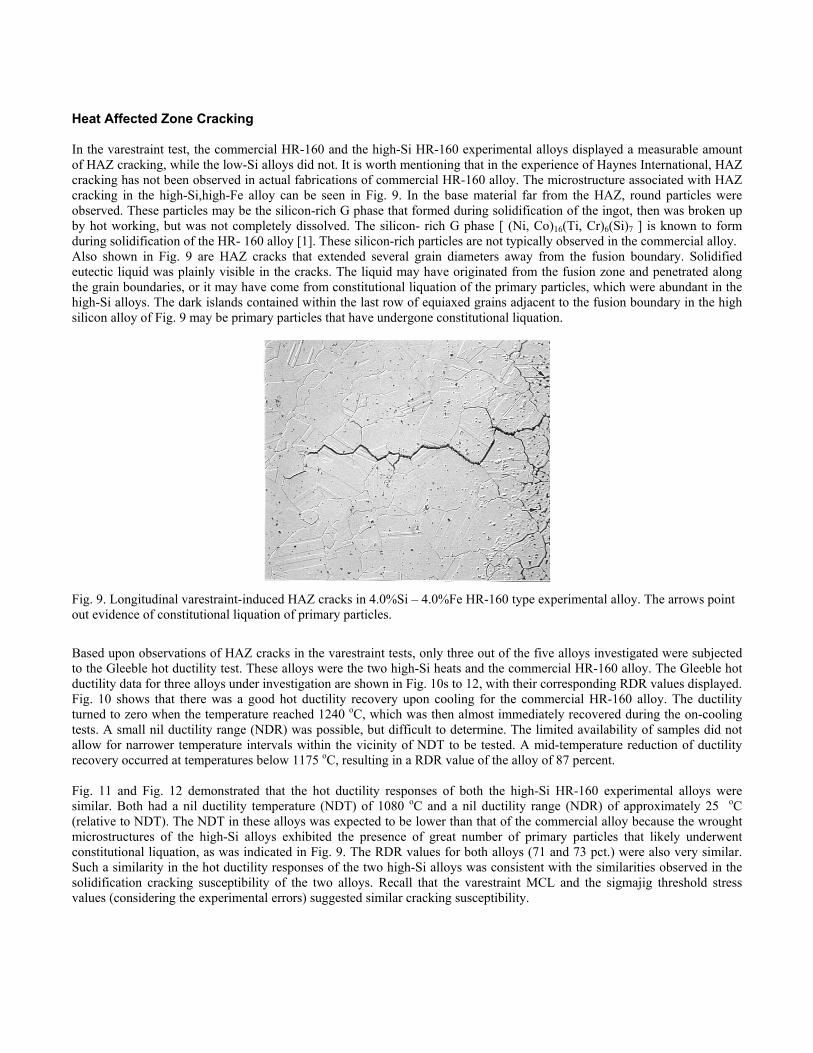
Heat Affected Zone Cracking In the varestraint test, the commercial HR-160 and the high-Si HR-160 experimental alloys displayed a measurable amount of HAZ cracking, while the low-Si alloys did not. It is worth mentioning that in the experience of Haynes International, HAZ cracking has not been observed in actual fabrications of commercial HR-160 alloy. The microstructure associated with HAZ cracking in the high-Si,high-Fe alloy can be seen in Fig. 9. In the base material far from the HAZ, round particles were observed. These particles may be the silicon-rich G phase that formed during solidification of the ingot, then was broken up by hot working, but was not completely dissolved. The silicon- rich G phase [ (Ni, Co)16(Ti, Cr)6(Si)7 ] is known to form during solidification of the HR- 160 alloy [1]. These silicon-rich particles are not typically observed in the commercial alloy. Also shown in Fig. 9 are HAZ cracks that extended several grain diameters away from the fusion boundary. Solidified eutectic liquid was plainly visible in the cracks. The liquid may have originated from the fusion zone and penetrated along the grain boundaries, or it may have come from constitutional liquation of the primary particles, which were abundant in the high-Si alloys. The dark islands contained within the last row of equiaxed grains adjacent to the fusion boundary in the high silicon alloy of Fig. 9 may be primary particles that have undergone constitutional liquation.
Fig. 9. Longitudinal varestraint-induced HAZ cracks in 4.0%Si – 4.0%Fe HR-160 type experimental alloy. The arrows point out evidence of constitutional liquation of primary particles.
Based upon observations of HAZ cracks in the varestraint tests, only three out of the five alloys investigated were subjected to the Gleeble hot ductility test. These alloys were the two high-Si heats and the commercial HR-160 alloy. The Gleeble hot ductility data for three alloys under investigation are shown in Fig. 10s to 12, with their corresponding RDR values displayed. Fig. 10 shows that there was a good hot ductility recovery upon cooling for the commercial HR-160 alloy. The ductility turned to zero when the temperature reached 1240 oC, which was then almost immediately recovered during the on-cooling tests. A small nil ductility range (NDR) was possible, but difficult to determine. The limited availability of samples did not allow for narrower temperature intervals within the vicinity of NDT to be tested. A mid-temperature reduction of ductility recovery occurred at temperatures below 1175 oC, resulting in a RDR value of the alloy of 87 percent. Fig. 11 and Fig. 12 demonstrated that the hot ductility responses of both the high-Si HR-160 experimental alloys were similar. Both had a nil ductility temperature (NDT) of 1080 oC and a nil ductility range (NDR) of approximately 25 oC (relative to NDT). The NDT in these alloys was expected to be lower than that of the commercial alloy because the wrought microstructures of the high-Si alloys exhibited the presence of great number of primary particles that likely underwent constitutional liquation, as was indicated in Fig. 9. The RDR values for both alloys (71 and 73 pct.) were also very similar. Such a similarity in the hot ductility responses of the two high-Si alloys was consistent with the similarities observed in the solidification cracking susceptibility of the two alloys. Recall that the varestraint MCL and the sigmajig threshold stress values (considering the experimental errors) suggested similar cracking susceptibility.

0
20
40
60
80
100
950 1000 1050 1100 1150 1200 1250 1300
Temperature (oC)
Red
uctio
n in
Are
a (p
ct.)
2.3%Si, 0.10%Fe -OH2.3%Si, 0.10% Fe - OC
RDR = 87%
0
20
40
60
80
100
950 1000 1050 1100 1150 1200 1250 1300
Temperature (oC)
Red
uctio
n in
Are
a (p
ct.)
2.3%Si, 0.10%Fe -OH2.3%Si, 0.10% Fe - OC
RDR = 87%
Fig. 10. Gleeble hot ductility data for HR-160 commercial alloy.
0
20
40
60
80
100
950 1000 1050 1100 1150 1200 1250 1300
Temperature (oC)
Red
uctio
n in
Are
a (p
ct.)
4.0%Si, 0.10%Fe - OH4.0%Si, 0.10% Fe - OC
RDR = 71%
0
20
40
60
80
100
950 1000 1050 1100 1150 1200 1250 1300
Temperature (oC)
Red
uctio
n in
Are
a (p
ct.)
4.0%Si, 0.10%Fe - OH4.0%Si, 0.10% Fe - OC
RDR = 71%
Fig. 11. Gleeble hot ductility data for HR-160 type experimental alloy with target concentrations of 4.0% Si and 0.10 % Fe.
0
20
40
60
80
100
950 1000 1050 1100 1150 1200 1250 1300
Temperature (oC)
Red
uctio
n in
Are
a (p
ct.)
4.0%Si, 4.0%Fe - OH4.0%Si, 4.0% Fe - OC
RDR = 73%
0
20
40
60
80
100
950 1000 1050 1100 1150 1200 1250 1300
Temperature (oC)
Red
uctio
n in
Are
a (p
ct.)
4.0%Si, 4.0%Fe - OH4.0%Si, 4.0% Fe - OC
RDR = 73%
Fig. 12. Gleeble hot ductility data for HR-160 experimental alloy with target concentrations of 4.0% Si and 0.10 % Fe.
HAZ hot cracking of aged commercial HR-160 alloy The microstructure of the commercial HR-160 alloy, aged at 870 oC for 4000 hrs, is shown in Fig. 13. The grain boundaries and twin boundaries are decorated with spherical precipitates. Intragranular precipitation is also evident, although less prominent. Chemical characterization of the precipitates was done by electron dispersive spectroscopy, utilizing the scanning electron microscopy (SEM-EDS), and chemically extracted residues of the alloy. The secondary electron image of the extracted precipitates, as shown in Fig. 13b, revealed that plate-like precipitates were also present in the aged alloy. The as-produced HR-160 alloy does not contain the precipitates seen in the aged alloy. The plate-like precipitates were not easily observed in the optical micrograph. The assessed chemical composition indicated an enrichment of silicon, titanium, chromium, cobalt, and nickel in the groups of precipitates. The possible precipitates were thought to be the silicon-rich G phase [ (Ni, Co)16(Ti, Cr)6(Si)7 and Cr23C6 carbides. To further characterize the precipitates, X-ray diffraction analysis was performed for structural identification. Fig. 14 shows the X-ray diffractions of two aged commercial alloys, along with reference patterns of both the G-phase and the Cr23C6 carbide. In addition to the HR-160 alloy, aged at 870 oC, another HR-160 alloy, aged at 760 oC for 4000 hrs, was prepared for Gleeble hot ductility study yet to be completed. The locations of the peaks match well with the reference patterns. The only discrepancy is that the relative height

of the collected patterns did not show the same peak ratios as those in the reference pattern for Cr23C6 carbide. However, the locations of the peaks are considered sufficient to identify the phases, and variations in the height could be accounted for by measuring variables or by differences in the sample morphologies between the extracted and the reference samples. The Gleeble hot ductility response of the aged commercial HR-160 alloy is shown in Fig. 15. As compared to the hot ductility response of the as-produced commercial HR-160 alloy (Fig. 10), the hot ductility was significantly reduced in the aged alloy, particularly the recovery at 1000 oC. It is not yet clear whether or not liquation at the grain boundaries, an event that guarantees a severe drop in ductility recovery of an alloy, occured. An NDR of approximately 25 oC was clearly evident. At this point, the RDR of the aged commercial HR-160 alloy can’t be accurately assessed because of the unpredictable trend of the data between 1000 and 1100 oC. A further test within these temperatures will be conducted for completion of the assessment of the hot ductility response of this alloy. In addition, another set of Gleeble hot ductility test will be performed on the commercial HR-160 alloy, aged at 760 oC for 4000 hrs, and on assessment of the fracture topography will be done to determine whether liquation occurred in the aged alloys.
20 µm20 µm20 µm20 µm
10uIE 870 extraction/ 1600oF
1
2
3
4
Fig. 13. (a) Optical micrograph (b) Secondary electron image of extracted precipitate of commercial HR-160 alloy , aged at 870 oC for 400 hrs.
0
10
20
30
40
50
60
70
80
90
100
20 30 40 50 60 70 80 90Two Theta (Degrees)
Rel
ativ
e In
tens
ity
14001600G phase (Ni16Ti6Si7)Cr23C6
0
10
20
30
40
50
60
70
80
90
100
20 30 40 50 60 70 80 90Two Theta (Degrees)
Rel
ativ
e In
tens
ity
14001600G phase (Ni16Ti6Si7)Cr23C6
Fig. 14. X-ray diffraction of extracted phases from commercial HR-160 alloy, aged at 760 oC and 870 oC for 4000 hrs. The actual data, shown as continuous lines, is plotted along with the reference patterns (represented by symbols).

0
20
40
60
80
950 1000 1050 1100 1150 1200 1250 1300
Temperature (oC)
Red
uctio
n in
Are
a (p
ct.)
AGED 2.3%Si, 0.10%Fe -OHAGED 2.3%Si, 0.10% Fe - OC
0
20
40
60
80
950 1000 1050 1100 1150 1200 1250 1300
Temperature (oC)
Red
uctio
n in
Are
a (p
ct.)
AGED 2.3%Si, 0.10%Fe -OHAGED 2.3%Si, 0.10% Fe - OC
0
20
40
60
80
950 1000 1050 1100 1150 1200 1250 1300
Temperature (oC)
Red
uctio
n in
Are
a (p
ct.)
AGED 2.3%Si, 0.10%Fe -OHAGED 2.3%Si, 0.10% Fe - OC
Fig. 15. Gleeble hot ductility data for commercial HR-160 alloy, aged at 870 oC for 4000 hrs.
Conclusions 1. Within the tested levels of alloying addition, both silicon and iron additions proved to increase the susceptibility of the
alloy to solidification cracking, with silicon having the predominant influence. 2. Both solidification temperature ranges and the interdendritic eutectic volume fraction strongly depended upon the silicon
content, with Fe having no measurable effect. 2. The two high-silicon alloys exhibited a lower ratio of ductility recovery (RDR) than the commercial HR-160 alloy in the
Gleeble test. 3. No siginificant difference was detected between the hot ductility responses of the two high-Si alloys (low and high Fe),
implying that iron did not significantly affect the HAZ hot cracking susceptibility of the HR-160 type alloys. 4. The aging at 870 oC for 4000 hrs severely reduced the hot ductility response and increased the HAZ hot cracking
susceptibility of the commercial HR-160 alloy.
Acknowledgment Support of the Fossil Energy Materials Program, U.S. Department of Energy is gratefully acknowledged. The authors also thank Mr. Stephen Matthews of Haynes International Inc. for his support. Finally, the technical assistances of Dr. Stan David, Materials Divison, ORNL, and Ms. Brenda Mulac of CSM are appreciated.
References 1 . J.N. DuPont, Welding Journal, 81, 408-415s (1999). 2 . J.N. Dupont, J. Materials Science, 32, 4101-4107 (1997). 3 . C.D. Lundin, C.Y.P. Qiao, C.H. Lee, Weldability of Materials (Proc. Of Materials Weldability Symposium), 9-21, ASM
International, Materials Park, Ohio, 1990. 4 . C.D. Lundin, C.Y.P. Qiao, T.P.S. Gill, and G.M. Goodwin, Welding Journal, 74, 189-200s (1993). 5 . J.N. Dupont, C.V. Rubino, and A.R. Marder, Welding Journal, 80 (1998).