welfare reform committee 5th report, 2014 (session … reform committee, 5th report, 2014 (session...
TRANSCRIPT

Welfare Reform Committee
5th Report, 2014 (Session 4)
Report on Local Impact of Welfare Reform
Published by the Scottish Parliament on 23 June 2014
SP Paper 563 Session 4 (2014)

Parliamentary copyright. Scottish Parliamentary Corporate Body
Information on the Scottish Parliament’s copyright policy can be found on the website - www.scottish.parliament.uk
Any links to external websites in this report were working correctly at the time of publication.
However, the Scottish Parliament cannot accept responsibility for content on external websites.

Welfare Reform Committee
Remit and membership
Remit: To keep under review the passage of the UK Welfare Reform Bill and monitor its implementation as it affects welfare provision in Scotland and to consider relevant Scottish legislation and other consequential arrangements. Membership: Annabelle Ewing Linda Fabiani Jamie Hepburn (Deputy Convener) Alex Johnstone Kenneth Macintosh Michael McMahon (Convener) Kevin Stewart Committee Clerking Team: Clerk to the Committee Simon Watkins Assistant Clerk Rebecca Macfie Committee Assistant Kevin Dougan

WR/S4/14/R5
1
Welfare Reform Committee
5th Report, 2014 (Session 4)
Report on Local Impact of Welfare Reform The Committee reports to the Parliament as follows—
1. In January 2014, the Committee commissioned research on the local impact of welfare reform from the Centre for Regional Economic and Social Research at Sheffield Hallam University
2. The research is attached as Annexe A to this report.
SP Paper 563 Session 4 (2014)

Welfare Reform Committee, 5th Report, 2014 (Session 4)
2
ANNEXE A: THE LOCAL IMPACT OF WELFARE REFORM
THE LOCAL IMPACT OF WELFARE REFORM
A report for the Scottish Parliament
Christina Beatty and Steve Fothergill
Centre for Regional Economic and Social Research Sheffield Hallam University
June 2014

Welfare Reform Committee, 5th Report, 2014 (Session 4)
3
Key points
A 2013 report by the present authors documented the impact of welfare reform
on Scotland as a whole and on its constituent local authorities. This new report
extends the analysis down to ward level.
Revised figures confirm that when the reforms have come into full effect they will
take more than £1.6bn a year out of the Scottish economy. This is equivalent to
around £460 a year for every adult of working age.
Although the financial loss is large, the scale of the loss in Scotland is broadly on
a par with the GB average.
At the level of electoral wards, there is a roughly four-fold difference between the
worst and least hit communities. Calton ward in Glasgow is hit hardest (£880 per
adult of working age per year). St Andrews in Fife (£180) escapes lightest.
A dozen Glasgow wards figure prominently among the list of worst affected
places in Scotland.
There is a clear relationship between the extent of deprivation and the scale of
the financial loss. The most deprived wards are hit hardest.
The reforms to incapacity benefits are resulting in the biggest financial losses,
particularly in more disadvantaged communities.
Some households and individuals are hit by several different elements of the
reforms. Incapacity claimants, for example, will often also lose out because of
the reforms to Disability Living Allowance and may lose from reforms to Housing
Benefit if they live in the private rented sector or if they have grown-up children
still living at home. They are also hit by the failure to uprate benefits with
inflation.
In the absence of a big shift into employment, a key effect of the welfare reforms
will be to widen the gaps in income between communities.

Welfare Reform Committee, 5th Report, 2014 (Session 4)
4
THE LOCAL IMPACT OF WELFARE REFORM Scope and purpose of the report
The Westminster Government is implementing welfare reforms that apply to all parts of the UK. The impact of the reforms, however, varies enormously from place to place, not least because benefit claimants are so unevenly spread across Britain. This report looks specifically at the impact of the reforms within Scotland at the level of electoral wards. This fine-grain picture is important because there is large variation in the impact not only between local authorities but also between individual neighbourhoods and communities. The report also considers the impact on different types of households and individuals. In April 2013 the Scottish Parliament published a report by the present authors which for the first time documented the impact of the reforms across Scotland as a whole and in each of its 32 constituent local authorities1. The new report builds directly on the foundations of this earlier study. As in the 2013 report, all the figures presented in the report are estimates but in every case they are deeply rooted in official statistics – for example in the Treasury’s own estimates of the financial savings, the Westminster government’s Impact Assessments, and benefit claimant data. Welfare reform is a deeply contentious issue and in documenting the impacts the report does not attempt to comment on the merits of the reforms. However, it is important that the impact on different places is fully exposed because this is a key dimension that is too often overlooked. The impact on different places is also one of the yardsticks by which the reforms should be judged. The welfare reforms
The figures in the 2013 report covered all the major welfare reforms that have been underway in Scotland since 2010. Some of these reforms are now fully in place, others are currently underway and a small number still have a long way to run before coming to full fruition. The reforms covered by the present report are: Housing Benefit – Local Housing Allowance
Changes to the rules governing assistance with the cost of housing for low-income households in the private rented sector. The new rules apply to rent levels, ‘excess’ payments, property size, age limits for sole occupancy, and indexation for inflation.
1 C Beatty and S Fothergill (2013) The Impact of Welfare Reform on Scotland, Scottish Parliament, Edinburgh. The research on which the report was based was co-funded by the Scottish Parliament, the Financial Times, and Sheffield Hallam University.

Welfare Reform Committee, 5th Report, 2014 (Session 4)
5
Non-dependant deductions Increases in the deductions from Housing Benefit, Council Tax Benefit and other income-based benefits to reflect the contribution that non-dependant household members are expected to make towards the household’s housing costs Household benefit cap New ceiling on total payments per household, applying to the sum of a wide range of benefits for working age claimants Disability Living Allowance Replacement of DLA by Personal Independence Payments (PIP), including more stringent and frequent medical tests, as the basis for financial support to help offset the additional costs faced by individuals with disabilities Incapacity benefits Replacement of Incapacity Benefit and related benefits by Employment and Support Allowance (ESA), with more stringent medical tests, greater conditionality and time-limiting of non-means tested entitlement for all but the most severely ill or disabled Child Benefit Three-year freeze, and withdrawal of benefit from households including a higher earner Tax Credits Reductions in payment rates and eligibility for Child Tax Credit and Working Tax Credit, paid to lower and middle income households 1 per cent up-rating Reduction in annual up-rating of value of most working-age benefits
A fuller description of each of these reforms, including the timing of implementation and the expected savings to the Exchequer, is contained in the appendix to the report. The vast majority of these welfare reforms have been initiated by the present Coalition government in Westminster, notably but not exclusively through the Welfare Reform Act 2012. Some of the incapacity benefit reforms, however, are Labour measures that pre-date the 2010 general election but are only now taking full effect. They have been included here, alongside the Coalition’s reforms, to provide a comprehensive view of the impact of the reforms that are currently underway. In the Scottish context, two important omissions from the list are worth noting:
Council Tax Benefit. In collaboration with Scottish local authorities, the Scottish Government has chosen not to pass on to claimants the Westminster Government’s 10 per cent cut in the value of Council Tax Benefit payments.

Welfare Reform Committee, 5th Report, 2014 (Session 4)
6
Housing Benefit: under-occupation in the social rented sector. This reform, better known as the ‘Bedroom Tax’, is effectively not being implemented in Scotland from 2014-15 as a result of the decision to make available sufficient funding for Discretionary Housing Payments to fully offset the reduction in Housing Benefit.
The ‘Bedroom Tax’ was included in the Scottish figures published in the 2013 report but, in the light of the new arrangements, is not included here. The ‘Bedroom Tax’ and the reductions in Council Tax Benefit continue to be included in the comparative figures for the other parts of the UK where they have been implemented. Three further omissions are worth noting:
Universal Credit. This is scheduled to replace just about all means-tested working age benefits and is arguably the most ambitious reform of all. The introduction of Universal Credit is however distinctly different from the other reforms. Unlike the others, it is not expected to lead directly to a reduction in welfare spending and is better understood as a repackaging of existing benefits that for the first time introduces a consistent benefit withdrawal rate, but the rules governing eligibility are essentially carried over from the existing benefits it replaces.
Income Support for lone parents. The qualifying age of the youngest child
has been reduced from under 7 to under 5. The effect is to transfer the lone parent from Income Support to Jobseeker’s Allowance at the same payment
rate.
RPI to CPI for benefits up-rating. This was introduced from 2011-12 but is really part of a much wider accounting reform, including for example all public service pensions.
When fully implemented, the welfare reforms covered in this report, including those that no longer apply to Scotland, are expected to save the UK Treasury almost £19bn a year. Measuring the impacts The data sources and methods underpinning the estimates are set out in full in the appendix to the report. In essence, this new report takes the estimates for local authorities published in the 2013 report for the Scottish Parliament and drills them down to the local, ward level. The 2013 estimates by authority have been modified only to remove the impact of the ‘Bedroom Tax’ and to take account of new data on the impact of the household benefit cap.

Welfare Reform Committee, 5th Report, 2014 (Session 4)
7
The Westminster Government has in most cases not produced estimates of the impact of the reforms by local authority, let alone by ward. It does however publish a range of statistics that allow the local impact to be estimated. This information includes:
HM Treasury estimates of the overall financial saving arising from each element of the reforms, published in the Budget or in the government’s
Autumn Statement. The estimates in the report are fully consistent with these Treasury figures2.
The Impact Assessment and (where available) Equality Impact Assessment
that Westminster departments publish for each element of the reforms3
Benefit claimant numbers and expenditure, by local authority, published by DWP and HMRC
Additional official statistics – for example on median earnings by local
authority to help calibrate the impact of the withdrawal of Child Benefit
DWP evidence from pilot schemes, in the context of the incapacity benefit reforms
The figures the report presents show the impact when the reforms have come into full effect. This is important because some of the reforms, particularly those affecting incapacity and disability benefits, are being implemented in stages over a number of years. In most cases, the figures show the expected impact in the 2014-15 financial year4. In comparing the impact on different areas, the report looks in particular at the financial loss per adult of working age5. A focus on adults of working age (16-64) is appropriate because the welfare reforms impact almost exclusively on this group. By contrast, benefit claimants of pensionable age are largely unaffected6. Some of the welfare reforms focus on households – the reforms to Housing Benefit for example. Others – the reforms to incapacity benefits for example – are about the
2 The GB-wide estimates of the impact of the reforms to incapacity benefits, DLA and Council Tax Benefit, the Household Cap and the ‘Bedroom Tax’ are subject to further detailed adjustment – see appendix. 3 Following official practice in the Impact Assessments, the estimates in the present report make no allowance for the small share of the financial impact falling on Northern Ireland. The effect is to slightly overstate the impact on Scotland and other parts of Great Britain, bearing in mind that Northern Ireland accounts for 3 per cent of the UK population. 4 The exceptions are the DLA reforms, which will not impact fully until 2017-18, and the wider application of means testing to ESA and the 1 per cent up-rating, both of which do not impact fully until 2015-16. 5 From the 2011 Census of Population. 6 The main exceptions are a small minority (around 5%) of Housing Benefit recipients in the private rented sector, affected by the reforms to Local Housing Allowance, and a small number of adults of pensionable age who receive Child Benefit.

Welfare Reform Committee, 5th Report, 2014 (Session 4)
8
entitlement of individuals. Additionally, several of the reforms impact simultaneously on the same households and/or individuals. It is possible to estimate how many people are affected by each element of the reforms, and how much they lose. The financial losses can be added together but to avoid counting the same people twice the number of households/individuals affected cannot be summed to an overall total. Finally, in estimating the impact of the welfare reforms the report holds all other factors constant. What this means in practice is that it makes no assumptions about the growth of the UK and Scottish economies, or about future levels of employment and unemployment. Westminster ministers take the view that the welfare reforms will increase the financial incentives to take up employment and because more people will look for work more people will find work. This assumes, of course, that extra labour supply leads to extra labour demand from employers. Whether labour markets really do work in this way, especially in places where the local economy is relatively weak, is a moot point and one that many economists would contest. Some individuals will undoubtedly find work to compensate for the loss of benefit income but whether the overall level of employment will be any higher as a result is questionable. More often than not, they will simply fill vacancies that would have gone to other jobseekers. The figures in this report (and its 2013 predecessor) therefore do not assume that loss of income from benefits will wholly or in part be replaced by additional income from employment. The impact on Scotland as a whole To provide a context for the local figures, Table 1 shows the estimated impact of the welfare reforms on Scotland as a whole. These figures are taken from the 2013 report but have been up-dated to incorporate new data on the household benefit cap and now exclude the ‘Bedroom Tax’, so in detail they differ a little from those previously published7 Overall, when the reforms have come into full effect it is estimated that they will take more than £1.6bn a year out of the Scottish economy, or around £460 a year for every adult of working age. These revised estimates are £60m, and £20 a year per adult of working age, down on the figures in the 2013 report. The difference is attributable to the measures to avert the ‘Bedroom Tax’ (worth around £50m a year to claimants in Scotland) and also to the smaller-than-expected numbers impacted by the household benefit cap. The individual welfare reforms vary greatly in the scale of their impact, in the number of individuals or households affected, and in the intensity of the financial loss imposed on those affected. In Scotland, and indeed in the rest of the UK, the biggest financial impact comes from the reform of incapacity benefits – an estimated loss in Scotland of £500m a year. Changes to Tax Credits and the 1 per cent up-
7 The figures also take more accurate account of DLA claimants who experience a partial loss of benefit as a result of the changeover to PIP.

Table 1: Impact of welfare reform on Scotland (revised figures)
No of h'holds/individuals adversely
affected
Estimated loss
£m p.a.
Average loss per affected h'hold/indiv
£ p.a.
No. of h'holds/indiv
affected per 10,000
Loss per working age adult £ p.a.
Incapacity benefits(1)(3) 144,000 500 3,480 410 145 Tax Credits 372,000 300 810 1,600 85 1 per cent uprating(3) n.a. 290 n.a. n.a. 85 Child Benefit 621,000 225 360 2,660 65 Disability Living
Allowance (1)(2) 106,000 165 1,560 310 50
Housing Benefit: LHA 80,000 80 1,010 340 25 Non-dependant
deductions 28,000 30 1,130 120 10
Household benefit cap 1,900 10 4,600 <10 <5
Total n.a. 1,600 n.a. n.a. 460
(1) Individuals affected; all other data refers to households (2) By 2017/18 (3) By 2015/16 All other impacts by 2014-15 Source: Sheffield Hallam estimates based on official data
Welfare Reform Committee, 5th Report, 2014 (Session 4)
9

Welfare Reform Committee, 5th Report, 2014 (Session 4)
10
rating of most working-age benefits from April 2013 also account for substantial sums - £300m and £290m respectively. Child Benefit changes affect the largest number of households – more than 600,000 in Scotland. This is because the three-year freeze in Child Benefit rates up to April 2014 (instead of up-rating with inflation) impacted on all recipients. The household benefit cap, by contrast, impacts on relatively few households in Scotland – just 1,900 according to the latest figures – but the average financial loss for each of these households is relatively large. As the 2013 report noted, the overall scale of the financial loss in Scotland (now estimated to be £460 per adult of working age per year) is more or less on a par with the GB average (£470). Scotland is hit harder than South East England (£370) but less than Wales (£550), London (£520) or North East England (£560)8. It should not escape note, however, that the impact in Scotland would have been around £35 a year higher (i.e. around £495 per adult of working age) if the Scottish Government had not struck a deal with local authorities to avoid passing on the cut in Council Tax Benefit or put in place arrangements to defray the impact of the ‘Bedroom Tax’. The financial burden of these welfare reforms is being borne by public sector budgets in Scotland rather than by benefit claimants. The impact by local authority Table 2 shows the estimated overall impact by local authority of the reforms. Again, this is a modified and up-dated version of the figures published in the 2013 report and the figures now exclude the ‘Bedroom Tax’. Tables in the appendix to the 2013 report presented detailed figures for each authority, benefit by benefit. The biggest impact, in absolute terms and on a per capita basis, falls on Glasgow where the welfare reforms are estimated to result in a loss of £259m a year, equivalent to £620 a year for every adult of working age in the city. On per capita basis a number of other older industrial areas are also hit hard. These include Inverclyde, Dundee, West Dunbartonshire, North Lanarkshire, Clackmannanshire and North and East Ayrshire. By contrast, the financial loss to Edinburgh – an estimated £130m, or £390 per adult of working age – is significantly smaller. The parts of Scotland that are least affected by the reforms are in North East Scotland, Orkney and Shetland, and two relatively affluent districts (East Renfrewshire and East Dunbartonshire) in the central belt. However, it is worth noting that even in some of these local authorities the absolute losses remain large. Aberdeen, for example, can still expect to lose £50m a year. 8 The figures quoted here for GB, Wales, London, South East and North East are from the 2013 report have not been revised to take account of new data on the impact of the ‘Bedroom Tax’ and household benefit cap.

Welfare Reform Committee, 5th Report, 2014 (Session 4)
11
Table 2: Overall impact of welfare reform on Scotland, by local authority (revised figures)
Estimated loss
£m p.a.
Loss per working age
adult £ p.a.
Glasgow 259 620 Inverclyde 32 600 West Dunbartonshire 35 580 Dundee 56 560 North Ayrshire 49 560 North Lanarkshire 119 540 East Ayrshire 42 520 Clackmannanshire 18 520 Renfrewshire 58 510 South Lanarkshire 101 490 South Ayrshire 34 490 West Lothian 55 470 Fife 109 460 Dumfries and Galloway
43 460 Midlothian 25 460 Falkirk 46 450 Argyll and Bute 23 420 East Lothian 26 410 Highland 59 400 Angus 29 400 Edinburgh 130 390 Scottish Borders 28 390 Perth and Kinross 35 380 Eilean Siar 6 370 Stirling 22 370 East Renfrewshire 20 350 Moray 20 340 Orkney Islands 5 340 East Dunbartonshire 22 330 Aberdeen 50 310 Aberdeenshire 48 290 Shetland Islands 4 270
Scotland 1,600 460
All impacts by 2014-15 except DLA by 2017/18, incapacity benefits and 1% up-rating by 2015/16 Source: Sheffield Hallam estimates based on official data

Welfare Reform Committee, 5th Report, 2014 (Session 4)
12
As the 2013 report explained, there are no surprises in this geography. It is to be expected that welfare reforms will hit hardest in the places where welfare claimants are concentrated, which tend to be in the poorest areas with the highest rates of worklessness. At the level of individual local authorities, Glasgow ranks 23rd, out of 379 districts across Britain in terms of the financial loss per working age adult9. This places Glasgow below Liverpool (8th) but above Birmingham (43rd) and Manchester (45th)10. The worst-hit place in Britain is Blackpool in North West England, at an estimated £910 a year per adult of working age, compared to £620 a year in Glasgow. The overall scale of the financial loss in Glasgow – an estimated £259m a year when the reforms are fully implemented – is second only in Britain to Birmingham (£419m)11, which has a substantially larger population. The impact by ward The new, local estimates in the present report are all for electoral wards. There are 353 of these across Scotland as a whole. Scottish wards have an average population of 15,000 but tend to be larger (in terms of population) in cities than in rural areas. Wards are the lowest spatial scale at which reliable estimates of the impact of welfare reform can be generated. At a finer geographical scale – in Scotland the option would be datazones – there is plenty of data to assist the estimation process but the relatively small number of residents in each zone – between 500 and 1,000 – means that the resulting figures would be subject to a wide margin of error. Electoral wards have the added advantage of being recognisable units, often familiar to politicians, administrators and residents. The estimates for wards presented here are for the overall financial loss, per adult of working age per year when the reforms have come to full fruition. These overall estimates have been built up from benefit-by-benefit calculations. The appendix to the report presents maps and statistics by ward for each of Scotland’s 32 local authorities. Table 3 list the wards with the highest and lowest financial losses. Unsurprisingly, the size of the gap between the ‘worst’ and ‘best’ wards is greater than between local authorities. Whereas the welfare reforms hit Glasgow rather more than twice as hard (per adult of working age) as Shetland, the least affected authority in Scotland, the worst affected wards are hit around four times harder than the least affected. The extremes are Calton. in Glasgow, with an estimated financial loss of £880 a year per adult of working age, and St Andrews, in Fife, where the loss is just £180 a year.
9 See C Beatty and S Fothergill (2013) Hitting the Poorest Places Hardest: the local and regional impact of welfare reform, CRESR, Sheffield Hallam University. 10 Comparisons based on unrevised 2013 estimates. 11 Unrevised 2013 estimate.

Welfare Reform Committee, 5th Report, 2014 (Session 4)
13
Table 3: Wards with the highest and lowest financial loss arising from welfare reform
Authority Ward
Overallfinancial loss per adult of working age £ per year
WORST AFFECTED 20 WARDS
Glasgow Calton 880 Glasgow Springburn 780 Glasgow North East 750 Glasgow Drumchapel/Anniesland 740 Glasgow Southside Central 730 Dundee East End 730 Glasgow Shettleston 720 Fife Buckhaven, Methil and Wemyss
Villages 700
Glasgow Canal 700 Inverclyde Inverclyde East Central 690 Glasgow Garscadden/Scotstounhill 690 Glasgow Govan 690 Glasgow Ballieston 680 Glasgow East Centre 680 Dundee North East 670 Fife The Lochs 670 Glasgow Linn 670 Renfrewshire Paisley North West 660 Inverclyde Inverclyde North 660 West Dunbarton Clydebank Central 660 LEAST AFFECTED 10 WARDS
Edinburgh Meadows/Morningside 220 Aberdeenshire Banchory and Mid Deeside 220 Aberdeen Bridge of Don 220 East Renfrewshire
Netherlee, Stamperland and Williamwood
220
East Renfrewshire
Newton Mearns South 220
Stirling Dunblane and Bridge of Allan 210 Aberdeenshire East Garioch 210 Aberdeenshire Westhill and District 210 Aberdeen Hazlehead/Ashley/Queens Cross 200 Fife St Andrews 180
Source: Sheffield Hallam estimates based on official data

Welfare Reform Committee, 5th Report, 2014 (Session 4)
14
Figure 1: Relationship between impact of welfare reform and deprivation, by ward
Sources: Sheffield Hallam estimates and Scottish Indices of Deprivation 2012

Welfare Reform Committee, 5th Report, 2014 (Session 4)
15
The list of hardest-hit wards is dominated by Glasgow, which accounts for 12 of the worst-hit 20. Other parts of older industrial Scotland also figure on this list. By contrast, 5 of the 10 wards that escape most lightly are in Aberdeen or Aberdeenshire. The 2013 report demonstrated that at the level of local authorities there is a clear relationship between the financial loss arising from welfare reform and the level of deprivation: as a general rule, the more deprived the local authority the greater the financial loss. Figure 1 confirms this relationship at the level of wards: the higher the average deprivation score12 of the ward, the greater the estimated loss per adult of working age. The source of the financial loss varies between the richest and poorest wards. Because there are relatively large numbers of children in nearly all areas, the freeze in the value of Child Benefit impacts more or less everywhere, but in the most affluent areas the loss is compounded by the withdrawal of Child Benefit from higher earners. As a result, in the most affluent wards the reduction in Child Benefit can account for a quarter or a third of the overall financial loss. By contrast, the really big financial losses in the poorest wards arise from the reforms to incapacity benefits. In Calton ward in Glasgow for example, the estimated loss from the incapacity benefit changes alone (£350 a year per adult of working age) is almost double the financial loss from the whole welfare reform package in St Andrews. In the poorest wards, like Calton, this loss is compounded by further big losses arising from DLA reform, reductions in Tax Credits and below-inflation up-rating. The measures to offset the ‘Bedroom Tax’ have gone someway towards narrowing the differences between the wards worst and least affected by welfare reform. In the worst affected wards, averting the impact of the ‘Bedroom Tax’ has reduced the loss by around £30 per adult of working age per year. This reflects the high proportion of social housing in these wards and high numbers claiming Hosing Benefit. By contrast, the wards least affected by welfare reform generally have little social housing and low claimant numbers, so the arrangements to avert the ‘Bedroom Tax’ have little impact there. What should still be noted is that even in mid-2014 much of the financial loss in the poorest wards is still in the pipeline. The incapacity benefit reforms will not come to full fruition until 2015-16, when means-testing for ESA claimants in the Work Related Activity Group – one of the very largest of all the welfare reforms, anticipated to save the Treasury six times as much as the ‘Bedroom Tax’ – will finally kick in for many. The changeover from DLA to PIP has barely started and is not anticipated to be completed until 2017-18, and the below-inflation up-rating still has another year to run.
12 The deprivation score for each ward is a population-weighted average of the scores for each of its constituent datazones.

Welfare Reform Committee, 5th Report, 2014 (Session 4)
16
As a rule of thumb, it would be reasonable to assume that in the poorest wards around 40 per cent of the overall financial loss arising from welfare reform has, in mid-2014, still to make itself felt. The impact on households and individuals The welfare reforms impact on a wide range of households and individuals, and not just on those on out-of-work benefits. As a guide, Table 4 identifies the types of households and individuals most affected by each of the reforms. This list draws on information in the Westminster government’s Impact Assessments but also on a wider understanding of which groups claim which benefits. A key point about the welfare reforms, however, is that they often impact simultaneously on the same individuals and households. This point is best illustrated by considering incapacity benefit claimants. This very large group of out-of-work men and women tends to be older (IB/ESA claimant rates increase with age) and most have previously worked in low-grade manual jobs. They tend to be concentrated in the most difficult local labour markets, where age, low skills and poor health severely limit their chances of finding work. Among incapacity claimants, the group most exposed to loss of benefit are those with less severe health problems or disabilities. They run the risk of being found ‘fit for work’ at the point they undergo the new medical assessment or, if they remain on ESA in the Work Related Activity Group, of losing their entitlement to non-means tested benefit after a year. This group of incapacity claimants is also most exposed to the loss of DLA as the changeover to PIP takes place. At present, around half of all incapacity claimants also claim DLA. In theory, the most severely disabled should retain entitlement to PIP, meaning that the reductions in eligibility that the Westminster government anticipates will hit those with less severe health problems or disabilities. Many of these will be the same people who are having their entitlement to incapacity benefits removed or reduced. Added to this, the age and income level of incapacity claimants means that they are also exposed to reductions in Housing Benefit. Many are tenants in the social rented sector and, if their children have grown up and moved away, they would have been hit by the ‘Bedroom Tax’. This impact has been averted in Scotland, but they may still face reductions in Housing Benefit if they live in the private rented sector. And, if their grown-up children are still living at home the new, larger non-dependant deductions come into play. The failure to uprate the value of benefits with inflation adds a further twist to their financial difficulties. In Scotland a still further financial hit on this group has only been averted by the decision not to pass on the claimants the Westminster Government’s reduction in funding for Council Tax Benefit.

Welfare Reform Committee, 5th Report, 2014 (Session 4)
17
Table 4: Groups typically most affected by individual welfare reforms
HOUSING BENEFIT: LOCAL HOUSING ALLOWANCE
Low income households, mostly of working age, in the private rented sector Under-35s, often single men, in the private rented sector Families with large numbers of children in the private rented sector
NON-DEPENDENT DEDUCTIONS
Low-income households with grown-up children living at home HOUSEHOLD BENEFIT CAP
Large out-of-work families in high rent areas DISABILITY LIVING ALLOWANCE
Less severely disabled of working age, mostly older, mostly out-of-work INCAPACITY BENEFITS
Out-of-work, mainly older adults with ill health or disability, except the most severely ill or disabled
CHILD BENEFIT
All households with children (a little) Households with higher earners (a lot)
TAX CREDITS
Low-to-middle income families with children, including workless households Part-time workers on less than 24hrs a week
1 PER CENT UP-RATING
Everyone on the main working age benefits (JSA, IB/ESA, IS, HB(LHA), Tax Credits)
Source: Impact Assessments
The effect is that many individuals and households face a loss of benefits from more than one source. Estimating just how much particular groups will lose in total is not easy and this is not an exercise the Westminster government has so far undertaken. Indeed, in the absence of this information it is impossible at this stage to provide an estimate of the total number of individuals or households adversely affected by the reforms, in Scotland or the rest of the UK13. What should nevertheless be noted, from the table listing the groups most affected by the welfare reforms, is the frequency with which a number of descriptive terms appear – ‘older’, out-of-work’, ‘low-income’, ‘sick and/or disabled’. These give a fair indication of who is being hit hardest by the welfare reforms.
13 The Sheffield Hallam team does however expect to generate preliminary estimates, later in 2014, drawing in particular on the Westminster government’s Family Resources Survey.

Welfare Reform Committee, 5th Report, 2014 (Session 4)
18
Our 2013 report noted that Scotland has not been singled out as the target for welfare reform, and that the financial loss in Scotland is close to the GB average. The slightly revised figures presented in this new report do not alter this assessment. But just as the 2013 report identified big variations in the impact between local authorities within Scotland, the new report shows that there are even larger variations between wards. This is not unexpected because the socio-economic differences between small areas such as wards are generally larger than between whole authorities. Nevertheless, it is striking that across Scotland the wards facing the greatest financial loss (per adult of working age) are sometimes losing four times as much as the wards losing the least. Moreover, there is a clear pattern to the losses, with Scotland’s most deprived wards being hit hardest. Westminster ministers are keen to claim that the welfare reforms will increase the incentive to work and will therefore lead to higher employment. As we noted, this is a bold assumption based on a questionable view of how the labour market works, especially in less prosperous areas. If Westminster ministers are not proved right, the evidence in this report suggests that the gaps in income and living standards between communities in Scotland are set to widen.
Concluding remarks

Welfare Reform Committee, 5th Report, 2014 (Session 4)
19
APPENDIX 1: Impact of welfare reform by electoral ward Aberdeen
Contains NRS data © Crown copyright and database right [2010] Contains Ordnance Survey data © Crown copyright and database right [2010]
Ward
Loss per working age
adult £ p.a.
Airyhall/Broomhill/Garthdee 260 Bridge of Don 220 Dyce/Bucksburn/Danestone 260 George St/Harbour 240 Hazlehead/Ashley/Queens Cross 200 Hilton/Stockethill 440 Kincorth/Loirston 310 Kingswells/Sheddocksley 390 Lower Deeside 240 Midstocket/Rosemount 270 Northfield 560 Tillydrone/Seaton/Old Aberdeen 350 Torry/Ferryhill 360
Source: Sheffield Hallam estimates based on official data

Welfare Reform Committee, 5th Report, 2014 (Session 4)
20
Aberdeenshire
Contains NRS data © Crown copyright and database right [2010] Contains Ordnance Survey data © Crown copyright and database right [2010]
Ward
Loss per working age
adult £ p.a.
Aboyne, Upper Deeside and Donside 280 Banchory and Mid Deeside 220 Banff and District 400 Central Buchan 320 East Garioch 210 Ellon and District 230 Fraserburgh and District 420 Huntly, Strathbogie and Howe of Alford 320 Inverurie and District 270 Mearns 290 Mid Formartine 250 North Kincardine 230 Peterhead North and Rattray 410 Peterhead South and Cruden 350 Stonehaven and Lower Deeside 250 Troup 370 Turriff and District 280 West Garioch 250 Westhill and District 210
Source: Sheffield Hallam estimates based on official data

Welfare Reform Committee, 5th Report, 2014 (Session 4)
21
Angus
Contains NRS data © Crown copyright and database right [2010] Contains Ordnance Survey data © Crown copyright and database right [2010]
Ward
Loss per working age
adult £ p.a.
Arbroath East and Lunan 480 Arbroath West and Letham 420 Brechin and Edzell 410 Carnoustie and District 360 Forfar and District 430 Kirriemuir and Dean 360 Monifeith and Sidlaw 300 Montrose and District 390
Source: Sheffield Hallam estimates based on official data

Welfare Reform Committee, 5th Report, 2014 (Session 4)
22
Argyll and Bute
Contains NRS data © Crown copyright and database right [2010] Contains Ordnance Survey data © Crown copyright and database right [2010]
Ward
Loss per working age
adult £ p.a.
Cowal 510 Dunoon 560 Helensburgh and Lomond South 330 Helensburgh Central 440 Isle of Bute 580 Kintyre and the Islands 440 Lomond North 310 Mid Argyll 380 Oban North and Lorn 330 Oban South and the Isles 400 South Kintyre 490
Source: Sheffield Hallam estimates based on official data

Welfare Reform Committee, 5th Report, 2014 (Session 4)
23
Clackmannanshire
Contains NRS data © Crown copyright and database right [2010] Contains Ordnance Survey data © Crown copyright and database right [2010]
Ward
Loss per working age
adult £ p.a.
Clackmannanshire Central 620 Clackmannanshire East 470 Clackmannanshire North 500 Clackmannanshire South 550 Clackmannanshire West 480
Source: Sheffield Hallam estimates based on official data

Welfare Reform Committee, 5th Report, 2014 (Session 4)
24
Dumfries and Galloway
Contains NRS data © Crown copyright and database right [2010] Contains Ordnance Survey data © Crown copyright and database right [2010]
Ward
Loss per working
age adult £ p.a.
Abbey 440 Annandale East and Eskdale 410 Annandale North 400 Annandale South 450 Castle Douglas and Glenkens 400 Dee 450 Lochar 370 Mid and Upper Nithsdale 490 Mid Galloway 540 Nith 420 North West Dumfries 530 Stranraer and North Rhins 580 Wigtown West 550
Source: Sheffield Hallam estimates based on official data

Welfare Reform Committee, 5th Report, 2014 (Session 4)
25
Dundee
Contains NRS data © Crown copyright and database right [2010] Contains Ordnance Survey data © Crown copyright and database right [2010]
Ward
Loss per working age
adult £ p.a.
Coldside 600 East End 730 Lochee 660 Maryfield 600 North East 670 Strathmartine 580 The Ferry 390 West End 360
Source: Sheffield Hallam estimates based on official data

Welfare Reform Committee, 5th Report, 2014 (Session 4)
26
East Ayrshire
Contains NRS data © Crown copyright and database right [2010] Contains Ordnance Survey data © Crown copyright and database right [2010]
Ward
Loss per working age
adult £ p.a.
Annick 430 Ballochmyle 550 Cumnock and New Cumnock 550 Doon Valley 640 Irvine Valley 480 Kilmarnock East and Hurlford 500 Kilmarnock North 430 Kilmarnock South 640 Kilmarnock West and Crosshouse 520
Source: Sheffield Hallam estimates based on official data

Welfare Reform Committee, 5th Report, 2014 (Session 4)
27
East Dunbartonshire
Contains NRS data © Crown copyright and database right [2010] Contains Ordnance Survey data © Crown copyright and database right [2010]
Ward
Loss per working
age adult £ p.a.
Bearsden North 240 Bearsden South 240 Bishopbriggs North and Torrance 280 Bishopbriggs South 400 Campsie and Kirkintilloch North 380 Kirkintilloch East and Twechar 530 Lenzie and Kirkintilloch South 310 Milngavie 290
Source: Sheffield Hallam estimates based on official data
Welfare Reform Committee, 5th Report, 2014 (Session 4)
28
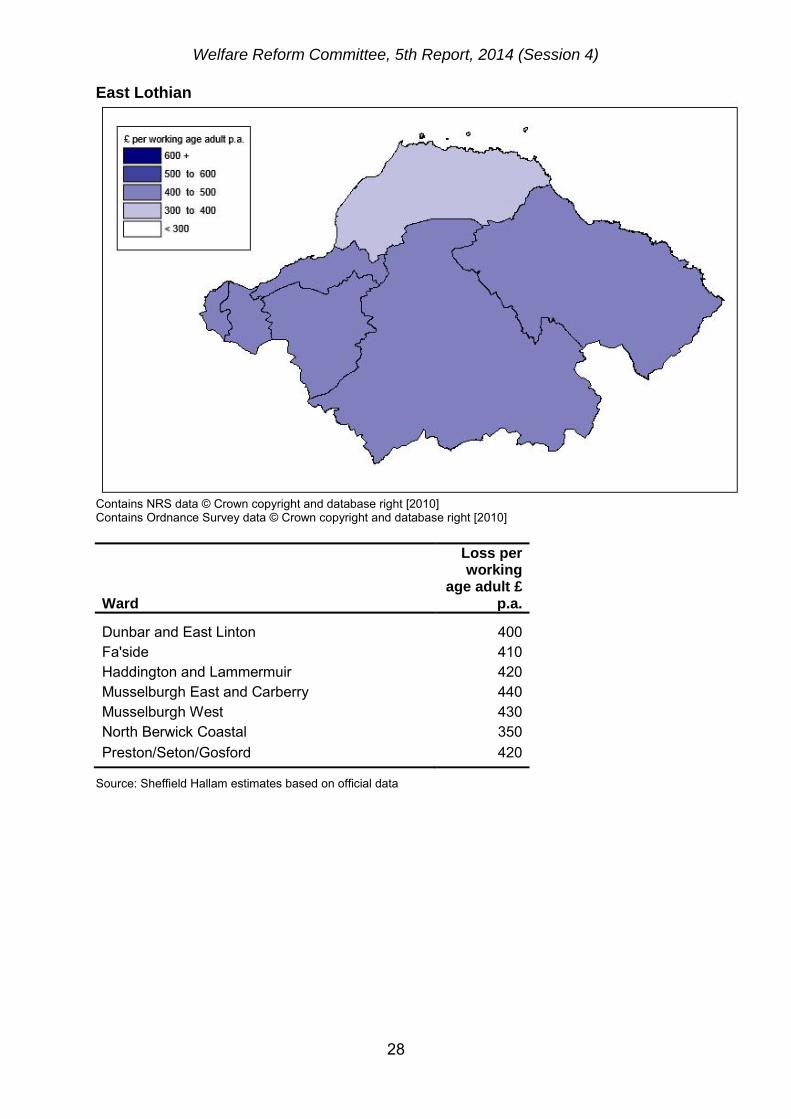
East Lothian
Contains NRS data © Crown copyright and database right [2010] Contains Ordnance Survey data © Crown copyright and database right [2010]
Ward
Loss per working
age adult £ p.a.
Dunbar and East Linton 400 Fa'side 410 Haddington and Lammermuir 420 Musselburgh East and Carberry 440 Musselburgh West 430 North Berwick Coastal 350 Preston/Seton/Gosford 420
Source: Sheffield Hallam estimates based on official data

Welfare Reform Committee, 5th Report, 2014 (Session 4)
29
East Renfrewshire
Contains NRS data © Crown copyright and database right [2010] Contains Ordnance Survey data © Crown copyright and database right [2010]
Ward
Loss per working age
adult £ p.a.
Barrhead 560 Busby, Clarkston and Eaglesham 270 Giffnock and Thornliebank 380 Neilston, Uplawmoor and Newton Mearns North 350 Netherlee, Stamperland and Williamwood 220 Newton Mearns South 220
Source: Sheffield Hallam estimates based on official data
Welfare Reform Committee, 5th Report, 2014 (Session 4)
30
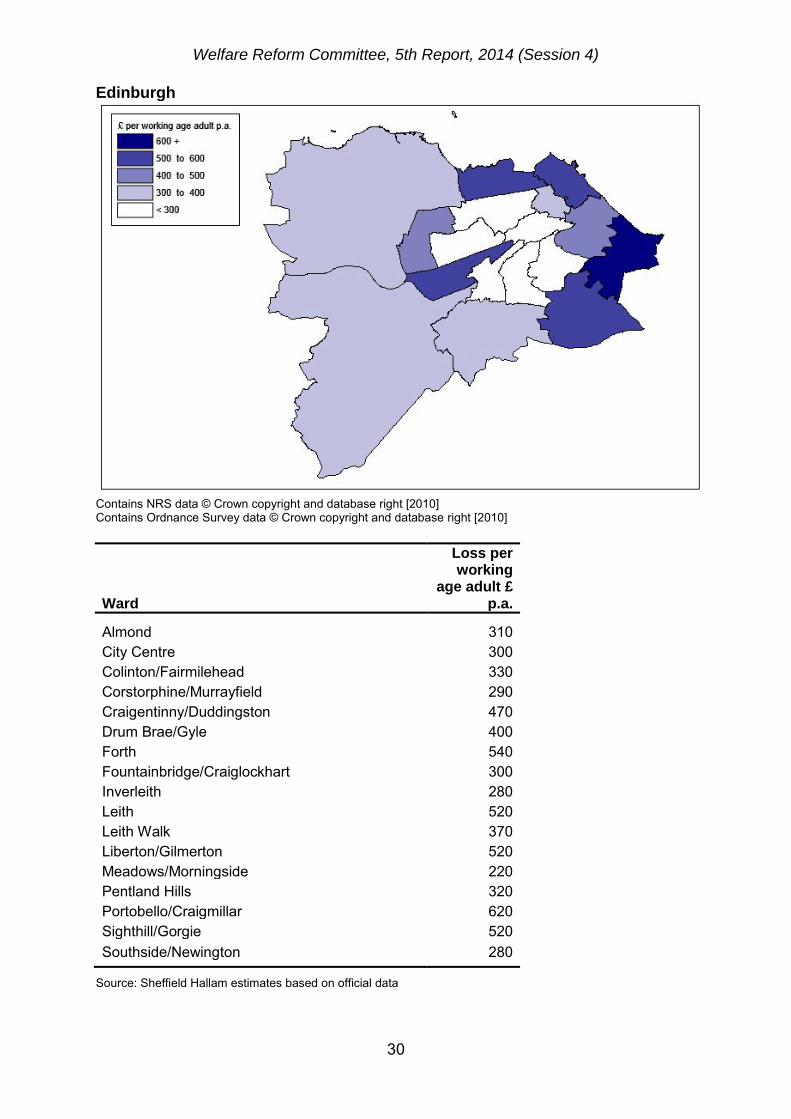
Edinburgh
Contains NRS data © Crown copyright and database right [2010] Contains Ordnance Survey data © Crown copyright and database right [2010]
Ward
Loss per working
age adult £ p.a.
Almond 310 City Centre 300 Colinton/Fairmilehead 330 Corstorphine/Murrayfield 290 Craigentinny/Duddingston 470 Drum Brae/Gyle 400 Forth 540 Fountainbridge/Craiglockhart 300 Inverleith 280 Leith 520 Leith Walk 370 Liberton/Gilmerton 520 Meadows/Morningside 220 Pentland Hills 320 Portobello/Craigmillar 620 Sighthill/Gorgie 520 Southside/Newington 280
Source: Sheffield Hallam estimates based on official data

Welfare Reform Committee, 5th Report, 2014 (Session 4)
31
Eilean Siar
Contains NRS data © Crown copyright and database right [2010] Contains Ordnance Survey data © Crown copyright and database right [2010]
Ward
Loss per working
age adult £ p.a.
An Taobh Siar agus Nis 390 Barraigh, Bhatarsaigh, Eirisgeigh agus Uibhist a Deas 360 Beinn na Foghla agus Uibhist a Tuath 290 Loch a Tuath 370 Na Hearadh agus Ceann a Deas nan Loch 500 Sgire an Rubha 310 Sgir'Uige agus Ceann a Tuath nan Loch 270 Steòrnabhagh a Deas 460 Steòrnabhagh a Tuath 410
Source: Sheffield Hallam estimates based on official data

Welfare Reform Committee, 5th Report, 2014 (Session 4)
32
Falkirk
Contains NRS data © Crown copyright and database right [2010] Contains Ordnance Survey data © Crown copyright and database right [2010]
Ward
Loss per working
age adult £ p.a.
Bo'ness and Blackness 410 Bonnybridge and Larbert 400 Carse, Kinnaird and Tryst 390 Denny and Banknock 410 Falkirk North 490 Falkirk South 560 Grangemouth 490 Lower Braes 440 Upper Braes 470
Source: Sheffield Hallam estimates based on official data

Welfare Reform Committee, 5th Report, 2014 (Session 4)
33
Fife
Contains NRS data © Crown copyright and database right [2010] Contains Ordnance Survey data © Crown copyright and database right [2010]
Ward
Loss per working age
adult £ p.a.
Buckhaven, Methil and Wemyss Villages 700 Burntisland, Kinghorn and Western Kirkcaldy 420 Cowdenbeath 500 Cupar 390 Dunfermline Central 380 Dunfermline North 510 Dunfermline South 380 East Neuk and Landward 420 Glenrothes Central and Thornton 520 Glenrothes North, Leslie and Markinch 460 Glenrothes West and Kinglassie 520 Howe of Fife and Tay Coast 370 Inverkeithing and Dalgety Bay 350 Kirkcaldy Central 570 Kirkcaldy East 590 Kirkcaldy North 440 Leven, Kennoway and Largo 520 Lochgelly and Cardenden 650 Rosyth 440 St Andrews 180 Tay Bridgehead 350 The Lochs 670 West Fife and Coastal Villages 440
Source: Sheffield Hallam estimates based on official data

Welfare Reform Committee, 5th Report, 2014 (Session 4)
34
Glasgow
Contains NRS data © Crown copyright and database right [2010] Contains Ordnance Survey data © Crown copyright and database right [2010]
Ward
Loss per working age
adult £ p.a.
Anderston/City 350 Baillieston 680 Calton 880 Canal 700 Craigton 630 Drumchapel/Anniesland 740 East Centre 680 Garscadden/Scotstounhill 690 Govan 690 Greater Pollok 630 Hillhead 360 Langside 500 Linn 670 Maryhill/Kelvin 560 Newlands/Auldburn 590 North East 750 Partick West 450 Pollokshields 460 Shettleston 720 Southside Central 730 Springburn 780
Source: Sheffield Hallam estimates based on official data

Welfare Reform Committee, 5th Report, 2014 (Session 4)
35
Highland
Contains NRS data © Crown copyright and database right [2010] Contains Ordnance Survey data © Crown copyright and database right [2010]
Ward Loss per working
age adult £ p.a.
Aird and Loch Ness 300 Badenoch and Strathspey 300 Black Isle 270 Caol and Mallaig 360 Cromarty Firth 440 Culloden and Ardersier 350 Dingwall and Seaforth 380 East Sutherland and Edderton 570 Eilean a' Chèo 390 Fort William and Ardnamurchan 410 Inverness Central 590 Inverness Millburn 340 Inverness Ness-Side 320 Inverness South 330 Inverness West 440 Landward Caithness 460 Nairn 370 North, West and Central Sutherland 510 Tain and Easter Ross 420 Thurso 450 Wester Ross, Strathpeffer and Lochalsh 330 Wick 520
Source: Sheffield Hallam estimates based on official data

Welfare Reform Committee, 5th Report, 2014 (Session 4)
36
Inverclyde
Contains NRS data © Crown copyright and database right [2010] Contains Ordnance Survey data © Crown copyright and database right [2010]
Ward
Loss per working
age adult £ p.a.
Inverclyde East 610 Inverclyde East Central 690 Inverclyde North 660 Inverclyde South 610 Inverclyde South West 550 Inverclyde West 430
Source: Sheffield Hallam estimates based on official data

Welfare Reform Committee, 5th Report, 2014 (Session 4)
37
Midlothian
Contains NRS data © Crown copyright and database right [2010] Contains Ordnance Survey data © Crown copyright and database right [2010]
Ward
Loss per working
age adult £ p.a.
Bonnyrigg 430 Dalkeith 520 Midlothian East 490 Midlothian South 510 Midlothian West 400 Penicuik 410
Source: Sheffield Hallam estimates based on official data

Welfare Reform Committee, 5th Report, 2014 (Session 4)
38
Moray
Contains NRS data © Crown copyright and database right [2010] Contains Ordnance Survey data © Crown copyright and database right [2010]
Ward
Loss per working age
adult £ p.a.
Buckie 360 Elgin City North 360 Elgin City South 310 Fochabers Lhanbryde 430 Forres 340 Heldon and Laich 310 Keith and Cullen 350 Speyside Glenlivet 340
Source: Sheffield Hallam estimates based on official data

Welfare Reform Committee, 5th Report, 2014 (Session 4)
39
North Ayrshire
Contains NRS data © Crown copyright and database right [2010] Contains Ordnance Survey data © Crown copyright and database right [2010]
Ward
Loss per working age
adult £ p.a.
Ardrossan and Arran 520 Dalry and West Kilbride 580 Irvine East 500 Irvine West 650 Kilbirnie and Beith 550 Kilwinning 570 North Coast and Cumbraes 460 Saltcoats and Stevenston 650
Source: Sheffield Hallam estimates based on official data
Welfare Reform Committee, 5th Report, 2014 (Session 4)
40
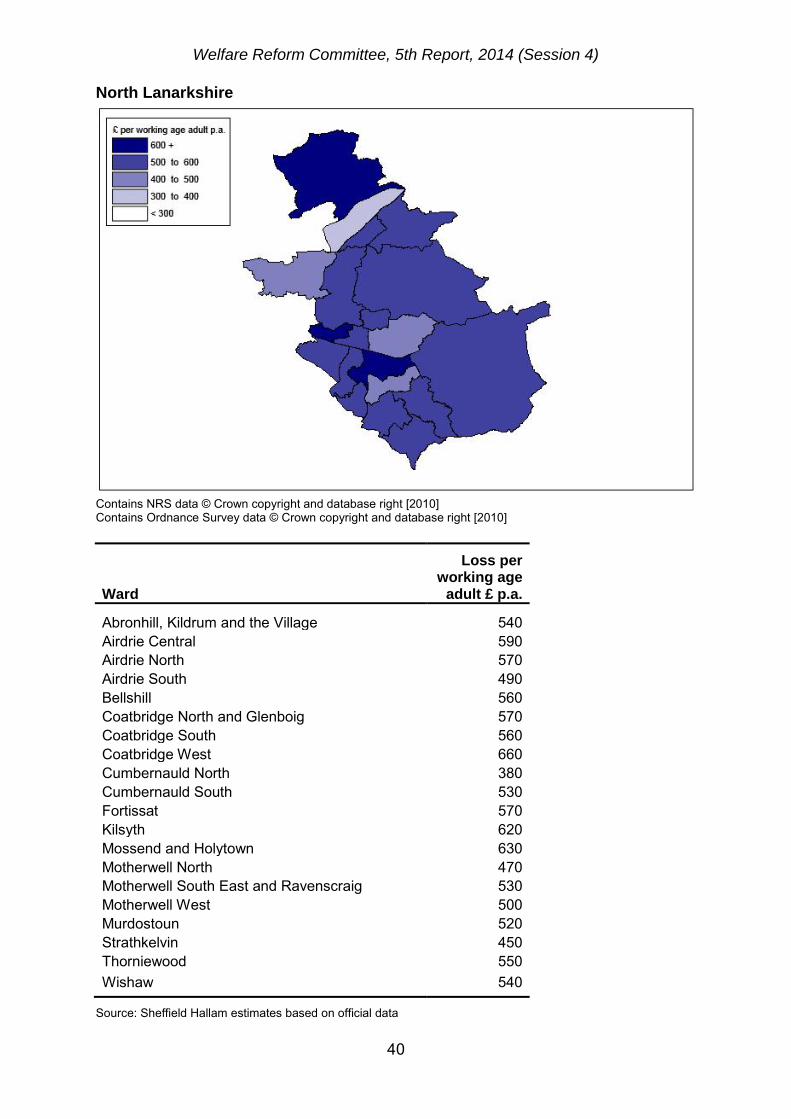
North Lanarkshire
Contains NRS data © Crown copyright and database right [2010] Contains Ordnance Survey data © Crown copyright and database right [2010]
Ward
Loss per working age
adult £ p.a.
Abronhill, Kildrum and the Village 540 Airdrie Central 590 Airdrie North 570 Airdrie South 490 Bellshill 560 Coatbridge North and Glenboig 570 Coatbridge South 560 Coatbridge West 660 Cumbernauld North 380 Cumbernauld South 530 Fortissat 570 Kilsyth 620 Mossend and Holytown 630 Motherwell North 470 Motherwell South East and Ravenscraig 530 Motherwell West 500 Murdostoun 520 Strathkelvin 450 Thorniewood 550 Wishaw 540
Source: Sheffield Hallam estimates based on official data

Welfare Reform Committee, 5th Report, 2014 (Session 4)
41
Orkney Islands
Contains NRS data © Crown copyright and database right [2010] Contains Ordnance Survey data © Crown copyright and database right [2010]
Ward
Loss per working
age adult £ p.a.
East Mainland, South Ronaldsay and Burray 280 Kirkwall East 270 Kirkwall West and Orphir 380 North Isles 430 Stromness and South Isles 450 West Mainland 290
Source: Sheffield Hallam estimates based on official data

Welfare Reform Committee, 5th Report, 2014 (Session 4)
42
Perth and Kinross
Contains NRS data © Crown copyright and database right [2010] Contains Ordnance Survey data © Crown copyright and database right [2010]
Ward
Loss per working
age adult £ p.a.
Almond and Earn 300 Blairgowrie and Glens 410 Carse of Gowrie 300 Highland 320 Kinross-shire 300 Perth City Centre 500 Perth City North 490 Perth City South 310 Strathallan 340 Strathearn 410 Strathmore 370 Strathtay 350
Source: Sheffield Hallam estimates based on official data

Welfare Reform Committee, 5th Report, 2014 (Session 4)
43
Renfrewshire
Contains NRS data © Crown copyright and database right [2010] Contains Ordnance Survey data © Crown copyright and database right [2010]
Ward
Loss per working age
adult £ p.a.
Bishopton, Bridge of Weir & Langbank 330 Erskine & Inchinnan 370 Houston, Crosslee & Linwood 470 Johnstone North, Kilbarchan & Lochwinnoch 540 Johnstone South, Elderslie & Howwood 480 Paisley East & Ralston 480 Paisley North West 660 Paisley South 490 Paisley South West 560 Renfrew North 520 Renfrew South & Gallowhill 610
Source: Sheffield Hallam estimates based on official data

Welfare Reform Committee, 5th Report, 2014 (Session 4)
44
Scottish Borders
Contains NRS data © Crown copyright and database right [2010] Contains Ordnance Survey data © Crown copyright and database right [2010]
Ward
Loss per working
age adult £ p.a.
East Berwickshire 410 Galashiels and District 430 Hawick and Denholm 470 Hawick and Hermitage 460 Jedburgh and District 320 Kelso and District 360 Leaderdale and Melrose 360 Mid Berwickshire 380 Selkirkshire 400 Tweeddale East 350 Tweeddale West 350
Source: Sheffield Hallam estimates based on official data

Welfare Reform Committee, 5th Report, 2014 (Session 4)
45
Shetland Islands
Contains NRS data © Crown copyright and database right [2010] Contains Ordnance Survey data © Crown copyright and database right [2010]
Ward
Loss per working age
adult £ p.a.
Lerwick North 310 Lerwick South 310 North Isles 230 Shetland Central 250 Shetland North 240 Shetland South 280 Shetland West 270
Source: Sheffield Hallam estimates based on official data

Welfare Reform Committee, 5th Report, 2014 (Session 4)
46
South Ayrshire
Contains NRS data © Crown copyright and database right [2010] Contains Ordnance Survey data © Crown copyright and database right [2010]
Ward
Loss per working
age adult £ p.a.
Ayr East 470 Ayr North 630 Ayr West 470 Girvan and South Carrick 610 Kyle 500 Maybole, North Carrick and Coylton 450 Prestwick 410 Troon 400
Source: Sheffield Hallam estimates based on official data

Welfare Reform Committee, 5th Report, 2014 (Session 4)
47
South Lanarkshire
Contains NRS data © Crown copyright and database right [2010] Contains Ordnance Survey data © Crown copyright and database right [2010]
Ward
Loss per working age adult £ p.a.
Avondale and Stonehouse 400 Blantyre 640 Bothwell and Uddingston 380 Cambuslang East 560 Cambuslang West 500 Clydesdale East 440 Clydesdale North 460 Clydesdale South 480 Clydesdale West 470 East Kilbride Central North 470 East Kilbride Central South 430 East Kilbride East 490 East Kilbride South 460 East Kilbride West 340 Hamilton North and East 550 Hamilton South 530 Hamilton West and Earnock 440 Larkhall 540 Rutherglen Central and North 600 Rutherglen South 580
Source: Sheffield Hallam estimates based on official data

Welfare Reform Committee, 5th Report, 2014 (Session 4)
48
Stirling
Contains NRS data © Crown copyright and database right [2010] Contains Ordnance Survey data © Crown copyright and database right [2010]
Ward
Loss per working
age adult £ p.a.
Bannockburn 490 Castle 450 Dunblane and Bridge of Allan 210 Forth and Endrick 290 Stirling East 410 Stirling West 400 Trossachs and Teith 340
Source: Sheffield Hallam estimates based on official data

Welfare Reform Committee, 5th Report, 2014 (Session 4)
49
West Dunbartonshire
Contains NRS data © Crown copyright and database right [2010] Contains Ordnance Survey data © Crown copyright and database right [2010]
Ward
Loss per working age adult £ p.a.
Clydebank Central 660 Clydebank Waterfront 610 Dumbarton 520 Kilpatrick 580 Leven 540 Lomond 570
Source: Sheffield Hallam estimates based on official data

Welfare Reform Committee, 5th Report, 2014 (Session 4)
50
West Lothian
Contains NRS data © Crown copyright and database right [2010] Contains Ordnance Survey data © Crown copyright and database right [2010]
Ward
Loss per working
age adult £ p.a.
Armadale and Blackridge 570 Bathgate 430 Broxburn, Uphall and Winchburgh 430 East Livingston and East Calder 440 Fauldhouse and the Breich Valley 550 Linlithgow 350 Livingston North 410 Livingston South 500 Whitburn and Blackburn 610
Source: Sheffield Hallam estimates based on official data

Welfare Reform Committee, 5th Report, 2014 (Session 4) — Annexe A
51
APPENDIX 2: Details of statistical sources and methods HOUSING BENEFIT: (1) LOCAL HOUSING ALLOWANCE Rules governing assistance with the cost of housing for low-income households in the private rented sector Nature of reforms Maximum rents set at 30th percentile of local rents, rather than 50th percentile,
from 2011-12
Caps on maximum rents for each property size, with 4-bed limit, from 2011-12 Abolition of £15 excess formerly retained by tenants paying below maximum
LHA rent, from 2011-12 Increase age limit for shared room rate from 25 to 35, from January 2012 Switch from 30th percentile rents to CPI indexation for LHA, from 2013-14 Total estimated loss (GB) £1,645m a year by 2014-15 (Source: HM Treasury) Methods and data sources (1) Allocation to local authorities Total loss arising from 30th percentile, size caps and £15 excess (£1040m pa)
allocated to local authorities on the basis of DWP estimates of the number of households affected and the average final loss (Source: DWP Impacts of Housing Benefit proposals: changes to LHA to be introduced in 2011-12)
Loss arising from increase in age limit for shared room rate (£215m pa)
allocated to local authorities on the basis of estimates of the numbers losing and average loss per week in each authority (Source: DWP Housing Benefit equality impact assessment: increasing the shared accommodation rate age threshold to 35)
Loss arising from CPI indexation (£390m pa) allocated to local authorities on
the basis of the number of Housing Benefit claims in the private rented sector in each authority in August 2012 (Source: DWP)
Number of affected households based on number of Housing Benefit claimants
in August 2012 in the private rented sector in each authority and the national share receiving LHA (Source: DWP). NB All LHA recipients affected by shift to CPI indexation.

Welfare Reform Committee, 5th Report, 2014 (Session 4)
52
(2) Allocation to wards Financial loss allocated to wards on the basis of the number of LHA claimants
in April 2011 (Source: DWP) HOUSING BENEFIT: (2) UNDER-OCCUPATION (‘BEDROOM TAX’) New rules governing the size of properties for which payments are made to working age claimants in the social rented sector (council and housing association) Nature of the reform Limit Housing Benefit payments to working-age households in social rented
accommodation to a level reflecting the number of bedrooms justified by the size and age composition of the household, from 2013-14
Total estimated loss (GB) £400m a year by 2014-15 (Source: HM Treasury, revised down from £490m on basis of ratio between number of households affected in June 2013 and number originally anticipated to be affected) Methods and data sources (1) Allocation to local authorities (areas outside Scotland)
Number of households affected in each local authority from outturn statistics for June 2013 (Source: DWP)
Financial loss in each local authority estimated on the basis of the outturn
number of affected households (see above) and the estimated average loss per claimant in each GB region (Source: DWP Impact Assessment, Housing Benefit: under-occupation of social housing, June 2012 update)
(2) Allocation to wards No longer relevant in Scotland owing to measures to avert the impact on
claimants. NON-DEPENDANT DEDUCTIONS Deductions from Housing Benefit, Council Tax Benefit and other income-based benefits to reflect the contribution that non-dependant household members are expected to make towards the household’s housing costs.

Welfare Reform Committee, 5th Report, 2014 (Session 4) — Annexe A
53
Nature of reform
Up-rating the deductions in stages between April 2011 and April 2014 to reflect growth in rents and increases in Council Tax since 2001, when the deductions were frozen, and subsequent link to prices
Total estimated loss (GB) £340m a year by 2014-15 (Source: HM Treasury) Methods and data sources (1) Allocation to local authorities Estimated 300,000 claimants affected (Source: DWP Equality Impact
Assessment: income-related benefits: changes to the non-dependent deduction rates) allocated on the basis of the number of Housing Benefit and Council Tax Benefit claimants in each local authority in August 2012 (Source: DWP).
Financial loss allocated to local authorities on the basis of the estimated numbers affected (see above)
(2) Allocation to wards Financial loss allocated to wards on the basis of Housing Benefit claimant
numbers in April 2012 HOUSEHOLD BENEFIT CAP New ceiling on total payments per household applying to wide range of benefits, including Child Benefit, Child Tax Credit, Employment and Support Allowance, Housing Benefit, Incapacity Benefit, Income Support and Jobseeker’s Allowance Nature of reforms
Total household benefit payments for working-age claimants capped so that workless households receive no more in benefit than the average weekly wage, after tax and national insurance, from 2013-14, administered through Housing Benefit payments
Total estimated loss (GB) £185m a year by 2014-15 (Source: HM Treasury, revised down from £270m on basis of the ratio between the number of households affected in February 2013 and the number originally anticipated to be affected)

Welfare Reform Committee, 5th Report, 2014 (Session 4)
54
Methods and data sources (1) Allocation to local authorities
Financial loss allocated to local authorities on the basis of the outturn statistics on the number of households in each authority in February 2013 expected to be affected by the benefit cap (Source: DWP)
(2) Allocation to wards Financial loss allocated to wards on the basis of the number on out-of-work
benefits in February 2013 (Source: DWP) COUNCIL TAX BENEFIT Paid to households on low incomes to offset Council Tax bills, in whole or in part Nature of the reform
10 per cent reduction in expenditure by HM Treasury and transfer of responsibility for the scheme to local authorities, from 2013-14.
Reduction in entitlement only permitted for working-age households; entitlement of pensioner households fully protected.
Some local authorities in England have chosen not to pass on the reduction to claimants, in whole or in part, absorbing the cut within their budget. In Scotland and Wales the devolved administrations have made arrangements that avoid the reduction falling on claimants.
Total estimated loss (GB) £490m a year by 2014-15 (Source: HM Treasury) of which an estimated £340m a year is being passed on to claimants Methods and data sources (1) Allocation to local authorities (areas outside Scotland)
Number of households affected and average weekly loss, by authority, from statistics assembled by the New Policy Institute, as updated on 7th February 2013 at www.npi.org.uk. The NPI calculations are based on information assembled from each local authority.
The NPI data shows that some local authorities in England have chosen not to
pass on the benefit reduction to claimants, in whole or in part, absorbing the cut elsewhere within their budget. In Scotland and Wales the devolved administrations have not passed on the cut to local authorities, thereby avoiding any impact on claimants.
Where the NPI identifies only ‘minor changes’ the impact has been set to zero.

Welfare Reform Committee, 5th Report, 2014 (Session 4) — Annexe A
55
(2) Allocation to wards Not relevant in Scotland DISABILITY LIVING ALLOWANCE Payments intended to help offset the additional financial costs faced by individuals of all ages with disabilities, including those both in and out of work Nature of reform
Phased replacement of Disability Living Allowance (DLA) for working-age claimants by Personal Independence Payments (PIP), from 2013-14
Introduction of more stringent medical test and regular re-testing Reduction in number of payment categories Total estimated loss (GB) £1,500m a year by 2017-18 (Source: DWP Impact Assessment Disability Living Allowance reform, adjusted for inflation and revised implementation timetable) Methods and data sources (1) Allocation to local authorities Anticipated reduction in national caseload of working age to 1.7m (Source:
DWP Impact Assessment) represents a 23 per cent reduction in anticipated numbers in absence of reform
Numbers affected refer to the 23 per cent reduction in claimants, allocated on
the basis of stock of working age DLA claimants in each local authority in February 2012 (Source: DWP). Additionally, a number of claimants in receipt of PIP instead of DLA may experience a reduction in payment.
Financial loss allocated to each local authority on the basis of the reduction in
claimant numbers (see above) (2) Allocation to wards Financial loss allocated by ward on the basis of the numbers aged 16-59
claiming DLA in February 2013 (Source: DWP)
Welfare Reform Committee, 5th Report, 2014 (Session 4)
56
INCAPACITY BENEFITS Out-of-work payments to men and women of working age with health problems or disabilities, including Employment and Support Allowance (ESA) and its predecessors Incapacity Benefit, Income Support on grounds of disability, and Severe Disablement Allowance Nature of reforms
Introduction of ESA for new claimants and a new, tougher medical test (the Work Capability Assessment), from October 2008
Applying the Work Capability Assessment to existing incapacity claimants from autumn 2010 onwards, and migration to ESA if not deemed ‘fit for work’
Time-limiting to 12 months non-means tested entitlement for ESA Work Related Activity Group, from 2012-13
New conditionality for ESA Work Related Activity Group Total estimated loss (GB) £4,350m a year by 2015-16, comprising:
£2,600m a year from time limiting of non-means tested entitlement (Source: HM Treasury estimates for 2014-15, revised to take account of inflation and additional numbers affected by 2015-16)
c. £1,750m a year from remaining measures (see below)
Methods and data sources (1) Allocation to local authorities
By 2015-16, an estimated 700,000 will be affected by time limiting non-means tested ESA entitlement. Of these, 40 per cent are anticipated to lose benefit entirely and the remaining 60 per cent will experience a reduction in payment (Source: DWP Impact Assessment Time limit contributory Employment and Support Allowance to one year for those in the Work-Related Activity Group).
By 2014 an additional 550,000 are estimated to be denied ESA by other elements of the reforms, of which 30 per cent will not claim alternative benefits (Source: Beatty and Fothergill 2011, Incapacity benefit reform: the local regional and national impact, CRESR, Sheffield Hallam University).
Numbers affected by local authority allocated on the basis of methods in Beatty
and Fothergill (2011) based primarily on DWP claimant data, DWP impact assessments and DWP evidence from pilot areas.
Financial loss arising from time limiting allocated in 3:1 ratio between those
losing benefit entirely and those retaining benefit at reduced rate, on the basis of estimated numbers in each group by local authority.

Welfare Reform Committee, 5th Report, 2014 (Session 4) — Annexe A
57
Financial loss arising from other elements of the reforms estimated to be two-thirds that arising from time limiting, given of numbers affected and proportion expected to be denied benefits. (Treasury or DWP estimates have not been published). Loss allocated in 2:1 ratio between those denied benefit entirely and those claiming other benefits at a lower rate, on the basis of estimated numbers in each group by local authority.
(2) Allocation to wards
Financial loss allocated by ward on the basis of the numbers claiming incapacity benefits in February 2011 (Source: DWP)
CHILD BENEFIT Paid to households on the basis of the number of children up to age 16 or, if they remain at school or in further education, up to 19 Nature of reforms
Freeze benefit rates for three years from 2011-12, instead of up-rate with inflation
Withdrawal of benefit from households including a higher earner (threshold at £50,000 and taper to £60,000), from January 2013
Total estimated loss (GB) £2,845m a year by 2014-15 (Source: HM Treasury) Methods and data sources (1) Allocation to local authorities
Numbers of families in receipt of Child Benefit, by local authority in August 2011, from HMRC (Source: HMRC Child Benefit Statistics: geographical analysis). NB All recipients affected by freeze.
Financial loss arising from freeze (£975m pa) allocated on basis of number of
families in receipt of Child Benefit in each local authority (see above) Financial loss arising from withdrawal of benefit from high earners (£1,870m
pa) allocated on basis of number of families in receipt of Child Benefit multiplied by an index of median earnings in the three years 2010, 2011 and 2012 of residents in each local authority relative to the UK average (Source: Annual Survey of Hours and Earnings). County averages used where earnings data for districts is unavailable.
Welfare Reform Committee, 5th Report, 2014 (Session 4)
58
(2) Allocation to wards Financial loss arising from three-year freeze allocated to wards on the basis of
numbers of Child Benefit claimants in August 2012 (Source: HMRC) Financial loss arising from withdrawal from higher earners allocated to wards in
proportion to the distribution of professional and managerial workers within the local authority in 2011 (Source: Census of Population)
TAX CREDITS Payments through the tax system of Child Tax Credit (CTC) and Working Tax Credit (WTC) to lower and middle income households Nature of reforms Adjustments to thresholds, withdrawal rates, supplements, income disregards
and backdating provisions, from 2011-12 onwards Changes in indexation and up-rating, from 2011-12 onwards Reductions in childcare element of WTC, from 2011-12 Increase in working hours requirement for WTC, from 2012-13 Total estimated loss (GB) £3,660m (net) a year by 2014-15 (Source: HM Treasury) Methods and data sources (1) Allocation to local authorities
Overall loss allocated on the basis of the total number of families in receipt of CTC or WTC in December 2012, by local authority (Source: HMRC Child and Working Tax Credits Statistics: geographical analysis)
All families in receipt of CTC or WTC affected by one or more of the changes (2) Allocation to wards Financial loss allocated to wards on the basis of the numbers claiming Tax
Credits in August 2011 (Source: HMRC)

Welfare Reform Committee, 5th Report, 2014 (Session 4) — Annexe A
59
1 PER CENT UP-RATING Annual up-rating of value of benefits Nature of reform
1 per cent up-rating (instead of by CPI) for three years from 2013-14 for main working-age benefits, and for two years from 2014-15 for Child Benefit and for Local Housing Allowance within Housing Benefit
Total estimated loss (GB) £3,430m a year by 2015-16 (Source: HM Treasury) Methods and data sources (1) Allocation to local authorities
Total loss divided equally between DWP-administrated benefits and HMRC-administrated benefits (Child Benefit, CTC, WTC), reflecting split of overall expenditure on relevant benefits (Sources: DWP and HMRC)
HMRC benefits loss allocated on basis of total number of families in receipt of
CTC or WTC in December 2012, (Source: HMRC Child and Working Tax Credits: geographical analysis)
DWP benefits loss divided 75:25 between working age benefits and Housing
Benefit, reflecting split of overall expenditure on relevant benefits (Source: DWP)
DWP working age benefits loss allocated on basis of non-employed working
age benefit numbers in February 2012, by local authority (Source: DWP) Housing Benefit loss allocated on basis of estimated expenditure on claimants
in the private rented sector, by local authority, derived from overall Housing Benefit expenditure data for 2011/12 and share of claimants in the private rented sector in August 2012 (Sources: DWP)
(2) Allocation to wards Financial loss allocated to wards according to claimant numbers, with
weightings of 37.5% for out-of-work benefit numbers, 12.5% for Housing Benefit claimant numbers and 50% for Tax Credit claimant numbers (see above for sources of weightings) (Sources: DWP, HMRC)

Members who would like a printed copy of this Numbered Report to be forwarded to them should give notice at the Document Supply Centre.
Produced and published in Scotland on behalf of the Scottish Parliamentary Corporate Body, The Scottish Parliament, Edinburgh, EH99 1SP by APS Group Scotland, 21 Tennant Street, Edinburgh EH6 5NA
All documents are available on the Scottish Parliament website at: www.scottish.parliament.uk For details of documents available to order in hard copy format, please contact: APS Scottish Parliament Publications on 0131 629 9941.
For information on the Scottish Parliament contact Public Information on: Telephone: 0131 348 5000 Textphone: 0800 092 7100 Email: [email protected]
ISBN 978-1-78457-712-4