welland river floodplain mapping - round 2 public information presentation
TRANSCRIPT
WELLAND RIVER FLOODPLAIN MAPPING UPDATEPublic Information Meeting
June 2016
Diego Torres Silvestre ((CC BY 2.0)
1
Presentation Outline
2
• Project Vision
• Project Overview
• Consultation Summary
• Where We Are Now
• Technical Overview
Project Overview
To successfully complete a Floodplain Mapping Update Study that is Connected, Accurate, Reliable, and founded on Empirical data and observations using state-of-the-art tools and methodologies.
Project Vision Statement
• This means that new floodline mapping will be in place for the Welland River. The new line may affect what you can do on your property.
• The project will fully engage affected landowners.
• Awareness, understanding and input are key principles of the consultation program.
3

Project Overview
Study Area Limit - Lower
Study Area Limit - MiddleStudy Area Limit - Upper
4
Project Overview
Awareness Meetings (February 2016) occurred during the beginning of the study and focused on describing the project and listening to community ideas and concerns.
Technical Understanding & Input Meetings (June 2016) are occurring now that some modeling work has been completed.
Draft Floodline Maps (once policy work is ready) will be presented once the technical work is complete and the policies are drafted. Community input will be considered before NPCA Board makes a final decision.
Public InputA series of Meetings open to the public, interested landowners and stakeholders are scheduled.
5

Consultation Summary
Meeting #1: 131 Meeting #2: 104Meeting #3: 63Meeting #4: 109
Total Sign-In: 407
6
Consultation Summary
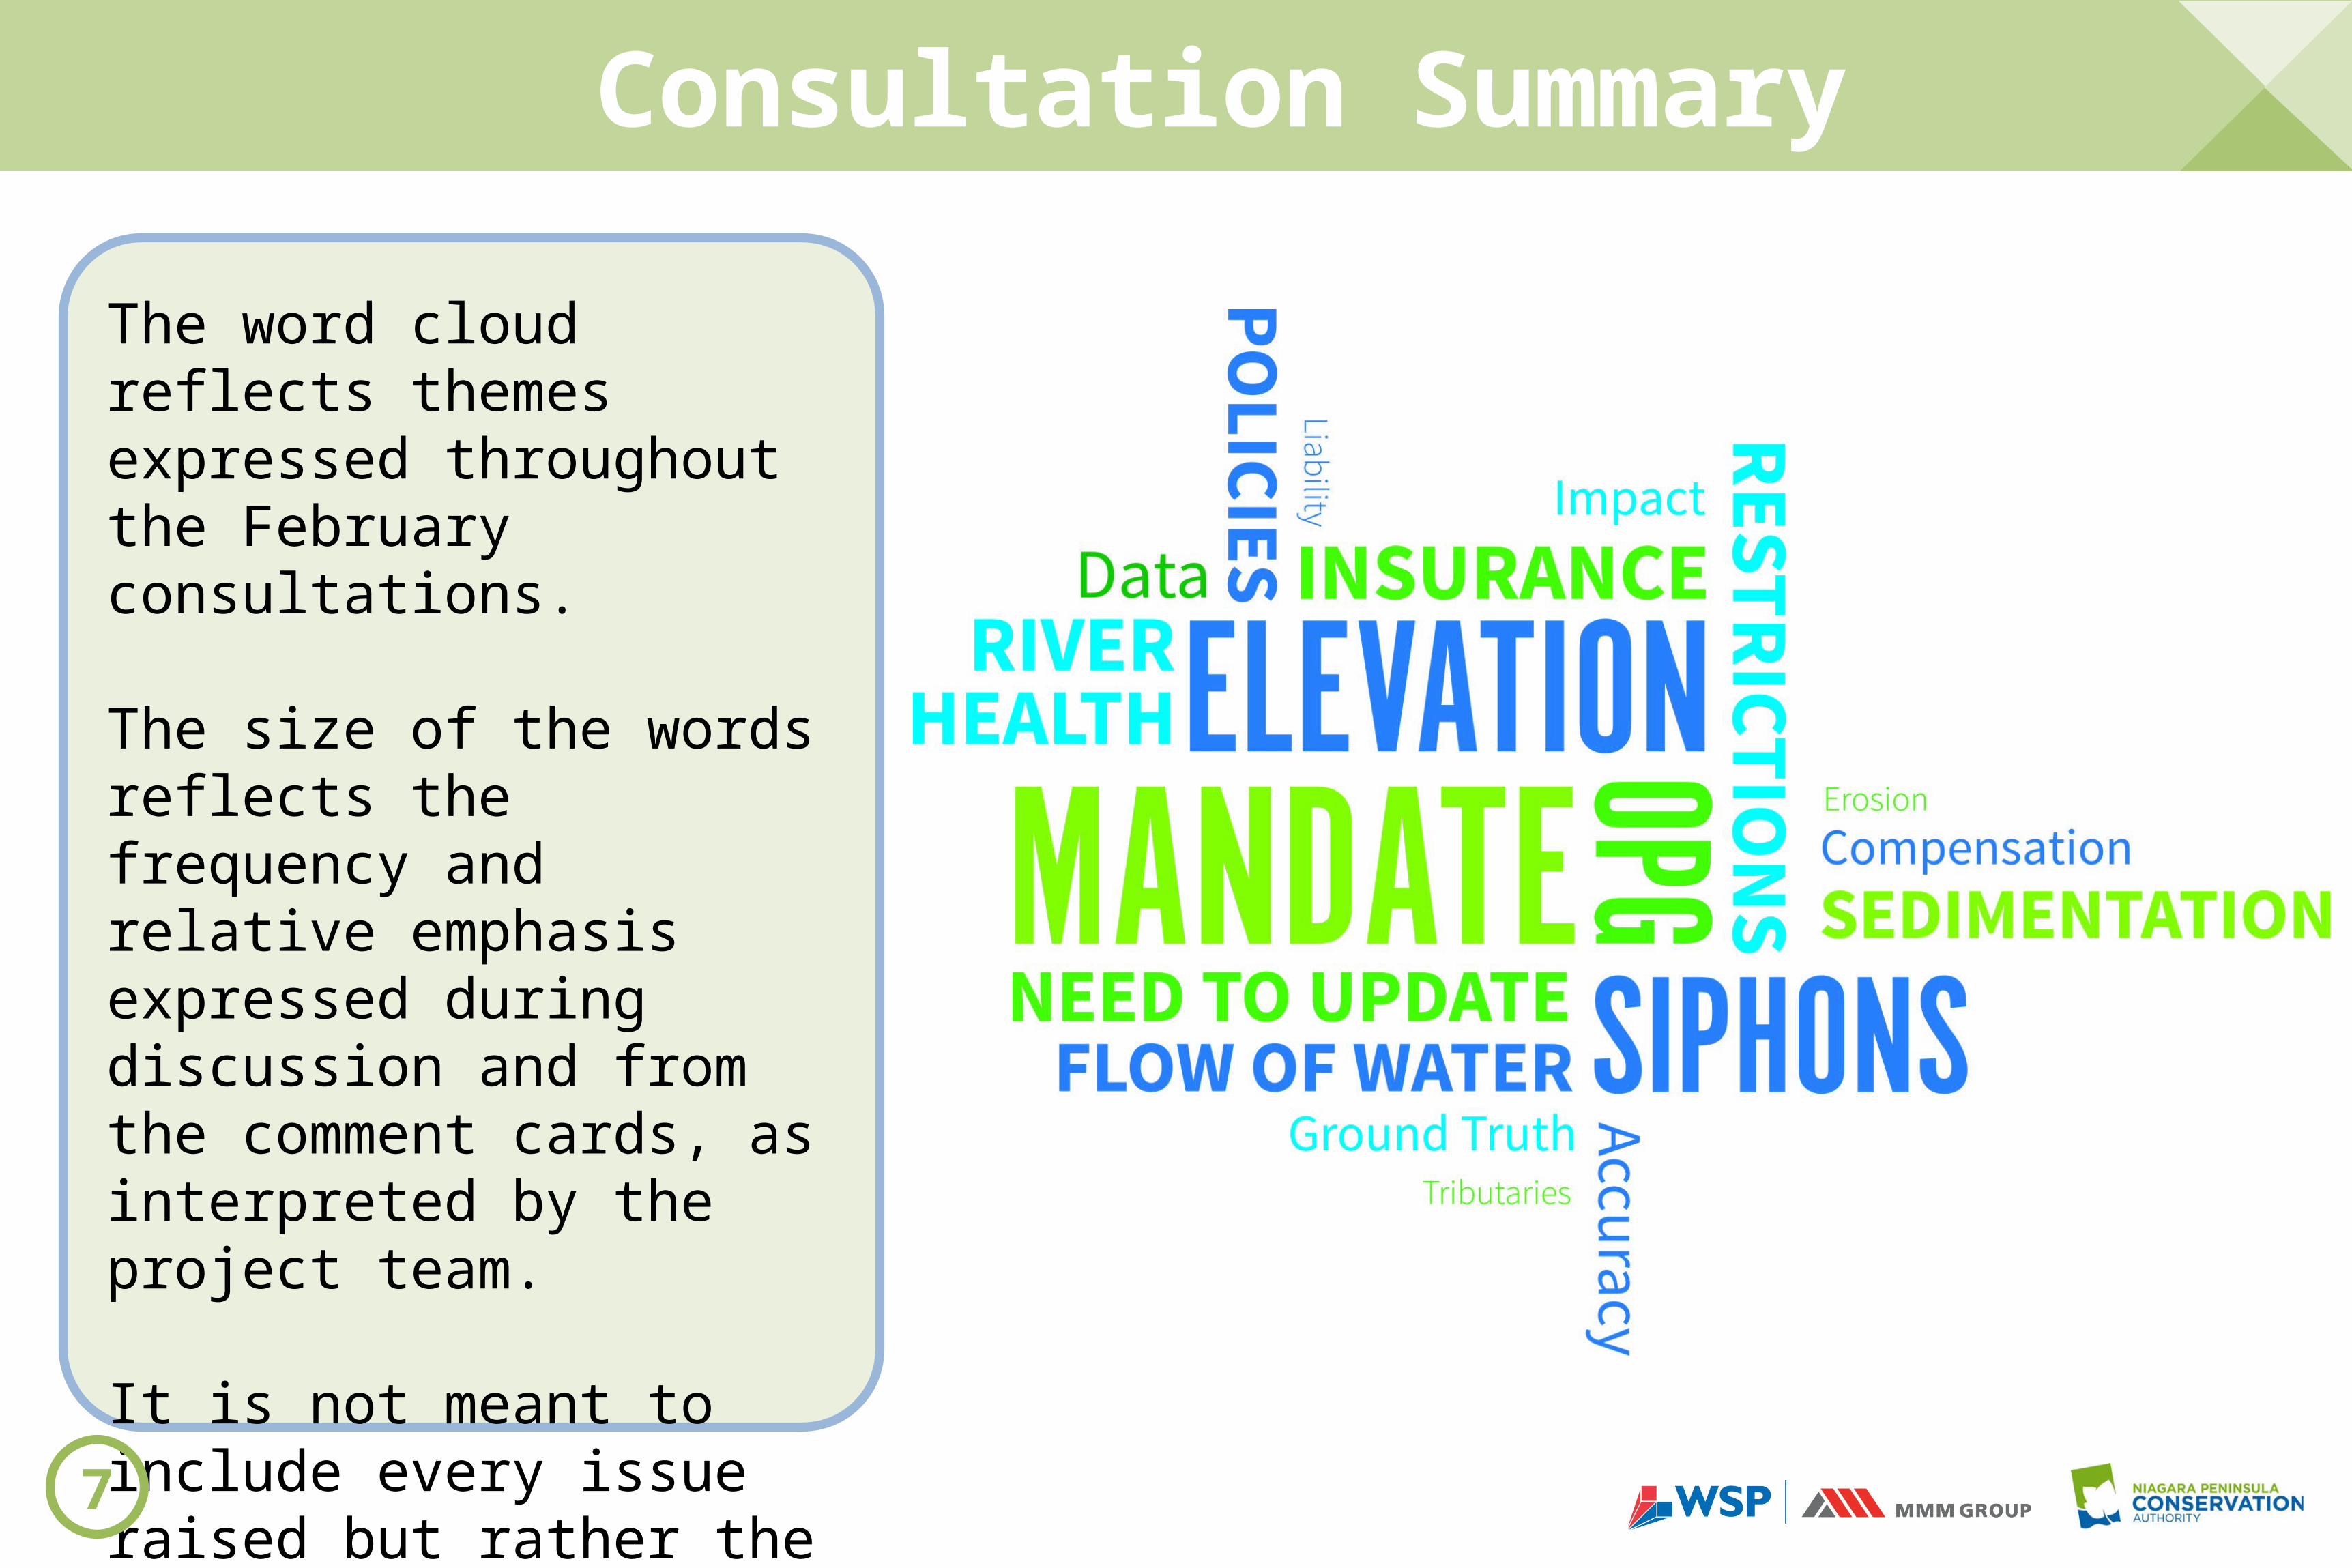
The word cloud reflects themes expressed throughout the February consultations.
The size of the words reflects the frequency and relative emphasis expressed during discussion and from the comment cards, as interpreted by the project team.
It is not meant to include every issue raised but rather the key themes that need to be addressed as the project progresses.
7

Consultation SummaryMandate and Need to Update Floodline Mapping• NPCA’s legislative mandate as set out in Section 20 of the Conservation Authorities Act is to establish and
undertake programs designed to further the conservation, restoration, development and management of natural resources.
• In addition, under the Provincial Planning Act Conservation Authorities have been delegated the responsibility to reduce the potential for public cost or risk to Ontario’s residents from natural or human made hazards. Section 3.1 of the Provincial Policy Statement (2014) indicates that development shall be directed away from areas of natural or human-made hazards where there is an unacceptable risk to public health or safety or of property damage, and not create new or aggravate existing hazards.
• As such, the Conservation Authorities require that Planning Act development applications identify areas of flood hazard and undertake development such that the risk to the public is mitigated.
• NPCA Board agreed with Staff recommendation that the 30 year old floodline mapping be updated in an effort to ensure that the established line reflects the best available information, is up to date, and is technically defensible.
• climate change• improved technology (e.g. greater resolution - Digital Elevation Models, more data).
8

Consultation Summary
Flood Event Selection
• In order to determine what risk of flood to protect against, a flood event must be selected and modeled.
• 100-year flood event is the minimum standard.
• This is also the flood event used to create the 1985 line.
• Means that 1% chance of that flood happening in any given year OR if thinking of a typical home mortgage, there is a 22% chance of the 100-year flood event occurring during the term of the mortgage.
9
Consultation Summary
Ontario Power Generation • OPG has a presence in the area and the Welland River plays a significant role in OPG
operations. There is a strong perception that:• various structures and facilities affect the flow of water in and down the River • controls on water level and flow have a direct impact on the River’s ability to
naturally accommodate flood events and as such the impact flood events have on property
• operations contribute significantly to the level of sedimentation
• The impact of current OPG operations will be taken into consideration when developing floodplain mapping for the Welland River.
• While there has been public discussion about potential changes to OPG operations, this project must assume that OPG will continue to operate their facility in the same manner until OPG declares otherwise.
10
Consultation Summary
Siphons
• The Siphons are perceived to have a significant impact on the Rivers response to flood events.
• The impact of the Old and New Siphons on the Welland River floodplain will be analyzed as part of this study.
• It is noted that the NPCA is not responsible for clearing the Siphons however these concerns have been passed along to the City of Welland and the St. Lawrence Seaway Management Corporation.
• It is unknown when the next clearing of the siphons will occur.
11

Where We Are Now
• Technical work is advancing.
• Some site visits have taken place.
• Excellent input and discussion from the Watershed Floodplain Committee.
• On track to complete the technical work and determine a recommended floodline.
• The Committee recommended that the floodline NOT be finalized until the policy work is complete. NPCA Board agreed with this recommendation.
12
What this Presentation will Cover
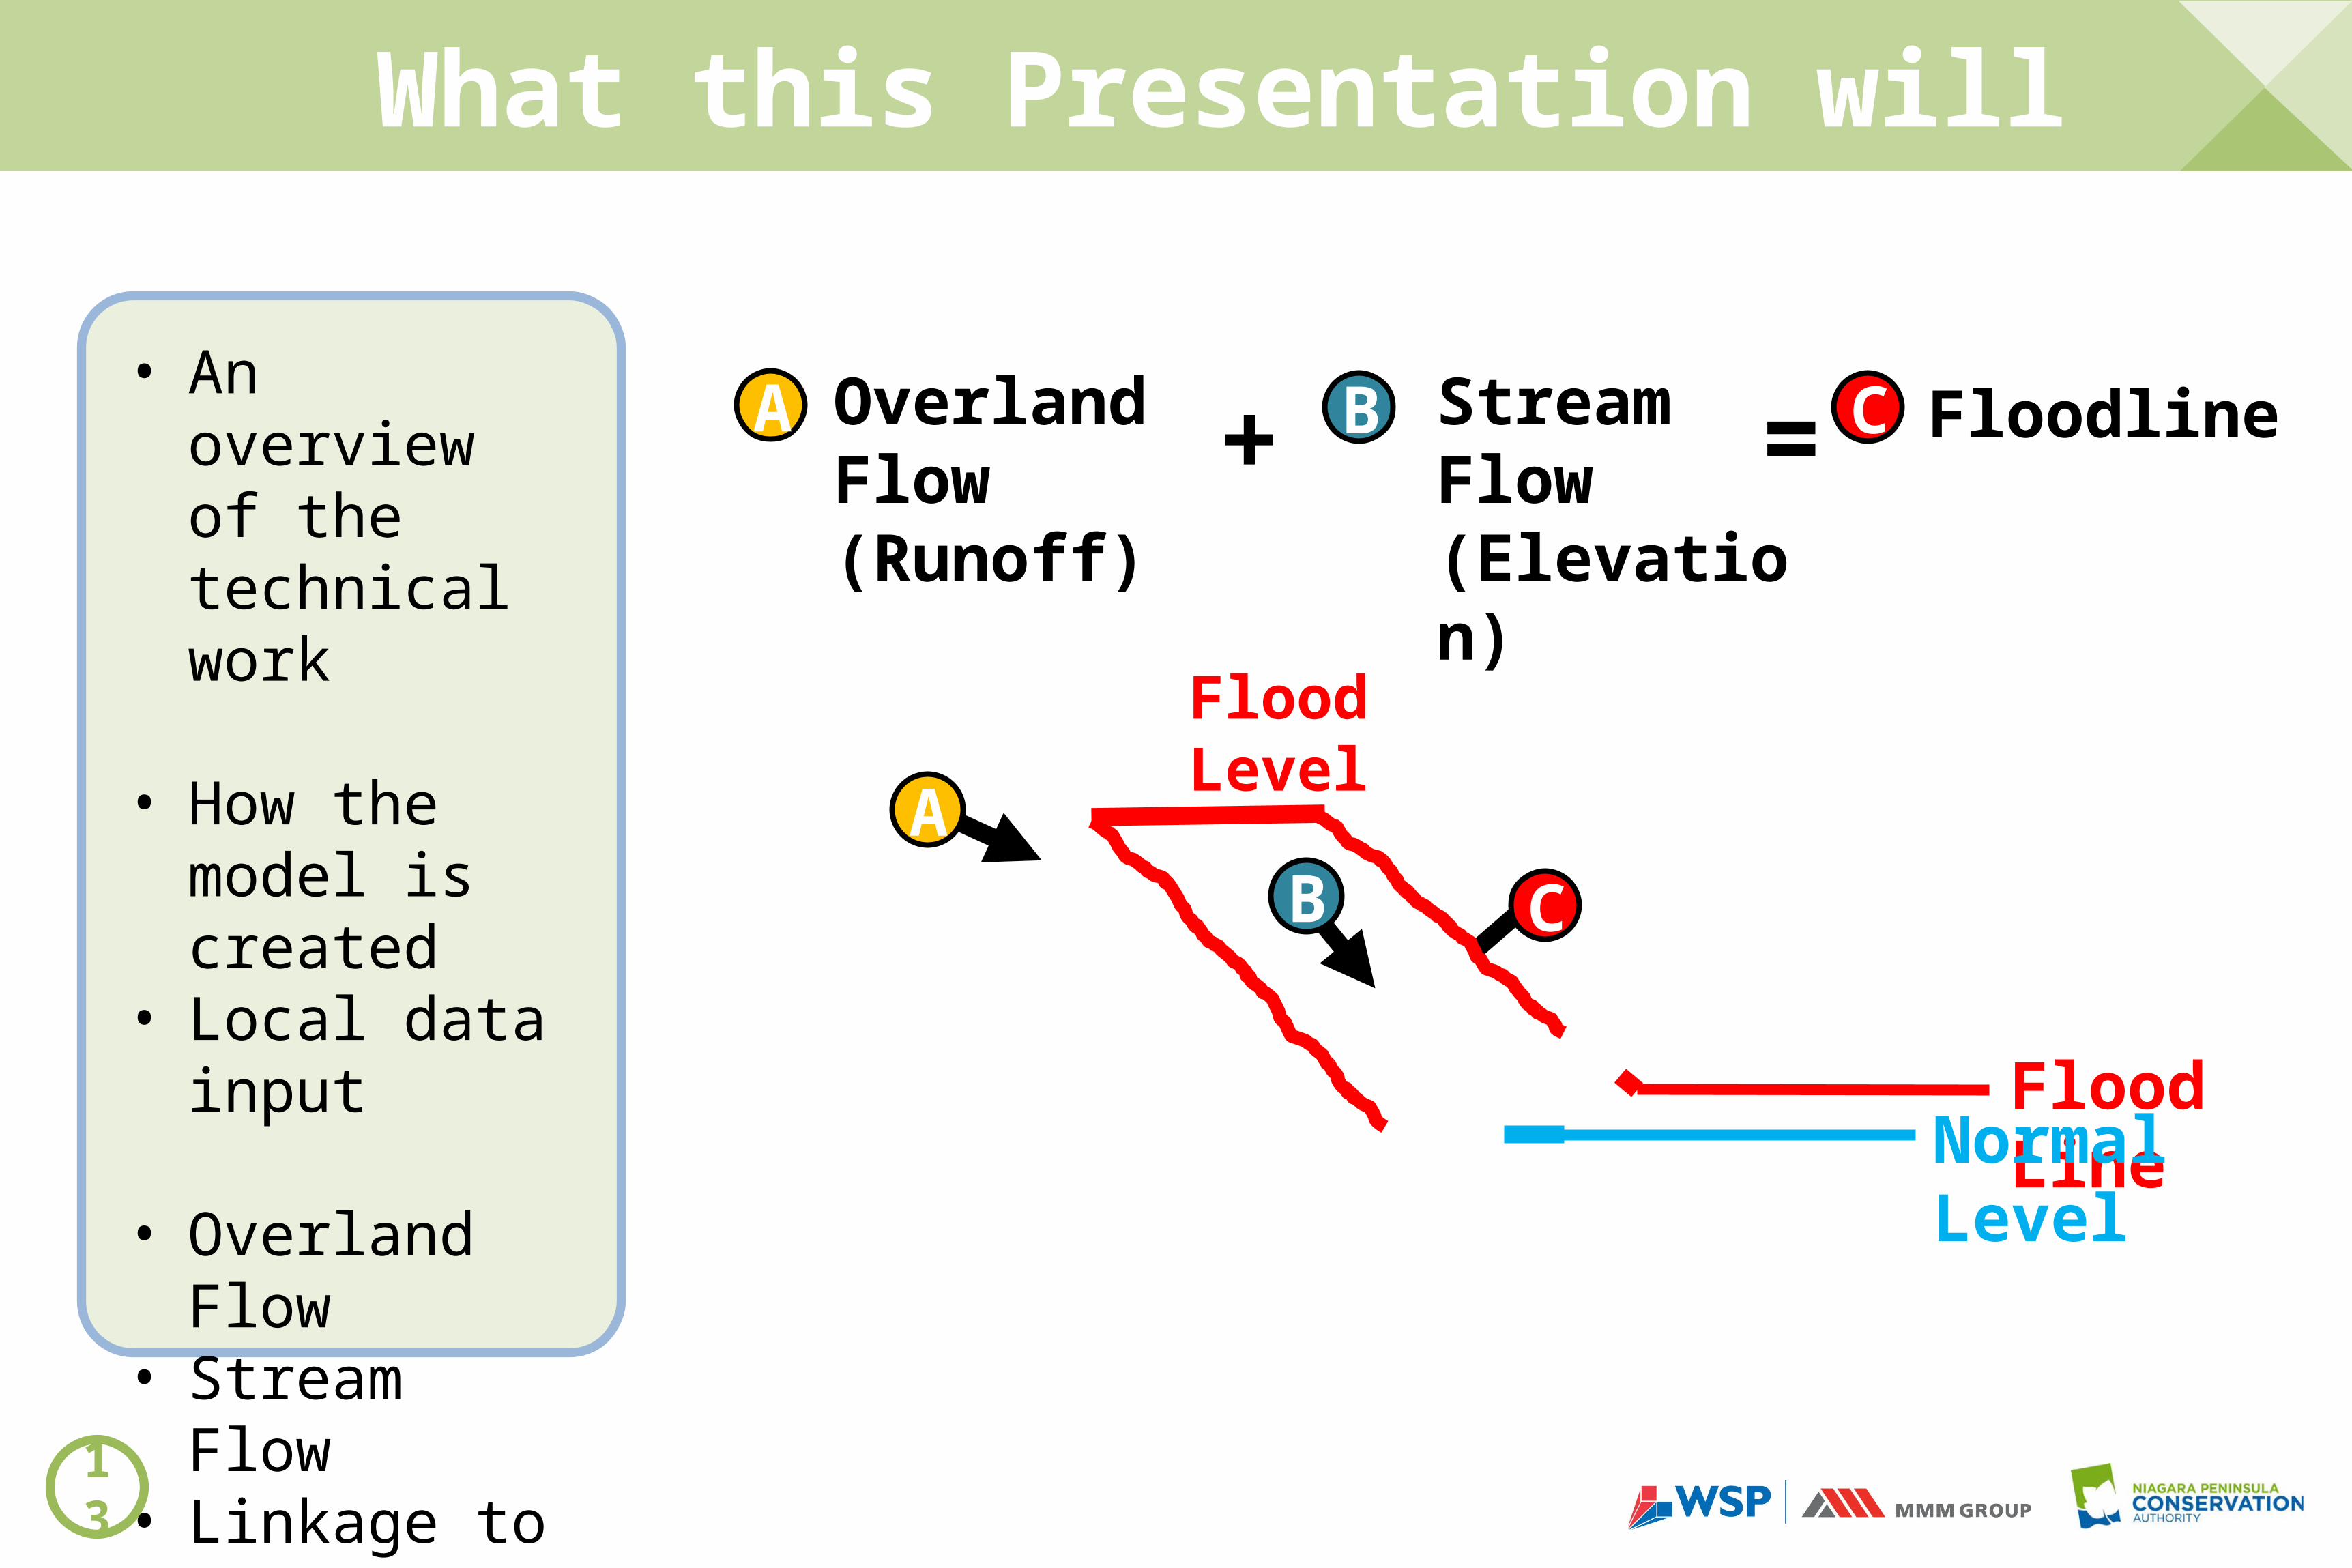
• An overview of the technical work
• How the model is created
• Local data input
• Overland Flow• Stream Flow• Linkage to the
Stream Flow Model
Overland Flow (Runoff)
A
A Stream Flow (Elevation)
B+ = C Floodline
Flood LineNormal Level
B C
Flood Level
13
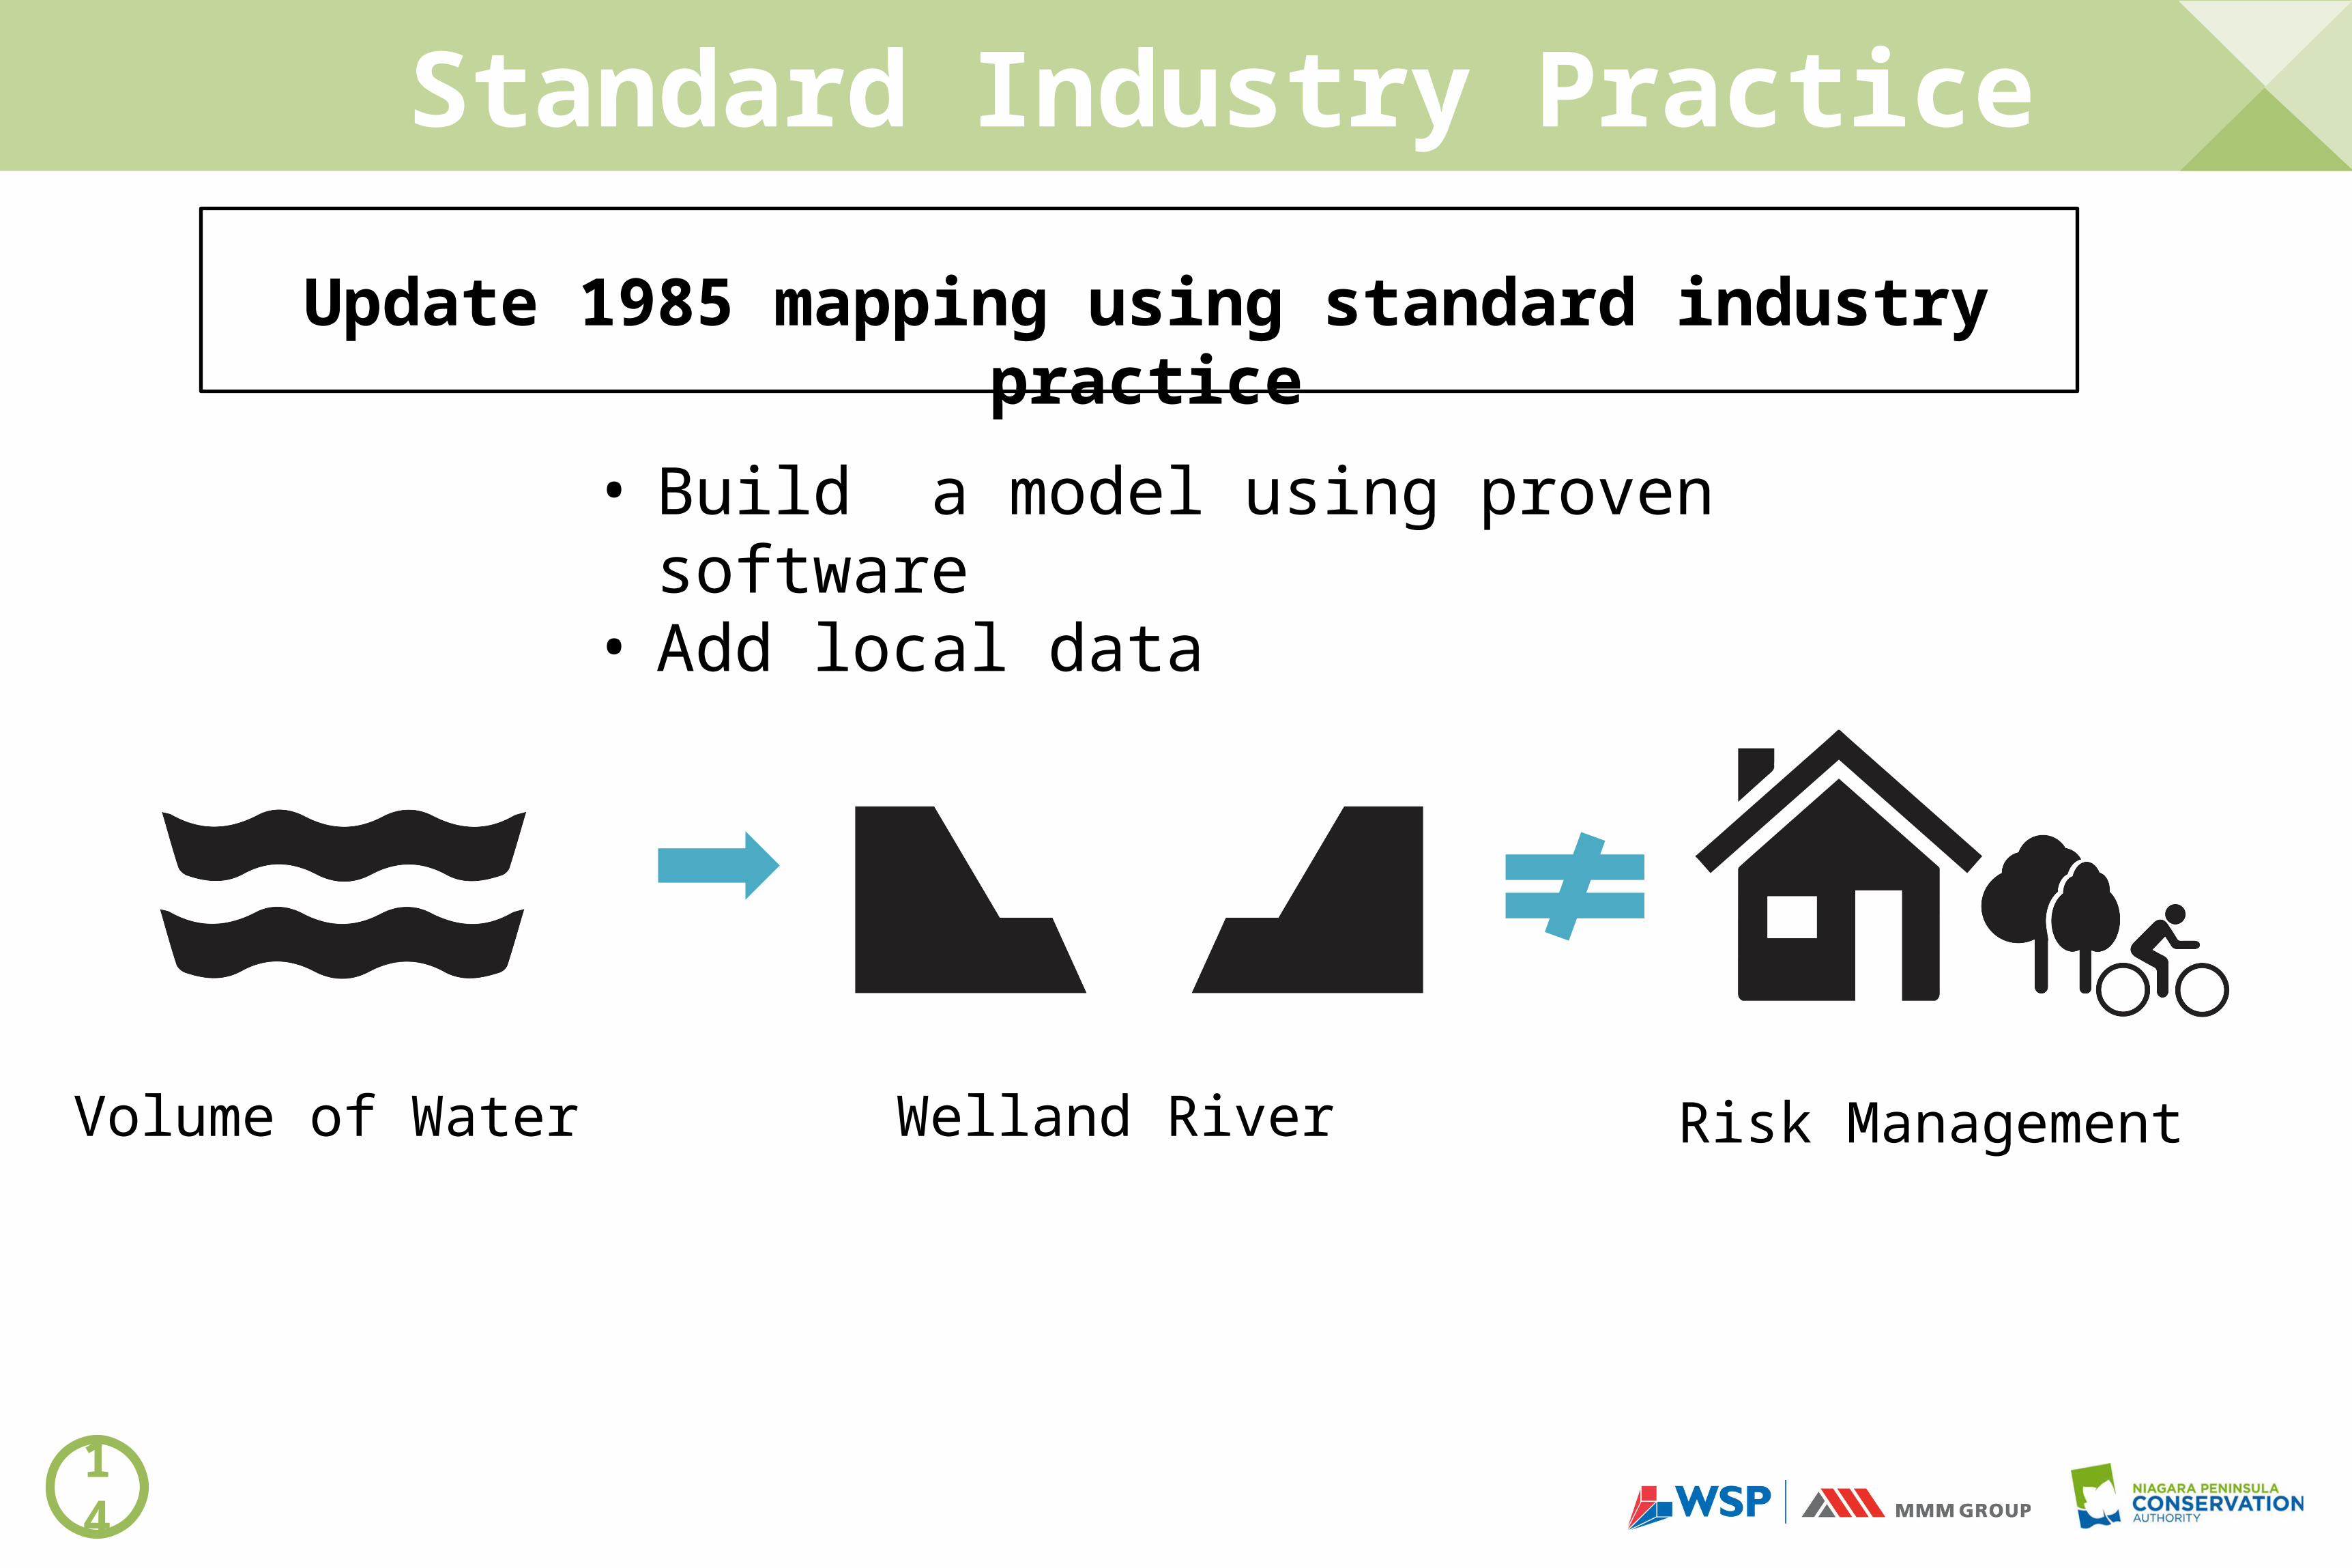
Standard Industry Practice
Update 1985 mapping using standard industry practice
• Build a model using proven software• Add local data
Volume of Water Welland River Risk Management
14

Floodplain Model for the Welland River
Overland Flow (Runoff)
A
A Stream Flow (Elevation)
B+ = C Floodline
Flood LineNormal Level
Standard industry practice, build model and input local data
B C
Flood Level
15

Floodplain Model for the Welland River
How much rain falls onto the land
1 How much water sinks into the ground, how much evaporates, and how much runoff gets into the river
2 3 How much water flows down the river once it gets into the river
We calculate volume in 3 steps
16
A

Floodplain Model for the Welland River
Rain contributes to how much water falls on the
land
Soil conditions, slope and what land is used for determines how
much sinks into the ground
17
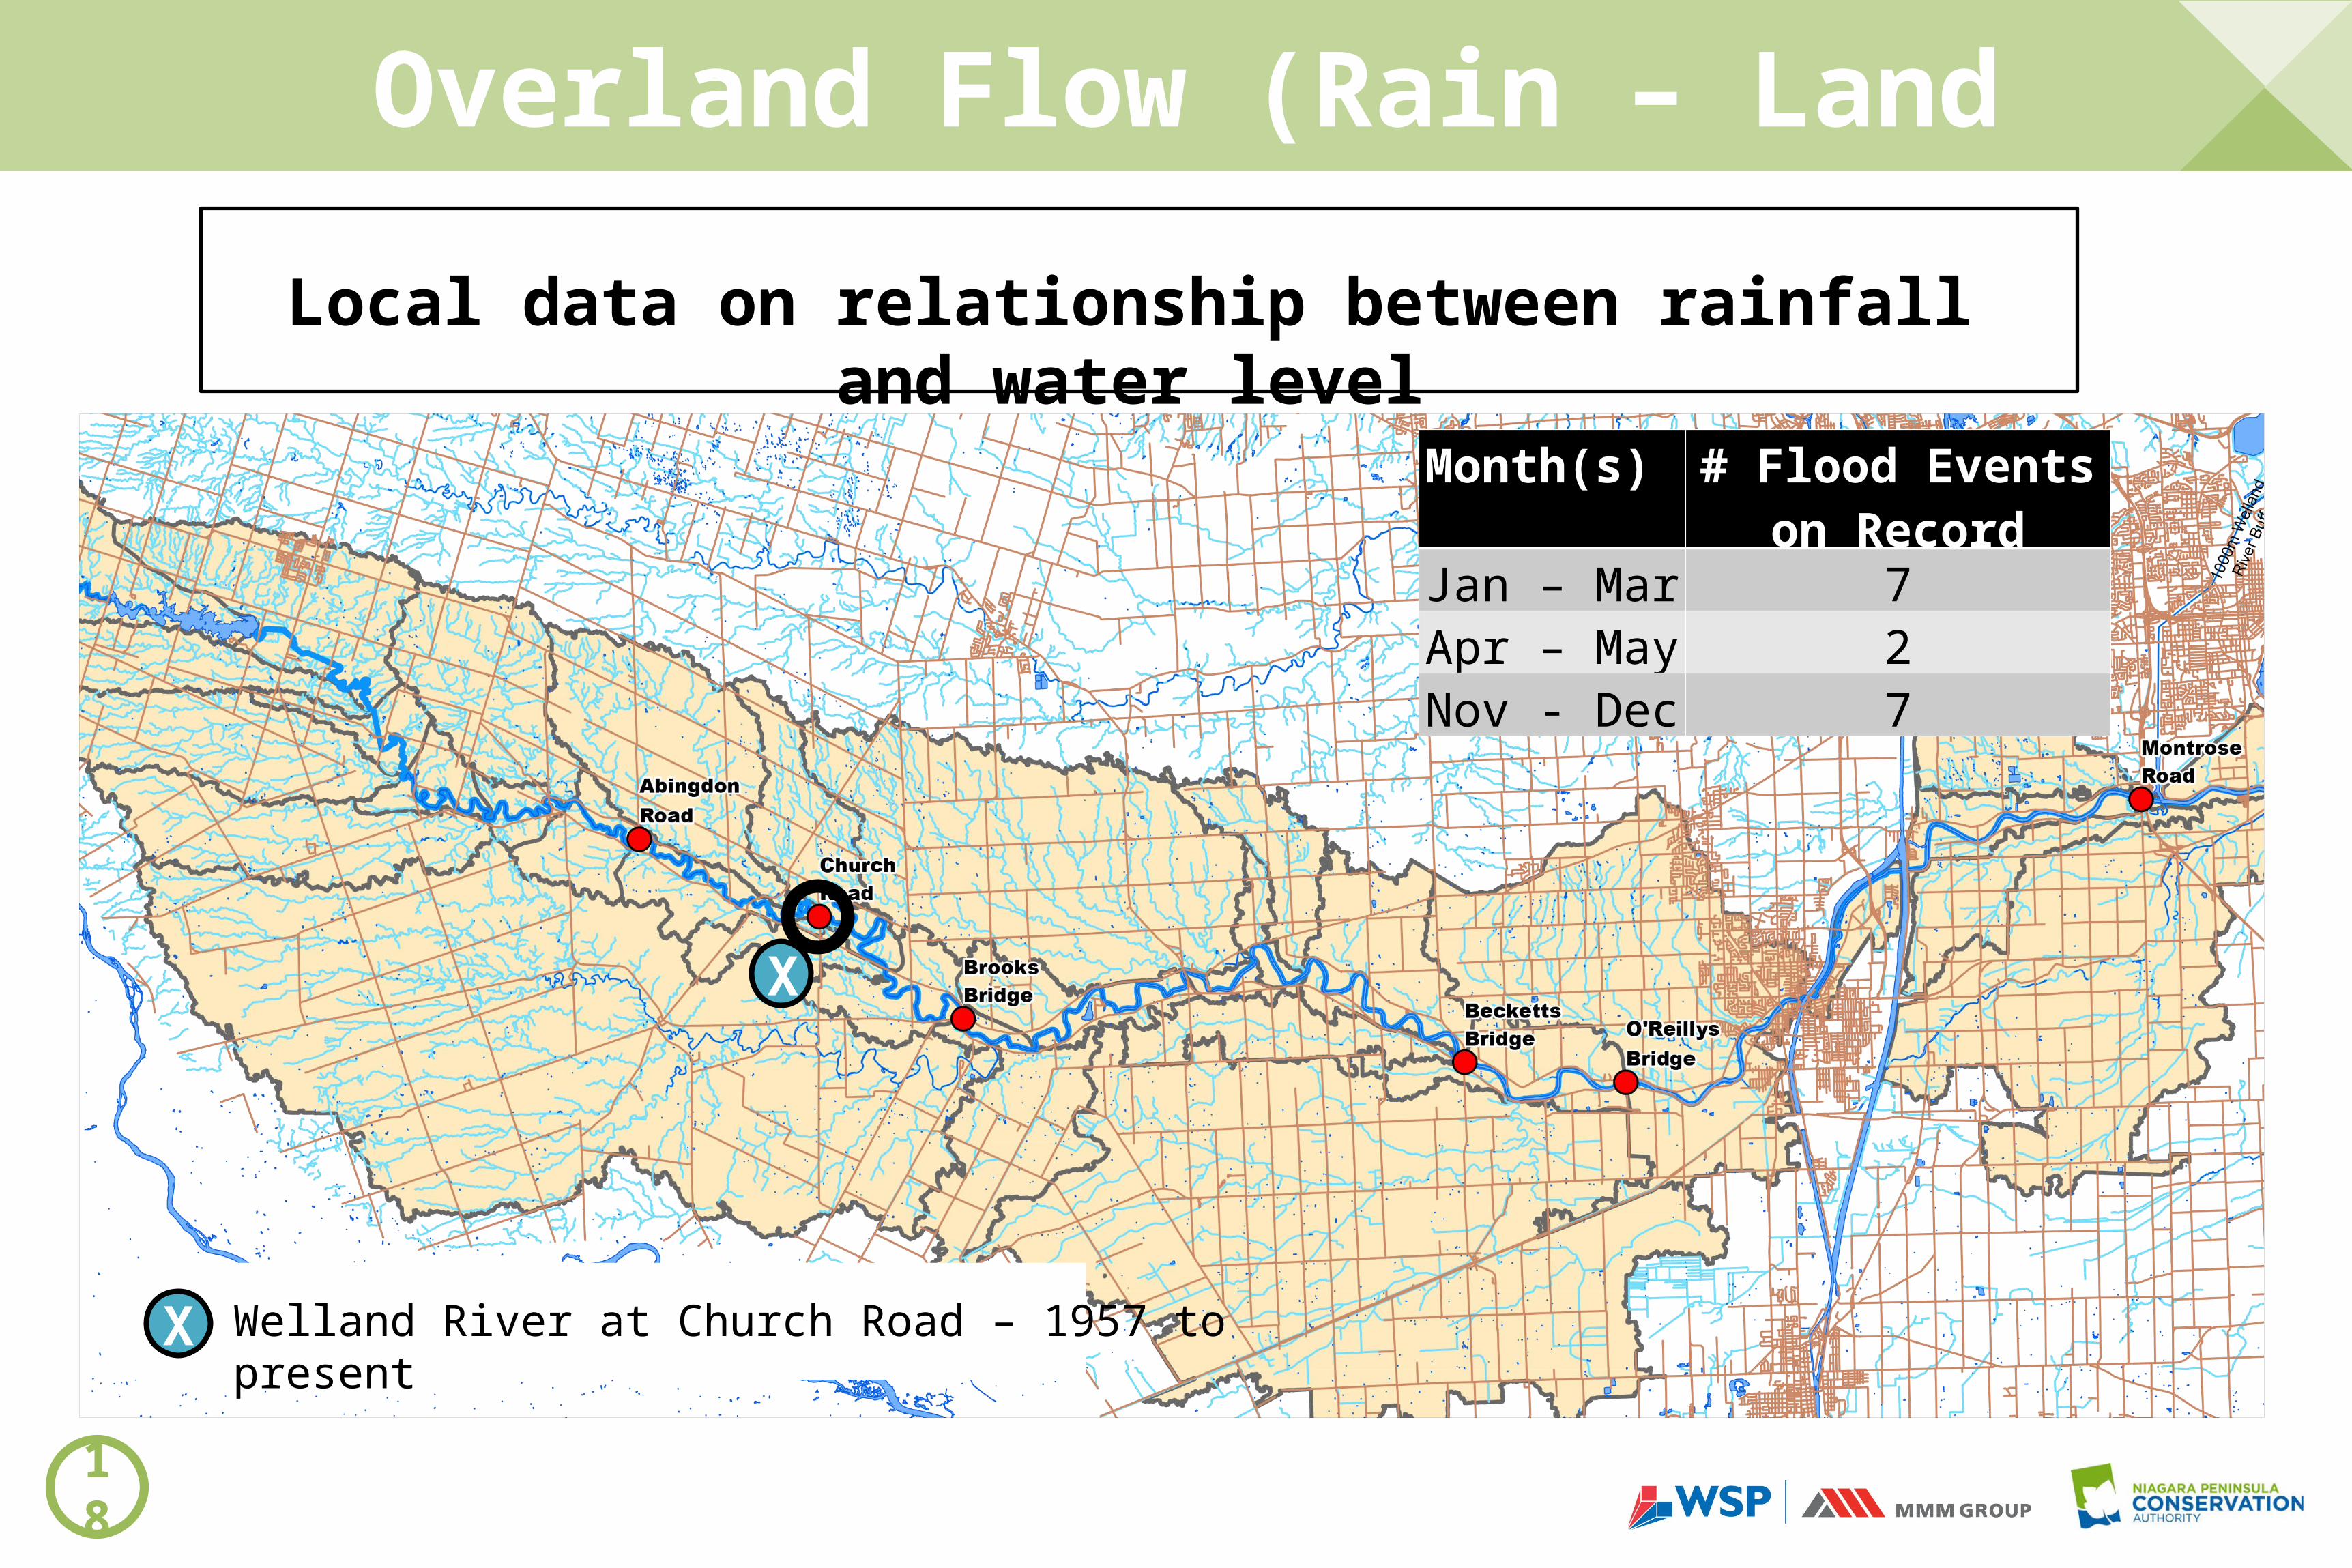
Welland River at Church Road – 1957 to present
Overland Flow (Rain – Land – Flow)
Local data on relationship between rainfall and water level
Month(s) # Flood Events on Record
Jan – Mar 7Apr – May 2Nov - Dec 7
X
18
X

Overland Flow (Rain – Land – Flow)Example of rainfall at Church Road gauge shows valid
connection between rainfall and increased flow in river
Peak Flow
ObservedFlow
ObservedRain
2006
3 days
Discharge Precipitation / Runoff Response
19
P3 P2 P1

We know from analyzing SOILS MAPS that the infiltration rates are generally consistent across the watershed therefore we can predict, with high confidence, overland flows in areas without long-term data monitors.
We also have good information on LAND USE by catchment area for each gauge station so we can adjust soils info for imperviousness due to development and still have a high confidence level that the volume of water getting to the river is accurate.
We are CALIBRATING the model using the Church Road gauge and VERIFYING it at all other gauge locations (Wellandport, O’Reillys Bridge, Old Siphon, Material Dock, Oswego Creek, Big Forks Creek).
Overland Flow (Rain – Land – Flow)
20
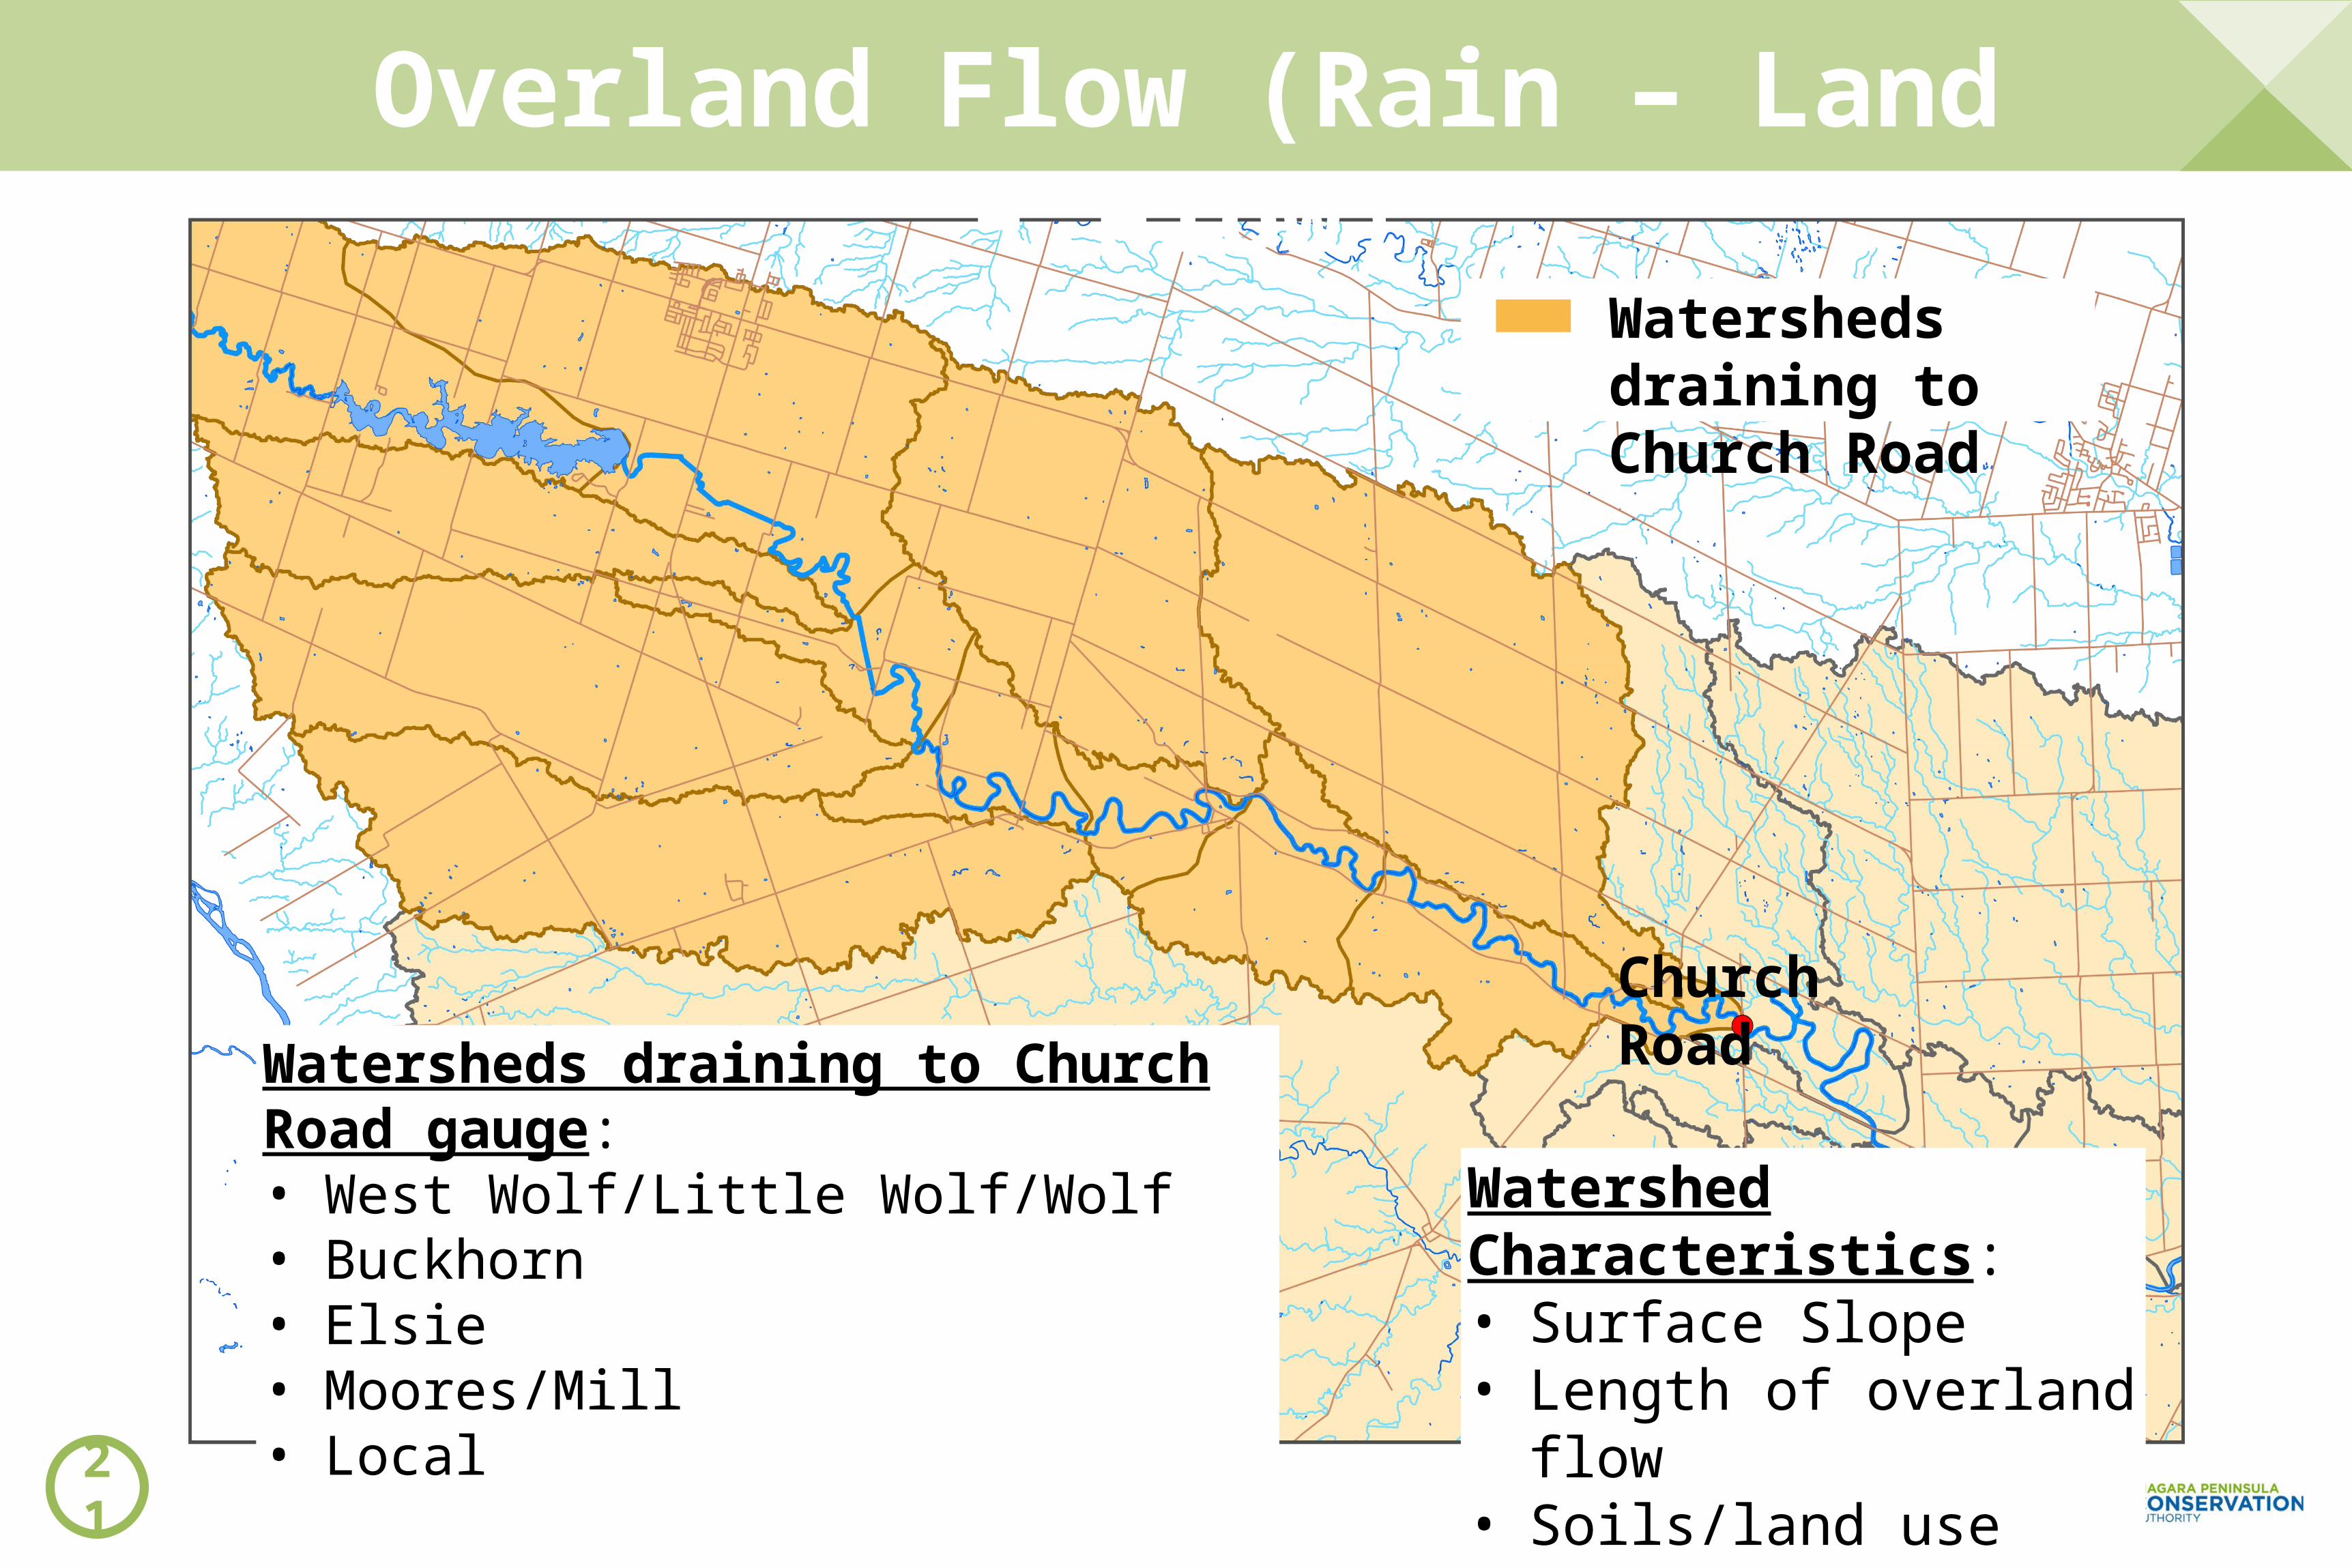
Overland Flow (Rain – Land – Flow)
Watersheds draining to Church Road gauge:• West Wolf/Little Wolf/Wolf• Buckhorn• Elsie• Moores/Mill• Local
Watershed Characteristics:• Surface Slope• Length of overland flow• Soils/land use
Church Road
Watersheds draining to Church Road
21
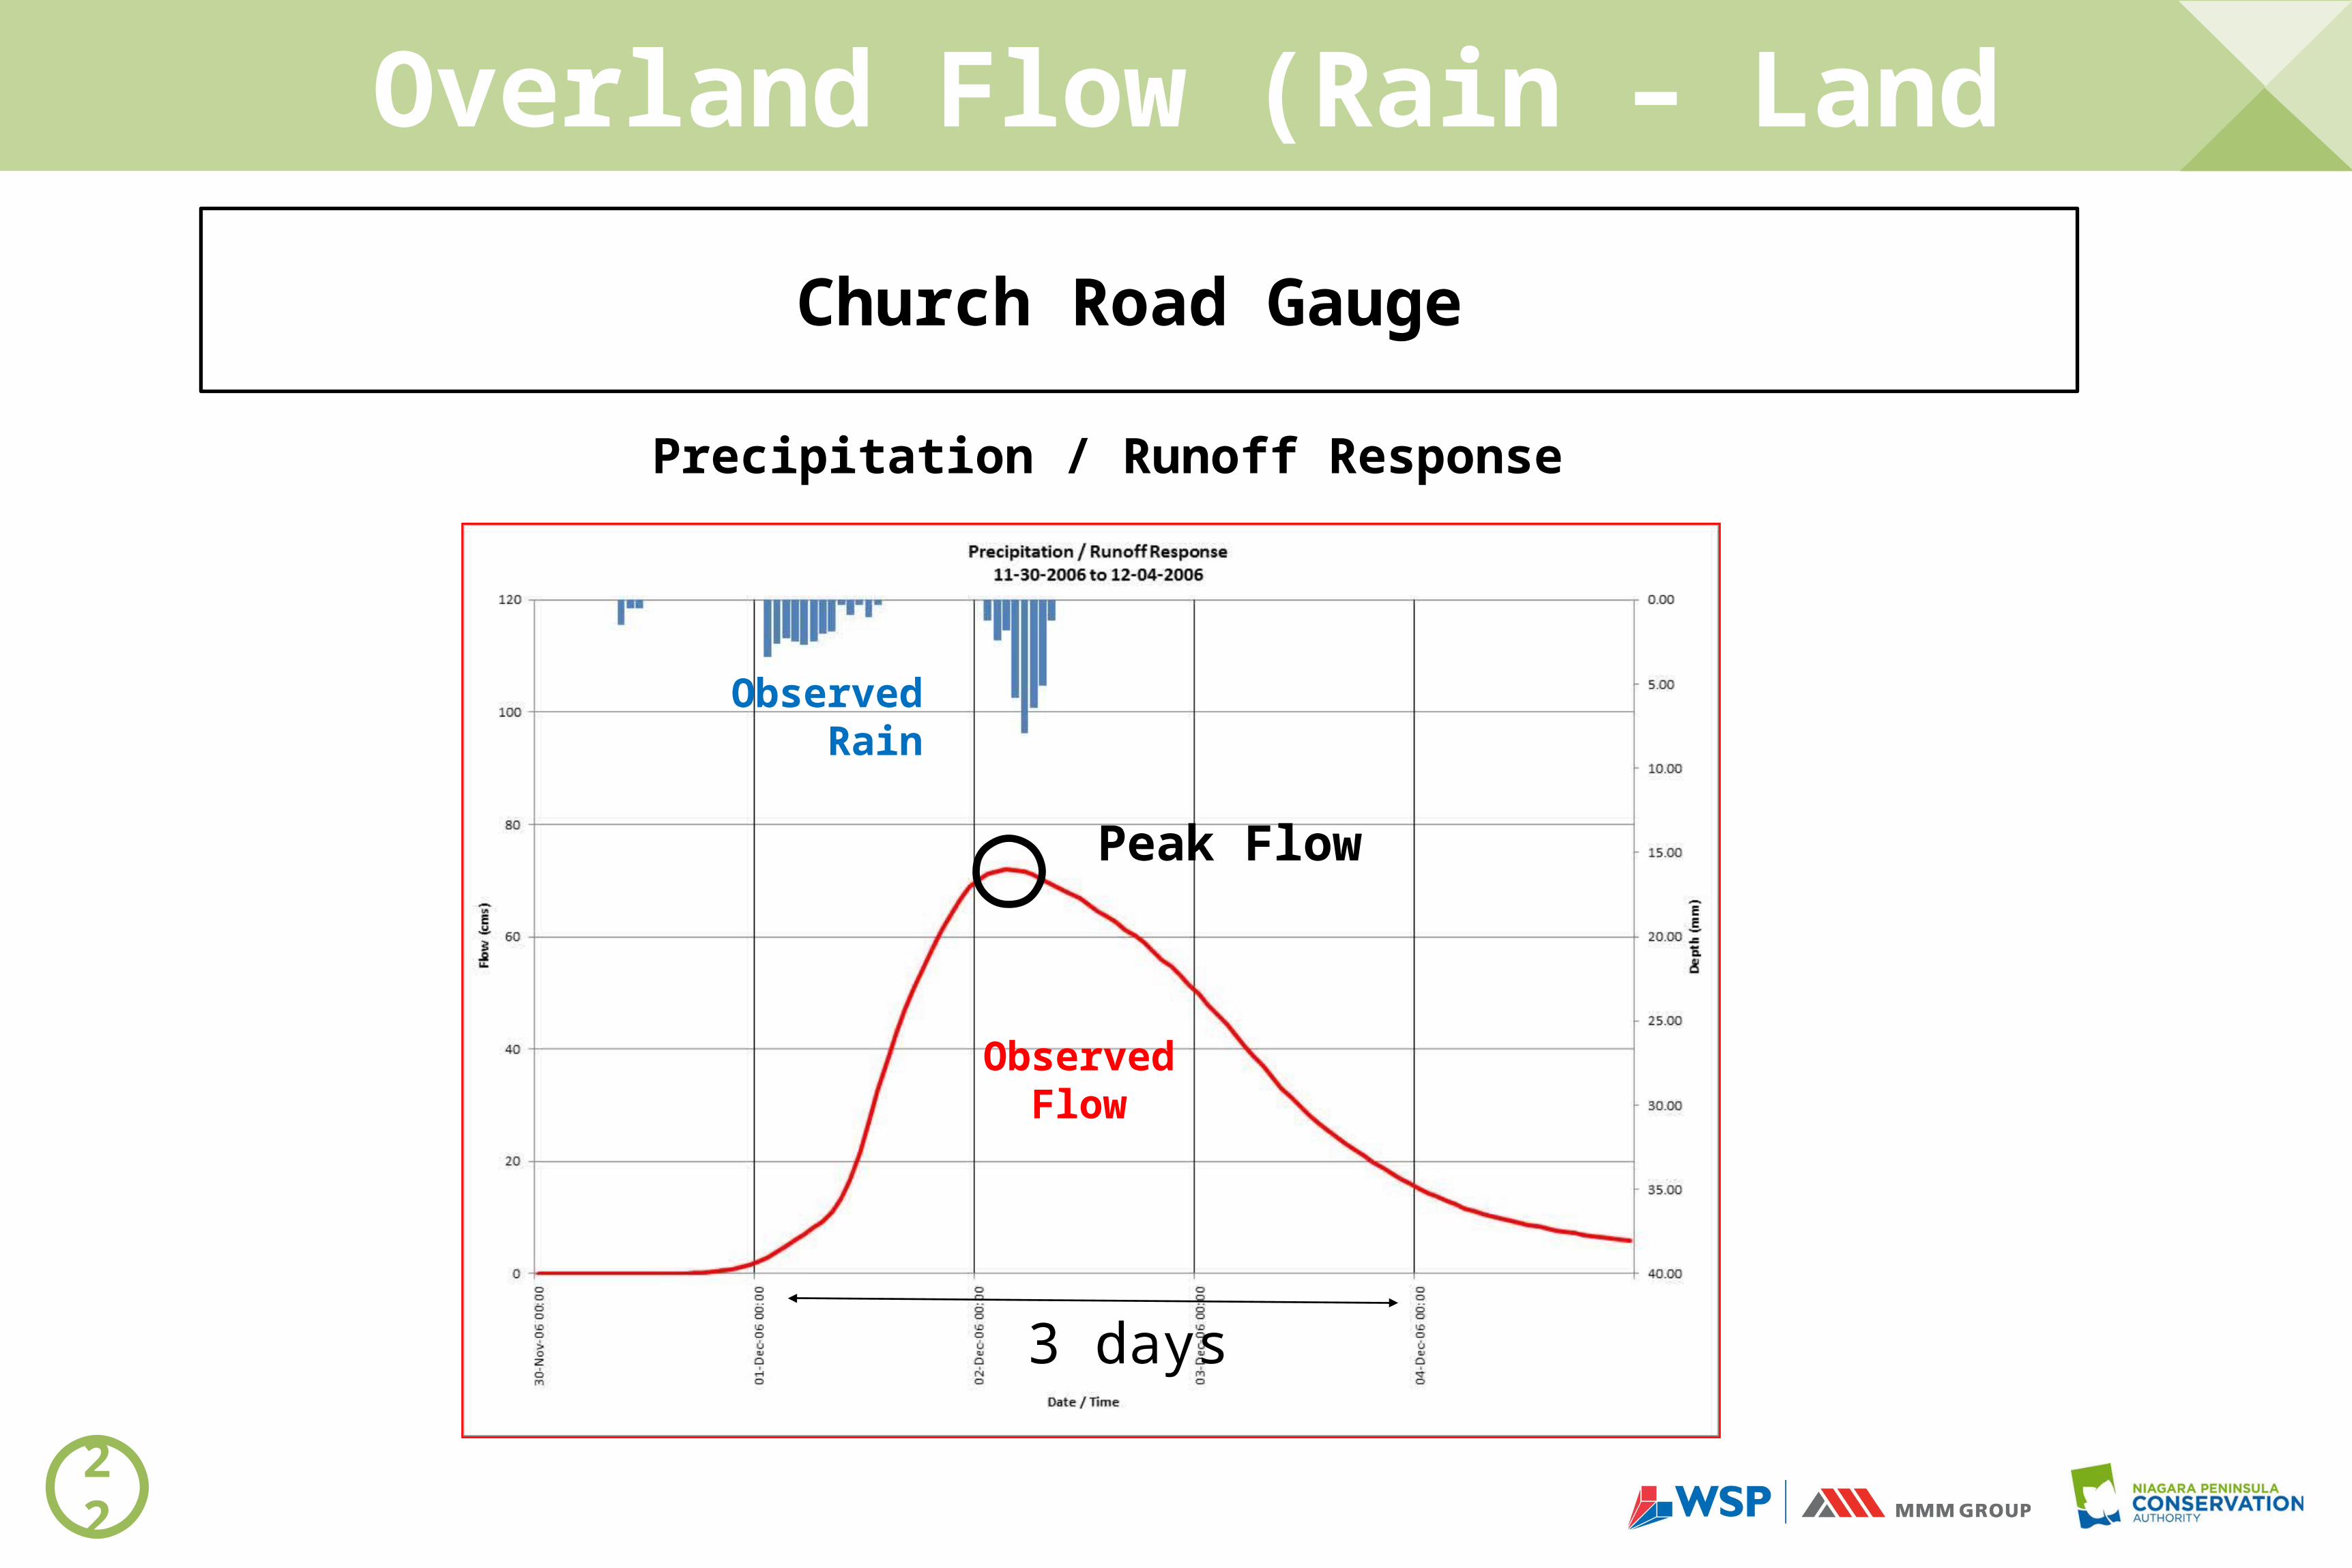
Overland Flow (Rain – Land – Flow)
Church Road Gauge
22
Peak Flow
ObservedFlow
ObservedRain
3 days
Precipitation / Runoff Response

Overland Flow Links to Stream Flow
We looked at cross sections of the river in different locations and at all bridges. This helps us understand the rivers capacity to handle the flood event.
shape and condition of the river
affects how water flows in the river once it gets there
23
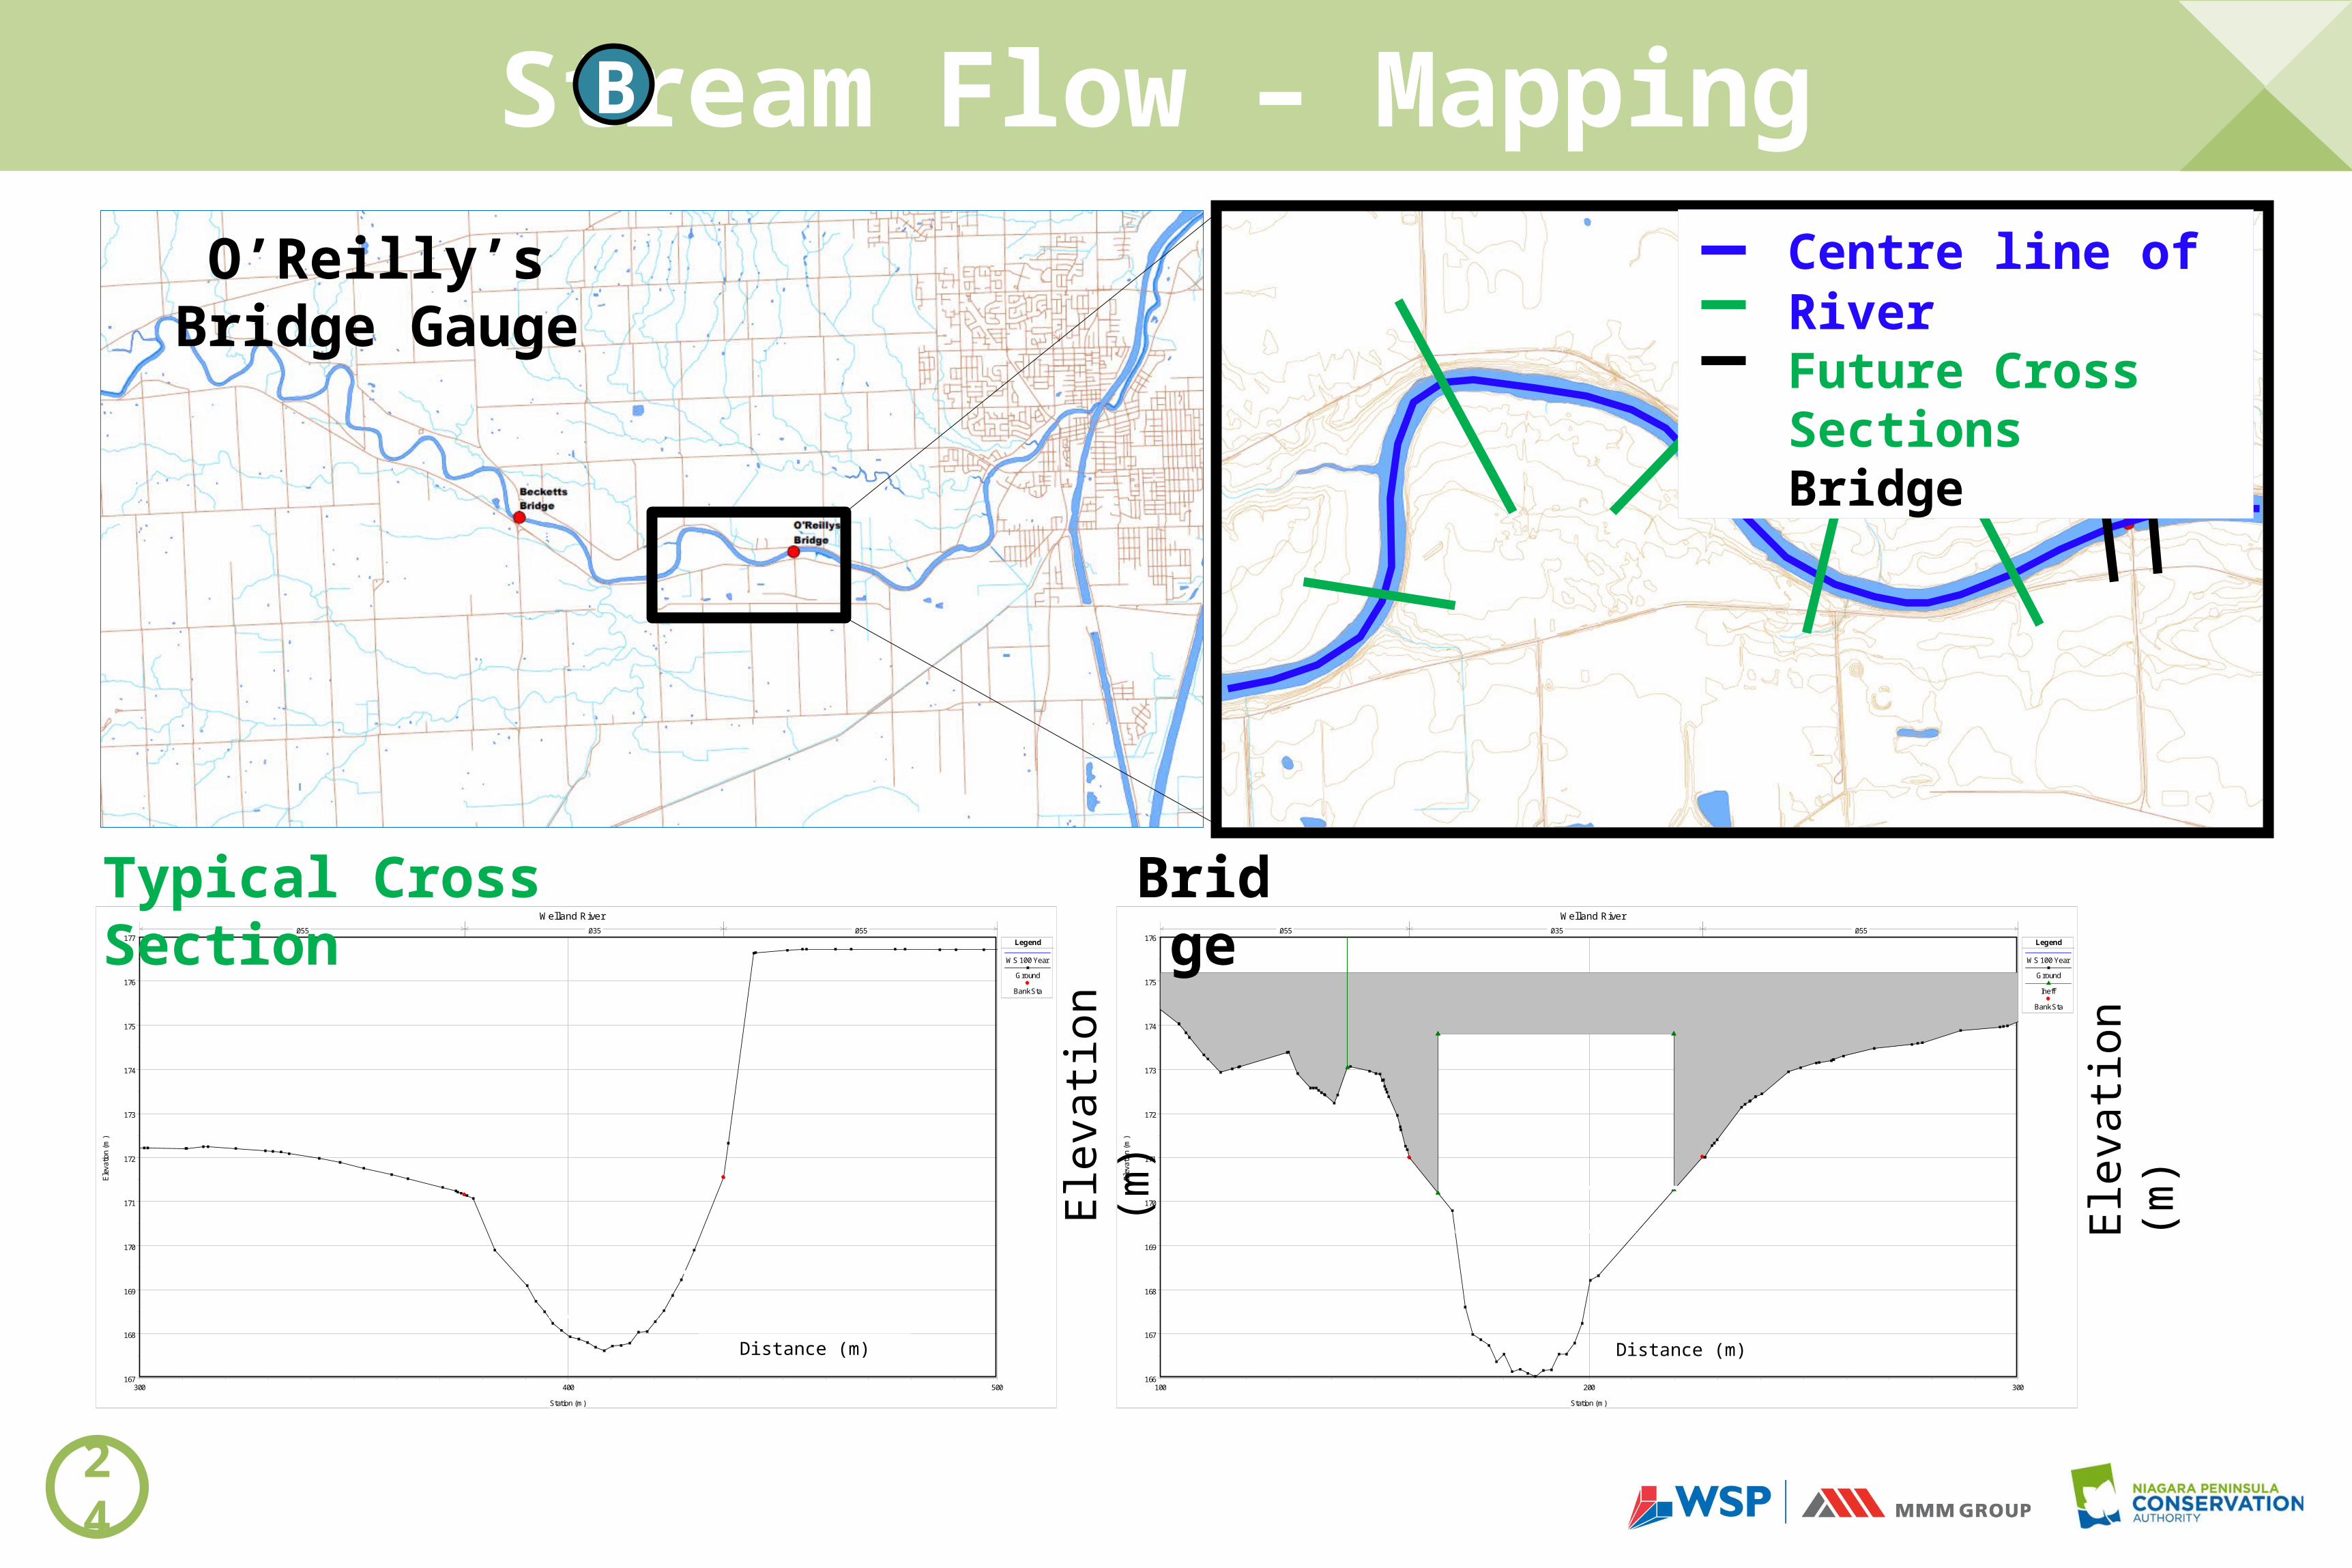
Stream Flow – Mapping
24
B
300 400 500167
168
169
170
171
172
173
174
175
176
177
Welland River
Station (m)
Elev
atio
n (m
)
Legend
WS 100 Year
Ground
Bank Sta
.055 .035 .055
100 200 300166
167
168
169
170
171
172
173
174
175
176
Welland River
Station (m)
Elev
atio
n (m
)
Legend
WS 100 Year
Ground
Ineff
Bank Sta
.055 .035 .055
BridgeTypical Cross Section
Elev
ation
(m)
Elev
ation
(m)
Distance (m) Distance (m)
Centre line of RiverFuture Cross SectionsBridge
O’Reilly’s Bridge Gauge
In order to determine what risk of flood to protect against we need to select a flood event.
100-year flood event is the minimum standard.
Means that 1% chance of that flood happening in any given year OR if thinking of a typical home mortgage, there is a 22% chance of the 100-year flood event occurring during the term of the mortgage.
Stream Flow – Flowing Water
25

Stream Flow – Flowing Water
Simulated flood event flows used for 1985 mapping (m3/s):1. Abingdon Road - 752. Church Road - 1003. Brooks Bridge -1154. Becketts Bridge - 2055. O’Reillys Bridge - 2456. Montrose Road - 275
Flood Event = 100 year event(1% chance of occurring each year)
26
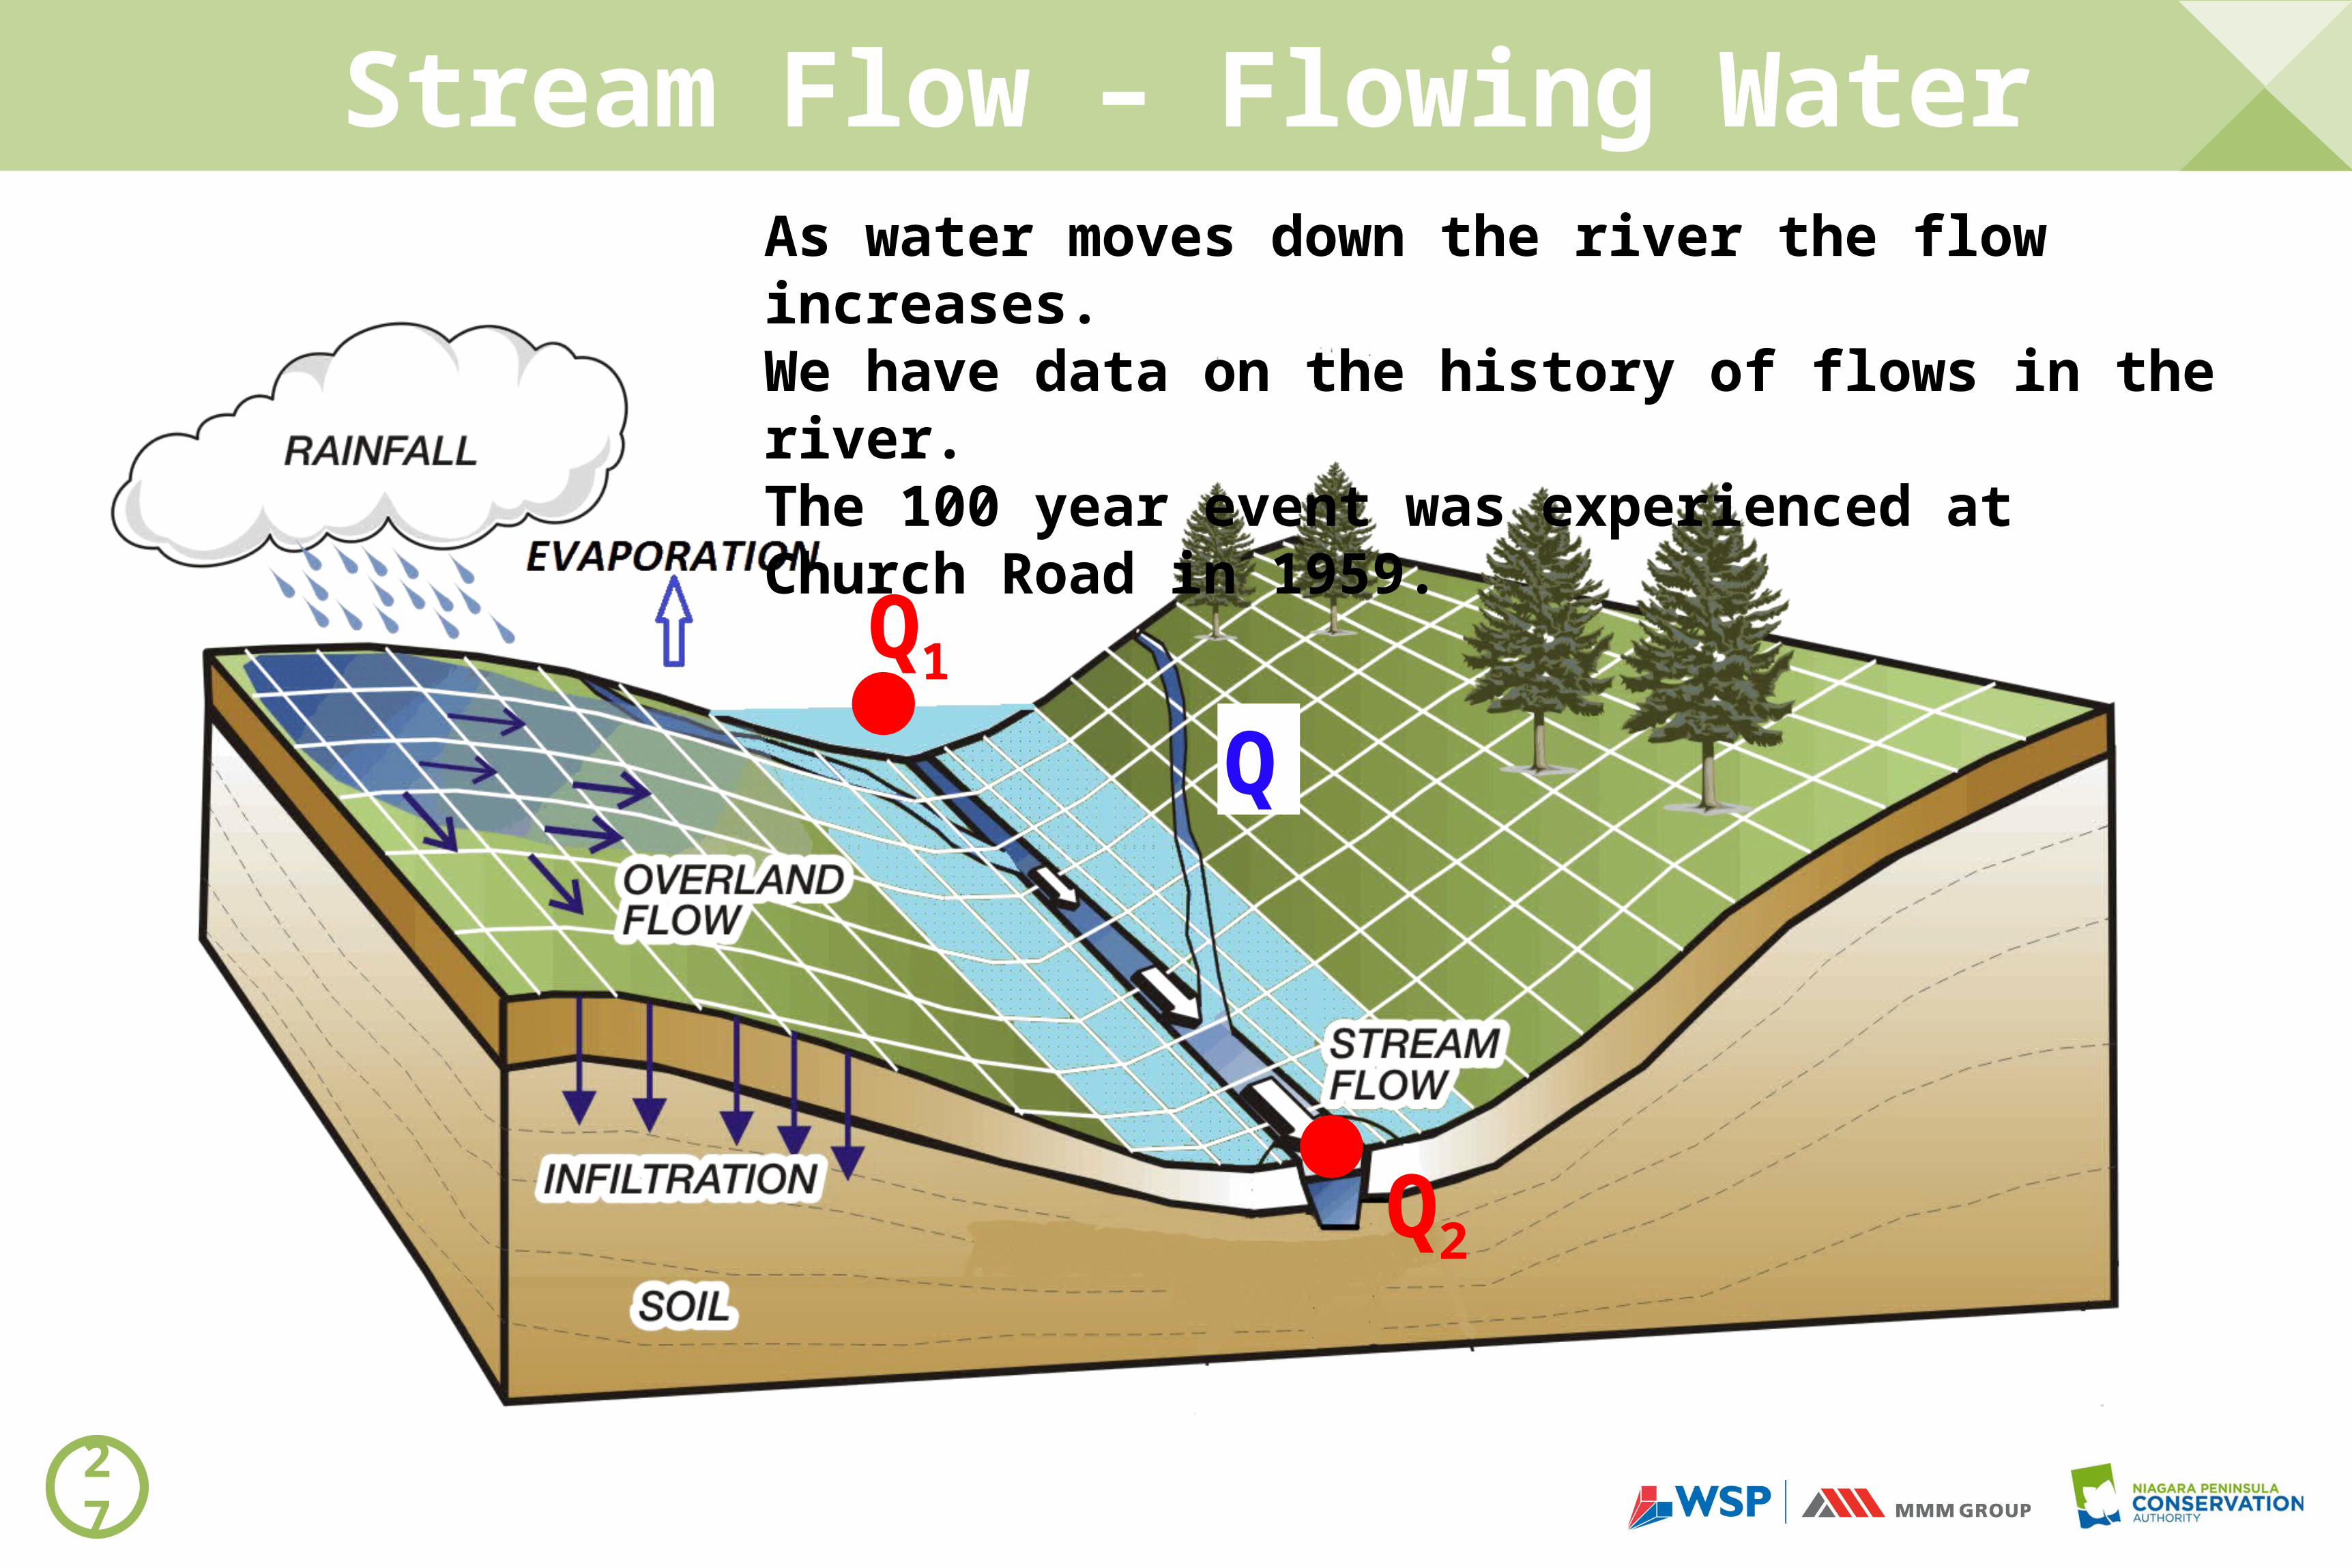
Q
Q2
Q1
As water moves down the river the flow increases.We have data on the history of flows in the river.The 100 year event was experienced at Church Road in 1959.
27
Stream Flow – Flowing Water
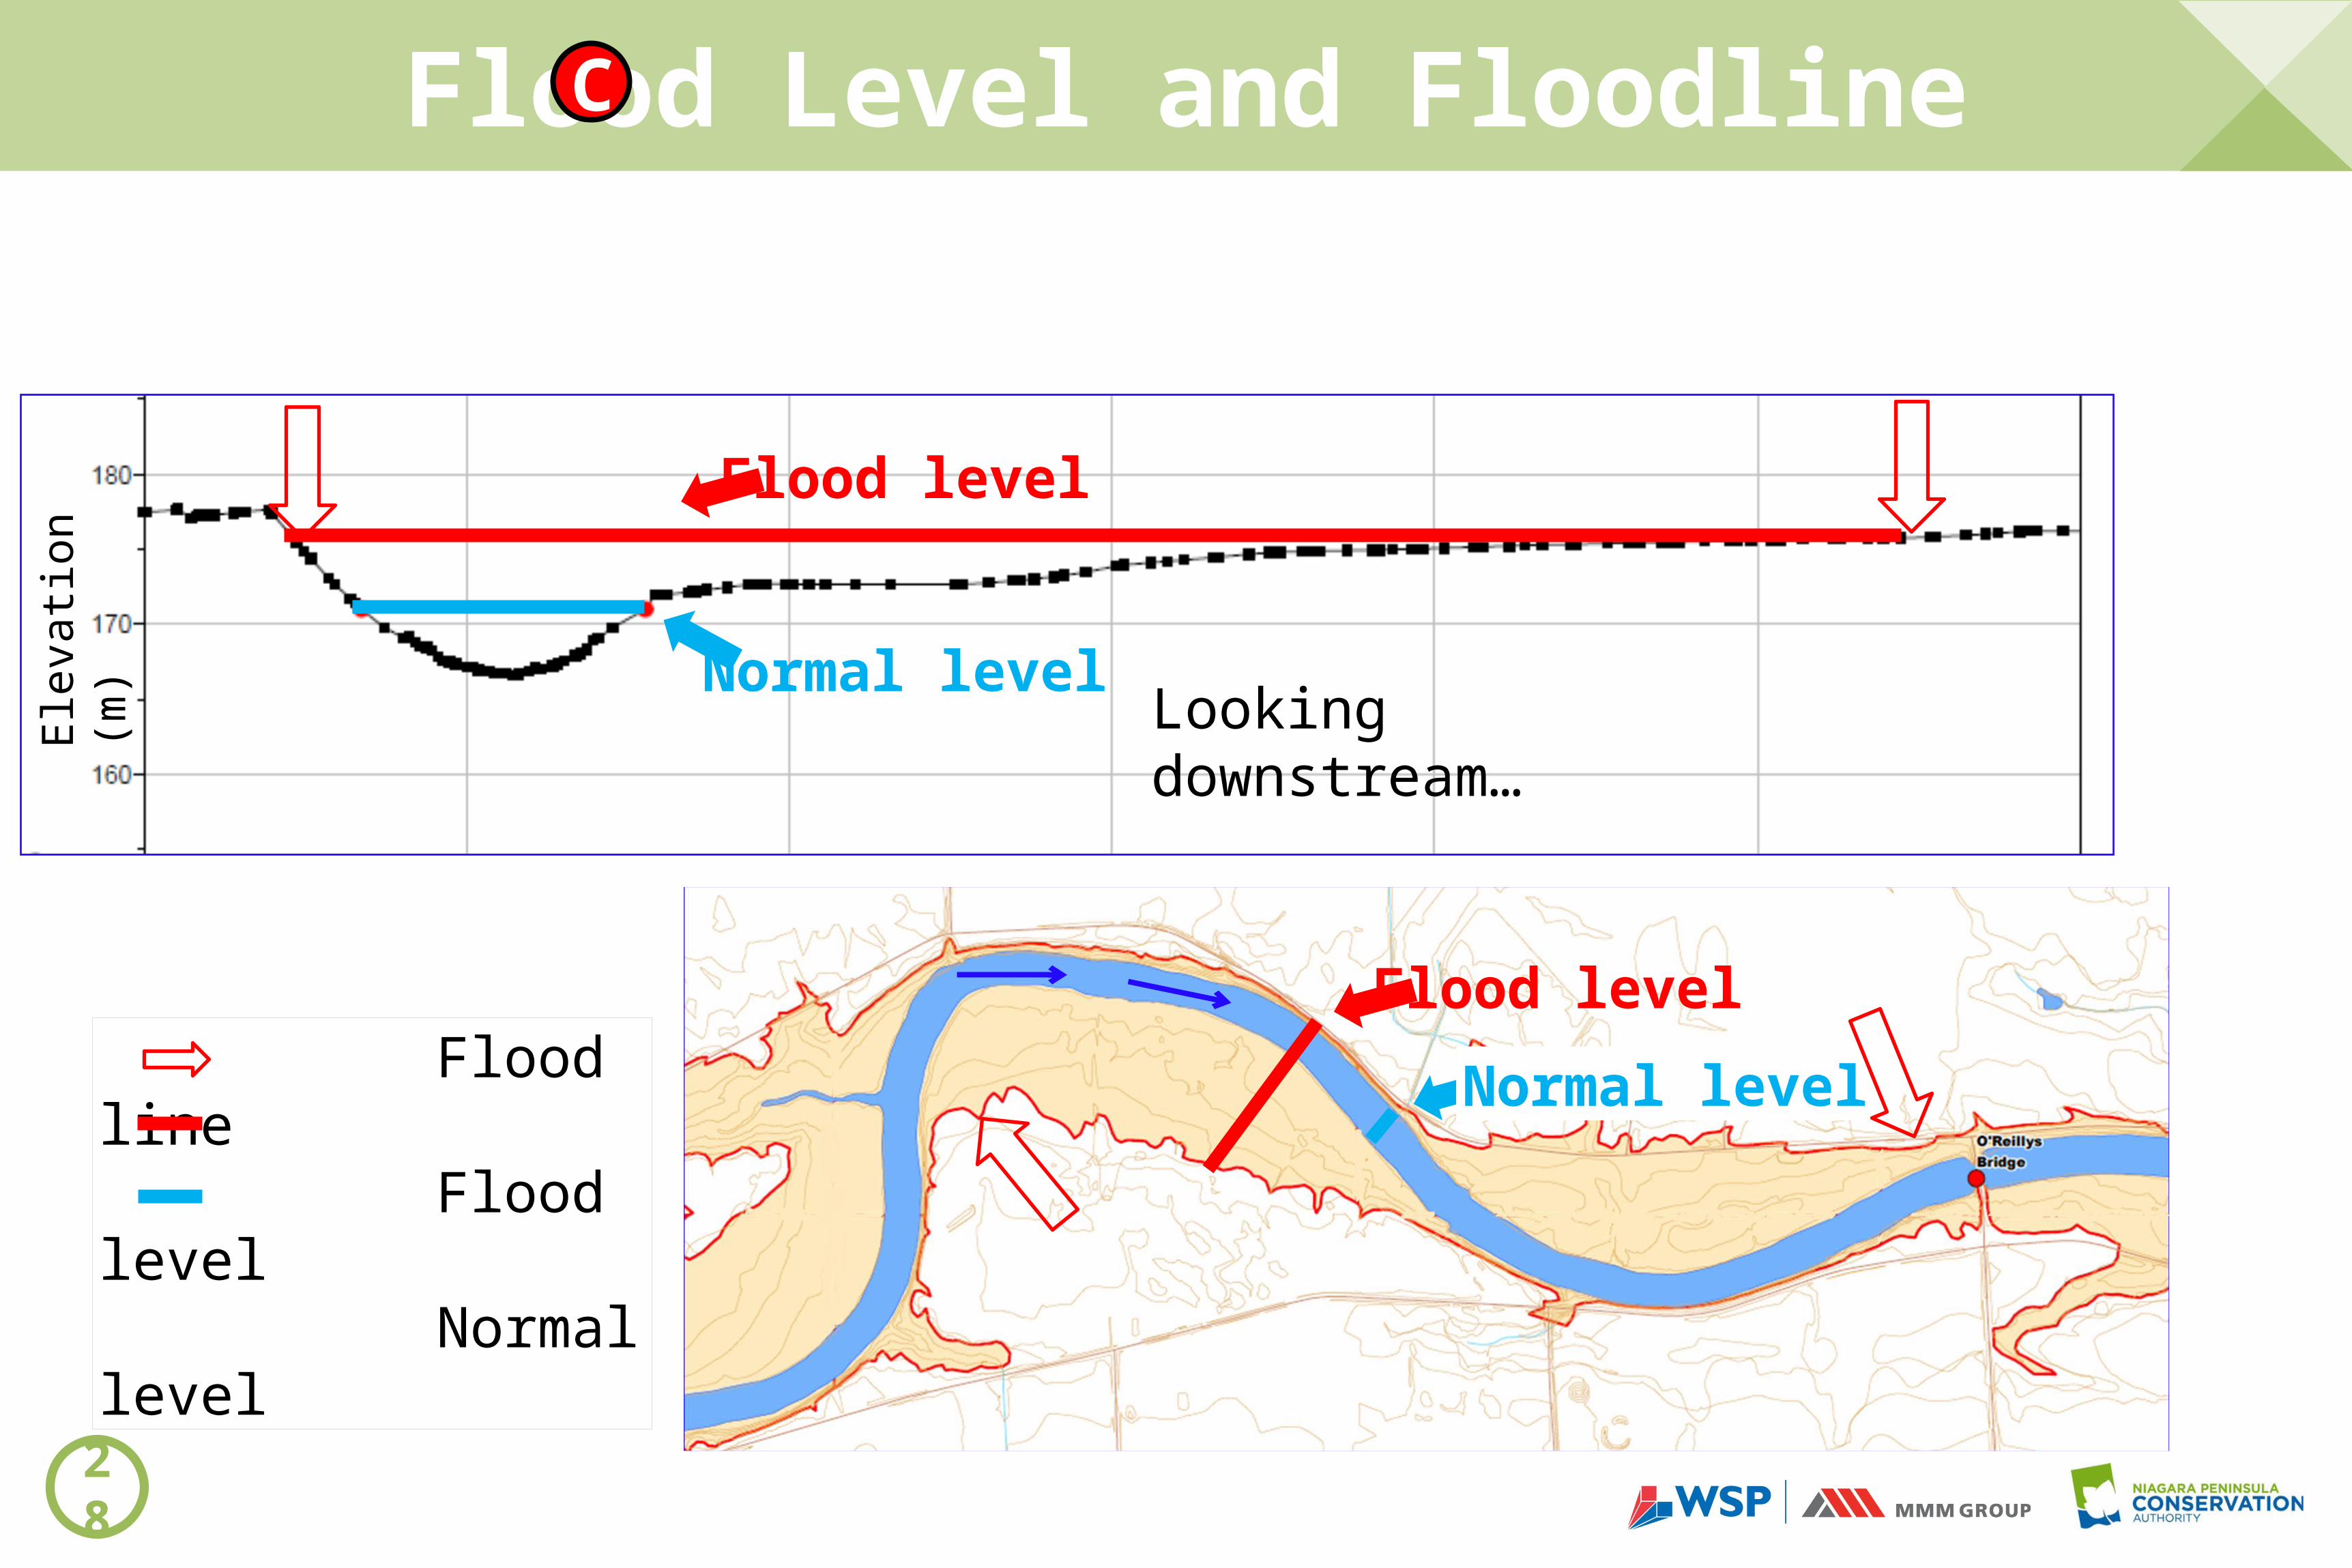
Flood line Flood level Normal level
Looking downstream…Elev
ation
(m)
Flood Level and Floodline
Flood level
Normal level
Flood level
Normal level
28
C

Summary – Floodplain Model
Overland Flow (Runoff)
A
A Stream Flow (Elevation)
B+ = C Floodline
Flood LineNormal Level
B C
Flood Level
29

Facilitated Q&A
Diego Torres Silvestre ((CC BY 2.0)