wells fargo advantage funds annual report - cme group · annual report february 28, 2010 wells...
TRANSCRIPT

Annual ReportFebruary 28, 2010
WELLS FARGO ADVANTAGE MONEY MARKET FUNDS
Administrator, Institutional, Select, and Service Class
■ Wells Fargo Advantage California Municipal Money Market Fund(formerly named Wells Fargo Advantage California Tax-Free Money Market Fund)
■ Wells Fargo Advantage Cash Investment Money Market Fund
■ Wells Fargo Advantage Government Money Market Fund
■ Wells Fargo Advantage Heritage Money Market Fund SM
■ Wells Fargo Advantage Municipal Money Market Fund
■ Wells Fargo Advantage National Tax-Free Money Market Fund
■ Wells Fargo Advantage Prime Investment Money Market Fund
■ Wells Fargo Advantage Treasury Plus Money Market Fund
■ Wells Fargo Advantage 100% Treasury Money Market Fund


Contents
Reduce clutter. Save trees.
Sign up for electronic delivery ofprospectuses and shareholder reports atwww.wellsfargo.com/advantagedelivery
Letter to Shareholders . . . . . . . . . . . . . . . . . . . . . . . . . . . . . . . . . . . . . . . . . . . . . . . . . . . . . . . 2Money Market Overview . . . . . . . . . . . . . . . . . . . . . . . . . . . . . . . . . . . . . . . . . . . . . . . . . . . . 4Performance HighlightsCalifornia Municipal Money Market Fund . . . . . . . . . . . . . . . . . . . . . . . . . . . . . . . . . . . . . 10Cash Investment Money Market Fund . . . . . . . . . . . . . . . . . . . . . . . . . . . . . . . . . . . . . . . . 12Government Money Market Fund . . . . . . . . . . . . . . . . . . . . . . . . . . . . . . . . . . . . . . . . . . . . 14Heritage Money Market Fund . . . . . . . . . . . . . . . . . . . . . . . . . . . . . . . . . . . . . . . . . . . . . . . . 16Municipal Money Market Fund . . . . . . . . . . . . . . . . . . . . . . . . . . . . . . . . . . . . . . . . . . . . . . . 18National Tax-Free Money Market Fund . . . . . . . . . . . . . . . . . . . . . . . . . . . . . . . . . . . . . . . 20Prime Investment Money Market Fund . . . . . . . . . . . . . . . . . . . . . . . . . . . . . . . . . . . . . . . 22Treasury Plus Money Market Fund . . . . . . . . . . . . . . . . . . . . . . . . . . . . . . . . . . . . . . . . . . . . 24100% Treasury Money Market Fund . . . . . . . . . . . . . . . . . . . . . . . . . . . . . . . . . . . . . . . . . . . 26
Fund Expenses . . . . . . . . . . . . . . . . . . . . . . . . . . . . . . . . . . . . . . . . . . . . . . . . . . . . . . . . . . . . . . 28
Portfolio of InvestmentsCalifornia Municipal Money Market Fund . . . . . . . . . . . . . . . . . . . . . . . . . . . . . . . . . . . . . 31Cash Investment Money Market Fund . . . . . . . . . . . . . . . . . . . . . . . . . . . . . . . . . . . . . . . . 40Government Money Market Fund . . . . . . . . . . . . . . . . . . . . . . . . . . . . . . . . . . . . . . . . . . . . 53Heritage Money Market Fund . . . . . . . . . . . . . . . . . . . . . . . . . . . . . . . . . . . . . . . . . . . . . . . . 58Municipal Money Market Fund . . . . . . . . . . . . . . . . . . . . . . . . . . . . . . . . . . . . . . . . . . . . . . . 71National Tax-Free Money Market Fund . . . . . . . . . . . . . . . . . . . . . . . . . . . . . . . . . . . . . . . 77Prime Investment Money Market Fund . . . . . . . . . . . . . . . . . . . . . . . . . . . . . . . . . . . . . . . 95Treasury Plus Money Market Fund . . . . . . . . . . . . . . . . . . . . . . . . . . . . . . . . . . . . . . . . . . . . 107100% Treasury Money Market Fund . . . . . . . . . . . . . . . . . . . . . . . . . . . . . . . . . . . . . . . . . . . 108
Financial StatementsStatements of Assets and Liabilities . . . . . . . . . . . . . . . . . . . . . . . . . . . . . . . . . . . . . . . . . . . 110Statements of Operations . . . . . . . . . . . . . . . . . . . . . . . . . . . . . . . . . . . . . . . . . . . . . . . . . . . . 114Statements of Changes in Net Assets . . . . . . . . . . . . . . . . . . . . . . . . . . . . . . . . . . . . . . . . . 116Financial Highlights . . . . . . . . . . . . . . . . . . . . . . . . . . . . . . . . . . . . . . . . . . . . . . . . . . . . . . . . . . 126
Notes to Financial Statements . . . . . . . . . . . . . . . . . . . . . . . . . . . . . . . . . . . . . . . . . . . . . . . . . 134
Report of Independent Registered Public Accounting Firm . . . . . . . . . . . . . . . . . . . 140
Other Information . . . . . . . . . . . . . . . . . . . . . . . . . . . . . . . . . . . . . . . . . . . . . . . . . . . . . . . . . . . . . . 141
List of Abbreviations . . . . . . . . . . . . . . . . . . . . . . . . . . . . . . . . . . . . . . . . . . . . . . . . . . . . . . . . 145
The views expressed are as of February 28, 2010, and are those of the Fund managers. Any reference to aspecific security in this report is not a recommendation to purchase or sell any specific security or adopt anyinvestment strategy. The views are subject to change at any time in response to changing circumstances in themarket and are not intended to predict or guarantee the future performance of any individual security, marketsector or the markets generally, or the Wells Fargo Advantage Money Market Funds.

Not part of the annual report.
WELLS FARGO INVESTMENT HISTORY
1971 Introduced one of the first institutionalindex funds.
1978 One of the first firms to apply assetallocation theory to investmentportfolio management.
1985 One of the first firms to create a three-way asset allocation fund that “tilts”investments toward portions of themarket that our proprietary modelsindicate will perform better.
1994 Introduced target date funds thatautomatically reallocate the asset mixover specific time horizons.
1997 Wells Fargo launched the WealthBuilderPortfolios, a unique “fund of funds” thatuses flexible asset allocation strategiesto shift assets.
1999 Reorganized the Norwest AdvantageFunds® and Stagecoach Funds® intothe Wells Fargo Funds®.
2003 Expanded fixed-income, small cap, and emerging markets lineup fromMontgomery Asset Management, LLC.
2004 Added additional large cap and mid capfunds to the lineup by adopting theCooke & Bieler value funds.
2005 Wells Fargo Funds merged with StrongFunds to become Wells FargoAdvantage Funds, forming a fundfamily of over 100 funds and placing it among the top 20 mutual fundfamilies in the United States.
2006 Enhanced and renamed the Wells FargoAdvantage Outlook FundsSM to theWells Fargo Advantage Dow JonesTarget Date FundsSM, which seek toreplicate returns of the appropriate DowJones Target Date Indexes, the first lifecycle indexes in the investment industry.
Wells Fargo Advantage Funds®
Wells Fargo Advantage Funds skillfully guides institutions, financial advisors, andindividuals through the investment terrain to help them reach their financialobjectives. Everything we do on behalf of our investors is backed by our uniquecombination of qualifications.
Strength Our organization is built on the standards of integrity and service established byour parent company—Wells Fargo & Company—more than 150 years ago. Ourdiverse family of mutual funds covers a broad spectrum of investment styles andasset classes. And, because we’re part of a widely diversified financial enterprise,we offer the scale and resources to help investors succeed, providing access tocomplementary solutions such as separately managed accounts, college investingplans, and retirement plans.
ExpertiseOur approach to investing is guided by the belief that agile, independentinvestment teams—each with its own distinct strengths and disciplines—providea superior level of insight and expertise. Each team is free to concentrate onmanaging money through well-defined philosophies and processes that haveproven to be consistent and repeatable over time.
Partnership Our collaborative approach is built around understanding the needs and goals ofour clients. By adhering to core principles of sound judgment and steady guidance,we support you through every stage of the investment decision process.
For 529 plans, an investor’s or a designated beneficiary’s home state may offer statetax or other benefits that are only available for investments in that state’s qualifiedtuition program. Please consider this before investing.
Carefully consider the investment objectives, risks, charges, and expenses before investing.For a current prospectus for Wells Fargo Advantage Funds or a current programdescription for certain 529 college savings plans, containing this and other information,visit www.wellsfargo.com/advantagefunds. Read it carefully before investing.
Wells Fargo Funds Management, LLC, a wholly owned subsidiary of Wells Fargo & Company, providesinvestment advisory and administrative services for Wells Fargo Advantage Funds, the Wells FargoAdvisorSM program, Wells Fargo Managed Account Services, and certain 529 college savings plans.Other affiliates of Wells Fargo & Company provide subadvisory and other services for the Funds. TheFunds and shares in the 529 plans are distributed by Wells Fargo Funds Distributor, LLC, MemberFINRA/SIPC, an affiliate of Wells Fargo & Company.

Not part of the annual report.
Wells Fargo Advantage Funds offers more than 100 mutual funds across a wide range of asset classes,representing over $170 billion in assets under management, as of February 28, 2010.
An investment in a money market fund is not insured or guaranteed by the Federal Deposit Insurance Corporation or any other government agency. Although the WellsFargo Advantage Money Market Funds seek to preserve the value of your investment at $1.00 per share, it is possible to lose money by investing in a money market fund.
1. The U.S. government guarantee applies to certain of the underlying securities and NOT to shares of the Fund.
2. The full name of this Fund series is the Wells Fargo Advantage Dow Jones Target Date FundsSM.
3. The Variable Trust Funds are generally available only through insurance company variable contracts.
† In this report, the Wells Fargo Advantage Discovery FundSM, Wells Fargo Advantage Endeavor Select FundSM, Wells Fargo Advantage Enterprise FundSM, WellsFargo Advantage Opportunity FundSM, Wells Fargo Advantage Social Sustainability FundSM, Wells Fargo Advantage WealthBuilder Conservative AllocationPortfolioSM, Wells Fargo Advantage WealthBuilder Equity PortfolioSM, Wells Fargo Advantage WealthBuilder Growth Allocation PortfolioSM, Wells Fargo AdvantageWealthBuilder Growth Balanced PortfolioSM, Wells Fargo Advantage WealthBuilder Moderate Balanced PortfolioSM, Wells Fargo Advantage WealthBuilderTactical Equity PortfolioSM, Wells Fargo Advantage Dow Jones Target Today FundSM, Wells Fargo Advantage Dow Jones Target 2010 FundSM, Wells FargoAdvantage Dow Jones Target 2015 FundSM, Wells Fargo Advantage Dow Jones Target 2020 FundSM, Wells Fargo Advantage Dow Jones Target 2025 FundSM,Wells Fargo Advantage Dow Jones Target 2030 FundSM, Wells Fargo Advantage Dow Jones Target 2035 FundSM, Wells Fargo Advantage Dow Jones Target2040 FundSM, Wells Fargo Advantage Dow Jones Target 2045 FundSM, Wells Fargo Advantage Dow Jones Target 2050 FundSM, Wells Fargo Advantage HeritageMoney Market FundSM, Wells Fargo Advantage Overland Express Sweep FundSM, Wells Fargo Advantage VT Discovery FundSM, and Wells Fargo Advantage VTOpportunity FundSM are referred to as the Discovery Fund, Endeavor Select Fund, Enterprise Fund, Opportunity Fund, Social Sustainability Fund,WealthBuilder Conservative Allocation Portfolio, WealthBuilder Equity Portfolio, WealthBuilder Growth Allocation Portfolio, WealthBuilder GrowthBalanced Portfolio, WealthBuilder Moderate Balanced Portfolio, WealthBuilder Tactical Equity Portfolio, Target Today Fund, Target 2010 Fund, Target2015 Fund, Target 2020 Fund, Target 2025 Fund, Target 2030 Fund, Target 2035 Fund, Target 2040 Fund, Target 2045 Fund, Target 2050 Fund, HeritageMoney Market Fund, Overland Express Sweep Fund, VT Discovery Fund, and VT Opportunity Fund, respectively.
Asia Pacific FundC&B Large Cap Value FundC&B Mid Cap Value FundCapital Growth FundCommon Stock FundDiscovery Fund†
Diversified Equity FundDiversified International FundDiversified Small Cap FundEmerging Growth FundEmerging Markets Equity FundEndeavor Select Fund†
Enterprise Fund†
Equity Income Fund
Equity Value FundGrowth FundGrowth Equity FundIndex FundInternational Core FundInternational Value FundLarge Cap Appreciation FundLarge Cap Growth FundLarge Company Core FundLarge Company Growth FundLarge Company Value FundMid Cap Disciplined FundMid Cap Growth FundOpportunity Fund†
Small Cap Disciplined FundSmall Cap Growth FundSmall Cap Opportunities FundSmall Cap Value FundSmall Company Growth FundSmall Company Value FundSmall/Mid Cap Value FundSocial Sustainability Fund†
Specialized Financial Services FundSpecialized Technology FundU.S. Value Fund
California Limited-Term Tax-Free FundCalifornia Tax-Free FundColorado Tax-Free FundDiversified Bond FundGovernment Securities Fund1
High Income FundIncome Plus Fund
Inflation-Protected Bond FundIntermediate Tax/AMT-Free FundMinnesota Tax-Free FundMunicipal Bond FundShort Duration Government Bond Fund1
Short-Term Bond FundShort-Term High Yield Bond Fund
Short-Term Municipal Bond FundStable Income FundStrategic Income FundTotal Return Bond FundUltra Short-Term Income FundUltra Short-Term Municipal Income FundWisconsin Tax-Free Fund
Aggressive Allocation FundConservative Allocation FundGrowth Balanced FundIndex Asset Allocation FundModerate Balanced FundWealthBuilder Conservative Allocation Portfolio†
WealthBuilder Equity Portfolio†
WealthBuilder Growth Allocation Portfolio†
WealthBuilder Growth Balanced Portfolio†
WealthBuilder Moderate Balanced Portfolio†
WealthBuilder Tactical Equity Portfolio†
Target Today Fund2†
Target 2010 Fund2†
Target 2015 Fund2†
Target 2020 Fund2†
Target 2025 Fund2†
Target 2030 Fund2†
Target 2035 Fund2†
Target 2040 Fund2†
Target 2045 Fund2†
Target 2050 Fund2†
VT Asset Allocation FundVT C&B Large Cap Value FundVT Discovery Fund†
VT Equity Income Fund
VT International Core FundVT Large Company Core FundVT Large Company Growth FundVT Money Market Fund
VT Opportunity Fund†
VT Small Cap Growth FundVT Small/Mid Cap Value FundVT Total Return Bond Fund
100% Treasury Money Market Fund1
California Municipal Money Market FundCalifornia Municipal Money Market TrustCash Investment Money Market FundGovernment Money Market Fund1
Heritage Money Market Fund†
Minnesota Money Market FundMoney Market FundMoney Market TrustMunicipal Money Market Fund
National Tax-Free Money Market FundNational Tax-Free Money Market TrustOverland Express Sweep Fund†
Prime Investment Money Market FundTreasury Plus Money Market Fund1
Equity Funds
Bond Funds
Asset Allocation Funds
Variable Trust Funds3
Money Market Funds

2 Wells Fargo Advantage Money Market Funds Letter to Shareholders
Karla M. Rabusch, PresidentWells Fargo Advantage Funds
Dear Valued Shareholder,We are pleased to provide you with this annual report for the Wells FargoAdvantage Money Market Funds for the 12-month period that ended February 28,2010. At the beginning of the period in March 2009, the credit markets were atthe early stages of a recovery in the wake of the credit crisis from late 2008. Thepositive effects from government intervention programs began to appear in thespring of 2009 as the credit system started to build a steadier foundation andinvestors increasingly returned to both the credit markets and the equity markets.The trend over the 12-month period was one of steady improvement in investorconfidence and in credit market conditions. Overall, the period finished withindications of stronger investor sentiment than when it began.
Credit markets improved considerably.Short-term credit markets slowly regained their footing in early 2009 after severalmonths of uncertainty following the credit crisis of late 2008. Although governmentintervention programs to aid the short-term credit markets had been in effect forseveral months following the crisis, the trend toward fully functioning marketsonly began to emerge in March of 2009. Many investors had remained skepticalof certain financial institutions for several months. That all finally started to changeafter the government’s stress tests of banks in early 2009 attested to the strengthof these financial institutions. That signal to the markets, coupled with theongoing support from government programs, bolstered confidence in the creditsystem. Thus, 2009 became a year of strengthening confidence in credit. Investorsincrementally began to follow the government’s lead by re-engaging in the creditsystem on the belief that in the worst case scenario the government would likelystep in and buy whatever the investor was too afraid to own through variousgovernment programs. As the months went by this government-inspired investorconfidence began to stand on its own two feet. Investors increasingly traded witheach other once again and relied less and less on selling to the government asthe buyer and lender of last resort.
Government programs served their purpose and began to decline in use.Compared with turmoil from the financial crisis, the past 12 months were a periodof improvement and relative calm. The tone of the markets improved with eachpassing month as efforts by central banks took hold and the general level ofcredit quality improved. Several government programs were implemented in late2008 and had positive effect during 2009. For money market eligible securities,the most influential programs were the Asset-Backed Commercial Paper MoneyMarket Fund Liquidity Facility (AMLF), and the Commercial Paper Funding Facility(CPFF). All of these facilities were aimed at reconstructing a market for short-termcredit securities. Because investors were largely unwilling to lend and investmoney in an environment of unusually high risk, the government was compelledto step in to fill the void. This resulted in a market made by governmentintervention which served investors well and produced a foundation for investorsto trade on. As 2009 progressed, the need for such programs lessened as marketsincreasingly functioned on their own merits without explicit government support.Thus, the government reassessed its intervention and scheduled the retirementof several programs for the end of October 2009. Credit markets showed littleconcern for the end of the programs which, in our view, was an indication
The trend over the 12-monthperiod was one of steadyimprovement in investorconfidence and in credit
market conditions.

Letter to Shareholders Wells Fargo Advantage Money Market Funds 3
of how far credit markets had improved over the previous six months. Manyof the Federal Reserve programs aimed at supporting liquidity in the moneymarkets, such as the Asset-Backed Commercial Paper Money Market Mutual FundLiquidity Facility (AMLF), Commercial Paper Funding Facility (CPFF), PrimaryDealer Credit Facility (PDCP) and Term Securities Lending Facility (TSLF), expiredon February 1, 2010, with little fanfare and to no noticeable effect.
Regulatory changes to money market funds were approved.On January 27, 2010, the SEC approved amendments to Rule 2a-7, the section ofthe Investment Company Act that governs money market funds. The SEC proposedcertain amendments in June 2009, asking for public comment. After having receivedover 150 comments from the public, the final amendments largely mirrored theinitial proposals released last June. These changes shortened the maximumweighted-average maturity of money funds, restricted the use of “second tier” andilliquid securities, required funds to periodically stress test their funds, and setstandards for the percentage of a fund’s assets that must be invested in highly liquidsecurities. These changes were well known by the money fund industry; and webelieve a transition to the new requirements should proceed smoothly. In our opinion,our funds are well positioned to accommodate the terms of the new regulations.
The upcoming fiscal year of 2010 is likely to be one of ongoing change. Theregulatory environment is evolving, and monetary policy is likely to shift sometimein the upcoming quarters. We have already seen the retirement of several federalliquidity programs; the next step would be higher interest rates at some point.Thus, just as we were cautious over the last 12 months in view of the varying creditrisks, we continue to remain cautiously optimistic but now with more of a focus onupholding absolute liquidity in a tightening regulatory environment and a potentiallyrising interest rate environment.
Steady investment disciplines with several broad diversification options.Experience tells us that strict adherence to time-tested strategies has its rewards.As a whole, Wells Fargo Advantage Funds represents investments across a range ofasset classes and investment styles, giving you an opportunity to create a diversified investment portfolio.
Thank you for choosing to invest with Wells Fargo Advantage Funds. We appreciateyour confidence in us and remain committed to helping you meet your financialneeds. For current information about your fund investments, contact yourinvestment professional, visit our Web site at www.wellsfargo.com/advantagefunds,or call us directly at 1-800-222-8222.
Sincerely,
Karla M. RabuschPresidentWells Fargo Advantage Funds
On January 27, 2010, the SECapproved amendments toRule 2a-7, the section of theInvestment Company Act thatgoverns money market funds.

4 Wells Fargo Advantage Money Market Funds Money Market Overview
Money Market OverviewThis portfolio manager commentary covers the 12-month period from March 1,2009, through February 28, 2010.
Prime Money Market SecuritiesIn marked contrast to the previous 18 months, when the money markets wereembroiled in the unprecedented financial markets crisis, the past 12 months were a period of improvement and relative calm as efforts by central banks took holdand the general level of credit quality became more positive. Many of theextraordinary measures that were taken by the Federal Reserve to augmentliquidity in the money markets, such as the Asset-Backed Commercial PaperMoney Market Fund Liquidity Facility (AMLF), Commercial Paper Funding Facility(CPFF), Primary Dealer Credit Facility (PDCF) and Term Securities Lending Facility(TSLF) expired on February 1, 2010, with little fanfare and no noticeable effect.
Overnight rates were largely unchanged over the entire year after being locked inby the exceptionally low level of the Federal funds rate, targeted at 0–0.25% bythe Federal Open Market Committee (FOMC) at its meeting in December 2008. As conditions in the money markets showed improvement and investors beganto regain confidence, other money market rates moved lower as well. The yieldcurve flattened steadily over this period with the spread between one-month andone-year LIBOR (London Interbank Offered Rate) falling from a high of 173 basispoints (bps) in March 2009 to a low of 60 bps by February 2010. One-year LIBORfell by 1.40%, declining from about 2-1/4% near the start of the fiscal year to0.84% by year-end. The declines in the shorter dates, while less pronounced, werestill considerable. In mid-March 2009, three-month LIBOR stood at 1.33% andone-month LIBOR at 0.56%. By February both had fallen to about 0.25%.
There was also more differentiation between issuers of different credit qualitythan in the past, with strong issuers trading well below LIBOR and weaker issuerswith the same ratings trading well above. While the yield spread between thesedifferent classes of credit quality narrowed as the year progressed, this tieringeffect was still evident. This is a notable difference from the market that existedprior to the onset of the financial crisis, when market participants were lessdiscriminating and there was almost no yield difference between different issuerswith the same credit-quality ratings.
In part, this spread narrowing can be attributed to a real improvement in creditquality. Uncertainty regarding credit quality peaked in March 2009, coincidentwith the bottom of the stock markets and the preliminary release of the bank“stress tests” by the U.S. Treasury. Revealing no surprises in terms of the banks thatwere expected to require additional capital, these stress test results alleviatedmany concerns in the money markets regarding the credit quality of financialinstitutions. Though still not on a positive footing, credit quality has seen a gradualimprovement, as evidenced by the actions of ratings agencies. In the last quarterof 2008, there were ten ratings downgrades for every upgrade. A year later, thisratio had improved to four downgrades for each upgrade.
A decline in the supply of high-quality money market instruments was also a factorin driving rates lower and compressing credit spreads. Total commercial paper

Money Market Overview Wells Fargo Advantage Money Market Funds 5
outstanding declined by more than 20% from $1.4 trillion at the end ofFebruary 2009 to $1.1 trillion a year later. The asset-backed commercial paper(ABCP) market suffered an even more severe decline, falling 32% from $646 billionto $436 billion over the same period, after having peaked at more than $1.2 trillionin August 2007. We estimate that the total supply of money market investmentsfell by over $1 trillion over the fiscal year, from $8.7 trillion to $7.5 trillion.
A number of factors contributed to this dwindling supply. As financial concernshave sought their way out of the financial crisis, they have collectively gonethrough an exercise of unwinding leverage. This naturally entailed reducedborrowing, especially short-term borrowing. As credit conditions have improved,issuers of short-term debt have sought to lock in extraordinarily low rates byextending the term of their liabilities through the issuance of long-term debt. Thelow rates available in the money markets have prompted some market participantsto seek higher returns by purchasing longer investments, including bond funds.This has made the process of long-term debt issuance relatively easier. Issuers,especially banks, are also under some pressure from their regulators to decreasetheir dependence on short-term funding, especially from institutional investors asopposed to retail investors. Finally, the relatively weak economic conditions led toa decreased need for short-term borrowings as inventories contracted and thevolume of receivables financing declined.
The lack of supply is likely to continue to be an issue for money marketparticipants, especially in the ABCP markets. Proposed accounting changes Fromthe Financial Accounting Standards Board (FASB) on “Accounting for Transfers ofFinancial Assets” and “Amendments to FASB Interpretation No. 46(R)” will come intoeffect next year and will change the accounting treatment for securitizations andoff-balance-sheet financing. The impact of both will be to make off-balance-sheettreatment of ABCP more difficult to achieve—causing many ABCP conduits to beconsolidated onto the balance sheet of the sponsoring financial institution, likelyresulting in a further reduction in the issuance of ABCP.
Our portfolio strategy has emphasized the need for a stable $1.00 net asset value(NAV) and the importance of liquidity to meet shareholder redemptions. Towardthat end, we have maintained a highly liquid posture and a shorter weighted-average maturity than our peer group. As opportunities presented themselves,we were able to selectively add to some longer-dated securities. We also foundthe adjustable rate sector attractive, especially in the municipal sector where thecompression of interest rates often meant that tax-exempt securities carriedhigher yields than taxable instruments of comparable term and quality. As always,we placed a high value on superior credit quality.
U.S. Government Agency SecuritiesAt this time last year, we were coming out of what was arguably the worstfinancial crisis in almost a century. While things have certainly not returned towhat we used to know as “normal,” this past fiscal year has been one of relativecalm and tranquility. There is still much to be decided regarding the future fate ofthe Government Sponsored Enterprises (GSEs), but if this past year has taught usanything it is that the GSEs play a vital role in the recovery of the housing marketand, therefore, will likely be around in some form for the foreseeable future.

6 Wells Fargo Advantage Money Market Funds Money Market Overview
One has to look no further than the dynamics of the GSE discount note marketduring the past 12 months to realize that market conditions have, indeed, improved.At the beginning of 2009 outstanding discount notes stood at a historic high of$1.2 trillion. During the previous fiscal year, the uncertainty around the ultimatefate of the GSEs caused investors to shy away from buying securities with maturitieslonger than one year. In order to get the funding needed to fulfill their mandateof providing liquidity to the mortgage market, the GSEs had to increase theirissuance of discount notes because they found it difficult to secure large amountsof funding further out on the yield curve.
This fiscal year, however, we witnessed an almost 40% decline in outstandingdiscount notes. Increased confidence, not just in the overall market but in the roleof the GSEs as well, brought investors back into the longer-term market. The GSEswere able to fund their obligations out past money fund eligible maturities atvery attractive rates. Remember, we are still in a historically low interest rateenvironment so the ability to lock in cheap funding farther out on the yield curveis definitely an advantage to the GSEs. As a result of the decreased supply ofdiscount notes and the continued robust demand from money fund participantswhose assets have not fallen nearly as much as the amount of discount notesoutstanding, yields during the past 12 months have fallen substantially. For example,the yield on discount notes maturing in three months has declined over 60%, or22 basis points, this fiscal year. The precipitous decline in market rates had amajor impact on money fund yields with some complexes having to waive fees inorder to maintain a positive return.
U.S. Treasury SecuritiesIt was certainly another volatile year for short-term U.S. Treasury securities as thetug-of-war between supply and demand continued. The economy seemed to bestabilizing from the traumatic events of the prior year, buoyed by efforts fromcentral banks and the Federal Reserve. As the year progressed, we saw a declinein risk aversion by investors as credit markets improved and money was redeployedinto other asset classes. There still remained, however, a healthy appetite for U.S.Treasury securities, especially U.S. Treasury Bills (T-Bills), since not everybody wasconvinced that conditions were improving. At the same time, a significant declinein supply was underway.
During the first half of the year, the amount of T-Bills outstanding under theSupplementary Financing Program (SFP) had fallen from a high of $560 billion to$200 billion, a decline of almost 65%. Regular T-Bill issuance also declined due toseasonal factors beginning in late April. In May, the Treasury Market PracticesGroup implemented a 300-basis-point penalty on failed trades in the U.S. Treasurymarket. This caused an increase in demand, especially from the broker/dealercommunity, which normally holds net short positions in T-Bills. The penalty wasconsidered too great so broker/dealers made it a point to hold more T-Bills tomake good delivery in both the cash market and the repurchase agreementmarket. These events forced the yield on the three-month U.S. Treasury Bill to becut by more than half, from 0.25% at the beginning of the fiscal year to 0.12% bythe end of August.

Money Market Overview Wells Fargo Advantage Money Market Funds 7
It did not get much easier during most of the second half of 2009 as supplycontinued to shrink. The $200 billion in outstanding T-Bills issued under the SFPshrank by an even greater amount, on a percentage basis, than during the firsthalf of the year—to just $5 billion, a decline of nearly 98%! This was in response tothe U.S. Government approaching the overall debt ceiling limit. Couple this effectwith an insatiable demand toward the end of the calendar year and yields on T-Billsapproached zero percent. However, towards the end of the fiscal year, the U.S.Congress voted to increase the debt ceiling limit, allowing for the beginning ofmore issuance in the SFP—a welcomed development. At the end of the fiscalyear, the yield on three-month T-Bills had risen from nearly zero percent to 0.11%.
Tax-Exempt SecuritiesThe best way to characterize the municipal money market during the periodwould be as a year of decline. Over the 12-month period ended February 28, 2010,the municipal money market saw a decline in supply, absolute yields, and assets.
The decline in supply was the result of several factors. First was the reduction ofissues eligible for purchase by money market funds. Banks are a major source ofsecurity and liquidity for securities purchased by municipal money market funds.Banks came under pressure for the period as a distressed economy weakenedtheir loan and investment portfolios. This ultimately led to downgrades by therating agencies, causing short-term municipal securities backed by some of thesebanks to become ineligible for purchase by municipal money market funds. Theremaining eligible banks increased their fees for liquidity to debt issuers of newissue variable-rate demand notes, causing a dramatic drop in the new issuance ofthese securities. The increase in liquidity fees charged by eligible banks made itmore economical for many municipal entities to issue long-term fixed rate debtinstead of the variable-rate debt that money funds typically purchase. This reductionin available bank liquidity has had a huge impact on municipal money marketsupply; not only has it reduced new issue supply, but it has also cut down on theexisting supply. Many municipalities have opted to issue long-term bonds with thepurpose of paying off their floating-rate obligations. For calendar year 2009, newissue variable-rate supply reached only $33.1 billion, compared with $125 billionfor calendar 2008, a decline of 73%. The trend continued into 2010, with variablerate issuance of $571 million in January 2010, down 49% from January 2009.
The second decline suffered over the period was absolute yield. The SecurityIndustry and Financial Markets Association (SIFMA) Municipal Swap Index, whichis the base rate for the majority of municipal floating-rate instruments, tradeddown over the period. The SIFMA index reached its high for the 12 months endedFebruary 28, 2010, on April 29, 2009, at 63 basis points. From this high there was a gradual steady drop to the period low of 15 basis points on January 6, 2010.As the pool of eligible municipal floating-rate securities shrunk and market demandfor these securities rose, the SIFMA index was pushed to historically low levels.This large fall in the index, coupled with a lower level of municipal floating-rateissuance, drove municipal money market fund yields to all-time lows.

8 Wells Fargo Advantage Money Market Funds Money Market Overview
These all-time low municipal money market fund yields in turn led to the thirddecline for the period: the outflow of municipal money market fund assets. Lowinterest rates had been the key driver of the outflow in municipal money marketassets. For calendar year 2009, municipal money market funds lost $92.2 billion inassets, a fall of 18.7% compared with calendar year 2008; the trend continued intoJanuary 2010, with a $120 billion, or 3.1%, outflow versus January 2009. As ofFebruary 3, 2010, tax-exempt money market fund assets totaled $387.6 billion,a level last observed in May 2007.
A change in market dynamics can bring a change in product dynamics. On a positivesupply note, new municipal variable-rate products started coming to market towardthe end of the period, helping offset some of the lost supply of variable-rate demandnotes. One such product, known as Windows Variable-Rate Demand Bonds, allowsthe highest-quality municipal issuers to provide their own ultimate liquidity. Theproduct is attractive for a variety of reasons. It adds much needed supply to theshort-term municipal marketplace, it consists of high-quality credits, it helps diversifyaway from expensive and scarce bank liquidity, and finally, it offers an attractivespread off the SIFMA index, making it a desirable option overall.
Going forward, the general strategy across all of our municipal money marketfunds is to maintain a weighted-average maturity that is relatively short versusour peer group, with a focus on floating-rate securities. With absolute rates athistoric lows and a flat yield curve, seeking longer maturities in this environmenthas not made much sense. We have added smaller municipal note issues on aselective basis and will continue to do so when we find securities that have bothhigh credit quality and attractive yields.
Strategic OutlookThe regulatory landscape for money market funds is changing. On January 27,2010 the Securities and Exchange Commission (SEC) approved amendments toRule 2a-7, the section of the Investment Company Act that governs moneymarket funds. The SEC had proposed certain amendments last June, asking forpublic comment. After having received over 150 comments from the public, thefinal amendments largely mirrored the initial proposals released last June. Thesechanges would shorten the maximum weighted-average maturity of moneyfunds, restrict the use of “second tier” and illiquid securities, require funds toperiodically stress test their funds, and set standards for the percentage of afund’s assets that must be invested in highly liquid securities. We are supportiveof the changes to Rule 2a-7 and agree that they will make money funds moreresilient to potential market disruptions. Largely reflecting the proposals of theReport of the Money Market Working Group of the Investment Company Institute,these changes were well-known by the money fund industry and a transition tothe new requirements should proceed smoothly. We believe our funds arewell-positioned in terms of the requirements of the new rule.
As we enter a new fiscal year, we stand at a point where the potential for changeis high. The regulatory environment, market conditions, and interest rates are allquite likely to see great changes in the coming year.

This page is intentionally left blank.

10 Wells Fargo Advantage Money Market Funds Performance Highlights (Unaudited)
1. Prior to December 1, 2009, the Wells Fargo Advantage California Municipal Money Market Fund was named,Wells Fargo Advantage California Tax-Free Money Market Fund.
2. Portfolio allocation and maturity distribution are subject to change and are calculated based on the totalinvestments of the Fund.
INVESTMENT OBJECTIVEThe Wells Fargo Advantage CaliforniaMunicipal Money Market Fund (the Fund)seeks current income exempt fromregular federal income tax and Californiaindividual income tax, while preservingcapital and liquidity.
INVESTMENT ADVISERWells Fargo Funds Management, LLC.
SUBADVISERWells Capital Management Incorporated
PORTFOLIO MANAGERMathew Kiselak (effective January 19, 2010)
FUND INCEPTION January 1, 1992
Wells Fargo Advantage California Municipal Money Market Fund1 – Institutional and Service Class
Municipal Bonds (93%)
Municipal Commercial Paper (7%)
PORTFOLIO ALLOCATION 2
(AS OF FEBRUARY 28, 2010)
30-59 days (1%)
60-89 days (1%)
2-7 days (87%)
1 day (7%)8-14 days (4%)
MATURITY DISTRIBUTION 2
(AS OF FEBRUARY 28, 2010)

Performance Highlights (Unaudited) Wells Fargo Advantage Money Market Funds 11
Wells Fargo Advantage California Municipal Money Market Fund –
Institutional and Service Class (continued)
3. The investment adviser has contractually committed through June 30, 2010, to waive fees and/or reimburse expenses to the extent necessary to maintain acertain net operating expense ratio for the Fund. Without these reductions, the Fund’s returns would have been lower. Without waived fees and/or reimbursedexpenses, the Fund’s 7-day current yield would have been (0.18)% and (0.47)% for Institutional Class and Service Class, respectively.
4. Institutional Class incepted on March 31, 2008. Performance shown since November 8, 1999 for the Institutional Class reflects the performance of the ServiceClass, and includes expenses that are not applicable to and higher than those of the Institutional Class.
AVERAGE ANNUAL TOTAL RETURN 4 (%) (AS OF FEBRUARY 28, 2010)6 Month* 1 Year 5 Year 10 Year
Institutional Class (WCTXX) 0.04 0.20 2.02 1.76
Service Class (WFCXX) 0.01 0.06 1.94 1.72
* Returns for periods of less than one year are not annualized.
FUND YIELD SUMMARY 3 Institutional Service(AS OF FEBRUARY 28, 2010) Class Class
7-Day Current Yield 0.04% 0.01%
7-Day Compound Yield 0.04% 0.01%
30-Day Simple Yield 0.03% 0.01%
30-Day Compound Yield 0.03% 0.01%
Figures quoted represent past performance, which is no guarantee of future results and do not reflect the deduction of taxes that a shareholder may pay onfund distributions or the redemption of fund shares. Investment returns will fluctuate. The Fund’s yield figures more closely reflect the current earnings of theFund than the total return figures. Current performance may be lower or higher than the performance data quoted. Current month-end performance isavailable at the Funds’ Web site – www.wellsfargo.com/advantagefunds.
The Fund is sold without a front-end sales charge or contingent deferred sales charge. Other fees and expenses apply to an investment in the Fund and aredescribed in the Fund’s current prospectus.
An investment in a money market fund is not insured or guaranteed by the Federal Deposit Insurance Corporation or any othergovernment agency. Although the Fund seeks to preserve the value of your investment at $1.00 per share, it is possible to losemoney by investing in a money market fund. A portion of the Fund’s income may be subject to federal, state and/or localincome taxes or the alternative minimum tax (AMT).

12 Wells Fargo Advantage Money Market Funds Performance Highlights (Unaudited)
Wells Fargo Advantage Cash Investment Money Market Fund – Administrator, Institutional, Select and Service Class
INVESTMENT OBJECTIVEThe Wells Fargo Advantage CashInvestment Money Market Fund (the Fund)seeks current income, while preservingcapital and liquidity.
INVESTMENT ADVISERWells Fargo Funds Management, LLC.
SUBADVISERWells Capital Management Incorporated
PORTFOLIO MANAGERDavid D. Sylvester
FUND INCEPTION October 14, 1987
1. Portfolio allocation and maturity distribution are subject to change and are calculated based on the totalinvestments of the Fund.
Repurchase Agreements (1%)
Secured Master Note Agreement (2%)
Certificate of Deposit (10%)
Medium Term Notes (1%)Time Deposits (8%)
Municipal Bonds (11%)
Corporate Bonds & Notes (7%)
Commercial Paper (60%)
PORTFOLIO ALLOCATION 1
(AS OF FEBRUARY 28, 2010)
2-7 days (18%)
180-269 days (2%)
270+ days (5%)
30-59 days (20%)
90-179 days (9%)1 day (14%)
60-89 days (15%)
15-29 days (12%)
8-14 days (5%)
MATURITY DISTRIBUTION 1
(AS OF FEBRUARY 28, 2010)

Performance Highlights (Unaudited) Wells Fargo Advantage Money Market Funds 13
Wells Fargo Advantage Cash Investment Money Market Fund –
Administrator, Institutional, Select and Service Class (continued)
AVERAGE ANNUAL TOTAL RETURN 3 (%) (AS OF FEBRUARY 28, 2010)6 Month* 1 Year 5 Year 10 Year
Administrator Class (WFAXX) 0.03 0.24 3.10 2.84
Institutional Class (WFIXX) 0.08 0.36 3.24 3.02
Select Class (WFQXX) 0.12 0.43 3.28 3.04
Service Class (NWIXX) 0.01 0.14 2.95 2.74
* Returns for periods of less than one year are not annualized.
FUND YIELD SUMMARY 2 Administrator Institutional Select Service(AS OF FEBRUARY 28, 2010) Class Class Class Class
7-Day Current Yield 0.01% 0.08% 0.15% 0.01%
7-Day Compound Yield 0.01% 0.08% 0.15% 0.01%
30-Day Simple Yield 0.01% 0.09% 0.16% 0.01%
30-Day Compound Yield 0.01% 0.09% 0.16% 0.01%
Figures quoted represent past performance, which is no guarantee of future results, and do not reflect the deduction of taxes that a shareholder may pay onfund distributions or the redemption of fund shares. Investment returns will fluctuate. The Fund’s yield figures more closely reflect the current earnings of theFund than the total return figures. Current performance may be lower or higher than the performance data quoted. Current month-end performance isavailable at the Funds’ Web site – www.wellsfargo.com/advantagefunds.
The Fund is sold without a front-end sales charge or contingent deferred sales charge. Other fees and expenses apply to an investment in the Fund and aredescribed in the Fund’s current prospectus.
An investment in a money market fund is not insured or guaranteed by the Federal Deposit Insurance Corporation or any othergovernment agency. Although the Fund seeks to preserve the value of your investment at $1.00 per share, it is possible to losemoney by investing in a money market fund.
2. The investment adviser has committed through June 30, 2010, to waive fees and/or reimburse expenses to the extent necessary to maintain a certain net operatingexpense ratio for the Fund. Without these reductions, the Fund’s returns would have been lower. Without waived fees and/or reimbursed expenses, the Fund’s 7-daycurrent yield would have been (0.05)%, 0.07%, 0.11% and (0.23)% for Administrator, Institutional, Select, and Service Classes, respectively.
3. Performance shown prior to the inception of the Administrator Class on July 31, 2003, reflects the performance of the Service Class, and includes expenses thatare not applicable to and are higher than those of the Administrator Class. Performance shown prior to the inception of the Select Class on June 29, 2007 reflectsthe performance of the Institutional Class, and includes expenses that are not applicable to and are higher than those of the Select Class.

14 Wells Fargo Advantage Money Market Funds Performance Highlights (Unaudited)
Wells Fargo Advantage Government Money Market Fund – Administrator, Institutional and Service Class
INVESTMENT OBJECTIVEThe Wells Fargo Advantage GovernmentMoney Market Fund (the Fund) seekscurrent income, while preserving capitaland liquidity.
INVESTMENT ADVISERWells Fargo Funds Management, LLC.
SUBADVISERWells Capital Management Incorporated
PORTFOLIO MANAGERDavid D. Sylvester
FUND INCEPTION November 16, 1987
1. Portfolio allocation and maturity distribution are subject to change and are calculated based on the totalinvestments of the Fund.
Federal Agencies (42%)
Corporate Bonds and Notes (6%)
Commercial Paper (9%)
Repurchase Agreements (43%)
PORTFOLIO ALLOCATION 1
(AS OF FEBRUARY 28, 2010)
1 day (40%)270+ days (10%)
2-7 days (5%)
90-179 days (12%)
15-29 days (4%)
180-269 days (6%)
8-14 days (3%)30-59 days (8%)
60-89 days (12%)
MATURITY DISTRIBUTION 1
(AS OF FEBRUARY 28, 2010)

Performance Highlights (Unaudited) Wells Fargo Advantage Money Market Funds 15
Wells Fargo Advantage Government Money Market Fund –
Administrator, Institutional and Service Class (continued)
AVERAGE ANNUAL TOTAL RETURN 3 (%) (AS OF FEBRUARY 28, 2010)6 Month* 1 Year 5 Year 10 Year
Administrator Class (WGAXX) 0.01 0.02 2.86 2.67
Institutional Class (GVIXX) 0.01 0.08 2.99 2.76
Service Class (NWGXX) 0.01 0.01 2.73 2.59
* Returns for periods of less than one year are not annualized.
FUND YIELD SUMMARY 2 Administrator Institutional Service(AS OF FEBRUARY 28, 2010) Class Class Class
7-Day Current Yield 0.01% 0.01% 0.01%
7-Day Compound Yield 0.01% 0.01% 0.01%
30-Day Simple Yield 0.01% 0.01% 0.01%
30-Day Compound Yield 0.01% 0.01% 0.01%
Figures quoted represent past performance, which is no guarantee of future results, and do not reflect the deduction of taxes that a shareholder may pay onfund distributions or the redemption of fund shares. Investment returns will fluctuate. The Fund’s yield figures more closely reflect the current earnings of theFund than the total return figures. Current performance may be lower or higher than the performance data quoted. Current month-end performance isavailable at the Funds’ Web site – www.wellsfargo.com/advantagefunds.
The Fund is sold without a front-end sales charge or contingent deferred sales charge. Other fees and expenses apply to an investment in the Fund and aredescribed in the Fund’s current prospectus.
An investment in a money market fund is not insured or guaranteed by the Federal Deposit Insurance Corporation or any othergovernment agency. Although the Fund seeks to preserve the value of your investment at $1.00 per share, it is possible to losemoney by investing in a money market fund. The U.S. Government guarantee applies to certain of the underlying securitiesheld by the Fund and not to shares of the Fund itself.
2. The investment adviser has committed through June 30, 2010, to waive fees and/or reimburse expenses to the extent necessary to maintain a certain netoperating expense ratio for the Fund. Without waived fees and/or reimbursed expenses, the Fund’s 7-day current yield would have been (0.20)%, (0.08)% and (0.37)%for Administrator, Institutional, and Service Classes, respectively.
3. Performance shown prior to the inception of the Administrator Class on July 31, 2003, reflects the performance of the Service Class, and includes expenses that arenot applicable to and are higher than those of the Administrator Class. Performance shown prior to the inception of the Institutional Class on July 28, 2003, reflectsthe performance of the Service Class, and includes expenses that are not applicable to and are higher than those of the Institutional Class.

16 Wells Fargo Advantage Money Market Funds Performance Highlights (Unaudited)
Wells Fargo Advantage Heritage Money Market Fund – Administrator, Institutional and Select Class
INVESTMENT OBJECTIVEThe Wells Fargo Advantage HeritageMoney Market Fund (the Fund) seekscurrent income, while preserving capitaland liquidity.
INVESTMENT ADVISERWells Fargo Funds Management, LLC.
SUBADVISERWells Capital Management Incorporated
PORTFOLIO MANAGERDavid D. Sylvester
FUND INCEPTION June 29, 1995
1. Portfolio allocation and maturity distribution are subject to change and are calculated based on the totalinvestments of the Fund.
Secured Master Note Agreement (2%)
Medium Term Notes (2%)Time Deposits (9%)
Certificate of Deposit (11%)
Repurchase Agreements (9%)Municipal Bonds (7%)
Corporate Bonds &Notes (2%)
Commercial Paper (58%)
PORTFOLIO ALLOCATION 1
(AS OF FEBRUARY 28, 2010)
270+ days (5%)90-179 days (6%)
60-89 days (12%)
180-269 days (3%)
1 day (22%)
15-29 days (12%)8-14 days (6%)
2-7 days (14%)30-59 days (20%)
g _MATURITY DISTRIBUTION 1
(AS OF FEBRUARY 28, 2010)

Performance Highlights (Unaudited) Wells Fargo Advantage Money Market Funds 17
Wells Fargo Advantage Heritage Money Market Fund –
Administrator, Institutional and Select Class (continued)
AVERAGE ANNUAL TOTAL RETURN 3 (%) (AS OF FEBRUARY 28, 2010)6 Month* 1 Year 5 Year 10 Year
Administrator Class (SHMXX) 0.02 0.21 3.08 2.83
Institutional Class (SHIXX) 0.07 0.33 3.24 3.03
Select Class (WFJXX) 0.11 0.40 3.28 3.04
* Returns for periods of less than one year are not annualized.
FUND YIELD SUMMARY 2 Administrator Institutional Select(AS OF FEBRUARY 28, 2010) Class Class Class
7-Day Current Yield 0.01% 0.06% 0.13%
7-Day Compound Yield 0.01% 0.06% 0.13%
30-Day Simple Yield 0.01% 0.07% 0.14%
30-Day Compound Yield 0.01% 0.07% 0.14%
Figures quoted represent past performance, which is no guarantee of future results, and do not reflect the deduction of taxes that a shareholder may pay onfund distributions or the redemption of fund shares. Investment returns will fluctuate. The Fund’s yield figures more closely reflect the current earnings of theFund than the total return figures. Current performance may be lower or higher than the performance data quoted. Current month-end performance isavailable at the Funds’ Web site – www.wellsfargo.com/advantagefunds.
The Fund is sold without a front-end sales charge or contingent deferred sales charge. Other fees and expenses apply to an investment in the Fund and aredescribed in the Fund’s current prospectus.
An investment in a money market fund is not insured or guaranteed by the Federal Deposit Insurance Corporation or any othergovernment agency. Although the Fund seeks to preserve the value of your investment at $1.00 per share, it is possible to losemoney by investing in a money market fund.
2. The investment adviser has committed through June 30, 2010, to waive fees and/or reimburse expenses to the extent necessary to maintain a certain net operatingexpense ratio for the Fund. Without waived fees and/or reimbursed expenses, the Fund’s 7-day current yield would have been (0.08)%, 0.04% and 0.08% forAdministrator, Institutional, and Select Classes, respectively.
3. Performance shown prior to the inception of the Institutional Class on March 31, 2000, reflects the performance of the Administrator Class, and includes expensesthat are not applicable to and are higher than those of the Institutional Class. Performance shown prior to the inception of the Select Class on June 29, 2007,reflects the performance of the Institutional Class, and includes expenses that are not applicable to and are higher than those of the Select Class. Performanceshown prior to March 31, 2000 for the Select Class reflects the performance of the Administrator Class, and includes expenses that are not applicable to and arehigher than those of the Select Class.

18 Wells Fargo Advantage Money Market Funds Performance Highlights (Unaudited)
Wells Fargo Advantage Municipal Money Market Fund – Institutional Class
INVESTMENT OBJECTIVEThe Wells Fargo Advantage MunicipalMoney Market Fund (the Fund) seekscurrent income exempt from regularfederal income tax, while preservingcapital and liquidity.
INVESTMENT ADVISERWells Fargo Funds Management, LLC.
SUBADVISERWells Capital Management Incorporated
PORTFOLIO MANAGERMathew Kiselak (effective January 19, 2010)
FUND INCEPTION October 23, 1986
1. Portfolio allocation and maturity distribution are subject to change and are calculated based on the totalinvestments of the Fund.
Municipal Bonds (97%)
Municipal Commercial Paper (3%)
PORTFOLIO ALLOCATION 1
(AS OF FEBRUARY 28, 2010)
1 day (12%)
180-269 days (1%)
90-179 days (1%) 270 + days (3%)
2-7 days (81%)
8-14 days (2%)
MATURITY DISTRIBUTION 1
(AS OF FEBRUARY 28, 2010)
Performance Highlights (Unaudited) Wells Fargo Advantage Money Market Funds 19
Wells Fargo Advantage Municipal Money Market Fund –
Institutional Class (continued)
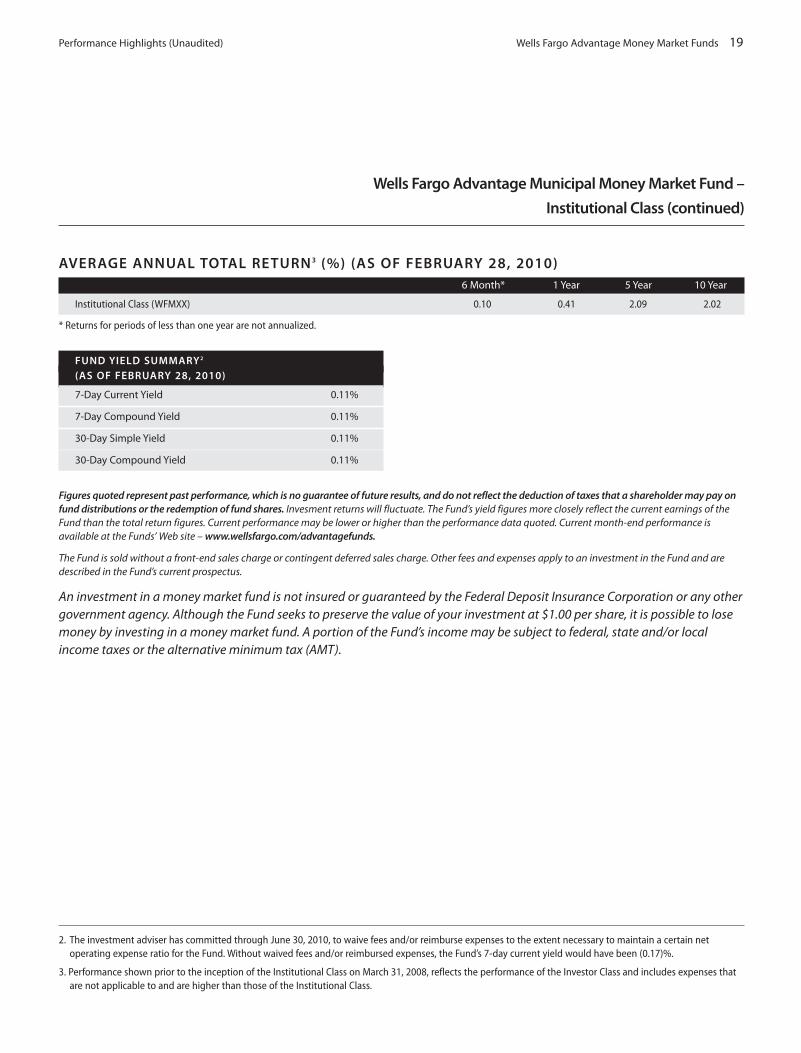
AVERAGE ANNUAL TOTAL RETURN 3 (%) (AS OF FEBRUARY 28, 2010)6 Month* 1 Year 5 Year 10 Year
Institutional Class (WFMXX) 0.10 0.41 2.09 2.02
* Returns for periods of less than one year are not annualized.
FUND YIELD SUMMARY 2
(AS OF FEBRUARY 28, 2010)
7-Day Current Yield 0.11%
7-Day Compound Yield 0.11%
30-Day Simple Yield 0.11%
30-Day Compound Yield 0.11%
Figures quoted represent past performance, which is no guarantee of future results, and do not reflect the deduction of taxes that a shareholder may pay onfund distributions or the redemption of fund shares. Invesment returns will fluctuate. The Fund’s yield figures more closely reflect the current earnings of theFund than the total return figures. Current performance may be lower or higher than the performance data quoted. Current month-end performance isavailable at the Funds’ Web site – www.wellsfargo.com/advantagefunds.
The Fund is sold without a front-end sales charge or contingent deferred sales charge. Other fees and expenses apply to an investment in the Fund and aredescribed in the Fund’s current prospectus.
An investment in a money market fund is not insured or guaranteed by the Federal Deposit Insurance Corporation or any othergovernment agency. Although the Fund seeks to preserve the value of your investment at $1.00 per share, it is possible to losemoney by investing in a money market fund. A portion of the Fund’s income may be subject to federal, state and/or localincome taxes or the alternative minimum tax (AMT).
2. The investment adviser has committed through June 30, 2010, to waive fees and/or reimburse expenses to the extent necessary to maintain a certain netoperating expense ratio for the Fund. Without waived fees and/or reimbursed expenses, the Fund’s 7-day current yield would have been (0.17)%.
3. Performance shown prior to the inception of the Institutional Class on March 31, 2008, reflects the performance of the Investor Class and includes expenses thatare not applicable to and are higher than those of the Institutional Class.

20 Wells Fargo Advantage Money Market Funds Performance Highlights (Unaudited)
Wells Fargo Advantage National Tax-Free Money Market Fund – Administrator, Institutional and Service Class
INVESTMENT OBJECTIVEThe Wells Fargo Advantage National Tax-Free Money Market Fund (the Fund)seeks current income exempt fromfederal income tax, while preservingcapital and liquidity.
INVESTMENT ADVISERWells Fargo Funds Management, LLC.
SUBADVISERWells Capital Management Incorporated
PORTFOLIO MANAGERMathew Kiselak (effective January 19, 2010)
FUND INCEPTION January 7, 1988
1. Portfolio allocation and maturity distribution are subject to change and are calculated based on the totalinvestments of the Fund.
Municipal Bonds (96%)
Municipal Commercial Paper (4%)
PORTFOLIO ALLOCATION 1
(AS OF FEBRUARY 28, 2010)
1 day (15%)
90-179 days (2%)
8-14 days (1%)
270+ days (1%)
2-7 days (78%)
30-59 days (2%)
180-269 days (1%)
MATURITY DISTRIBUTION 1
(AS OF FEBRUARY 28, 2010)
Performance Highlights (Unaudited) Wells Fargo Advantage Money Market Funds 21
Wells Fargo Advantage National Tax-Free Money Market Fund –
Administrator, Institutional and Service Class (continued)
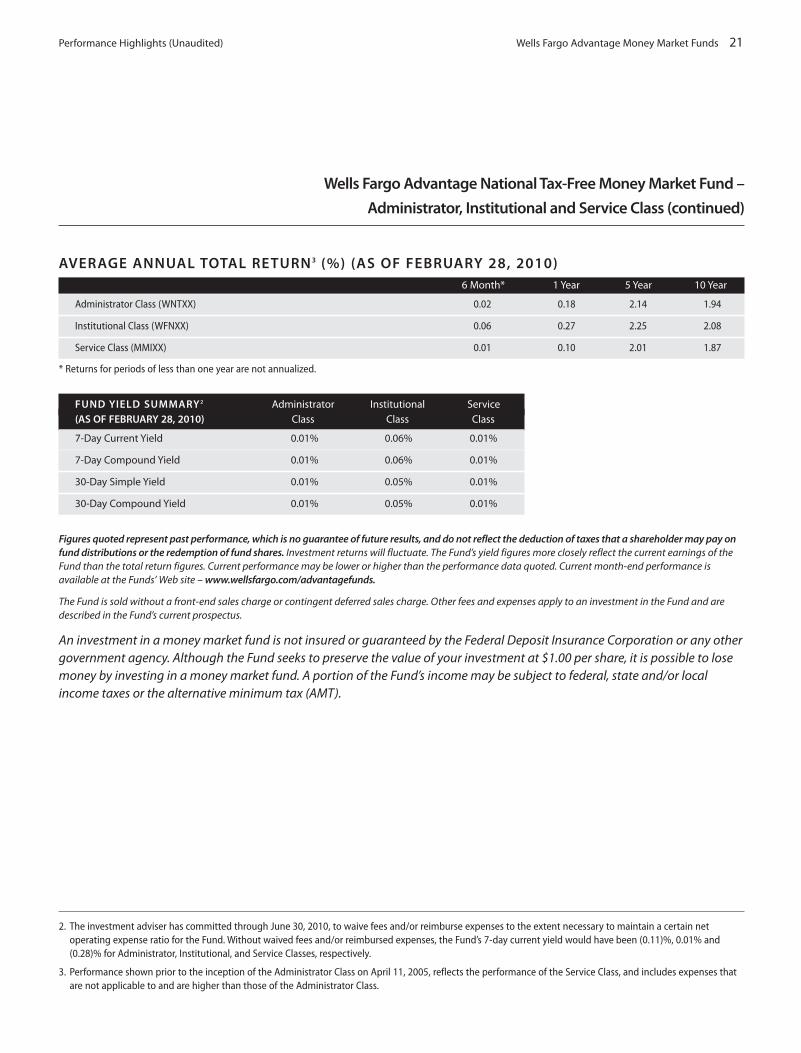
AVERAGE ANNUAL TOTAL RETURN 3 (%) (AS OF FEBRUARY 28, 2010)6 Month* 1 Year 5 Year 10 Year
Administrator Class (WNTXX) 0.02 0.18 2.14 1.94
Institutional Class (WFNXX) 0.06 0.27 2.25 2.08
Service Class (MMIXX) 0.01 0.10 2.01 1.87
* Returns for periods of less than one year are not annualized.
FUND YIELD SUMMARY 2 Administrator Institutional Service(AS OF FEBRUARY 28, 2010) Class Class Class
7-Day Current Yield 0.01% 0.06% 0.01%
7-Day Compound Yield 0.01% 0.06% 0.01%
30-Day Simple Yield 0.01% 0.05% 0.01%
30-Day Compound Yield 0.01% 0.05% 0.01%
Figures quoted represent past performance, which is no guarantee of future results, and do not reflect the deduction of taxes that a shareholder may pay onfund distributions or the redemption of fund shares. Investment returns will fluctuate. The Fund’s yield figures more closely reflect the current earnings of theFund than the total return figures. Current performance may be lower or higher than the performance data quoted. Current month-end performance isavailable at the Funds’ Web site – www.wellsfargo.com/advantagefunds.
The Fund is sold without a front-end sales charge or contingent deferred sales charge. Other fees and expenses apply to an investment in the Fund and aredescribed in the Fund’s current prospectus.
An investment in a money market fund is not insured or guaranteed by the Federal Deposit Insurance Corporation or any othergovernment agency. Although the Fund seeks to preserve the value of your investment at $1.00 per share, it is possible to losemoney by investing in a money market fund. A portion of the Fund’s income may be subject to federal, state and/or localincome taxes or the alternative minimum tax (AMT).
2. The investment adviser has committed through June 30, 2010, to waive fees and/or reimburse expenses to the extent necessary to maintain a certain netoperating expense ratio for the Fund. Without waived fees and/or reimbursed expenses, the Fund’s 7-day current yield would have been (0.11)%, 0.01% and (0.28)% for Administrator, Institutional, and Service Classes, respectively.
3. Performance shown prior to the inception of the Administrator Class on April 11, 2005, reflects the performance of the Service Class, and includes expenses thatare not applicable to and are higher than those of the Administrator Class.

22 Wells Fargo Advantage Money Market Funds Performance Highlights (Unaudited)
Wells Fargo Advantage Prime Investment Money Market Fund – Institutional and Service Class
INVESTMENT OBJECTIVEThe Wells Fargo Advantage PrimeInvestment Money Market Fund (the Fund)seeks current income, while preservingcapital and liquidity.
INVESTMENT ADVISERWells Fargo Funds Management, LLC.
SUBADVISERWells Capital Management Incorporated
PORTFOLIO MANAGERDavid D. Sylvester
FUND INCEPTIONSeptember 2, 1998
1. Portfolio allocation and maturity distribution are subject to change and are calculated based on the totalinvestments of the Fund.
Banker Acceptance Notes (1%)
Medium Term Notes (2%)
Certificate of Deposit (11%)
Repurchase Agreements (4%)
Commercial Paper (61%)
Time Deposits (10%)
Secured Master Note Agreement (2%)
Municipal Bonds (7%)Corporate Bonds &Notes (2%)
PORTFOLIO ALLOCATION 1
(AS OF FEBRUARY 28, 2010)
270+ days (4%)
1 day (19%)180-269 days (3%)
90-179 days (7%)
60-89 days (21%)
30-59 days (20%) 15-29 days (8%)
8-14 days (4%)
2-7 days (14%)
MATURITY DISTRIBUTION 1
(AS OF FEBRUARY 28, 2010)
Performance Highlights (Unaudited) Wells Fargo Advantage Money Market Funds 23
Wells Fargo Advantage Prime Investment Money Market Fund –
Institutional and Service Class (continued)
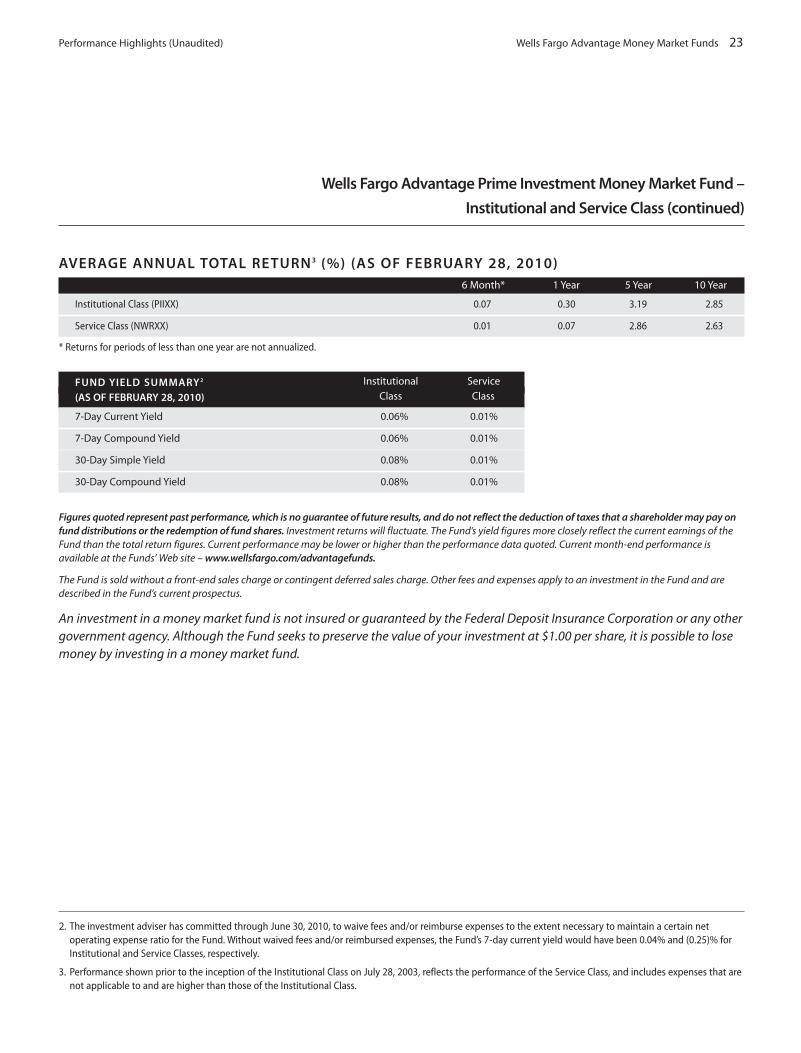
AVERAGE ANNUAL TOTAL RETURN 3 (%) (AS OF FEBRUARY 28, 2010)6 Month* 1 Year 5 Year 10 Year
Institutional Class (PIIXX) 0.07 0.30 3.19 2.85
Service Class (NWRXX) 0.01 0.07 2.86 2.63
* Returns for periods of less than one year are not annualized.
FUND YIELD SUMMARY 2 Institutional Service
(AS OF FEBRUARY 28, 2010) Class Class
7-Day Current Yield 0.06% 0.01%
7-Day Compound Yield 0.06% 0.01%
30-Day Simple Yield 0.08% 0.01%
30-Day Compound Yield 0.08% 0.01%
Figures quoted represent past performance, which is no guarantee of future results, and do not reflect the deduction of taxes that a shareholder may pay onfund distributions or the redemption of fund shares. Investment returns will fluctuate. The Fund’s yield figures more closely reflect the current earnings of theFund than the total return figures. Current performance may be lower or higher than the performance data quoted. Current month-end performance isavailable at the Funds’ Web site – www.wellsfargo.com/advantagefunds.
The Fund is sold without a front-end sales charge or contingent deferred sales charge. Other fees and expenses apply to an investment in the Fund and aredescribed in the Fund’s current prospectus.
An investment in a money market fund is not insured or guaranteed by the Federal Deposit Insurance Corporation or any othergovernment agency. Although the Fund seeks to preserve the value of your investment at $1.00 per share, it is possible to losemoney by investing in a money market fund.
2. The investment adviser has committed through June 30, 2010, to waive fees and/or reimburse expenses to the extent necessary to maintain a certain netoperating expense ratio for the Fund. Without waived fees and/or reimbursed expenses, the Fund’s 7-day current yield would have been 0.04% and (0.25)% forInstitutional and Service Classes, respectively.
3. Performance shown prior to the inception of the Institutional Class on July 28, 2003, reflects the performance of the Service Class, and includes expenses that arenot applicable to and are higher than those of the Institutional Class.
24 Wells Fargo Advantage Money Market Funds Performance Highlights (Unaudited)
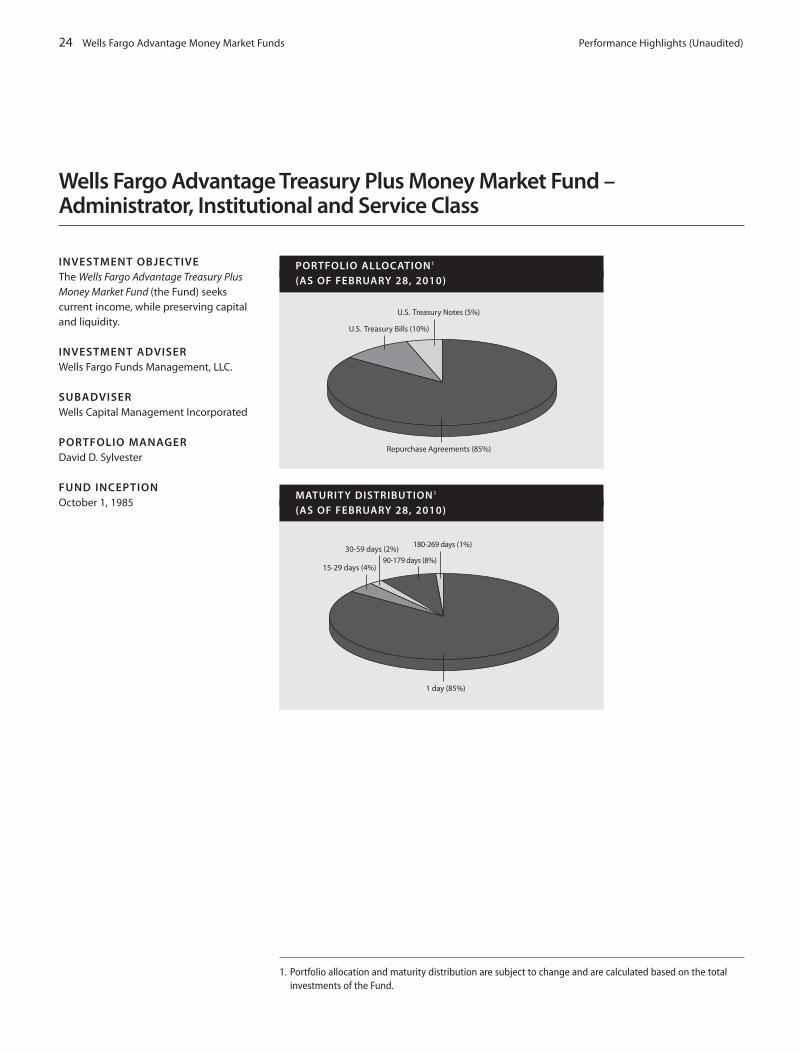
Wells Fargo Advantage Treasury Plus Money Market Fund – Administrator, Institutional and Service Class
INVESTMENT OBJECTIVEThe Wells Fargo Advantage Treasury PlusMoney Market Fund (the Fund) seekscurrent income, while preserving capitaland liquidity.
INVESTMENT ADVISERWells Fargo Funds Management, LLC.
SUBADVISERWells Capital Management Incorporated
PORTFOLIO MANAGERDavid D. Sylvester
FUND INCEPTION October 1, 1985
1. Portfolio allocation and maturity distribution are subject to change and are calculated based on the totalinvestments of the Fund.
Repurchase Agreements (85%)
U.S. Treasury Bills (10%)
U.S. Treasury Notes (5%)
PORTFOLIO ALLOCATION 1
(AS OF FEBRUARY 28, 2010)
1 day (85%)
90-179 days (8%)15-29 days (4%)
30-59 days (2%)180-269 days (1%)
MATURITY DISTRIBUTION 1
(AS OF FEBRUARY 28, 2010)

Performance Highlights (Unaudited) Wells Fargo Advantage Money Market Funds 25
Wells Fargo Advantage Treasury Plus Money Market Fund –
Administrator, Institutional and Service Class (continued)
AVERAGE ANNUAL TOTAL RETURN 3 (%) (AS OF FEBRUARY 28, 2010)6 Month* 1 Year 5 Year 10 Year
Administrator Class (WTPXX) 0.00 0.01 2.63 2.54
Institutional Class (PISXX) 0.00 0.02 2.75 2.68
Service Class (PRVXX) 0.00 0.01 2.52 2.43
* Returns for periods of less than one year are not annualized.
FUND YIELD SUMMARY 2 Administrator Institutional Service(AS OF FEBRUARY 28, 2010) Class Class Class
7-Day Current Yield 0.01% 0.01% 0.01%
7-Day Compound Yield 0.01% 0.01% 0.01%
30-Day Simple Yield 0.01% 0.01% 0.01%
30-Day Compound Yield 0.01% 0.01% 0.01%
Figures quoted represent past performance, which is no guarantee of future results, and do not reflect the deduction of taxes that a shareholder may pay onfund distributions or the redemption of fund shares. Investment returns will fluctuate. The Fund’s yield figures more closely reflect the current earnings of theFund than the total return figures. Current performance may be lower or higher than the performance data quoted. Current month-end performance isavailable at the Funds’ Web site – www.wellsfargo.com/advantagefunds.
The Fund is sold without a front-end sales charge or contingent deferred sales charge. Other fees and expenses apply to an investment in the Fund and aredescribed in the Fund’s current prospectus.
An investment in a money market fund is not insured or guaranteed by the Federal Deposit Insurance Corporation or any othergovernment agency. Although the Fund seeks to preserve the value of your investment at $1.00 per share, it is possible to losemoney by investing in a money market fund. The U.S. Government guarantee applies to certain of the underlying securitiesheld by the Fund and not to shares of the Fund itself.
2. The investment adviser has committed through June 30, 2010, to waive fees and/or reimburse expenses to the extent necessary to maintain a certain netoperating expense ratio for the Fund. Without waived fees and/or reimbursed expenses, the Fund’s 7-day current yield would have been (0.26)%, (0.14)% and(0.43)% for Administrator, Institutional and Service Classes, respectively.
3. Performance shown prior to the inception of the Administrator Class on March 31, 2008, reflects the performance of the Institutional Class and includesexpenses that are not applicable to and are lower than those of the Administrator Class.

26 Wells Fargo Advantage Money Market Funds Performance Highlights (Unaudited)
Wells Fargo Advantage 100% Treasury Money Market Fund – Service Class
INVESTMENT OBJECTIVEThe Wells Fargo Advantage 100% Treasury Money Market Fund (the Fund)seeks current income exempt from moststate and local individual income taxes,while preserving capital and liquidity.
INVESTMENT ADVISERWells Fargo Funds Management, LLC.
SUBADVISERWells Capital Management Incorporated
PORTFOLIO MANAGERDavid D. Sylvester
FUND INCEPTION December 3, 1990
1. Portfolio allocation and maturity distribution are subject to change and are calculated based on the totalinvestments of the Fund.
U.S. Treasury Bills (99%)
U.S. Treasury Notes (1%)
PORTFOLIO ALLOCATION 1
(AS OF FEBRUARY 28, 2010)
180-269 days (1%)2-7 days (8%)
90-179 days (16%)
60-89 days (24%)
30-59 days (27%)
15-29 days (15%)8-14 days (9%)
MATURITY DISTRIBUTION 1
(AS OF FEBRUARY 28, 2010)

Performance Highlights (Unaudited) Wells Fargo Advantage Money Market Funds 27
Wells Fargo Advantage 100% Treasury Money Market Fund – Service Class (continued)
AVERAGE ANNUAL TOTAL RETURN (%) (AS OF FEBRUARY 28, 2010)6 Month* 1 Year 5 Year 10 Year
Service Class (NWTXX) 0.03 0.03 2.41 2.33
* Returns for periods of less than one year are not annualized.
FUND YIELD SUMMARY 2
(AS OF FEBRUARY 28, 2010)
7-Day Current Yield 0.01%
7-Day Compound Yield 0.01%
30-Day Simple Yield 0.01%
30-Day Compound Yield 0.01%
Figures quoted represent past performance, which is no guarantee of future results, and do not reflect the deduction of taxes that a shareholder may pay onfund distributions or the redemption of fund shares. Investment returns will fluctuate. The Fund’s yield figures more closely reflect the current earnings of theFund than the total return figures. Current performance may be lower or higher than the performance data quoted. Current month-end performance isavailable at the Funds’ Web site – www.wellsfargo.com/advantagefunds.
The Fund is sold without a front-end sales charge or contingent deferred sales charge. Other fees and expenses apply to an investment in the Fund and aredescribed in the Fund’s current prospectus.
An investment in a money market fund is not insured or guaranteed by the Federal Deposit Insurance Corporation or any othergovernment agency. Although the Fund seeks to preserve the value of your investment at $1.00 per share, it is possible to losemoney by investing in a money market fund. The U.S. Government guarantee applies to certain of the underlying securitiesheld by the Fund and not to shares of the Fund itself.
2. The investment adviser has committed through June 30, 2010, to waive fees and/or reimburse expenses to the extent necessary to maintain a certain netoperating expense ratio for the Fund. Without waived fees and/or reimbursed expenses, the Fund’s 7-day current yield would have been (0.60)%.

28 Wells Fargo Advantage Money Market Funds Fund Expenses (Unaudited)
As a shareholder of the Fund, you incur two types of costs: (1) transaction costs, including sales charges (loads) onpurchase payments, redemption fees (if any) and exchange fees (if any); and (2) ongoing costs, including managementfees; distribution (12b-1) and/or shareholder service fees; and other Fund expenses. This example is intended to help youunderstand your ongoing costs (in dollars) of investing in the Fund and to compare these costs with the ongoing costsof investing in other mutual funds.
The example is based on an investment of $1,000 invested at the beginning of the six-month period and held for theentire six-month period, from September 1, 2009 to February 28, 2010.
Actual expensesThe “Actual” line of the table below provides information about actual account values and actual expenses. You may usethe information in this line, together with the amount you invested, to estimate the expenses that you paid over theperiod. Simply divide your account value by $1,000 (for example, an $8,600 account value divided by $1,000 = 8.6), thenmultiply the result by the number in the “Actual” line under the heading entitled “Expenses Paid During Period” for yourapplicable class of shares to estimate the expenses you paid on your account during this period.
Hypothetical example for comparison purposesThe “Hypothetical” line of the table below provides information about hypothetical account values and hypotheticalexpenses based on the Fund’s actual expense ratio and an assumed rate of return of 5% per year before expenses, whichis not the Fund’s actual return. The hypothetical account values and expenses may not be used to estimate the actualending account balance or expenses you paid for the period. You may use this information to compare the ongoingcosts of investing in the Fund and other funds. To do so, compare this 5% hypothetical example with the 5%hypothetical examples that appear in the shareholder reports of the other funds.
Please note that the expenses shown in the table are meant to highlight your ongoing costs only and do not reflect anytransactional costs, such as sales charges (loads), redemption fees, or exchange fees. Therefore, the “Hypothetical” line ofthe table is useful in comparing ongoing costs only, and will not help you determine the relative total costs of owningdifferent funds. In addition, if these transactional costs were included, your costs would have been higher.
Beginning EndingAccount Value Account Value Expenses Paid Net Annual
California Municipal Money Market Fund 09-01-2009 02-28-2010 During Period1 Expense Ratio
Institutional Class
Actual $1,000.00 $1,000.40 $0.99 0.20%
Hypothetical (5% return before expenses) $1,000.00 $1,023.80 $1.00 0.20%
Service Class
Actual $1,000.00 $1,000.10 $1.29 0.26%
Hypothetical (5% return before expenses) $1,000.00 $1,023.51 $1.30 0.26%
Cash Investment Money Market Fund
Administrator Class
Actual $1,000.00 $1,000.30 $1.59 0.32%
Hypothetical (5% return before expenses) $1,000.00 $1,023.21 $1.61 0.32%
Institutional Class
Actual $1,000.00 $1,000.80 $0.99 0.20%
Hypothetical (5% return before expenses) $1,000.00 $1,023.80 $1.00 0.20%
Select Class
Actual $1,000.00 $1,001.20 $0.65 0.13%
Hypothetical (5% return before expenses) $1,000.00 $1,024.15 $0.65 0.13%
Service Class
Actual $1,000.00 $1,000.10 $1.79 0.36%
Hypothetical (5% return before expenses) $1,000.00 $1,023.01 $1.81 0.36%

Fund Expenses (Unaudited) Wells Fargo Advantage Money Market Funds 29
Beginning EndingAccount Value Account Value Expenses Paid Net Annual
Government Money Market Fund 09-01-2009 02-28-2010 During Period1 Expense Ratio
Administrator Class
Actual $1,000.00 $1,000.10 $0.89 0.18%
Hypothetical (5% return before expenses) $1,000.00 $1,023.90 $0.90 0.18%
Institutional Class
Actual $1,000.00 $1,000.10 $0.84 0.17%
Hypothetical (5% return before expenses) $1,000.00 $1,023.95 $0.85 0.17%
Service Class
Actual $1,000.00 $1,000.10 $0.89 0.18%
Hypothetical (5% return before expenses) $1,000.00 $1,023.90 $0.90 0.18%
Heritage Money Market Fund
Administrator Class
Actual $1,000.00 $1,000.20 $1.54 0.31%
Hypothetical (5% return before expenses) $1,000.00 $1,023.26 $1.56 0.31%
Institutional Class
Actual $1,000.00 $1,000.70 $0.99 0.20%
Hypothetical (5% return before expenses) $1,000.00 $1,023.80 $1.00 0.20%
Select Class
Actual $1,000.00 $1,001.10 $0.65 0.13%
Hypothetical (5% return before expenses) $1,000.00 $1,024.15 $0.65 0.13%
Municipal Money Market Fund
Institutional Class
Actual $1,000.00 $1,001.00 $0.99 0.20%
Hypothetical (5% return before expenses) $1,000.00 $1,023.80 $1.00 0.20%
National Tax-Free Money Market Fund
Administrator Class
Actual $1,000.00 $1,000.20 $1.34 0.27%
Hypothetical (5% return before expenses) $1,000.00 $1,023.46 $1.35 0.27%
Institutional Class
Actual $1,000.00 $1,000.60 $0.99 0.20%
Hypothetical (5% return before expenses) $1,000.00 $1,023.80 $1.00 0.20%
Service Class
Actual $1,000.00 $1,000.10 $1.44 0.29%
Hypothetical (5% return before expenses) $1,000.00 $1,023.36 $1.45 0.29%
Prime Investment Money Market Fund
Institutional Class
Actual $1,000.00 $1,000.70 $0.99 0.20%
Hypothetical (5% return before expenses) $1,000.00 $1,023.80 $1.00 0.20%
Service Class
Actual $1,000.00 $1,000.10 $1.64 0.33%
Hypothetical (5% return before expenses) $1,000.00 $1,023.16 $1.66 0.33%

30 Wells Fargo Advantage Money Market Funds Fund Expenses (Unaudited)
Beginning EndingAccount Value Account Value Expenses Paid Net Annual
Treasury Plus Money Market Fund 09-01-2009 02-28-2010 During Period1 Expense Ratio
Administrator Class
Actual $1,000.00 $1,000.00 $0.45 0.09%
Hypothetical (5% return before expenses) $1,000.00 $1,024.35 $0.45 0.09%
Institutional Class
Actual $1,000.00 $1,000.00 $0.50 0.10%
Hypothetical (5% return before expenses) $1,000.00 $1,024.30 $0.50 0.10%
Service Class
Actual $1,000.00 $1,000.00 $0.50 0.10%
Hypothetical (5% return before expenses) $1,000.00 $1,024.30 $0.50 0.10%
100% Treasury Money Market Fund
Service Class
Actual $1,000.00 $1,000.30 $0.55 0.11%
Hypothetical (5% return before expenses) $1,000.00 $1,024.25 $0.55 0.11%
1. Expenses are equal to the Fund’s annualized expense ratio multiplied by the average account value over the period, multiplied by the number of days in the mostrecent fiscal half-year divided by the number of days in the fiscal year (to reflect the one-half year period.)

Portfolio of Investments—February 28, 2010 Wells Fargo Advantage Money Market Funds 31
CALIFORNIA MUNICIPAL MONEY MARKET FUND
Principal Security Name Interest Rate Maturity Date Value
Commercial Paper: 6.62%$ 24,600,000 California Infrastructure & Economic Development 0.15% 03/04/2010 $ 24,600,000
10,000,000 California Infrastructure & Economic Development 0.17 04/06/2010 10,000,00025,985,000 Golden Gate Bridge, Highway & Transportation District 0.16 03/09/2010 25,985,00012,245,000 Imperial Irrigation District California Electric & Water System 0.21 03/10/2010 12,245,000
4,100,000 Riverside County Teter Financing 0.18 03/10/2010 4,100,0005,540,000 San Diego Regional Airport Authority 0.37 03/11/2010 5,540,000
16,880,000 San Francisco Public Utilities Commission 0.20 04/05/2010 16,880,0008,425,000 San Francisco Public Utilities Commission 0.18 04/05/2010 8,425,000
10,000,000 San Francisco Public Utilities Commission 0.20 05/04/2010 10,000,00053,185,000 San Joaquin Transportation Authority 0.18 03/10/2010 53,185,000
Total Commercial Paper (Cost $170,960,000) 170,960,000
Municipal Bonds & Notes: 93.32%
California: 91.70%12,200,000 ABAG Finance Authority for Nonprofit Corporation California Branson School
(Other Revenue, Allied Irish Bank plc LOC)§± 0.60 07/01/2038 12,200,00016,075,000 ABAG Finance Authority for Nonprofit Corporation California Marin Country
Day School (Private School Revenue, US Bank NA LOC)§± 0.18 07/01/2037 16,075,00011,200,000 ABAG Finance Authority for Nonprofit Corporation California MFHR Fine Arts
Building Projects Series A (Housing Revenue, FNMA Insured)§± 0.22 07/15/2035 11,200,0006,965,000 ABAG Finance Authority for Nonprofit Corporation California MFHR GAIA
Building Project Series A (Housing Revenue, FNMA Insured)§± 0.22 09/15/2032 6,965,0001,485,000 ABAG Finance Authority for Nonprofit Corporation California St. Anthony
Foundation (Other Revenue, Bank of America NA LOC)§± 0.19 03/01/2037 1,485,00010,000,000 ABAG Finance Authority for Nonprofit Corporation California The Head-Royce
School (Private School Revenue, Bank of America NA LOC)§± 0.19 09/01/2036 10,000,0003,900,000 ABAG Finance Authority for Nonprofit Corporation Schools Sacred Heart
Series FB (Private School Revenue, Bank of America NA LOC)§± 0.17 06/01/2030 3,900,00010,865,000 ABAG Finance Authority for Nonprofit Corporations California Air Force Village
West Incorporated (Other Revenue, KBC Bank NV LOC)§± 0.20 05/15/2035 10,865,00010,110,000 ABAG Finance Authority for Nonprofit Corporations California Colma
BART Apartments Series A (Housing Revenue, Bank of America NA LOC)§± 0.25 11/15/2035 10,110,0005,435,000 ABAG Finance Authority for Nonprofit Corporations California Francis
Parker School Project (Private School Revenue, Bank of New York LOC)§± 0.18 09/01/2036 5,435,0004,180,000 ABAG Finance Authority for Nonprofit Corporations California La Jolla
County Day School Series A (Private School Revenue, Allied Irish Bank plc LOC)§± 0.60 09/01/2036 4,180,00019,500,000 ABAG Finance Authority for Nonprofit Corporations California La Jolla County
Day School Series A (Private School Revenue, Allied Irish Bank plc LOC)§± 0.60 09/01/2037 19,500,00010,000,000 ABAG Finance Authority for Nonprofit Corporations California Menlo School
(Private School Revenue, Allied Irish Bank plc LOC)§± 0.16 09/01/2033 10,000,0002,680,000 ABAG Finance Authority for Nonprofit Corporations California San Francisco
University Series A (Private School Revenue, Allied Irish Bank plc LOC)§± 0.60 04/01/2035 2,680,0004,600,000 ABAG Finance Authority for Nonprofit Corporations California Zoological
Society of San Diego (Other Revenue, Bank of America NA LOC)§± 0.17 10/01/2034 4,600,0001,895,000 Anaheim CA Housing Authority MFHR Monterey Apartments Series B
(MFHR, FNMA Insured)§± 0.21 05/15/2027 1,895,00012,600,000 Anaheim CA Housing Authority Park Vista Apartments (MFHR, FHLMC Insured)§± 0.18 07/01/2033 12,600,000
6,000,000 Anaheim CA Housing Authority Sea Wind Apartments Project Series C(MFHR, FNMA Insured)§± 0.20 07/15/2033 6,000,000
7,768,500 Arcadia CA USD Series 2679 (Other Revenue, First Security Bank LOC)§± 0.20 08/01/2013 7,768,5005,900,000 Bakersfield CA Series B (Water & Wastewater Authority Revenue, First
Security Bank LOC)§± 0.24 09/01/2035 5,900,0009,100,000 Bay Area Toll Authority Various San Francisco Bay Area Series D1
(Highway Revenue Tolls Revenue)§± 0.16 04/01/2045 9,100,000

32 Wells Fargo Advantage Money Market Funds Portfolio of Investments—February 28, 2010
CALIFORNIA MUNICIPAL MONEY MARKET FUND
Principal Security Name Interest Rate Maturity Date Value
California (continued)$ 36,430,000 Big Bear Lake CA Southwest Gas Corporation Project Series A
(IDR, KBC Bank NV LOC)§± 0.21% 12/01/2028 $ 36,430,00025,040,000 California Alternative Energy Source Financing Authority GE Capital Corporation
Series A (Electric Revenue)§± 0.22 10/01/2020 25,040,00039,770,000 California Educational Facilities Authority California Institute of Technology
Series B (College & University Revenue, GO of Institution Insured)§± 0.16 10/01/2036 39,770,0001,650,000 California Educational Facilities Authority Chapman University Series A
(College & University Revenue, Bank of America NA LOC)§± 0.15 10/01/2036 1,650,00012,500,000 California Educational Facilities Authority Charles R Drew University
(Other Revenue, Sovereign Bank FSB LOC)§± 0.36 11/01/2042 12,500,0005,500,000 California Educational Facilities Authority University of La Verne
(Educational Facilities Revenue, Allied Irish Bank plc LOC)§± 0.36 03/01/2038 5,500,0003,900,000 California Infrastructure & Economic Development Bank California Academy
Series B (Other Revenue, Allied Irish Bank plc LOC)§± 0.18 09/01/2038 3,900,0003,730,000 California Infrastructure & Economic Development Bank Colburn School
Series B (Other Revenue, Allied Irish Bank plc LOC)§± 0.37 08/01/2037 3,730,0002,600,000 California Infrastructure & Economic Development Bank Lycee Francias de
Los Angeles Project (College & University Revenue, Mellon Bank NA LOC)§± 0.17 09/01/2036 2,600,000520,000 California Infrastructure & Economic Development Bank ROCS RR II R-11527
(Toll Road Revenue, AMBAC Insured)§± 0.18 07/01/2030 520,0007,500,000 California Infrastructure & Economic Development Bank Sage Hill School Project
(Other Revenue, Allied Irish Bank plc LOC)§± 0.59 06/01/2038 7,500,0007,000,000 California Infrastructure & Economic Development Bank San Francisco Ballet
(Other Revenue, Allied Irish Bank plc LOC)§± 0.18 08/01/2038 7,000,0001,125,000 California Infrastructure & Economic Development Bank Southern CA Public
Radio Project (Other Revenue, Allied Irish Bank plc LOC)§± 0.24 10/01/2025 1,125,00010,775,000 California Infrastructure & Economic Development Bank St. Margarets
Episcopal School (Other Revenue, Allied Irish Bank plc LOC)§± 0.60 01/01/2038 10,775,0005,600,000 California Infrastructure & Economic Development Bank The Bay Institute
Aquarium Foundation (Other Revenue, FHLMC Insured)§± 0.18 06/01/2025 5,600,0006,200,000 California Municipal Finance Authority (Economic Development Revenue,
California Bank & Trust LOC)§± 0.18 08/01/2039 6,200,0006,935,000 California Municipal Finance Authority (Economic Development Revenue,
Pacific National LOC)§± 0.18 12/01/2042 6,935,0009,100,000 California Municipal Finance Authority (Private School Revenue,
Allied Irish Bank plc LOC)§± 0.60 09/01/2036 9,100,0005,600,000 California Municipal Finance Authority Chevron USA Incorporated Project
(Other Revenue)§± 0.10 06/01/2025 5,600,00016,705,000 California Municipal Finance Authority Pacific Institute Series A (Housing Revenue,
California Bank & Trust LOC)§± 0.15 08/01/2037 16,705,000400,000 California PCA BP West Coast Product LLC (Other Revenue)§± 0.13 01/01/2043 400,000
1,400,000 California PCFA Wadham Energy (PCR, BNP Paribas LOC)§± 0.17 11/01/2017 1,400,0006,275,000 California PCFA Wadham Energy Series C (Other Revenue, Banque
Nationale Paris LOC)§± 0.17 11/01/2017 6,275,0004,950,000 California Stanford Hospital Series B (HFFA Revenue, Allied Irish Bank plc LOC)§± 0.37 07/01/2034 4,950,000
23,600,000 California Stanford Hospital Series B (HFFA Revenue, First Security Bank LOC)§± 0.22 11/15/2036 23,600,00046,900,000 California Stanford Hospital Series B (Recreational Revenue, JPMorgan
Chase Bank LOC)§± 0.11 06/01/2034 46,900,0007,480,000 California State Department of Veterans Affairs (Other Revenue)§± 0.25 12/01/2014 7,480,000
14,900,000 California State DWR Power Supply Revenue Series B2 (Power Revenue,BNP Paribas LOC)§± 0.14 05/01/2022 14,900,000
12,290,000 California State DWR Power Supply Revenue Series B6 (Water & WastewaterAuthority Revenue, State Street Bank & Trust Company NA LOC)§± 0.15 05/01/2022 12,290,000
7,800,000 California State DWR Power Supply Revenue Series C 7 (Electric, Power &Light Revenue, AGM Insured)§± 0.25 05/01/2022 7,800,000
4,380,000 California State DWR Power Supply Revenue Series C1 (Power Revenue,Dexia Credit Local de France LOC)§± 0.19 05/01/2022 4,380,000

Portfolio of Investments—February 28, 2010 Wells Fargo Advantage Money Market Funds 33
CALIFORNIA MUNICIPAL MONEY MARKET FUND
Principal Security Name Interest Rate Maturity Date Value
California (continued)$ 5,030,000 California State DWR Power Supply Revenue Series C9
(Electric Revenue, Citibank NA LOC)§± 0.16% 05/01/2022 $ 5,030,0002,130,000 California State DWR Power Supply Subseries F2 (Water Revenue,
JPMorgan Chase Bank LOC)§± 0.11 05/01/2020 2,130,0002,000,000 California State DWR Power Supply Subseries G7 (Water Revenue, FSA Insured)§± 0.23 05/01/2017 2,000,0001,650,000 California State DWR Power Supply Subseries I1 (Water Revenue,
Allied Irish Bank plc LOC)§± 0.18 05/01/2022 1,650,0003,995,000 California State DWR Series 3019 (Water Revenue, JPMorgan Chase Bank LOC)§± 0.18 06/01/2016 3,995,000
14,800,000 California State Economic Recovery Revenue Series C-2 (Recovery Revenue,JPMorgan Chase Bank LOC)§± 0.11 07/01/2023 14,800,000
38,755,000 California State Economic Recovery Series C 16 (Sales Tax Revenue)§± 0.21 07/01/2023 38,755,00022,315,000 California State Series 2758 (Other Revenue, AMBAC Insured)± 0.45 04/01/2010 22,315,00014,685,000 California State Series A Subseries A1 (Other Revenue, Fortis Banque LOC)§± 0.18 05/01/2040 14,685,000
8,560,000 California State Series A Subseries A2 (Other Revenue, Calyon Bank LOC)§± 0.20 05/01/2040 8,560,00016,275,000 California State Series A-2 ( General Fund, Bank of Montreal LOC)§± 0.10 05/01/2033 16,275,000
7,125,000 California State Series B Subseries B1 (Other Revenue, Bank of America NA LOC)§± 0.20 05/01/2040 7,125,00012,825,000 California Statewide CDA (Hospital Revenue, Citibank NA LOC)§±†† 0.23 08/15/2032 12,825,000
3,125,000 California Statewide CDA (Private School Revenue, Allied Irish Bank plc LOC)§± 0.35 10/01/2036 3,125,0002,155,000 California Statewide CDA Aegis Moraga Project C (MFHR, FNMA Insured)§± 0.25 07/01/2027 2,155,0006,270,000 California Statewide CDA Aegis Pleasant Hill Series H (MFHR, FNMA Insured)§± 0.20 07/01/2027 6,270,0006,645,000 California Statewide CDA Arbor Ridge Apartments Series B (MFHR, FHLMC Insured)§± 0.21 11/01/2036 6,645,0004,155,000 California Statewide CDA Archer School for Girls Incorporated
(Private School Revenue, Allied Irish Bank plc LOC)§± 0.60 05/01/2035 4,155,00022,150,000 California Statewide CDA Azusa Pacific University Project (College &
University Revenue, Allied Irish Bank plc LOC)§± 0.49 04/01/2039 22,150,0009,390,000 California Statewide CDA Belmont Project Series F (MFHR, FNMA Insured)§± 0.18 06/15/2038 9,390,0004,000,000 California Statewide CDA Charter Court Apartments Series L (MFHR, FHLMC Insured)§± 0.21 09/01/2040 4,000,0004,850,000 California Statewide CDA Culinary Institute of America (Other Revenue,
Allied Irish Bank plc LOC)§± 0.40 10/01/2038 4,850,0001,925,000 California Statewide CDA Grande Apartments Series TT (Housing Revenue,
FNMA Insured)§± 0.22 12/15/2034 1,925,0006,000,000 California Statewide CDA Heritage Park Apartments Series C
(MFHR, FHLMC Insured)§± 0.17 01/01/2038 6,000,0003,310,000 California Statewide CDA Horizons Indio Series F (Housing Revenue,
Citibank NA LOC)§± 0.22 07/01/2038 3,310,0006,100,000 California Statewide CDA John Muir Health Series B (Hospital Revenue,
UBS AG LOC)§± 0.16 08/15/2036 6,100,0006,300,000 California Statewide CDA La Puente Apartments Series JJ (MFHR, US Bank NA LOC)§± 0.16 11/01/2031 6,300,000
18,110,000 California Statewide CDA Livermore Valley Arts Center Project (Other Revenue,Bank of New York LOC)§± 0.16 12/01/2036 18,110,000
6,135,000 California Statewide CDA Marin Horizon School (Private School Revenue,Allied Irish Bank plc LOC)§± 0.60 07/01/2036 6,135,000
6,500,000 California Statewide CDA Marinears Pointe Series A (MFHR, FNMA Insured)§± 0.17 02/15/2036 6,500,00010,600,000 California Statewide CDA MFHR Canyon Country Apartments
Series M (MFHR , FHLMC Insured)§± 0.19 12/01/2034 10,600,0003,985,000 California Statewide CDA MFHR Granite Oaks Apartments Series R
(MFHR, FNMA Insured)§± 0.22 10/15/2030 3,985,00012,000,000 California Statewide CDA MFHR Imperial Park Apartments Series 00
(Housing Revenue, FNMA Insured)§± 0.25 11/01/2040 12,000,0003,200,000 California Statewide CDA MFHR Series AA (Housing Revenue, FNMA Insured)§± 0.20 04/15/2035 3,200,000
11,330,000 California Statewide CDA National Center International Schools A(Private School Revenue, Allied Irish Bank plc LOC)§± 0.36 05/01/2026 11,330,000
7,840,000 California Statewide CDA Oakmont Senior Living(Housing Revenue, FNMA Insured)§± 0.19 08/01/2031 7,840,000
8,640,000 California Statewide CDA Olympus Park Apartments Series Y (MFHR, FNMA Insured)§± 0.20 10/15/2030 8,640,000

34 Wells Fargo Advantage Money Market Funds Portfolio of Investments—February 28, 2010
CALIFORNIA MUNICIPAL MONEY MARKET FUND
Principal Security Name Interest Rate Maturity Date Value
California (continued)$ 9,400,000 California Statewide CDA Rady Childrens Hospital Series B (HCFR,
Bank of the West LOC)§± 0.13% 08/15/2047 $ 9,400,0005,265,000 California Statewide CDA Seasons Senior Apartments Series B
(MFHR, FNMA Insured)§± 0.20 05/15/2037 5,265,0005,500,000 California Statewide CDA Series 2680 (Other Revenue, JPMorgan Chase Bank LOC)§± 0.30 05/15/2016 5,500,0005,665,000 California Statewide CDA Sunrise of Danville Project Series A (MFHR, FNMA Insured)§± 0.20 05/01/2027 5,665,0001,870,000 California Statewide CDA Sweep Loan Program Series A (HCFR, Citibank NA LOC)§± 0.18 08/01/2035 1,870,0002,500,000 California Statewide CDA Tyrella Gardens Apartments Series B (Housing Revenue,
Citibank NA LOC)§± 0.25 06/01/2036 2,500,00010,000,000 California Statewide CDA University of San Diego (College & University Revenue,
Banque Nationale Paris LOC)§± 0.17 10/01/2045 10,000,0004,000,000 California Statewide CDA Villa Paseo Senior Project MM (MFHR, East West Bank LOC)§± 0.19 11/01/2035 4,000,0002,605,000 California Statewide CDA Village at Hesperia Series CCC (MFHR, FNMA Insured)§± 0.20 11/15/2039 2,605,0004,375,000 California Statewide CDA Village at Ninth Apartments Series D
(Housing Revenue, FNMA Insured)§± 0.22 11/15/2035 4,375,0002,600,000 California Statewide CDA Village at Shaw Apartments Series E (MFHR,
FNMA Insured)§± 0.22 11/15/2035 2,600,00079,950,000 California Statewide CDA Western University Health Series A (Other Revenue,
Bank of New York LOC)§± 0.36 06/01/2039 79,950,0005,490,000 California Statewide CDA YMCA East Bay Project (Other Revenue,
Allied Irish Bank plc LOC)§± 0.36 06/01/2027 5,490,0001,160,000 California Statewide Communities Authority Center for Early Education
(Private School Revenue, Allied Irish Bank plc LOC)§± 0.60 09/01/2031 1,160,0004,538,000 California University of San Francisco Series 2005B (Educational Facilities Revenue,
Bank of America NA LOC)§± 0.17 10/01/2035 4,538,0001,000,000 Castacic CA USD COP School Facilities Bridge Funding Program (Other Revenue,
Dexia Credit Local de France LOC)§± 0.70 09/01/2026 1,000,0002,100,000 Concord CA MFHR (Other Revenue, FHLMC Insured)§± 0.25 12/01/2016 2,100,0006,440,000 Contra Costa County CA Housing Authority Series C (Housing Revenue,
FHLMC Insured)§± 0.17 11/15/2017 6,440,0002,000,000 Contra Costa County CA MFHR Series B (MFHR, FNMA Insured)§± 0.17 11/15/2022 2,000,0007,000,000 Corona CA Household Bank Project B (MFHR, FNMA Insured)§± 0.21 02/01/2023 7,000,0002,640,000 Deutsche Bank Spears Lifers Trust DB-382 (Other Revenue, NATL - RE Insured)§± 0.19 08/01/2030 2,640,0002,325,000 Deutsche Bank Spears Lifers Trust DB-383 (Property Tax Revenue, FGIC Insured)§± 0.19 08/01/2035 2,325,0005,400,000 Deutsche Bank Spears Lifers Trust DB-384 (Property Tax Revenue, NATL - RE Insured)§± 0.19 06/01/2032 5,400,000
29,015,000 Deutsche Bank Spears Lifers Trust Series DB-287 (Other Revenue)§± 0.19 09/01/2037 29,015,0005,775,000 Deutsche Bank Spears Lifers Trust Series DB-445 (Property Tax Revenue,
First Security Bank LOC)§± 0.20 08/01/2032 5,775,0008,465,000 Deutsche Bank Spears Lifers Trust Series DB-448 (Other Revenue,
First Security Bank LOC)§± 0.20 07/01/2032 8,465,0003,994,000 Deutsche Bank Spears Lifers Trust Series DB-457 (Other Revenue,
First Security Bank LOC)§± 0.20 08/01/2032 3,994,0005,142,000 Deutsche Bank Spears Lifers Trust Series DB-477 (Other Revenue,
First Security Bank LOC)§± 0.20 12/01/2024 5,142,00014,406,000 Deutsche Bank Spears Lifers Trust Series DB-490 (Property Tax Revenue,
First Security Bank LOC)§± 0.20 08/01/2042 14,406,00010,510,000 Deutsche Bank Spears Lifers Trust Series DB-490 (Tax Incremental Revenue,
First Security Bank LOC)§± 0.20 02/01/2031 10,510,0004,095,000 Deutsche Bank Spears Lifers Trust Series DB-561 (Other Revenue,
First Security Bank LOC)§± 0.23 07/01/2031 4,095,0005,860,000 Deutsche Bank Spears Lifers Trust Series DB-600 (Water Revenue,
First Security Bank LOC)§± 0.20 02/01/2038 5,860,0005,505,000 Deutsche Bank Spears Lifers Trust Series DB-621 (Property Tax Revenue,
First Security Bank LOC)§± 0.20 08/01/2028 5,505,0004,065,000 Deutsche Bank Spears Lifers Trust Series DB-628 (Property Tax Revenue,
First Security Bank LOC)§± 0.20 08/01/2031 4,065,000

Portfolio of Investments—February 28, 2010 Wells Fargo Advantage Money Market Funds 35
CALIFORNIA MUNICIPAL MONEY MARKET FUND
Principal Security Name Interest Rate Maturity Date Value
California (continued)$ 6,360,000 Deutsche Bank Spears Lifers Trust Series DB-629 (Property
Tax Revenue, NATL - RE Insured)§± 0.20% 08/01/2031 $ 6,360,0004,520,000 Deutsche Bank Spears Lifers Trust Series DB-630 (Property
Tax Revenue, NATL - RE Insured)§± 0.20 02/01/2024 4,520,00011,910,000 Deutsche Bank Spears Lifers Trust Series DB-631 (Property
Tax Revenue, NATL - RE Insured)§± 0.20 09/01/2027 11,910,00011,570,000 Deutsche Bank Spears Lifers Trust Series DB-632 (Property Tax Revenue,
First Security Bank LOC)§± 0.20 08/01/2033 11,570,0007,570,000 Deutsche Bank Spears Lifers Trust Series DB-649 (Property
Tax Revenue, NATL - RE Insured)§± 0.20 06/01/2031 7,570,0008,453,000 Deutsche Bank Spears Lifers Trust Series DB-670 (Property Tax Revenue,
First Security Bank LOC)§± 0.20 06/01/2028 8,453,0002,380,000 Deutsche Bank Spears Lifers Trust Series DBE-500 (Other Revenue, AMBAC Insured)§± 0.23 11/01/2038 2,380,0001,690,000 Deutsche Bank Spears Lifers Trust Series DBE-525 (Other Revenue, FGIC Insured)§± 0.20 06/01/2035 1,690,0001,025,000 Deutsche Bank Spears Lifers Trust Series DBE-575 (Other Revenue, AMBAC Insured)§± 0.20 09/01/2029 1,025,0006,460,000 Deutsche Bank Spears Lifers Trust Series DBE-625 (Other Revenue, AMBAC Insured)§± 0.20 06/01/2028 6,460,000
22,025,000 East Bay CA MUD Series A1 (Water Revenue)§± 0.20 06/01/2026 22,025,00021,400,000 East Bay CA MUD Series A2 (Water Revenue)§± 0.20 06/01/2026 21,400,000
2,100,000 East Bay CA MUD Subseries A2 (Water Revenue, Dexia Credit Local de France LOC)§± 0.20 06/01/2038 2,100,000470,000 East Bay CA MUD Subseries A3 (Other Revenue, Dexia Credit Local de France LOC)§± 0.20 06/01/2038 470,000
6,950,000 East Bay CA MUD Subseries B1 (Other Revenue, Dexia Credit Local de France LOC)§± 0.17 06/01/2038 6,950,0006,805,000 East Bay CA MUD Subseries C (Other Revenue, Dexia Credit Local de France LOC)§± 0.17 06/01/2027 6,805,0009,835,000 Eastern Municipal Water District California Water & Sewer COP Series D
(Water Revenue, Lloyds TSB Bank plc LOC)§± 0.16 07/01/2023 9,835,00025,925,000 Eclipse Funding Trust 2006-0002-Solar Eclipse-Los Angeles (Property Tax Revenue,
US Bank NA LOC)§± 0.17 07/01/2030 25,925,00018,720,000 Elsinore Valley CA Municipal Water District COP Series B (Water & Sewer Revenue,
Allied Irish Bank plc LOC)§± 0.50 07/01/2035 18,720,0009,800,000 Fremont CA Treetops Apartments Series A (Housing Revenue, FNMA Insured)§± 0.20 08/15/2026 9,800,0005,300,000 Golden State Tobacco Securitization Corporation Series 3123 (Other Revenue)§±†† 0.27 06/01/2045 5,300,000
11,500,000 Golden State Tobacco Securitization Corporation California Tobacco Settlement ROCS RR II R-11432 (Other Revenue, Citibank NA LOC)§± 0.24 06/01/2035 11,500,000
19,085,000 Golden State Tobacco Securitization Corporation California Tobacco Settlement ROCS RR II R-11442 (Other Revenue, Citibank NA LOC)§± 0.24 06/01/2035 19,085,000
4,800,000 Hartnell CA Community College District Series 2966 (Property Tax Revenue, First Security Bank LOC)§± 0.20 06/01/2014 4,800,000
7,400,000 Hayward CA Housing Authority MFHR Barrington Hills Series A (Housing Revenue, FNMA Insured)§± 0.17 06/15/2025 7,400,000
4,000,000 Hayward CA MFHR Shorewood Series A (MFHR, FGIC Insured)§± 0.17 07/15/2014 4,000,0001,000,000 Hemet CA MFHR Sunwest Retirement Series A (MFHR, FHLMC Insured)§± 0.16 01/01/2025 1,000,0005,190,000 Hesperia CA USD COP Interim School Facility Funding Program
(Lease Revenue, First Security Bank LOC)§± 0.45 02/01/2028 5,190,0007,505,000 Hesperia CA USD COP Interim School Facility Funding Program (Lease Revenue,
First Security Bank LOC)§± 0.45 02/01/2038 7,505,0004,955,000 Hesperia CA USD COP Interim School Facility Funding Program (Other Revenue,
Dexia Credit Local de France LOC)§± 0.45 02/01/2018 4,955,00010,370,000 Irvine CA Improvement Board ACT 1915 Assessment District #07-22-A (Other Revenue,
KBC Bank NV LOC)§± 0.13 09/02/2032 10,370,0002,700,000 Irvine CA Improvement Board ACT 1915 Assessment District #85-7 Series A (Other
Revenue, First Security Bank NA LOC)§± 0.16 09/02/2032 2,700,0001,165,000 Irvine CA Improvement Board ACT 1915 Assessment District #97-17 (Other Revenue,
State Street Bank & Trust Company NA LOC)§± 0.13 09/02/2023 1,165,0004,000,000 Irvine Ranch CA Water District Bank of America Insured (Water & Sewer Revenue,
Bank of America NA LOC)§± 0.15 04/01/2033 4,000,00029,545,000 JPMorgan Chase Putters Drivers Trust (Property Tax Revenue, JPMorgan
Chase Bank LOC)§±†† 0.18 08/01/2015 29,545,000
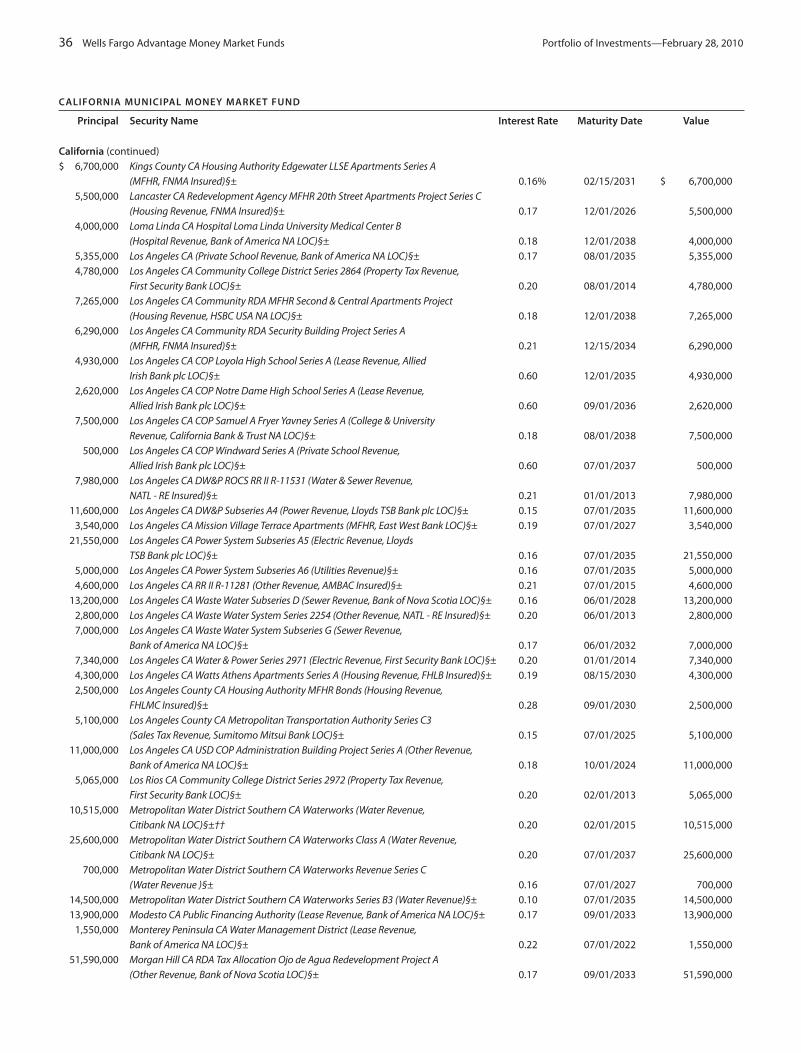
36 Wells Fargo Advantage Money Market Funds Portfolio of Investments—February 28, 2010
CALIFORNIA MUNICIPAL MONEY MARKET FUND
Principal Security Name Interest Rate Maturity Date Value
California (continued)$ 6,700,000 Kings County CA Housing Authority Edgewater LLSE Apartments Series A
(MFHR, FNMA Insured)§± 0.16% 02/15/2031 $ 6,700,0005,500,000 Lancaster CA Redevelopment Agency MFHR 20th Street Apartments Project Series C
(Housing Revenue, FNMA Insured)§± 0.17 12/01/2026 5,500,0004,000,000 Loma Linda CA Hospital Loma Linda University Medical Center B
(Hospital Revenue, Bank of America NA LOC)§± 0.18 12/01/2038 4,000,0005,355,000 Los Angeles CA (Private School Revenue, Bank of America NA LOC)§± 0.17 08/01/2035 5,355,0004,780,000 Los Angeles CA Community College District Series 2864 (Property Tax Revenue,
First Security Bank LOC)§± 0.20 08/01/2014 4,780,0007,265,000 Los Angeles CA Community RDA MFHR Second & Central Apartments Project
(Housing Revenue, HSBC USA NA LOC)§± 0.18 12/01/2038 7,265,0006,290,000 Los Angeles CA Community RDA Security Building Project Series A
(MFHR, FNMA Insured)§± 0.21 12/15/2034 6,290,0004,930,000 Los Angeles CA COP Loyola High School Series A (Lease Revenue, Allied
Irish Bank plc LOC)§± 0.60 12/01/2035 4,930,0002,620,000 Los Angeles CA COP Notre Dame High School Series A (Lease Revenue,
Allied Irish Bank plc LOC)§± 0.60 09/01/2036 2,620,0007,500,000 Los Angeles CA COP Samuel A Fryer Yavney Series A (College & University
Revenue, California Bank & Trust NA LOC)§± 0.18 08/01/2038 7,500,000500,000 Los Angeles CA COP Windward Series A (Private School Revenue,
Allied Irish Bank plc LOC)§± 0.60 07/01/2037 500,0007,980,000 Los Angeles CA DW&P ROCS RR II R-11531 (Water & Sewer Revenue,
NATL - RE Insured)§± 0.21 01/01/2013 7,980,00011,600,000 Los Angeles CA DW&P Subseries A4 (Power Revenue, Lloyds TSB Bank plc LOC)§± 0.15 07/01/2035 11,600,000
3,540,000 Los Angeles CA Mission Village Terrace Apartments (MFHR, East West Bank LOC)§± 0.19 07/01/2027 3,540,00021,550,000 Los Angeles CA Power System Subseries A5 (Electric Revenue, Lloyds
TSB Bank plc LOC)§± 0.16 07/01/2035 21,550,0005,000,000 Los Angeles CA Power System Subseries A6 (Utilities Revenue)§± 0.16 07/01/2035 5,000,0004,600,000 Los Angeles CA RR II R-11281 (Other Revenue, AMBAC Insured)§± 0.21 07/01/2015 4,600,000
13,200,000 Los Angeles CA Waste Water Subseries D (Sewer Revenue, Bank of Nova Scotia LOC)§± 0.16 06/01/2028 13,200,0002,800,000 Los Angeles CA Waste Water System Series 2254 (Other Revenue, NATL - RE Insured)§± 0.20 06/01/2013 2,800,0007,000,000 Los Angeles CA Waste Water System Subseries G (Sewer Revenue,
Bank of America NA LOC)§± 0.17 06/01/2032 7,000,0007,340,000 Los Angeles CA Water & Power Series 2971 (Electric Revenue, First Security Bank LOC)§± 0.20 01/01/2014 7,340,0004,300,000 Los Angeles CA Watts Athens Apartments Series A (Housing Revenue, FHLB Insured)§± 0.19 08/15/2030 4,300,0002,500,000 Los Angeles County CA Housing Authority MFHR Bonds (Housing Revenue,
FHLMC Insured)§± 0.28 09/01/2030 2,500,0005,100,000 Los Angeles County CA Metropolitan Transportation Authority Series C3
(Sales Tax Revenue, Sumitomo Mitsui Bank LOC)§± 0.15 07/01/2025 5,100,00011,000,000 Los Angeles CA USD COP Administration Building Project Series A (Other Revenue,
Bank of America NA LOC)§± 0.18 10/01/2024 11,000,0005,065,000 Los Rios CA Community College District Series 2972 (Property Tax Revenue,
First Security Bank LOC)§± 0.20 02/01/2013 5,065,00010,515,000 Metropolitan Water District Southern CA Waterworks (Water Revenue,
Citibank NA LOC)§±†† 0.20 02/01/2015 10,515,00025,600,000 Metropolitan Water District Southern CA Waterworks Class A (Water Revenue,
Citibank NA LOC)§± 0.20 07/01/2037 25,600,000700,000 Metropolitan Water District Southern CA Waterworks Revenue Series C
(Water Revenue )§± 0.16 07/01/2027 700,00014,500,000 Metropolitan Water District Southern CA Waterworks Series B3 (Water Revenue)§± 0.10 07/01/2035 14,500,00013,900,000 Modesto CA Public Financing Authority (Lease Revenue, Bank of America NA LOC)§± 0.17 09/01/2033 13,900,000
1,550,000 Monterey Peninsula CA Water Management District (Lease Revenue, Bank of America NA LOC)§± 0.22 07/01/2022 1,550,000
51,590,000 Morgan Hill CA RDA Tax Allocation Ojo de Agua Redevelopment Project A (Other Revenue, Bank of Nova Scotia LOC)§± 0.17 09/01/2033 51,590,000

Portfolio of Investments—February 28, 2010 Wells Fargo Advantage Money Market Funds 37
CALIFORNIA MUNICIPAL MONEY MARKET FUND
Principal Security Name Interest Rate Maturity Date Value
California (continued)$ 3,680,000 Northern CA Power Agency Hydroelectric Project 1 Series A (Electric Revenue,
Dexia Credit Local de France LOC)§± 0.21% 07/01/2032 $ 3,680,00017,400,000 Northern California Transmission Agency Series A (Utilities Revenue,
First Security Bank LOC)§± 0.24 05/01/2024 17,400,0006,500,000 Ontario CA Multifamily Revenue (HCFR, FHLMC Insured)§± 0.15 12/01/2035 6,500,0006,070,000 Orange County CA (Housing Revenue, FNMA Insured)§± 0.21 12/15/2028 6,070,0004,000,000 Orange County CA Apartment Development Revenue Park Ridge Villas
Project (Housing Revenue, FNMA Insured)§± 0.16 11/15/2028 4,000,00014,900,000 Orange County CA Apartment Development Revenue Project Park Place
Apartments Issue A (Housing Revenue, FHLB Insured)§± 0.18 04/01/2024 14,900,0008,619,000 Orange County CA Apartment Development Revenue Series D Harbor Pointe
Project (Housing Revenue, FHLMC Insured)§± 0.16 12/01/2022 8,619,0004,244,000 Orange County CA Improvement Board ACT 1915 Assessment District 01-1 Series A
(Special Tax Revenue, KBC Bank NV LOC)§± 0.15 09/02/2033 4,244,0005,960,000 Orange County CA Sanitation District Series A (Lease Revenue)§± 0.14 08/01/2029 5,960,0001,075,000 Orange County CA Sanitation Districts COP Series 25297 (Sewer Revenue,
First Security Bank LOC)§± 0.20 02/01/2015 1,075,00019,400,000 Pittsburg CA Public Financing Authority Water (Water Revenue,
Allied Irish Bank plc LOC)§± 0.45 06/01/2035 19,400,0007,000,000 Rancho CA Water District Financing Authority Series B (Other Revenue,
UBS AG LOC)§± 0.17 08/15/2031 7,000,000160,000 Riverside CA COP (Lease Revenue, Bank of America NA LOC)§± 0.18 03/01/2037 160,000
3,245,000 Riverside CA Electric Putters Series 3042Z (Electric Revenue, First Security Bank LOC)§±†† 0.14 04/01/2016 3,245,000
8,500,000 Riverside County CA (Lease Abatement Revenue, Bank of America NA LOC)§± 0.18 11/01/2039 8,500,0001,500,000 Riverside County CA Housing Authority Mountain View Apartments
Series A (MFHR, Redlands Federal S&L LOC)§± 0.21 08/01/2025 1,500,0002,300,000 Riverside County CA IDA IDR Cryogenic Project Issue B (IDR, Bank of
America NA LOC)§± 0.18 07/05/2014 2,300,00014,750,000 Roseville CA COP Series A (Electric Revenue, Bank of New York LOC)§± 0.19 02/01/2035 14,750,00012,874,000 Roseville CA Electric System COP Series B (Other Revenue, Dexia
Credit Local de France LOC)§± 0.19 02/01/2035 12,874,0007,000,000 Sacramento CA Housing Authority Shenandoah Apartments Series F
(Housing Revenue, FNMA Insured)§± 0.20 09/15/2036 7,000,0005,000,000 Sacramento County CA Housing Authority (Housing Revenue, FNMA Insured)§± 0.16 07/15/2029 5,000,0007,000,000 Sacramento County CA Housing Authority MFHR Arlington Creek Apartment
Series I (Housing Revenue, FNMA Insured)§± 0.19 05/15/2034 7,000,0006,835,000 Sacramento County CA Housing Authority MFHR Cascades Series D
(Housing Revenue, FNMA Insured)§± 0.20 09/15/2035 6,835,0009,140,000 Sacramento County CA Housing Authority MFHR Logan Park Apartments Issue E
(Housing Revenue, FHLMC Insured)§± 0.21 05/01/2042 9,140,0006,000,000 Sacramento County CA Housing Authority MFHR Normandy Park Apartments
Series A (Housing Revenue, FNMA Insured)§± 0.20 02/15/2033 6,000,0002,900,000 Sacramento County CA Housing Authority Seasons at Winter Series C2
(MFHR, FHLMC Insured)§± 0.16 08/01/2034 2,900,0004,700,000 Sacramento County CA Housing Authority Shadwood Apartments Project Issue A
(MFHR, FHLMC Insured)§± 0.18 12/01/2022 4,700,00010,000,000 Sacramento County CA River Pointe Apartments Series B (MFHR, FNMA Insured)§± 0.16 08/15/2027 10,000,000
5,000,000 Sacramento County CA Sanitation District Financing Authority Subordinate Lien Sacramento District E (Sewer Revenue, US Bank NA LOC)§± 0.20 12/01/2040 5,000,000
5,050,000 Sacramento County CA Sanitation District Financing Authority Subordinate Lien Sacramento Regulation C (Sewer Revenue, Credit Agricole Indosuez LOC)§± 0.18 12/01/2030 5,050,000
7,000,000 San Bernardino CA Redevelopment Agency Silver Woods Apartments Project (Housing Revenue, FNMA Insured)§± 0.20 05/01/2026 7,000,000
6,809,000 San Bernardino County CA COP Series A (Lease Revenue, Bank of America NA LOC)§± 0.18 03/01/2024 6,809,0005,500,000 San Bernardino County CA Flood Control District (Water Revenue, UBS AG LOC)§± 0.18 08/01/2037 5,500,000

38 Wells Fargo Advantage Money Market Funds Portfolio of Investments—February 28, 2010
CALIFORNIA MUNICIPAL MONEY MARKET FUND
Principal Security Name Interest Rate Maturity Date Value
California (continued)$ 6,115,000 San Bernardino County CA MFHR Green Valley Apartments Project Series A
(Housing Revenue, FNMA Insured)§± 0.17% 05/15/2029 $ 6,115,0005,600,000 San Bernardino County CA MFHR Sycamore Terrace Project Series A
(Housing Revenue, FNMA Insured)§± 0.17 05/15/2029 5,600,0004,695,000 San Diego County CA Regional Transportation Community Limited Tax Series A
(Sales Tax Revenue, JPMorgan Chase Bank LOC)§± 0.18 04/01/2038 4,695,0004,005,000 San Diego County CA Regional Transportation Community Limited Tax Series B
(Sales Tax Revenue, JPMorgan Chase Bank LOC)§± 0.17 04/01/2038 4,005,000295,000 San Diego County CA Regional Transportation Community Limited Tax Series D
(Sales Tax Revenue, Dexia Credit Local de France LOC)§± 0.35 04/01/2038 295,0001,545,000 San Diego County CA Water Authority COP Series 2873 (Water Revenue,
First Security Bank LOC)§± 0.20 05/01/2013 1,545,0006,850,000 San Francisco CA City & County Airports Commission Second Series 37C
(Airport Revenue, FSA Insured)§± 0.21 05/01/2029 6,850,0005,000,000 San Francisco CA City & County Airports Commission Second Series 37D
(Other Revenue, AGM Insured)§± 0.21 05/01/2030 5,000,0004,655,000 San Francisco CA City & County Airports Commission Series B (Airport Revenue)§± 0.75 05/01/2029 4,655,0005,425,000 San Francisco CA City & County Finance Corporation Moscone Center (Lease Revenue,
State Street Bank & Trust Company NA LOC)§± 0.17 04/01/2030 5,425,0002,645,000 San Francisco CA City & County MFHR Carter Terrace Apartments Series B (MFHR,
Citibank NA LOC)§± 0.15 03/01/2036 2,645,00040,000,000 San Francisco CA City & County RDA Fillmore Center Series B1 (Housing Revenue,
FHLMC Insured)§± 0.20 12/01/2017 40,000,0006,440,000 San Francisco CA City & County RDA Notre Dame Apartments Series G
(Housing Revenue, Citibank NA LOC)§± 0.22 12/01/2033 6,440,0008,925,000 San Francisco CA City & County RDA Orlando Cepeda Place Series D (MFHR,
Citibank NA LOC)§± 0.25 11/01/2033 8,925,0009,250,000 San Francisco CA City & County Redevelopment Agency Community Facilities District
Hunters Point Series A (Tax Revenue, KBC Bank NV LOC)§± 0.18 08/01/2036 9,250,0003,030,000 San Francisco CA City & County Redevelopment Agency MFHR Leland Polk Senior
Community Series A (MFHR, Citibank NA LOC)§± 0.15 12/01/2019 3,030,0008,900,000 San Jose CA Cinnabar Commons Series C (Housing Revenue, Bank of America NA LOC)§± 0.17 02/01/2037 8,900,0009,360,000 San Jose CA MFHR Raintree Apartments Series A (MFHR, FNMA Insured)§± 0.27 02/01/2038 9,360,0005,750,000 San Jose CA Redevelopment Agency Merged Area Redevelopment Project Series A
(Property Tax Revenue, JPMorgan Chase Bank LOC)§± 0.15 07/01/2026 5,750,0007,100,000 San Jose CA Redevelopment Agency Tax Allocation (Housing Revenue,
Bank of New York LOC)§± 0.15 08/01/2035 7,100,0004,230,000 San Jose CA Turnleaf Apartments Series A (Housing Revenue, FHLMC Insured)§± 0.22 06/01/2036 4,230,0005,025,000 San Leandro CA Parkside Commons Apartments Project (MFHR, FNMA Insured)§± 0.18 07/15/2018 5,025,0006,660,000 Santa Ana CA Health Facility Revenue Multi-Model Town & Country Project BNP
Paribas (HCFR, Dexia Credit Local de France LOC)§± 0.11 10/01/2020 6,660,00037,545,000 Santa Clara CA Subseries B (Electric Plant Revenue, Dexia Credit Local de France LOC)§± 0.19 07/01/2027 37,545,00020,750,000 Santa Clara County CA Financing Authority Multiple Facilities Projects Series M
(Lease Revenue, Bank of America NA LOC)§± 0.18 05/15/2035 20,750,0005,900,000 Santa Clara County CA MFHR Benton Park Center Apartments Project Series A
(MFHR, FNMA Insured)§± 0.16 12/15/2025 5,900,0003,120,000 Santa Rosa CA Alderbrook Heights Apartments (Housing Revenue, FHLB insured)§± 0.20 05/01/2040 3,120,000
17,695,000 Simi Valley CA Series A (MFHR, FHLMC Insured)§± 0.15 07/01/2023 17,695,0005,700,000 Simi Valley CA Shadowridge Apartments Project (Housing Revenue, FHLMC Insured)§± 0.19 09/01/2019 5,700,000
32,900,000 Southern CA Public Power Authority Project (Electric Revenue, KBC Bank NV LOC)§± 0.18 07/01/2036 32,900,00092,085,000 Southern CA Public Power Authority Transmission Project Revenue (Utilities Revenue,
Lloyds TSB Bank plc LOC)§± 0.20 07/01/2019 92,085,0005,900,000 Stockton CA HCFR Series A (HCFR, Citibank NA LOC)§± 0.13 12/01/2032 5,900,0008,220,000 Sweetwater CA Union High School District ROCS RR II 11484 (Property Tax Revenue,
First Security Bank LOC)§± 0.23 02/01/2013 8,220,000

Portfolio of Investments—February 28, 2010 Wells Fargo Advantage Money Market Funds 39
§ These securities are subject to a demand feature which reduces the effective maturity.
± Variable rate investments.
†† Securities that may be resold to “qualified institutional buyers” under rule 144A or securities offered pursuant to section 4(2) of the Securities Act of 1933, asamended.
°° Credit enhancement is provided by a non-controlled affiliate.
* Cost for federal income tax purposes is substantially the same as for financial reporting purposes.
The accompanying notes are an integral part of these financial statements.
CALIFORNIA MUNICIPAL MONEY MARKET FUND
Principal Security Name Interest Rate Maturity Date Value
California (continued)$ 12,460,000 University of California (College & University Revenue, First Security Bank LOC)§± 0.21% 05/15/2032 $ 12,460,000
12,000,000 Upland CA Community RDA Sunset Ridge Apartments (Housing Revenue, East West Bank LOC)§± 0.17 08/01/2037 12,000,000
7,750,000 Vacaville CA MFHR Sycamore Apartments Series A (Housing Revenue, FNMA Insured)§± 0.17 05/15/2029 7,750,0003,200,000 Vacaville CA Series A (Housing Revenue, FNMA Insured)§± 0.21 07/15/2018 3,200,0003,620,000 Walnut Creek CA Creekside Drive (Housing Revenue, FHLMC Insured)§± 0.17 04/01/2027 3,620,0009,900,000 Whittier CA Whittier College (College & University Revenue, Bank of America NA LOC)§± 0.18 12/01/2038 9,900,000
2,367,737,500
Other: 0.54%8,030,000 Branch Banking & Trust Municipal Trust (Lease Revenue, Branch Banking & Trust LOC)§± 0.20 09/01/2022 8,030,0006,000,000 Branch Banking & Trust Municipal Trust (Other Revenue, First Security Bank LOC)§± 0.24 02/01/2027 6,000,000
14,030,000
Puerto Rico: 1.08%5,331,000 Deutsche Bank Spears Lifers Trust Series DBE-627A (Sales Tax Revenue,
AMBAC Insured)§± 0.22 08/01/2049 5,331,00011,000,000 Puerto Rico Commonwealth (Other Revenue, Wachovia Bank LOC)§±°° 0.14 07/01/2034 11,000,00011,600,000 Puerto Rico Commonwealth (Property Tax Revenue, Wachovia Bank LOC)§±°° 0.14 07/01/2034 11,600,000
27,931,000
Total Municipal Bonds & Notes (Cost $2,409,698,500) 2,409,698,500
Total Investments in Securities
(Cost $2,580,658,500) 99.94% 2,580,658,500
Other Assets and Liabilities, Net 0.06 1,515,153
Total Net Assets 100.00% $2,582,173,653

40 Wells Fargo Advantage Money Market Funds Portfolio of Investments—February 28, 2010
CASH INVESTMENT MONEY MARKET FUND
Principal Security Name Interest Rate Maturity Date Value
Agency Notes - Interest Bearing: 0.28%
Federal Home Loan Mortgage Corporation: 0.28%$ 53,000,000 FHLMC±§ 0.15% 02/02/2012 $ 52,917,834
Total Agency Notes - Interest Bearing (Cost $52,917,834) 52,917,834
Bankers Acceptance Notes: 0.27%
Domestic Banks: 0.27%5,000,000 Bank of America NA^ 0.20 03/17/2010 4,999,556
16,000,000 Bank of America NA^ 0.20 03/18/2010 15,998,4891,839,446 Bank of America NA^ 0.32 08/18/2010 1,836,6663,000,000 Bank of America NA^ 0.32 08/20/2010 2,995,413
12,264,900 Bank of America NA^ 0.37 04/08/2010 12,259,9432,000,000 Bank of America NA^ 0.35 05/18/2010 1,998,483
10,000,000 Bank of America NA^ 0.33 05/24/2010 9,992,253
Total Bankers Acceptance Notes (Cost $50,080,803) 50,080,803
Certificates of Deposit: 9.99%48,000,000 Abbey National Treasury Services± 0.27 12/10/2010 48,000,00019,000,000 Acts Retirement Life Communities Incorporated 0.23 03/10/2010 18,998,81380,000,000 Allied Irish Banks North America Incorporated±†† 0.25 03/03/2010 80,000,000
100,000,000 Banco Bilbao Vizcaya (London)†† 0.18 03/18/2010 99,991,028140,000,000 Banco Bilbao Vizcaya (London) 0.30 03/16/2010 140,000,291
50,000,000 Banco Bilbao Vizcaya Argentaria (London)†† 0.29 04/22/2010 49,978,33372,000,000 Banco Bilbao Vizcaya Argentaria (New York) 0.23 04/12/2010 72,000,00049,500,000 Barclays Bank plc (New York)± 0.48 01/19/2011 49,500,00043,000,000 Barclays Bank plc (New York)± 0.78 11/08/2010 43,000,000
112,500,000 Barclays Bank plc (New York)± 1.00 06/24/2010 112,500,00032,000,000 BNP Paribas Euro 0.23 04/12/2010 32,000,37315,000,000 Calyon (New York) 0.25 06/02/2010 14,999,99918,000,000 Calyon (New York)± 0.29 06/29/2010 17,988,82354,600,000 Calyon (New York) 0.55 03/22/2010 54,601,586
8,000,000 Dexia Credit Local SA 0.95 05/12/2010 8,011,32881,000,000 Dexia Delaware 1.00 03/01/2010 81,000,00075,000,000 Lloyds TSB Bank plc (New York)± 0.35 05/10/2010 75,000,000
102,500,000 Lloyds TSB Bank plc (New York)± 0.46 11/12/2010 102,500,000150,000,000 Lloyds TSB Bank plc (New York)± 0.50 07/26/2010 150,000,000
19,000,000 Natixis Commercial Paper Corporation 0.28 04/05/2010 19,000,00067,000,000 Natixis Commercial Paper Corporation 0.30 03/02/2010 67,000,00021,000,000 Rabobank Nederland NV (New York)± 0.23 01/06/2011 21,000,00024,000,000 Rabobank Nederland NV (New York)± 0.23 01/07/2011 24,000,00029,000,000 Rabobank Nederland NV (New York)± 0.23 10/19/2010 29,000,000
130,000,000 Royal Bank Scotland plc (Connecticut)± 0.84 07/16/2010 130,000,000162,000,000 Societe Generale (New York)± 0.10 04/05/2010 162,000,000
47,000,000 Societe Generale (New York)±§ 0.55 05/05/2011 47,000,000130,000,000 Unicredit S.p.A (New York) 0.27 05/04/2010 130,000,000
Total Certificates of Deposit (Cost $1,879,070,574) 1,879,070,574
Commercial Paper: 60.09%20,000,000 Allied Irish Banks North America Incorporated^†† 0.13 03/02/2010 19,999,86155,000,000 Allied Irish Banks North America Incorporated^†† 0.20 03/04/2010 54,998,80844,000,000 Allied Irish Banks North America Incorporated^†† 0.21 03/05/2010 43,998,72943,000,000 Amstel Funding Corporation^††(p) 0.00 03/01/2010 43,000,00024,000,000 Amstel Funding Corporation^††(p) 0.49 03/04/2010 23,998,70027,000,000 Amstel Funding Corporation^††(p) 0.56 03/15/2010 26,993,700

Portfolio of Investments—February 28, 2010 Wells Fargo Advantage Money Market Funds 41
CASH INVESTMENT MONEY MARKET FUND
Principal Security Name Interest Rate Maturity Date Value
Commercial Paper (continued)$ 57,000,000 Amstel Funding Corporation^††(p) 0.56% 03/16/2010 $ 56,985,750
49,000,000 Amstel Funding Corporation^††(p) 0.57 03/17/2010 48,986,93363,000,000 Amstel Funding Corporation^††(p) 0.57 03/18/2010 62,982,150
120,000,000 Amstel Funding Corporation^††(p) 0.79 04/30/2010 119,840,00018,000,000 Amsterdam Funding Corporation^††(p) 0.15 03/22/2010 17,998,32017,000,000 Amsterdam Funding Corporation^††(p) 0.17 03/25/2010 16,997,96013,000,000 Amsterdam Funding Corporation^††(p) 0.18 04/07/2010 12,997,59560,000,000 Amsterdam Funding Corporation^††(p) 0.19 04/19/2010 59,984,48319,000,000 Amsterdam Funding Corporation^††(p) 0.20 05/03/2010 18,993,35096,000,000 Anglo Irish Bank Corporation Limited^†† 0.17 03/03/2010 95,998,667
9,000,000 Antalis US Funding Corporation^††(p) 0.14 03/05/2010 8,999,8208,000,000 Antalis US Funding Corporation^††(p) 0.17 03/08/2010 7,999,704
57,000,000 Antalis US Funding Corporation^††(p) 0.17 03/09/2010 56,997,59314,000,000 Antalis US Funding Corporation^††(p) 0.17 03/17/2010 13,998,88019,000,000 Antalis US Funding Corporation^††(p) 0.17 03/24/2010 18,997,815
9,000,000 Antalis US Funding Corporation^††(p) 0.20 04/16/2010 8,997,70014,000,000 Antalis US Funding Corporation^††(p) 0.20 03/08/2010 13,999,45614,800,000 Antalis US Funding Corporation^††(p) 0.21 04/13/2010 14,796,288
8,000,000 Antalis US Funding Corporation^††(p) 0.21 04/23/2010 7,997,52727,000,000 Antalis US Funding Corporation^††(p) 0.22 04/08/2010 26,993,508
5,000,000 Antalis US Funding Corporation^††(p) 0.22 04/12/2010 4,998,71760,000,000 ANZ National (International) Limited±†† 0.32 01/11/2011 60,000,00040,000,000 ANZ National (International) Limited±†† 0.38 10/20/2010 40,000,00024,000,000 Arabella Finance LLC^††(p) 0.47 03/18/2010 23,994,33427,000,000 Arabella Finance LLC^††(p) 0.52 05/18/2010 26,969,580
6,000,000 Arabella Finance LLC^††(p) 0.53 05/24/2010 5,992,58030,000,000 ASB Finance Limited (London)±†† 0.33 01/12/2011 29,998,69430,000,000 ASB Finance Limited (London)±†† 0.33 01/10/2011 30,000,00042,000,000 ASB Finance Limited (London)±†† 0.36 12/08/2010 42,003,37541,000,000 ASB Finance Limited (London)±†† 0.36 12/13/2010 41,003,274
175,000,000 ASB Finance Limited (London)±†† 0.78 06/16/2010 175,000,00030,000,000 ASB Finance Limited (London)±†† 0.80 07/09/2010 30,000,00036,000,000 ASB Finance Limited (London)±†† 0.47 03/08/2010 35,996,22014,000,000 Aspen Funding Corporation^††(p) 0.20 04/28/2010 13,995,48918,000,000 Atlantic Asset Securitization Corporation^††(p) 0.17 03/11/2010 17,999,15022,000,000 Atlantic Asset Securitization Corporation^††(p) 0.18 03/18/2010 21,998,02635,500,000 Atlantic Asset Securitization Corporation^††(p) 0.19 04/09/2010 35,492,69318,000,000 Atlantic Asset Securitization Corporation^††(p) 0.19 04/14/2010 17,995,82024,000,000 Atlantic Asset Securitization Corporation^††(p) 0.20 04/08/2010 23,994,93323,062,000 Atlantic Asset Securitization Corporation^††(p) 0.20 05/21/2010 23,051,62281,000,000 Atlantis One Funding Corporation^††(p) 0.23 03/11/2010 80,994,82547,000,000 Atlantis One Funding Corporation^††(p) 0.20 03/09/2010 46,997,59836,000,000 Autobahn Funding Company LLC^††(p) 0.00 03/01/2010 36,000,000
2,500,000 Autobahn Funding Company LLC^††(p) 0.24 03/30/2010 2,499,4977,000,000 Autobahn Funding Company LLC^††(p) 0.26 04/05/2010 6,998,1638,000,000 Autobahn Funding Company LLC^††(p) 0.27 05/10/2010 7,995,800
10,000,000 Autobahn Funding Company LLC^††(p) 0.27 05/17/2010 9,994,22569,420,000 Bank of Nova Scotia^ 0.18 04/14/2010 69,404,728
100,000,000 Barclays US Funding LLC^ 0.00 03/01/2010 100,000,00028,000,000 Barton Capital Corporation^††(p) 0.17 04/06/2010 27,995,24013,000,000 Barton Capital Corporation^††(p) 0.19 04/16/2010 12,996,844
3,000,000 Beethoven Funding Corporation^††(p) 0.15 03/02/2010 2,999,97510,000,000 Beethoven Funding Corporation^††(p) 0.20 03/03/2010 9,999,833
4,000,000 Beethoven Funding Corporation^††(p) 0.23 03/04/2010 3,999,90024,000,000 Beethoven Funding Corporation^††(p) 0.24 03/05/2010 23,999,20021,000,000 Belmont Funding LLC^††(p) 0.23 03/03/2010 20,999,592

42 Wells Fargo Advantage Money Market Funds Portfolio of Investments—February 28, 2010
CASH INVESTMENT MONEY MARKET FUND
Principal Security Name Interest Rate Maturity Date Value
Commercial Paper (continued)$ 94,000,000 BGL BNP Paribas SA^ 0.23% 04/14/2010 $ 93,973,576
9,000,000 BGL BNP Paribas SA^ 0.23 04/21/2010 8,997,06819,000,000 BNZ International Funding^†† 0.20 03/04/2010 18,999,58833,000,000 BNZ International Funding^†† 0.29 04/09/2010 32,989,275
120,000,000 BPCE SA^†† 0.24 03/30/2010 119,975,83333,000,000 BPCE SA^†† 0.24 04/06/2010 32,991,750
8,000,000 BPCE SA^†† 0.24 05/13/2010 7,996,0266,000,000 CAFCO LLC^††(p) 0.17 03/22/2010 5,999,370
27,000,000 CAFCO LLC^††(p) 0.20 05/05/2010 26,990,2506,000,000 Cancara Asset Securitisation LLC^††(p) 0.17 03/08/2010 5,999,767
59,000,000 Cancara Asset Securitisation LLC^††(p) 0.18 03/11/2010 58,996,72215,000,000 Cancara Asset Securitisation LLC^††(p) 0.19 03/15/2010 14,998,83320,000,000 Cancara Asset Securitisation LLC^††(p) 0.19 03/22/2010 19,997,66730,000,000 Cancara Asset Securitisation LLC^††(p) 0.19 03/23/2010 29,996,33315,000,000 Cancara Asset Securitisation LLC^††(p) 0.21 04/07/2010 14,996,60830,000,000 Cancara Asset Securitisation LLC^††(p) 0.22 05/11/2010 29,986,98359,000,000 Cancara Asset Securitisation LLC^††(p) 0.22 05/12/2010 58,974,040
6,000,000 Cancara Asset Securitisation LLC^††(p) 0.22 05/18/2010 5,997,14036,000,000 Cancara Asset Securitisation LLC^††(p) 0.22 05/20/2010 35,982,40016,000,000 Cancara Asset Securitisation LLC^††(p) 0.23 04/05/2010 15,996,26743,000,000 Cancara Asset Securitisation LLC^††(p) 0.23 04/19/2010 42,986,53938,000,000 Cancara Asset Securitisation LLC^††(p) 0.26 03/12/2010 37,996,74928,000,000 Cancara Asset Securitisation LLC^††(p) 0.19 03/18/2010 27,997,356
3,750,000 Cancara Asset Securitization LLC^††(p) 0.23 03/10/2010 3,749,75623,000,000 Charta LLC^††(p) 0.19 04/07/2010 22,995,27222,000,000 Charta LLC^††(p) 0.19 04/19/2010 21,994,31114,000,000 Charta LLC^††(p) 0.20 04/12/2010 13,996,73342,000,000 Charta LLC^††(p) 0.20 04/13/2010 41,989,96727,000,000 Charta LLC^††(p) 0.20 05/03/2010 26,990,55035,000,000 Charta LLC^††(p) 0.20 05/06/2010 34,987,16718,000,000 Charta LLC^††(p) 0.20 05/12/2010 17,992,80018,000,000 Charta LLC^††(p) 0.20 03/09/2010 17,999,04023,000,000 Ciesco LLC^††(p) 0.19 04/05/2010 22,995,52839,500,000 Ciesco LLC^††(p) 0.19 04/13/2010 39,491,03630,000,000 Ciesco LLC^††(p) 0.20 05/04/2010 29,989,33327,000,000 Ciesco LLC^††(p) 0.20 05/05/2010 26,990,250
4,000,000 Ciesco LLC^††(p) 0.20 05/20/2010 3,998,22228,000,000 Ciesco LLC^††(p) 0.20 05/25/2010 27,986,77828,000,000 Ciesco LLC^††(p) 0.20 05/26/2010 27,986,622
110,000,000 Citibank Credit Card Issuance Trust^††(p) 0.16 03/05/2010 109,997,6287,000,000 Citibank Credit Card Issuance Trust^††(p) 0.17 03/08/2010 6,999,7419,000,000 Citibank Credit Card Issuance Trust^††(p) 0.20 04/05/2010 8,998,1636,000,000 Citibank Credit Card Issuance Trust^††(p) 0.00 03/01/2010 6,000,000
16,750,000 Citibank Credit Card Issuance Trust^††(p) 0.12 03/02/2010 16,749,884100,000,000 Citibank Credit Card Issuance Trust^††(p) 0.16 03/04/2010 99,997,917
50,000,000 Citibank Credit Card Issuance Trust^††(p) 0.20 03/05/2010 49,998,61127,000,000 Clipper Receivables Company LLC^††(p) 0.22 04/23/2010 26,991,25570,000,000 Clipper Receivables Company LLC^††(p) 0.22 04/23/2010 69,977,32825,000,000 Clipper Receivables Company LLC^††(p) 0.23 03/25/2010 24,996,00019,000,000 Commonwealth Bank of Australia^†† 0.20 05/10/2010 18,992,61116,000,000 Concord Minutemen Capital Company^††(p) 0.00 03/01/2010 16,000,00049,500,000 Concord Minutemen Capital Company^††(p) 0.44 04/15/2010 49,472,156
9,000,000 Concord Minutemen Capital Company^††(p) 0.44 04/21/2010 8,994,26316,000,000 Concord Minutemen Capital Company^††(p) 0.44 05/05/2010 15,987,000
3,000,000 Concord Minutemen Capital Company^††(p) 0.44 05/10/2010 2,997,37542,000,000 Concord Minutemen Capital Company^††(p) 0.45 05/19/2010 41,958,525

Portfolio of Investments—February 28, 2010 Wells Fargo Advantage Money Market Funds 43
CASH INVESTMENT MONEY MARKET FUND
Principal Security Name Interest Rate Maturity Date Value
Commercial Paper (continued)58,650,000 Concord Minutemen Capital Company^††(p) 0.33% 03/03/2010 $ 58,648,37133,000,000 CRC Funding LLC^††(p) 0.19 04/14/2010 32,992,337
3,000,000 CRC Funding LLC^††(p) 0.19 04/15/2010 2,999,28821,000,000 CRC Funding LLC^††(p) 0.19 04/16/2010 20,994,902
2,000,000 CRC Funding LLC^††(p) 0.19 04/27/2010 1,999,39834,000,000 CRC Funding LLC^††(p) 0.20 04/09/2010 33,992,63319,000,000 CRC Funding LLC^††(p) 0.20 04/28/2010 18,993,87815,000,000 CRC Funding LLC^††(p) 0.20 05/03/2010 14,994,75022,000,000 CRC Funding LLC^††(p) 0.20 04/13/2010 21,994,74489,500,000 Crown Point Capital Company^††(p) 0.44 04/09/2010 89,456,36981,000,000 Crown Point Capital Company^††(p) 0.44 04/15/2010 80,954,43831,000,000 Crown Point Capital Company^††(p) 0.44 04/21/2010 30,980,238
5,000,000 Crown Point Capital Company^††(p) 0.44 05/05/2010 4,995,93813,000,000 Crown Point Capital Company^††(p) 0.45 04/13/2010 12,993,01336,000,000 Crown Point Capital Company^††(p) 0.45 05/19/2010 35,964,45048,000,000 Crown Point Capital Company^††(p) 0.45 05/21/2010 47,951,40048,000,000 Danske Corporation^†† 0.19 03/29/2010 47,992,53319,000,000 Danske Corporation^†† 0.19 04/07/2010 18,996,09442,000,000 Dexia Delaware^ 0.14 03/02/2010 41,999,67391,000,000 Dexia Delaware^ 0.17 03/04/2010 90,998,33240,000,000 Dexia Delaware^ 0.25 03/10/2010 39,997,20049,000,000 Dexia Delaware^ 0.26 03/12/2010 48,995,73341,000,000 DnB Nor Bank ASA^†† 0.27 05/25/2010 40,973,86359,000,000 DnB Nor Bank ASA^†† 0.27 05/28/2010 58,961,06030,000,000 E.ON AG^†† 0.23 05/18/2010 29,985,050
132,000,000 Ebbets Funding LLC^††(p) 0.43 03/19/2010 131,970,30045,000,000 Ebbets Funding LLC^††(p) 0.48 03/23/2010 44,986,25022,000,000 Ebbets Funding LLC^††(p) 0.48 03/25/2010 21,992,66721,000,000 Ebbets Funding LLC^††(p) 0.48 03/26/2010 20,992,70819,000,000 Elysian Funding LLC^††(p) 0.40 03/09/2010 18,998,100
9,000,000 Elysian Funding LLC^††(p) 0.43 03/19/2010 8,997,97518,000,000 ENI Coordination Center SA^†† 0.12 03/03/2010 17,999,82014,000,000 Enterprise Funding LLC^††(p) 0.17 03/18/2010 13,998,81012,000,000 Enterprise Funding LLC^††(p) 0.19 04/21/2010 11,996,77074,000,000 Enterprise Funding LLC^††(p) 0.21 05/26/2010 73,961,99311,000,000 Enterprise Funding LLC^††(p) 0.22 04/12/2010 10,997,177
4,000,000 Erasmus Capital Corporation^††(p) 0.00 03/01/2010 4,000,0008,000,000 Erasmus Capital Corporation^††(p) 0.14 03/04/2010 7,999,873
19,000,000 Erasmus Capital Corporation^††(p) 0.15 03/05/2010 18,999,5999,000,000 Erasmus Capital Corporation^††(p) 0.17 03/10/2010 8,999,5736,000,000 Erasmus Capital Corporation^††(p) 0.21 03/25/2010 5,999,120
64,000,000 Erasmus Capital Corporation^††(p) 0.22 04/09/2010 63,984,05313,000,000 Erasmus Capital Corporation^††(p) 0.24 04/22/2010 12,995,49320,155,000 Fairway Finance Corporation^††(p) 0.15 03/11/2010 20,154,04812,000,000 Fairway Finance Corporation^††(p) 0.19 04/05/2010 11,997,66775,000,000 Fortis Funding LLC^†† 0.21 05/21/2010 74,964,563
9,300,000 GDF Suez^†† 0.17 03/22/2010 9,299,0244,000,000 GDF Suez^†† 0.17 03/23/2010 3,999,560
19,000,000 Gemini Securitization Corporation LLC^††(p) 0.18 04/19/2010 18,995,22310,000,000 Gemini Securitization Corporation LLC^††(p) 0.18 04/26/2010 9,997,20034,000,000 Gemini Securitization Corporation LLC^††(p) 0.19 04/29/2010 33,989,134
5,000,000 Gotham Funding Corporation^††(p) 0.11 03/03/2010 4,999,95321,000,000 Gotham Funding Corporation^††(p) 0.17 03/23/2010 20,997,69047,000,000 Gotham Funding Corporation^††(p) 0.17 03/24/2010 46,994,59541,250,000 Govco LLC^††(p) 0.17 03/04/2010 41,249,24424,000,000 Govco LLC^††(p) 0.19 04/12/2010 23,994,680

44 Wells Fargo Advantage Money Market Funds Portfolio of Investments—February 28, 2010
CASH INVESTMENT MONEY MARKET FUND
Principal Security Name Interest Rate Maturity Date Value
Commercial Paper (continued)$ 5,000,000 Govco LLC^††(p) 0.20% 04/15/2010 $ 4,998,750
8,000,000 Govco LLC^††(p) 0.20 04/21/2010 7,997,73310,000,000 Govco LLC^††(p) 0.20 04/26/2010 9,996,88914,000,000 Govco LLC^††(p) 0.20 04/27/2010 13,995,56721,000,000 Govco LLC^††(p) 0.20 05/11/2010 20,991,717
7,000,000 Govco LLC^††(p) 0.20 05/18/2010 6,996,96738,000,000 Govco LLC^††(p) 0.24 03/16/2010 37,996,200
8,000,000 Govco LLC^††(p) 0.00 03/01/2010 8,000,00041,000,000 Grampian Funding^††(p) 0.21 03/19/2010 40,995,49010,000,000 Grampian Funding^††(p) 0.26 04/22/2010 9,996,24410,000,000 Grampian Funding^††(p) 0.26 04/23/2010 9,996,17216,000,000 Grampian Funding^††(p) 0.26 05/07/2010 15,992,25822,000,000 Grampian Funding^††(p) 0.26 05/19/2010 21,987,448
8,000,000 Grampian Funding^††(p) 0.26 05/21/2010 7,995,32016,000,000 Grampian Funding^††(p) 0.28 04/13/2010 15,994,45845,000,000 Grampian Funding^††(p) 0.28 04/15/2010 44,983,68819,000,000 Grampian Funding^††(p) 0.29 04/01/2010 18,995,09270,000,000 Grampian Funding^††(p) 0.30 04/08/2010 69,977,51612,000,000 Grampian Funding^††(p) 0.31 03/17/2010 11,998,347
5,000,000 Grampian Funding^††(p) 0.23 03/04/2010 4,999,87125,000,000 Groupe BPCE^†† 0.00 03/01/2010 25,000,00020,000,000 ICICI Bank Limited (Bahrain)^ 0.23 03/15/2010 19,998,05616,000,000 ICICI Bank Limited (Bahrain)^ 0.50 07/15/2010 15,969,77815,000,000 ICICI Bank Limited (Bahrain)^ 0.50 07/15/2010 14,971,66714,800,000 ICICI Bank Limited (Bahrain)^ 0.71 03/09/2010 14,797,36950,000,000 ING USA Funding LLC^ 0.16 03/12/2010 49,997,40323,000,000 ING USA Funding LLC^ 0.16 03/16/2010 22,998,371
3,500,000 ING USA Funding LLC^ 0.24 03/19/2010 3,499,56349,000,000 Intesa Funding LLC^ 0.15 03/11/2010 48,997,82215,000,000 Kitty Hawk Funding Corporation^††(p) 0.19 05/05/2010 14,994,854
175,000,000 Kitty Hawk Funding Corporation^††(p) 0.22 05/24/2010 174,910,40015,000,000 Kitty Hawk Funding Corporation^††(p) 0.24 03/19/2010 14,998,12557,000,000 Legacy Capital LLC^††(p) 0.44 04/13/2010 56,969,363
7,000,000 Legacy Capital LLC^††(p) 0.45 05/19/2010 6,993,088111,000,000 Lexington Parker Capital^††(p) 0.44 04/16/2010 110,936,175
11,000,000 Lexington Parker Capital^††(p) 0.44 04/21/2010 10,992,98811,000,000 Lexington Parker Capital^††(p) 0.44 05/05/2010 10,991,06358,000,000 Lexington Parker Capital^††(p) 0.44 05/07/2010 57,951,42534,000,000 Lexington Parker Capital^††(p) 0.44 05/11/2010 33,969,825
7,000,000 Lexington Parker Capital^††(p) 0.45 05/19/2010 6,993,08852,000,000 Lexington Parker Capital^††(p) 0.40 03/05/2010 51,997,11134,000,000 Lexington Parker Capital^††(p) 0.44 03/19/2010 33,991,50033,000,000 Liberty Street Funding LLC^††(p) 0.00 03/01/2010 33,000,00018,000,000 Liberty Street Funding LLC^††(p) 0.19 04/12/2010 17,996,01015,000,000 Liberty Street Funding LLC^††(p) 0.19 05/04/2010 14,994,93331,000,000 Liberty Street Funding LLC^††(p) 0.20 05/05/2010 30,988,80629,000,000 LMA Americas LLC^††(p) 0.14 03/05/2010 28,999,45240,000,000 LMA Americas LLC^††(p) 0.17 03/22/2010 39,995,80016,000,000 LMA Americas LLC^††(p) 0.17 03/23/2010 15,998,24015,000,000 LMA Americas LLC^††(p) 0.20 03/15/2010 14,998,775
4,000,000 LMA Americas LLC^††(p) 0.20 04/26/2010 3,998,7561,000,000 Louis Dreyfus Corporation^ 0.00 03/01/2010 1,000,000
21,000,000 Louis Dreyfus Corporation^ 0.00 03/01/2010 21,000,00012,500,000 Louis Dreyfus Corporation^ 0.28 03/19/2010 12,498,125
6,000,000 Louis Dreyfus Corporation^ 0.28 03/19/2010 5,999,1006,000,000 Louis Dreyfus Corporation^ 0.31 04/09/2010 5,997,920

Portfolio of Investments—February 28, 2010 Wells Fargo Advantage Money Market Funds 45
CASH INVESTMENT MONEY MARKET FUND
Principal Security Name Interest Rate Maturity Date Value
Commercial Paper (continued)11,000,000 Louis Dreyfus Corporation^ 0.31% 04/16/2010 $ 10,995,50213,000,000 Louis Dreyfus Corporation^ 0.32 04/27/2010 12,993,41333,000,000 Louis Dreyfus Corporation^ 0.32 04/27/2010 32,983,280
9,000,000 Market Street Funding LLC^††(p) 0.19 03/05/2010 8,999,81014,000,000 Market Street Funding LLC^††(p) 0.19 03/18/2010 13,998,74438,000,000 Matchpoint Master Trust^††(p) 0.19 04/06/2010 37,992,40018,000,000 Matchpoint Master Trust^††(p) 0.20 05/24/2010 17,991,60037,000,000 Metlife Short Term Fund^††(p) 0.23 04/26/2010 36,986,76238,000,000 Mont Blanc Capital Corporation^††(p) 0.15 03/09/2010 37,998,56411,000,000 Mont Blanc Capital Corporation^††(p) 0.17 03/25/2010 10,998,680
5,100,000 Mont Blanc Capital Corporation^††(p) 0.18 03/12/2010 5,099,6885,000,000 Mont Blanc Capital Corporation^††(p) 0.18 03/16/2010 4,999,6047,000,000 Mont Blanc Capital Corporation^††(p) 0.20 05/12/2010 6,997,200
100,000,000 Nationwide Building Society^†† 0.20 04/15/2010 99,975,00029,000,000 Nationwide Building Society^†† 0.20 04/16/2010 28,992,58925,000,000 Nationwide Building Society^†† 0.48 03/22/2010 24,992,70820,000,000 Nationwide Building Society^†† 0.50 05/06/2010 19,981,300
135,000,000 Natixis Commercial Paper Corporation^†† 0.26 05/18/2010 134,923,95018,000,000 Natixis US Finance Company^ 0.26 04/13/2010 17,994,303
100,000,000 Natixis US Finance Company^ 0.28 05/06/2010 99,948,66735,000,000 Natixis US Finance Company^ 0.15 03/02/2010 34,999,70810,000,000 Newport Funding Corporation^††(p) 0.17 03/23/2010 9,998,900
9,269,000 Newport Funding Corporation^††(p) 0.18 03/26/2010 9,267,7773,000,000 Nieuw Amsterdam Receivables Corporation^††(p) 0.16 03/05/2010 2,999,933
32,000,000 Nieuw Amsterdam Receivables Corporation^††(p) 0.19 03/18/2010 31,996,97821,000,000 Nieuw Amsterdam Receivables Corporation^††(p) 0.20 04/14/2010 20,994,86715,000,000 Nieuw Amsterdam Receivables Corporation^††(p) 0.21 04/15/2010 14,996,06354,000,000 Nordea North America Incorporated^ 0.17 03/17/2010 53,995,92011,000,000 Oakland-Alameda County± 0.20 03/02/2010 11,000,000
7,000,000 Prudential plc^†† 0.00 03/01/2010 7,000,0007,000,000 Ranger Funding Company LLC^††(p) 0.20 05/03/2010 6,997,5503,000,000 Ranger Funding Company LLC^††(p) 0.20 05/13/2010 2,998,783
18,000,000 Ranger Funding Company LLC^††(p) 0.21 05/26/2010 17,990,97018,000,000 Ranger Funding Company LLC^††(p) 0.22 04/21/2010 17,994,390
8,000,000 Ranger Funding Company LLC^††(p) 0.24 03/19/2010 7,999,00031,000,000 Regency Markets #1 LLC^††(p) 0.13 03/05/2010 30,999,449
4,000,000 Regency Markets #1 LLC^††(p) 0.16 03/08/2010 3,999,86051,000,000 Regency Markets #1 LLC^††(p) 0.17 03/22/2010 50,994,645
3,000,000 Regency Markets #1 LLC^††(p) 0.17 03/24/2010 2,999,65512,000,000 Rhein-Main Security Limited^††(p) 0.18 03/05/2010 11,999,70723,000,000 Rhein-Main Security Limited^††(p) 0.18 03/26/2010 22,996,965
7,000,000 Rhein-Main Security Limited^††(p) 0.23 03/29/2010 6,998,69377,000,000 Rhein-Main Security Limited^††(p) 0.27 05/17/2010 76,955,53330,000,000 Rhein-Main Security Limited^††(p) 0.28 05/20/2010 29,981,33310,720,000 Rheingold Securitization^††(p) 0.23 04/20/2010 10,716,57659,000,000 Rheingold Securitization^††(p) 0.24 03/22/2010 58,991,39629,000,000 Rheingold Securitization^††(p) 0.24 03/29/2010 28,994,48532,000,000 Rheingold Securitization^††(p) 0.24 04/12/2010 31,990,666
1,000,000 Romulus Funding Corporation^††(p) 0.15 03/04/2010 999,98313,000,000 Romulus Funding Corporation^††(p) 0.25 03/05/2010 12,999,552
9,000,000 Romulus Funding Corporation^††(p) 0.25 03/15/2010 8,999,0553,000,000 Romulus Funding Corporation^††(p) 0.26 03/25/2010 2,999,4609,000,000 Romulus Funding Corporation^††(p) 0.29 03/09/2010 8,999,340
16,000,000 Romulus Funding Corporation^††(p) 0.29 03/30/2010 15,996,13323,000,000 Royal KPN NV±(p) 0.19 04/06/2010 22,995,630
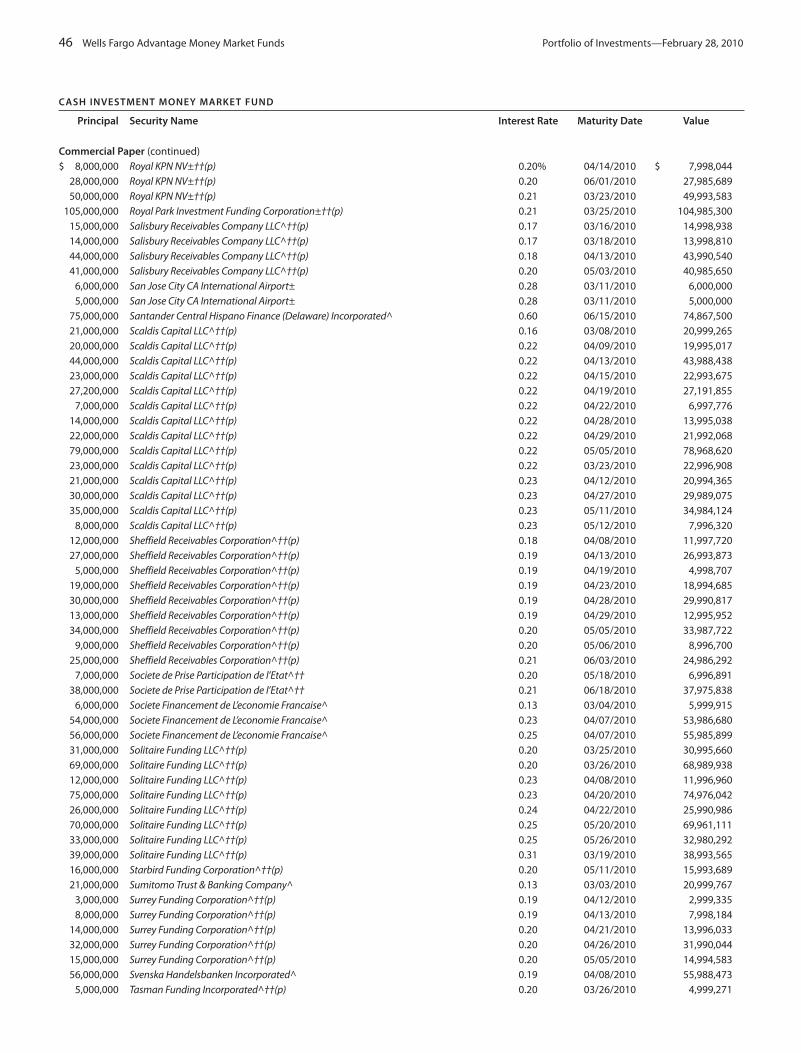
46 Wells Fargo Advantage Money Market Funds Portfolio of Investments—February 28, 2010
CASH INVESTMENT MONEY MARKET FUND
Principal Security Name Interest Rate Maturity Date Value
Commercial Paper (continued)$ 8,000,000 Royal KPN NV±††(p) 0.20% 04/14/2010 $ 7,998,044
28,000,000 Royal KPN NV±††(p) 0.20 06/01/2010 27,985,68950,000,000 Royal KPN NV±††(p) 0.21 03/23/2010 49,993,583
105,000,000 Royal Park Investment Funding Corporation±††(p) 0.21 03/25/2010 104,985,30015,000,000 Salisbury Receivables Company LLC^††(p) 0.17 03/16/2010 14,998,93814,000,000 Salisbury Receivables Company LLC^††(p) 0.17 03/18/2010 13,998,81044,000,000 Salisbury Receivables Company LLC^††(p) 0.18 04/13/2010 43,990,54041,000,000 Salisbury Receivables Company LLC^††(p) 0.20 05/03/2010 40,985,650
6,000,000 San Jose City CA International Airport± 0.28 03/11/2010 6,000,0005,000,000 San Jose City CA International Airport± 0.28 03/11/2010 5,000,000
75,000,000 Santander Central Hispano Finance (Delaware) Incorporated^ 0.60 06/15/2010 74,867,50021,000,000 Scaldis Capital LLC^††(p) 0.16 03/08/2010 20,999,26520,000,000 Scaldis Capital LLC^††(p) 0.22 04/09/2010 19,995,01744,000,000 Scaldis Capital LLC^††(p) 0.22 04/13/2010 43,988,43823,000,000 Scaldis Capital LLC^††(p) 0.22 04/15/2010 22,993,67527,200,000 Scaldis Capital LLC^††(p) 0.22 04/19/2010 27,191,855
7,000,000 Scaldis Capital LLC^††(p) 0.22 04/22/2010 6,997,77614,000,000 Scaldis Capital LLC^††(p) 0.22 04/28/2010 13,995,03822,000,000 Scaldis Capital LLC^††(p) 0.22 04/29/2010 21,992,06879,000,000 Scaldis Capital LLC^††(p) 0.22 05/05/2010 78,968,62023,000,000 Scaldis Capital LLC^††(p) 0.22 03/23/2010 22,996,90821,000,000 Scaldis Capital LLC^††(p) 0.23 04/12/2010 20,994,36530,000,000 Scaldis Capital LLC^††(p) 0.23 04/27/2010 29,989,07535,000,000 Scaldis Capital LLC^††(p) 0.23 05/11/2010 34,984,124
8,000,000 Scaldis Capital LLC^††(p) 0.23 05/12/2010 7,996,32012,000,000 Sheffield Receivables Corporation^††(p) 0.18 04/08/2010 11,997,72027,000,000 Sheffield Receivables Corporation^††(p) 0.19 04/13/2010 26,993,873
5,000,000 Sheffield Receivables Corporation^††(p) 0.19 04/19/2010 4,998,70719,000,000 Sheffield Receivables Corporation^††(p) 0.19 04/23/2010 18,994,68530,000,000 Sheffield Receivables Corporation^††(p) 0.19 04/28/2010 29,990,81713,000,000 Sheffield Receivables Corporation^††(p) 0.19 04/29/2010 12,995,95234,000,000 Sheffield Receivables Corporation^††(p) 0.20 05/05/2010 33,987,722
9,000,000 Sheffield Receivables Corporation^††(p) 0.20 05/06/2010 8,996,70025,000,000 Sheffield Receivables Corporation^††(p) 0.21 06/03/2010 24,986,292
7,000,000 Societe de Prise Participation de l’Etat^†† 0.20 05/18/2010 6,996,89138,000,000 Societe de Prise Participation de l’Etat^†† 0.21 06/18/2010 37,975,838
6,000,000 Societe Financement de L’economie Francaise^ 0.13 03/04/2010 5,999,91554,000,000 Societe Financement de L’economie Francaise^ 0.23 04/07/2010 53,986,68056,000,000 Societe Financement de L’economie Francaise^ 0.25 04/07/2010 55,985,89931,000,000 Solitaire Funding LLC^††(p) 0.20 03/25/2010 30,995,66069,000,000 Solitaire Funding LLC^††(p) 0.20 03/26/2010 68,989,93812,000,000 Solitaire Funding LLC^††(p) 0.23 04/08/2010 11,996,96075,000,000 Solitaire Funding LLC^††(p) 0.23 04/20/2010 74,976,04226,000,000 Solitaire Funding LLC^††(p) 0.24 04/22/2010 25,990,98670,000,000 Solitaire Funding LLC^††(p) 0.25 05/20/2010 69,961,11133,000,000 Solitaire Funding LLC^††(p) 0.25 05/26/2010 32,980,29239,000,000 Solitaire Funding LLC^††(p) 0.31 03/19/2010 38,993,56516,000,000 Starbird Funding Corporation^††(p) 0.20 05/11/2010 15,993,68921,000,000 Sumitomo Trust & Banking Company^ 0.13 03/03/2010 20,999,767
3,000,000 Surrey Funding Corporation^††(p) 0.19 04/12/2010 2,999,3358,000,000 Surrey Funding Corporation^††(p) 0.19 04/13/2010 7,998,184
14,000,000 Surrey Funding Corporation^††(p) 0.20 04/21/2010 13,996,03332,000,000 Surrey Funding Corporation^††(p) 0.20 04/26/2010 31,990,04415,000,000 Surrey Funding Corporation^††(p) 0.20 05/05/2010 14,994,58356,000,000 Svenska Handelsbanken Incorporated^ 0.19 04/08/2010 55,988,473
5,000,000 Tasman Funding Incorporated^††(p) 0.20 03/26/2010 4,999,271

Portfolio of Investments—February 28, 2010 Wells Fargo Advantage Money Market Funds 47
CASH INVESTMENT MONEY MARKET FUND
Principal Security Name Interest Rate Maturity Date Value
Commercial Paper (continued)$ 2,068,000 Tasman Funding Incorporated^††(p) 0.23% 03/12/2010 $ 2,067,842
24,731,000 Tasman Funding Incorporated^††(p) 0.24 04/14/2010 24,723,71810,000,000 Tasman Funding Incorporated^††(p) 0.24 04/27/2010 9,996,20012,028,000 Tasman Funding Incorporated^††(p) 0.26 04/12/2010 12,024,35215,000,000 Thames Asset Global Securitization # 1 Incorporated^††(p) 0.17 03/22/2010 14,998,42519,000,000 Thames Asset Global Securitization # 1 Incorporated^††(p) 0.19 04/19/2010 18,995,086
8,000,000 Thames Asset Global Securitization # 1 Incorporated^††(p) 0.19 04/26/2010 7,997,636118,000,000 Thames Asset Global Securitization # 1 Incorporated^††(p) 0.24 06/07/2010 117,922,335
20,000,000 Thames Asset Global Securitization # 1 Incorporated^††(p) 0.21 03/12/2010 19,998,59410,000,000 Thames Asset Global Securitization # 1 Incorporated^††(p) 0.22 03/18/2010 9,998,914
9,767,000 Thames Asset Global Securitization #1 Incorporated^††(p) 0.17 03/24/2010 9,765,8777,289,000 Thames Asset Global Securitization #1 Incorporated^††(p) 0.19 04/07/2010 7,287,502
25,000,000 Thames Asset Global Securitization #1 Incorporated^††(p) 0.20 04/09/2010 24,994,58326,000,000 Thames Asset Global Securitization #1Incorporated^††(p) 0.21 03/15/2010 25,997,674
1,000,000 Ticonderoga Funding LLC^††(p) 0.09 03/02/2010 999,99544,500,000 Ticonderoga Funding LLC^††(p) 0.18 03/29/2010 44,493,424
9,000,000 Ticonderoga Funding LLC^††(p) 0.19 04/26/2010 8,997,34040,000,000 Total Capital Canada Limited^†† 0.19 05/26/2010 39,981,84424,000,000 Toyota Financial Services de Puerto Rico Incorporated^ 0.20 03/10/2010 23,998,68024,000,000 Toyota Financial Services de Puerto Rico Incorporated^ 0.20 03/11/2010 23,998,53326,500,000 Toyota Motor Credit Corporation^ 0.19 04/21/2010 26,492,86717,500,000 Toyota Motor Credit Corporation^ 0.19 04/22/2010 17,495,19721,000,000 Toyota Motor Credit Corporation^ 0.21 04/26/2010 20,993,14010,000,000 Toyota Motor Credit Corporation^ 0.24 03/19/2010 9,998,75050,000,000 Toyota Motor Credit Corporation^ 0.24 03/29/2010 49,990,27823,750,000 Toyota Motor Credit Corporation^ 0.20 03/12/2010 23,748,40319,000,000 Tulip Funding Corporation^††(p) 0.19 04/08/2010 18,996,18918,000,000 Tulip Funding Corporation^††(p) 0.20 04/09/2010 17,996,10075,000,000 UBS Finance Delaware LLC^ 0.26 04/05/2010 74,980,313
106,000,000 Unicredit Delaware Incorporated^†† 0.20 03/15/2010 105,991,34387,000,000 Unicredit Delaware Incorporated^†† 0.19 03/03/2010 86,998,59810,750,000 Unicredit Delaware Incorporated^†† 0.29 03/11/2010 10,749,04460,000,000 UniCredito Italiano Bank (Ireland) plc^†† 0.29 04/06/2010 59,982,000
3,000,000 Versailles Commercial Paper LLC^††(p) 0.18 03/23/2010 2,999,65217,000,000 Versailles Commercial Paper LLC^††(p) 0.35 03/12/2010 16,998,18223,000,000 Versailles Commercial Paper LLC^††(p) 0.28 03/05/2010 22,999,10642,000,000 Versailles Commercial Paper LLC^††(p) 0.33 03/19/2010 41,992,65032,840,000 Victory Receivables Corporation^††(p) 0.13 03/04/2010 32,839,53516,000,000 Victory Receivables Corporation^††(p) 0.14 03/08/2010 15,999,50221,000,000 Victory Receivables Corporation^††(p) 0.14 03/09/2010 20,999,25375,000,000 Westpac Securities NZ Limited±†† 0.30 08/20/2010 75,000,00030,500,000 Westpac Securities NZ Limited±†† 0.35 11/05/2010 30,500,00021,500,000 Windmill Funding Corporation^††(p) 0.09 03/02/2010 21,499,898
4,000,000 Windmill Funding Corporation^††(p) 0.15 03/17/2010 3,999,71615,050,000 Windmill Funding Corporation^††(p) 0.18 04/07/2010 15,047,21642,000,000 Yorktown Capital LLC^††(p) 0.20 05/10/2010 41,983,65419,000,000 Yorktown Capital LLC^††(p) 0.22 04/12/2010 18,995,12317,000,000 Yorktown Capital LLC^††(p) 0.23 04/20/2010 16,994,569
6,000,000 Yorktown Capital LLC^††(p) 0.24 03/19/2010 5,999,250
Total Commercial Paper (Cost $11,305,329,434) 11,305,329,434
Corporate Bonds & Notes: 7.06%11,210,000 ACTS Retirement Life Communities Incorporated±§ 0.23 11/15/2029 11,210,000
197,390,000 Bank of America Corporation±§ 1.08 12/02/2011 200,437,59340,000,000 BBVA US Senior SAU±†† 0.30 03/12/2010 40,000,590
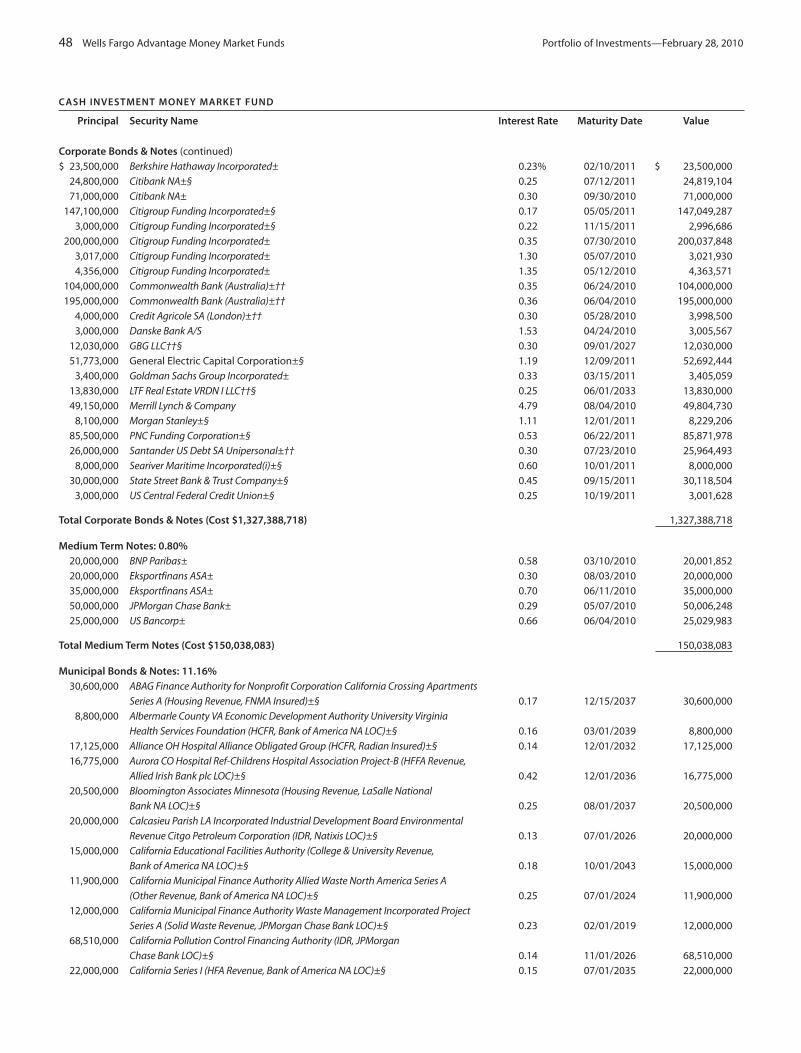
48 Wells Fargo Advantage Money Market Funds Portfolio of Investments—February 28, 2010
CASH INVESTMENT MONEY MARKET FUND
Principal Security Name Interest Rate Maturity Date Value
Corporate Bonds & Notes (continued)$ 23,500,000 Berkshire Hathaway Incorporated± 0.23% 02/10/2011 $ 23,500,000
24,800,000 Citibank NA±§ 0.25 07/12/2011 24,819,10471,000,000 Citibank NA± 0.30 09/30/2010 71,000,000
147,100,000 Citigroup Funding Incorporated±§ 0.17 05/05/2011 147,049,2873,000,000 Citigroup Funding Incorporated±§ 0.22 11/15/2011 2,996,686
200,000,000 Citigroup Funding Incorporated± 0.35 07/30/2010 200,037,8483,017,000 Citigroup Funding Incorporated± 1.30 05/07/2010 3,021,9304,356,000 Citigroup Funding Incorporated± 1.35 05/12/2010 4,363,571
104,000,000 Commonwealth Bank (Australia)±†† 0.35 06/24/2010 104,000,000195,000,000 Commonwealth Bank (Australia)±†† 0.36 06/04/2010 195,000,000
4,000,000 Credit Agricole SA (London)±†† 0.30 05/28/2010 3,998,5003,000,000 Danske Bank A/S 1.53 04/24/2010 3,005,567
12,030,000 GBG LLC††§ 0.30 09/01/2027 12,030,00051,773,000 General Electric Capital Corporation±§ 1.19 12/09/2011 52,692,444
3,400,000 Goldman Sachs Group Incorporated± 0.33 03/15/2011 3,405,05913,830,000 LTF Real Estate VRDN I LLC††§ 0.25 06/01/2033 13,830,00049,150,000 Merrill Lynch & Company 4.79 08/04/2010 49,804,730
8,100,000 Morgan Stanley±§ 1.11 12/01/2011 8,229,20685,500,000 PNC Funding Corporation±§ 0.53 06/22/2011 85,871,97826,000,000 Santander US Debt SA Unipersonal±†† 0.30 07/23/2010 25,964,493
8,000,000 Seariver Maritime Incorporated(i)±§ 0.60 10/01/2011 8,000,00030,000,000 State Street Bank & Trust Company±§ 0.45 09/15/2011 30,118,504
3,000,000 US Central Federal Credit Union±§ 0.25 10/19/2011 3,001,628
Total Corporate Bonds & Notes (Cost $1,327,388,718) 1,327,388,718
Medium Term Notes: 0.80%20,000,000 BNP Paribas± 0.58 03/10/2010 20,001,85220,000,000 Eksportfinans ASA± 0.30 08/03/2010 20,000,00035,000,000 Eksportfinans ASA± 0.70 06/11/2010 35,000,00050,000,000 JPMorgan Chase Bank± 0.29 05/07/2010 50,006,24825,000,000 US Bancorp± 0.66 06/04/2010 25,029,983
Total Medium Term Notes (Cost $150,038,083) 150,038,083
Municipal Bonds & Notes: 11.16%30,600,000 ABAG Finance Authority for Nonprofit Corporation California Crossing Apartments
Series A (Housing Revenue, FNMA Insured)±§ 0.17 12/15/2037 30,600,0008,800,000 Albermarle County VA Economic Development Authority University Virginia
Health Services Foundation (HCFR, Bank of America NA LOC)±§ 0.16 03/01/2039 8,800,00017,125,000 Alliance OH Hospital Alliance Obligated Group (HCFR, Radian Insured)±§ 0.14 12/01/2032 17,125,00016,775,000 Aurora CO Hospital Ref-Childrens Hospital Association Project-B (HFFA Revenue,
Allied Irish Bank plc LOC)±§ 0.42 12/01/2036 16,775,00020,500,000 Bloomington Associates Minnesota (Housing Revenue, LaSalle National
Bank NA LOC)±§ 0.25 08/01/2037 20,500,00020,000,000 Calcasieu Parish LA Incorporated Industrial Development Board Environmental
Revenue Citgo Petroleum Corporation (IDR, Natixis LOC)±§ 0.13 07/01/2026 20,000,00015,000,000 California Educational Facilities Authority (College & University Revenue,
Bank of America NA LOC)±§ 0.18 10/01/2043 15,000,00011,900,000 California Municipal Finance Authority Allied Waste North America Series A
(Other Revenue, Bank of America NA LOC)±§ 0.25 07/01/2024 11,900,00012,000,000 California Municipal Finance Authority Waste Management Incorporated Project
Series A (Solid Waste Revenue, JPMorgan Chase Bank LOC)±§ 0.23 02/01/2019 12,000,00068,510,000 California Pollution Control Financing Authority (IDR, JPMorgan
Chase Bank LOC)±§ 0.14 11/01/2026 68,510,00022,000,000 California Series I (HFA Revenue, Bank of America NA LOC)±§ 0.15 07/01/2035 22,000,000
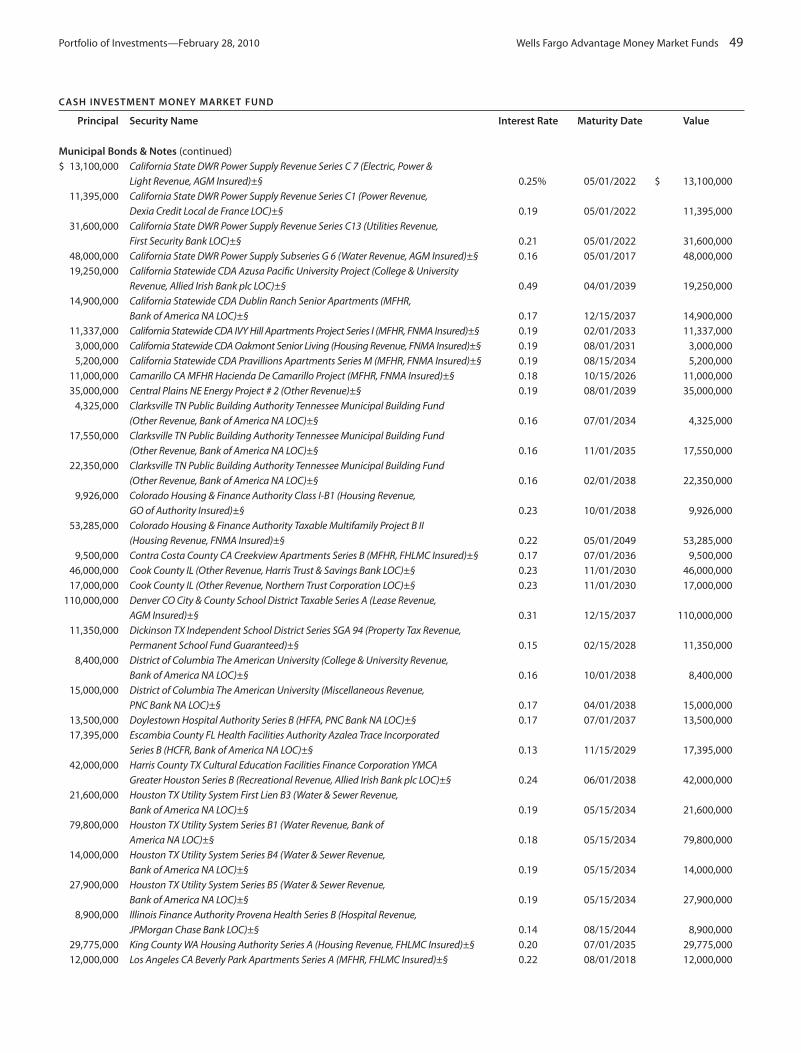
Portfolio of Investments—February 28, 2010 Wells Fargo Advantage Money Market Funds 49
CASH INVESTMENT MONEY MARKET FUND
Principal Security Name Interest Rate Maturity Date Value
Municipal Bonds & Notes (continued)$ 13,100,000 California State DWR Power Supply Revenue Series C 7 (Electric, Power &
Light Revenue, AGM Insured)±§ 0.25% 05/01/2022 $ 13,100,00011,395,000 California State DWR Power Supply Revenue Series C1 (Power Revenue,
Dexia Credit Local de France LOC)±§ 0.19 05/01/2022 11,395,00031,600,000 California State DWR Power Supply Revenue Series C13 (Utilities Revenue,
First Security Bank LOC)±§ 0.21 05/01/2022 31,600,00048,000,000 California State DWR Power Supply Subseries G 6 (Water Revenue, AGM Insured)±§ 0.16 05/01/2017 48,000,00019,250,000 California Statewide CDA Azusa Pacific University Project (College & University
Revenue, Allied Irish Bank plc LOC)±§ 0.49 04/01/2039 19,250,00014,900,000 California Statewide CDA Dublin Ranch Senior Apartments (MFHR,
Bank of America NA LOC)±§ 0.17 12/15/2037 14,900,00011,337,000 California Statewide CDA IVY Hill Apartments Project Series I (MFHR, FNMA Insured)±§ 0.19 02/01/2033 11,337,000
3,000,000 California Statewide CDA Oakmont Senior Living (Housing Revenue, FNMA Insured)±§ 0.19 08/01/2031 3,000,0005,200,000 California Statewide CDA Pravillions Apartments Series M (MFHR, FNMA Insured)±§ 0.19 08/15/2034 5,200,000
11,000,000 Camarillo CA MFHR Hacienda De Camarillo Project (MFHR, FNMA Insured)±§ 0.18 10/15/2026 11,000,00035,000,000 Central Plains NE Energy Project # 2 (Other Revenue)±§ 0.19 08/01/2039 35,000,000
4,325,000 Clarksville TN Public Building Authority Tennessee Municipal Building Fund (Other Revenue, Bank of America NA LOC)±§ 0.16 07/01/2034 4,325,000
17,550,000 Clarksville TN Public Building Authority Tennessee Municipal Building Fund (Other Revenue, Bank of America NA LOC)±§ 0.16 11/01/2035 17,550,000
22,350,000 Clarksville TN Public Building Authority Tennessee Municipal Building Fund (Other Revenue, Bank of America NA LOC)±§ 0.16 02/01/2038 22,350,000
9,926,000 Colorado Housing & Finance Authority Class I-B1 (Housing Revenue, GO of Authority Insured)±§ 0.23 10/01/2038 9,926,000
53,285,000 Colorado Housing & Finance Authority Taxable Multifamily Project B II (Housing Revenue, FNMA Insured)±§ 0.22 05/01/2049 53,285,000
9,500,000 Contra Costa County CA Creekview Apartments Series B (MFHR, FHLMC Insured)±§ 0.17 07/01/2036 9,500,00046,000,000 Cook County IL (Other Revenue, Harris Trust & Savings Bank LOC)±§ 0.23 11/01/2030 46,000,00017,000,000 Cook County IL (Other Revenue, Northern Trust Corporation LOC)±§ 0.23 11/01/2030 17,000,000
110,000,000 Denver CO City & County School District Taxable Series A (Lease Revenue,AGM Insured)±§ 0.31 12/15/2037 110,000,000
11,350,000 Dickinson TX Independent School District Series SGA 94 (Property Tax Revenue, Permanent School Fund Guaranteed)±§ 0.15 02/15/2028 11,350,000
8,400,000 District of Columbia The American University (College & University Revenue, Bank of America NA LOC)±§ 0.16 10/01/2038 8,400,000
15,000,000 District of Columbia The American University (Miscellaneous Revenue, PNC Bank NA LOC)±§ 0.17 04/01/2038 15,000,000
13,500,000 Doylestown Hospital Authority Series B (HFFA, PNC Bank NA LOC)±§ 0.17 07/01/2037 13,500,00017,395,000 Escambia County FL Health Facilities Authority Azalea Trace Incorporated
Series B (HCFR, Bank of America NA LOC)±§ 0.13 11/15/2029 17,395,00042,000,000 Harris County TX Cultural Education Facilities Finance Corporation YMCA
Greater Houston Series B (Recreational Revenue, Allied Irish Bank plc LOC)±§ 0.24 06/01/2038 42,000,00021,600,000 Houston TX Utility System First Lien B3 (Water & Sewer Revenue,
Bank of America NA LOC)±§ 0.19 05/15/2034 21,600,00079,800,000 Houston TX Utility System Series B1 (Water Revenue, Bank of
America NA LOC)±§ 0.18 05/15/2034 79,800,00014,000,000 Houston TX Utility System Series B4 (Water & Sewer Revenue,
Bank of America NA LOC)±§ 0.19 05/15/2034 14,000,00027,900,000 Houston TX Utility System Series B5 (Water & Sewer Revenue,
Bank of America NA LOC)±§ 0.19 05/15/2034 27,900,0008,900,000 Illinois Finance Authority Provena Health Series B (Hospital Revenue,
JPMorgan Chase Bank LOC)±§ 0.14 08/15/2044 8,900,00029,775,000 King County WA Housing Authority Series A (Housing Revenue, FHLMC Insured)±§ 0.20 07/01/2035 29,775,00012,000,000 Los Angeles CA Beverly Park Apartments Series A (MFHR, FHLMC Insured)±§ 0.22 08/01/2018 12,000,000

50 Wells Fargo Advantage Money Market Funds Portfolio of Investments—February 28, 2010
CASH INVESTMENT MONEY MARKET FUND
Principal Security Name Interest Rate Maturity Date Value
Municipal Bonds & Notes (continued)$ 15,200,000 Los Angeles CA Community RDA Academy Village Apartments (Housing Revenue,
FHLMC Insured)±§ 0.19% 10/01/2019 $ 15,200,00017,900,000 Los Angeles County CA Housing Authority MFHR Bonds (Housing Revenue,
FHLMC Insured)±§ 0.28 09/01/2030 17,900,00025,000,000 Louisiana Public Facilities Authority (IDR, JPMorgan Chase Bank LOC)±§ 0.13 10/01/2033 25,000,00040,917,000 Lower Alabama Gas District Supply Revenue Series A (Utilities Revenue,
Societe Generale LOC)±§ 0.20 11/01/2027 40,917,00024,345,000 Massachusetts Development Finance Agency Babson College B (Other Revenue,
Citibank NA LOC)±§ 0.20 10/01/2031 24,345,00012,700,000 Midlothian Industrial Development Corporation (IDR, UBS AG LOC)±§ 0.17 08/01/2034 12,700,000
4,700,000 Minnesota State Office of Higher Education Series B (Educational Facilities Revenue, Bank of America NA LOC)±§ 0.22 12/01/2043 4,700,000
20,925,000 Mississippi State Taxable Nissan Project A (Other Revenue, Bank of America NA LOC)±§ 0.22 11/01/2028 20,924,101
14,100,000 Missouri State HEFA The Washington University Series A (College & University Revenue, JPMorgan Chase Bank LOC)±§ 0.13 09/01/2030 14,100,000
35,810,000 Montgomery County TN Public Building Authority Pooled Financing Loan Pool(Other Revenue, Bank of America NA LOC)±§ 0.16 02/01/2036 35,810,000
26,230,000 Montgomery County TN Public Building Authority Pooled Financing Loan Pool (Other Revenue, Bank of America NA LOC)±§ 0.16 07/01/2038 26,230,000
21,800,000 New Britain Connecticut Taxable Pension Series C (Property Tax Revenue, Bank of America NA LOC)±§ 0.33 02/01/2026 21,800,000
13,000,000 New Jersey State Turnpike Authority Series C (Transit Revenue, JPMorgan Chase Bank LOC)±§ 0.16 06/15/2032 13,000,000
18,000,000 New Jersey State Turnpike Authority Series D (Tolls Road Revenue, Societe Generale LOC)±§ 0.23 01/01/2018 18,000,000
27,500,000 New York NY City Transitional Financing Authority Class A (Other Revenue, FGIC Insured)±§ 0.23 07/15/2036 27,500,000
17,500,000 New York State Housing Finance Agency Taxable 600 West 42nd B (Other Revenue, Bank of New York LOC)±§ 0.70 11/01/2041 17,500,000
21,627,000 Ohio State HFA Residential Management Taxable Series I (Housing Revenue, GNMA Insured)±§ 0.23 09/01/2039 21,627,000
45,714,000 Ohio State HFA Residential Mortgage Securities Program (Housing Revenue,GNMA Insured)±§ 0.25 09/01/2029 45,714,000
13,700,000 Palm Beach County FL Pine Crest Preparatory (Private School Revenue, Bank of America NA LOC)±§ 0.20 06/01/2032 13,700,000
13,500,000 Parma OH Community General Hospital Series A (Other Revenue, JPMorgan Chase Bank LOC)±§ 0.17 11/01/2029 13,500,000
48,460,000 Pasadena CA COP Series A (Lease Revenue, Bank of America NA LOC)±§ 0.18 02/01/2035 48,460,0007,500,000 Port Arthur TX Navigation District Motiva Enterprises Series C (Other Revenue)±§ 0.13 12/01/2039 7,500,000
10,000,000 Port Arthur TX Navy District Environmental Facilities MotivaEnterprises B (Other Revenue)±§ 0.13 12/01/2039 10,000,000
5,000,000 Ramsey County MN Housing & Redevelopment MFHR Gateway Apartments LP Series A (Housing Revenue, LaSalle National Bank NA LOC)±§ 0.30 10/01/2038 5,000,000
53,500,000 Riverside CA COP (Lease Revenue, Bank of America NA LOC)±§ 0.18 03/01/2037 53,500,0009,800,000 Riverside CA Series C (Electric Revenue, Bank of America NA LOC)±§ 0.18 10/01/2035 9,800,000
13,550,000 Sacramento County CA Housing Authority Natomas Park Apartments Issue B (Housing Revenue, FNMA Insured)±§ 0.18 07/15/2035 13,550,000
7,945,000 Sacramento County CA Housing Authority Shadwood Apartments Project Issue A (MFHR, FHLMC Insured)±§ 0.18 12/01/2022 7,945,000
10,325,000 San Diego CA HFA MFHR Stratton Apartments Project Series A (Housing Revenue, FNMA Insured)±§ 0.18 01/15/2033 10,325,000
7,500,000 San Diego CA Housing Authority MFHR Hillside Garden Apartments Series B (Housing Revenue, FNMA Insured)±§ 0.17 01/15/2035 7,500,000

Portfolio of Investments—February 28, 2010 Wells Fargo Advantage Money Market Funds 51
Municipal Bonds & Notes (continued)$ 37,000,000 San Francisco CA City & County Finance Corporation CA Moscone Center
(Lease Revenue, Bank of America NA LOC)±§ 0.20% 04/01/2030 $ 37,000,0007,700,000 San Francisco CA City & County Redevelopment Agency (MFHR, FNMA Insured)±§ 0.20 06/15/2034 7,700,000
12,500,000 San Francisco CA City & County Redevelopment Agency Community Facilities District # 4 (Other Revenue, Bank of America NA LOC)±§ 0.19 08/01/2032 12,500,000
5,800,000 San Leandro CA Carlton Plaza Series A (MFHR, FNMA Insured)±§ 0.26 09/15/2032 5,800,000302,360,000 Southeast Alabama Gas District Alabama Revenue Supply Project Series A (IDR) ±§ 0.15 08/01/2027 302,360,000
28,500,000 Sweetwater County WY Pacific Corporation Project Series A (PCR, Barclays Bank plc LOC)±§ 0.16 07/01/2015 28,500,000
12,000,000 Texas State Taxable Product Development Program Series A (Other Revenue, National Australia Bank NA LOC)±§ 0.23 06/01/2045 12,000,000
7,500,000 Tyler TX Health Facilities Development Corporation Mother Frances Hospital Series B (HCFR, Bank of America NA LOC)±§ 0.20 07/01/2020 7,500,000
2,000,000 Umatilla Indian Reservation OR Confederated Tribes (Other Revenue, Bank of America NA LOC)±§ 0.20 12/01/2028 2,000,000
32,000,000 Vermont State Student Assistance Corporation (Student Loan Revenue, Lloyds TSB Bank plc LOC)±§ 0.21 12/15/2040 32,000,000
2,125,000 Wayne County MI Airport Authority Series F (Airport Revenue, JPMorgan Chase Bank LOC)±§ 0.19 12/01/2016 2,125,000
8,000,000 West Virginia State Hospital Finance Authority United Health Systems Series A (Hospital Revenue, Bank of America NA LOC)±§ 0.16 06/01/2041 8,000,000
Total Municipal Bonds & Notes (Cost $2,099,780,101) 2,099,780,101
Repurchase Agreements(z): 1.15%14,000,000 Bank of America NA, dated 02/26/2010, Maturity Value $14,000,140 (1) 0.12 03/01/2010 14,000,00010,300,000 Bank of America Securities LLC, dated 02/26/2010, Maturity Value $10,300,103 (2) 0.12 03/01/2010 10,300,00061,000,000 Bank of America Securities LLC, dated 02/26/2010, Maturity Value $61,001,220 (3) 0.24 03/01/2010 61,000,00038,000,000 Barclays Capital Incorporated, dated 02/26/2010, Maturity Value $38,000,760 (4) 0.24 03/01/2010 38,000,000
7,000,000 BNP Paribas Securities, dated 02/26/2010, Maturity Value $7,000,070 (5) 0.12 03/01/2010 7,000,0007,000,000 Citigroup Global Markets, dated 02/26/2010, Maturity Value $7,000,070 (6) 0.12 03/01/2010 7,000,0005,000,000 Credit Suisse First Boston Corporation, dated 02/26/2010,
Maturity Value $5,000,050 (7) 0.12 03/01/2010 5,000,0001,650,000 Deutsche Bank Securities, dated 02/26/2010, Maturity Value $1,650,017 (8) 0.12 03/01/2010 1,650,000
73,000,000 JPMorgan Securities, dated 02/26/2010, Maturity Value $73,001,460 (9) 0.24 03/01/2010 73,000,000
Total Repurchase Agreements (Cost $216,950,000) 216,950,000
Secured Master Note Agreement: 2.28%298,704,000 Bank of America Corporation±§ 0.29 09/09/2034 298,704,000131,213,000 Citigroup Global Markets Holdings DTC MMI±§ 0.64 09/09/2049 131,213,000
Total Secured Master Note Agreement (Cost $429,917,000) 429,917,000
Time Deposits: 7.97%124,000,000 Bank of Ireland 0.35 03/01/2010 124,000,000
99,000,000 Bank of Ireland 0.50 03/02/2010 99,000,00066,000,000 Bayer Hypo-und Vereinsbank AG Munich 0.15 03/02/2010 66,000,00053,000,000 BNP Paribas Paris 0.14 03/02/2010 53,000,00014,000,000 Citibank NA Nassau 0.12 03/01/2010 14,000,00066,000,000 Danske Bank A/S Copenhagen 0.14 03/01/2010 66,000,000
119,000,000 Danske Bank A/S Copenhagen 0.20 03/02/2010 119,000,000184,000,000 Danske Bank A/S Copenhagen 0.21 03/01/2010 184,000,000
90,000,000 Dexia Bank Grand Cayman 0.22 03/05/2010 90,000,00067,000,000 Fortis Bank NV SA 0.18 03/01/2010 67,000,00049,000,000 Fortis Bank NV SA 0.18 03/03/2010 49,000,000
CASH INVESTMENT MONEY MARKET FUND
Principal Security Name Interest Rate Maturity Date Value
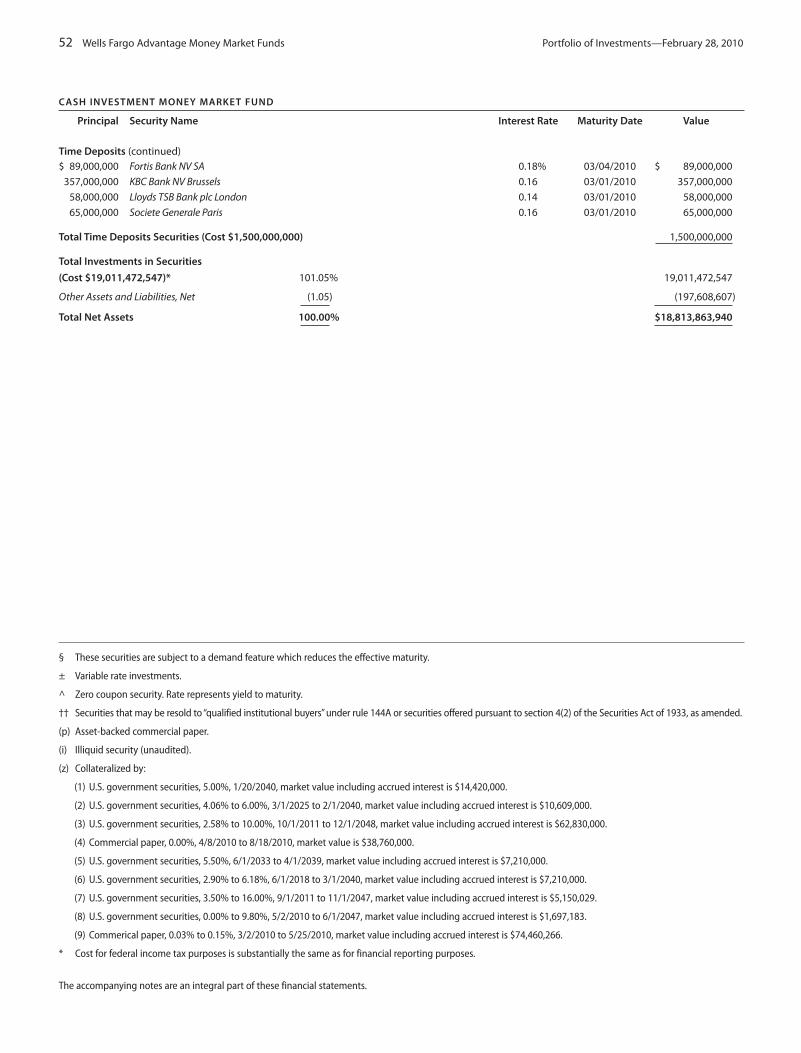
52 Wells Fargo Advantage Money Market Funds Portfolio of Investments—February 28, 2010
CASH INVESTMENT MONEY MARKET FUND
Principal Security Name Interest Rate Maturity Date Value
Time Deposits (continued)$ 89,000,000 Fortis Bank NV SA 0.18% 03/04/2010 $ 89,000,000
357,000,000 KBC Bank NV Brussels 0.16 03/01/2010 357,000,00058,000,000 Lloyds TSB Bank plc London 0.14 03/01/2010 58,000,00065,000,000 Societe Generale Paris 0.16 03/01/2010 65,000,000
Total Time Deposits Securities (Cost $1,500,000,000) 1,500,000,000
Total Investments in Securities
(Cost $19,011,472,547)* 101.05% 19,011,472,547
Other Assets and Liabilities, Net (1.05) (197,608,607)
Total Net Assets 100.00% $18,813,863,940
§ These securities are subject to a demand feature which reduces the effective maturity.
± Variable rate investments.
^ Zero coupon security. Rate represents yield to maturity.
†† Securities that may be resold to “qualified institutional buyers” under rule 144A or securities offered pursuant to section 4(2) of the Securities Act of 1933, as amended.
(p) Asset-backed commercial paper.
(i) Illiquid security (unaudited).
(z) Collateralized by:
(1) U.S. government securities, 5.00%, 1/20/2040, market value including accrued interest is $14,420,000.
(2) U.S. government securities, 4.06% to 6.00%, 3/1/2025 to 2/1/2040, market value including accrued interest is $10,609,000.
(3) U.S. government securities, 2.58% to 10.00%, 10/1/2011 to 12/1/2048, market value including accrued interest is $62,830,000.
(4) Commercial paper, 0.00%, 4/8/2010 to 8/18/2010, market value is $38,760,000.
(5) U.S. government securities, 5.50%, 6/1/2033 to 4/1/2039, market value including accrued interest is $7,210,000.
(6) U.S. government securities, 2.90% to 6.18%, 6/1/2018 to 3/1/2040, market value including accrued interest is $7,210,000.
(7) U.S. government securities, 3.50% to 16.00%, 9/1/2011 to 11/1/2047, market value including accrued interest is $5,150,029.
(8) U.S. government securities, 0.00% to 9.80%, 5/2/2010 to 6/1/2047, market value including accrued interest is $1,697,183.
(9) Commerical paper, 0.03% to 0.15%, 3/2/2010 to 5/25/2010, market value including accrued interest is $74,460,266.
* Cost for federal income tax purposes is substantially the same as for financial reporting purposes.
The accompanying notes are an integral part of these financial statements.
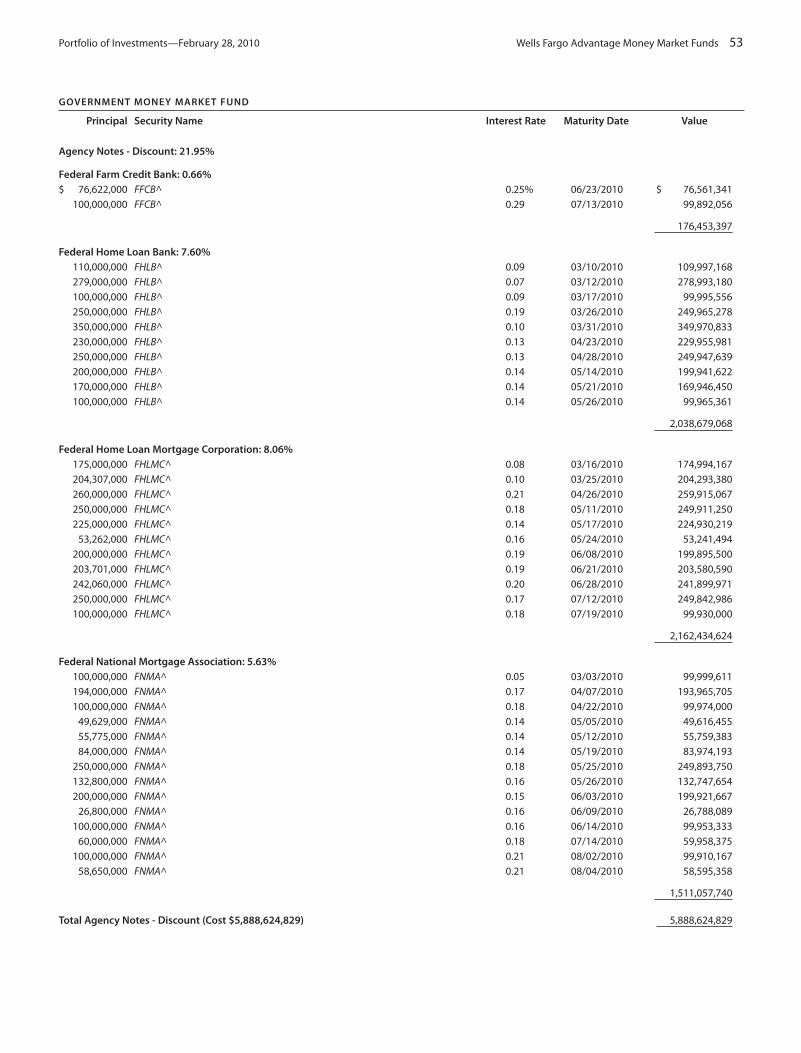
Portfolio of Investments—February 28, 2010 Wells Fargo Advantage Money Market Funds 53
GOVERNMENT MONEY MARKET FUND
Principal Security Name Interest Rate Maturity Date Value
Agency Notes - Discount: 21.95%
Federal Farm Credit Bank: 0.66%$ 76,622,000 FFCB^ 0.25% 06/23/2010 $ 76,561,341
100,000,000 FFCB^ 0.29 07/13/2010 99,892,056
176,453,397
Federal Home Loan Bank: 7.60%110,000,000 FHLB^ 0.09 03/10/2010 109,997,168279,000,000 FHLB^ 0.07 03/12/2010 278,993,180100,000,000 FHLB^ 0.09 03/17/2010 99,995,556250,000,000 FHLB^ 0.19 03/26/2010 249,965,278350,000,000 FHLB^ 0.10 03/31/2010 349,970,833230,000,000 FHLB^ 0.13 04/23/2010 229,955,981250,000,000 FHLB^ 0.13 04/28/2010 249,947,639200,000,000 FHLB^ 0.14 05/14/2010 199,941,622170,000,000 FHLB^ 0.14 05/21/2010 169,946,450100,000,000 FHLB^ 0.14 05/26/2010 99,965,361
2,038,679,068
Federal Home Loan Mortgage Corporation: 8.06%175,000,000 FHLMC^ 0.08 03/16/2010 174,994,167204,307,000 FHLMC^ 0.10 03/25/2010 204,293,380260,000,000 FHLMC^ 0.21 04/26/2010 259,915,067250,000,000 FHLMC^ 0.18 05/11/2010 249,911,250225,000,000 FHLMC^ 0.14 05/17/2010 224,930,219
53,262,000 FHLMC^ 0.16 05/24/2010 53,241,494200,000,000 FHLMC^ 0.19 06/08/2010 199,895,500203,701,000 FHLMC^ 0.19 06/21/2010 203,580,590242,060,000 FHLMC^ 0.20 06/28/2010 241,899,971250,000,000 FHLMC^ 0.17 07/12/2010 249,842,986100,000,000 FHLMC^ 0.18 07/19/2010 99,930,000
2,162,434,624
Federal National Mortgage Association: 5.63%100,000,000 FNMA^ 0.05 03/03/2010 99,999,611194,000,000 FNMA^ 0.17 04/07/2010 193,965,705100,000,000 FNMA^ 0.18 04/22/2010 99,974,000
49,629,000 FNMA^ 0.14 05/05/2010 49,616,45555,775,000 FNMA^ 0.14 05/12/2010 55,759,38384,000,000 FNMA^ 0.14 05/19/2010 83,974,193
250,000,000 FNMA^ 0.18 05/25/2010 249,893,750132,800,000 FNMA^ 0.16 05/26/2010 132,747,654200,000,000 FNMA^ 0.15 06/03/2010 199,921,667
26,800,000 FNMA^ 0.16 06/09/2010 26,788,089100,000,000 FNMA^ 0.16 06/14/2010 99,953,333
60,000,000 FNMA^ 0.18 07/14/2010 59,958,375100,000,000 FNMA^ 0.21 08/02/2010 99,910,167
58,650,000 FNMA^ 0.21 08/04/2010 58,595,358
1,511,057,740
Total Agency Notes - Discount (Cost $5,888,624,829) 5,888,624,829

54 Wells Fargo Advantage Money Market Funds Portfolio of Investments—February 28, 2010
GOVERNMENT MONEY MARKET FUND
Principal Security Name Interest Rate Maturity Date Value
Agency Notes - Interest Bearing: 20.51%
Federal Farm Credit Bank: 4.22%$ 90,000,000 FFCB± 0.23% 03/01/2010 $ 90,000,000
20,000,000 FFCB 1.05 03/18/2010 20,006,19129,450,000 FFCB 2.38 04/07/2010 29,515,89415,540,000 FFCB 4.30 04/27/2010 15,640,21266,200,000 FFCB 2.75 05/04/2010 66,465,29446,582,000 FFCB 4.75 05/07/2010 46,977,99110,000,000 FFCB 2.25 07/01/2010 10,066,417
100,000,000 FFCB± 0.50 07/23/2010 100,000,000125,000,000 FFCB± 0.18 07/27/2010 125,000,000
75,000,000 FFCB± 0.03 12/17/2010 74,913,96450,000,000 FFCB± 0.17 03/22/2011 50,000,00016,200,000 FFCB± 0.32 05/18/2011 16,230,01650,000,000 FFCB± 0.15 06/07/2011 49,985,505
225,000,000 FFCB± 0.15 06/23/2011 224,960,594211,725,000 FFCB± 0.14 06/28/2011 211,681,309
1,131,443,387
Federal Home Loan Bank: 8.18%100,000,000 FHLB 5.00 03/03/2010 100,026,419
50,000,000 FHLB± 0.16 04/01/2010 49,993,113200,000,000 FHLB± 0.18 04/16/2010 200,002,544
27,000,000 FHLB 0.48 05/11/2010 27,011,986125,000,000 FHLB 0.55 05/28/2010 125,044,491
2,665,000 FHLB 3.00 06/11/2010 2,684,857134,885,000 FHLB 4.25 06/11/2010 136,363,036
38,570,000 FHLB 5.25 06/11/2010 39,099,818106,770,000 FHLB 0.56 06/18/2010 106,842,144
41,800,000 FHLB 3.50 07/16/2010 42,303,567370,000,000 FHLB± 0.18 07/27/2010 369,975,429250,000,000 FHLB± 0.18 05/25/2011 249,938,187160,000,000 FHLB± 0.13 06/07/2011 159,917,367165,000,000 FHLB± 0.13 07/20/2011 164,929,660150,000,000 FHLB± 0.13 07/25/2011 149,925,217150,000,000 FHLB± 0.15 07/28/2011 149,924,778120,000,000 FHLB± 0.14 08/12/2011 119,929,777
2,193,912,390
Federal Home Loan Mortgage Corporation: 5.70%50,000,000 FHLMC 2.88 06/28/2010 50,443,156
500,000,000 FHLMC± 0.24 09/03/2010 499,940,710600,000,000 FHLMC± 0.22 09/24/2010 600,025,993128,365,000 FHLMC± 0.30 01/28/2011 128,512,137250,000,000 FHLMC± 0.33 03/09/2011 250,193,115
1,529,115,111
Federal National Mortgage Association: 2.41%105,188,000 FNMA 0.00 04/01/2010 105,165,355300,000,000 FNMA 5.25 04/27/2010 302,354,226103,884,000 FNMA± 0.20 08/05/2010 103,911,200135,000,000 FNMA± 0.14 08/11/2011 134,901,660
646,332,441
Total Agency Notes - Interest Bearing (Cost $5,500,803,329) 5,500,803,329

Portfolio of Investments—February 28, 2010 Wells Fargo Advantage Money Market Funds 55
GOVERNMENT MONEY MARKET FUND
Principal Security Name Interest Rate Maturity Date Value
Corporate Bonds & Notes: 5.65%
Depository Institutions: 1.22%$ 235,000,000 American Express Bank FSB± 1.08% 12/10/2010 $ 236,625,807
90,000,000 JPMorgan Chase & Company± 0.76 12/02/2010 90,453,056
327,078,863
Diversified Financial Services: 2.38%145,600,000 Citigroup Incorporated± 0.81 12/09/2010 146,394,082159,300,000 General Electric Capital Corporation± 0.30 07/08/2010 159,387,022201,250,000 General Electric Capital Corporation± 0.66 06/09/2010 201,537,199130,000,000 General Electric Capital Corporation± 0.89 12/09/2010 130,811,544
638,129,847
Domestic Banks: 2.05%375,000,000 Bank of America NA Temporary Liquidity Guarantee Program± 0.28 09/13/2010 375,014,545115,000,000 Citibank NA± 0.30 09/30/2010 115,000,000
59,315,000 Citigroup Funding Incorporated± 0.35 07/30/2010 59,365,584
549,380,129
Total Corporate Bonds & Notes (Cost $1,514,588,839) 1,514,588,839
Repurchase Agreements(z): 42.61%1,302,000,000 Bank of America NA, dated 02/26/2010, Maturity Value $1,302,013,020 (1) 0.12 03/01/2010 1,302,000,000
75,000,000 Bank of America Securities LLC , dated 02/26/2010, Maturity Value $75,000,625 (2) 0.10 03/01/2010 75,000,000194,390,000 Barclays Capital Incorporated, dated 02/26/2010, Maturity Value $194,391,620 (3) 0.10 03/01/2010 194,390,000900,000,000 Barclays Capital Incorporated, dated 02/26/2010, Maturity Value $900,008,250 (4) 0.11 03/03/2010 900,000,000579,000,000 BNP Paribas Securities , dated 02/26/2010, Maturity Value $579,005,790 (5) 0.12 03/01/2010 579,000,000723,000,000 Citigroup Global Markets, dated 02/26/2010, Maturity Value $723,007,230 (6) 0.12 03/01/2010 723,000,000100,000,000 Credit Suisse First Boston Corporation, dated 02/26/2010,
Maturity Value $100,000,750 (7) 0.09 03/01/2010 100,000,000723,000,000 Credit Suisse First Boston Corporation, dated 02/26/2010,
Maturity Value $723,007,230 (8) 0.12 03/01/2010 723,000,0001,502,900,000 Deutsche Bank Securities, dated 02/26/2010, Maturity Value $1,502,915,029 (9) 0.12 03/01/2010 1,502,900,000
50,000,000 Deutsche Bank Securities, dated 02/26/2010, Maturity Value $50,000,417 (10) 0.10 03/01/2010 50,000,000100,000,000 Goldman Sachs & Company, dated 02/26/2010, Maturity Value $100,000,417 (11) 0.05 03/01/2010 100,000,000921,380,000 Goldman Sachs & Company, dated 02/26/2010, Maturity Value $921,389,214 (12) 0.12 03/01/2010 921,380,000
1,447,000,000 HSBC Securities, dated 02/26/2010, Maturity Value $1,447,014,470 (13) 0.12 03/01/2010 1,447,000,000964,000,000 JPMorgan Securities, dated 02/26/2010, Maturity Value $964,009,640 (14) 0.12 03/01/2010 964,000,000100,000,000 Morgan Stanley & Company, dated 02/26/2010, Maturity Value $100,000,750 (15) 0.09 03/01/2010 100,000,000100,000,000 Morgan Stanley & Company, dated 02/26/2010, Maturity Value $100,000,917 (16) 0.11 03/01/2010 100,000,000200,000,000 Morgan Stanley & Company, dated 02/26/2010, Maturity Value $200,001,333 (17) 0.08 03/01/2010 200,000,000
1,447,000,000 RBS Securities , dated 02/26/2010, Maturity Value $1,447,014,470 (18) 0.12 03/01/2010 1,447,000,000
Total Repurchase Agreements (Cost $11,428,670,000) 11,428,670,000
Commercial Paper: 9.24%
Financial Services: 9.24%40,131,000 Straight-A Funding LLC^††(p) 0.00 03/01/2010 40,131,000
100,124,000 Straight-A Funding LLC^††(p) 0.11 03/02/2010 100,123,49950,487,000 Straight-A Funding LLC^††(p) 0.18 03/03/2010 50,486,49515,130,000 Straight-A Funding LLC^††(p) 0.14 03/08/2010 15,129,529
100,000,000 Straight-A Funding LLC^††(p) 0.16 03/08/2010 99,996,88975,000,000 Straight-A Funding LLC^††(p) 0.14 03/09/2010 74,997,333
100,000,000 Straight-A Funding LLC^††(p) 0.18 03/10/2010 99,995,500102,000,000 Straight-A Funding LLC^††(p) 0.16 03/11/2010 101,994,900
13,760,000 Straight-A Funding LLC^††(p) 0.18 03/12/2010 13,759,243
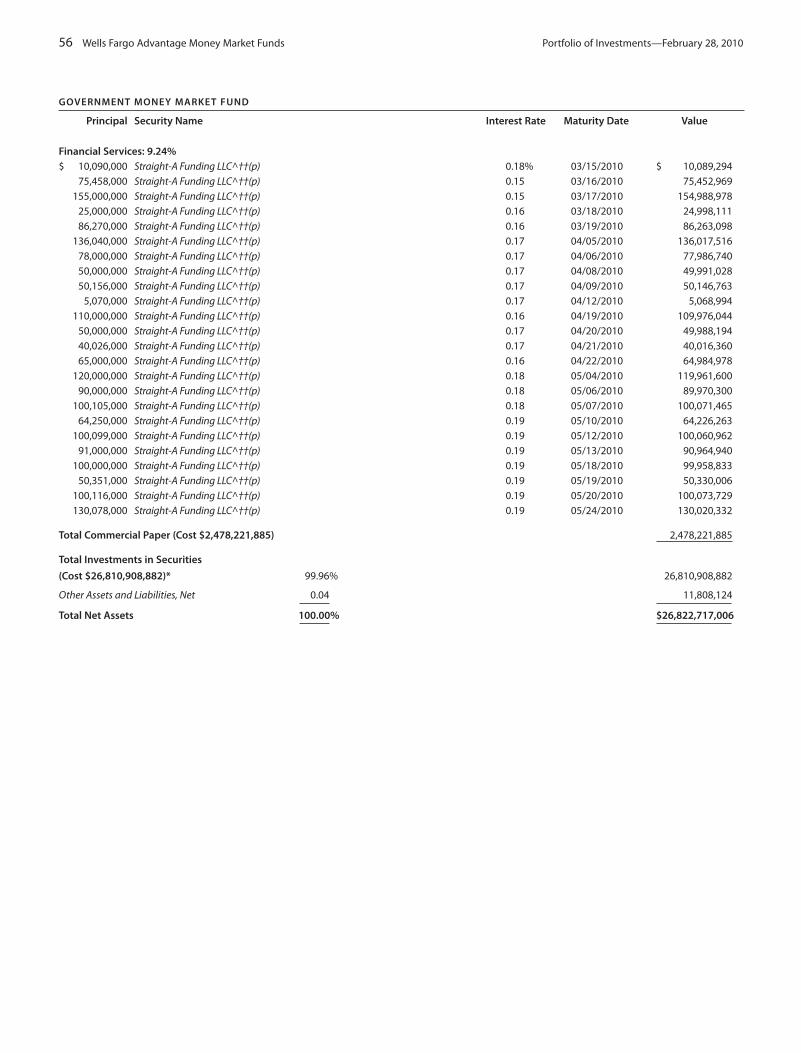
56 Wells Fargo Advantage Money Market Funds Portfolio of Investments—February 28, 2010
GOVERNMENT MONEY MARKET FUND
Principal Security Name Interest Rate Maturity Date Value
Financial Services: 9.24%$ 10,090,000 Straight-A Funding LLC^††(p) 0.18% 03/15/2010 $ 10,089,294
75,458,000 Straight-A Funding LLC^††(p) 0.15 03/16/2010 75,452,969155,000,000 Straight-A Funding LLC^††(p) 0.15 03/17/2010 154,988,978
25,000,000 Straight-A Funding LLC^††(p) 0.16 03/18/2010 24,998,11186,270,000 Straight-A Funding LLC^††(p) 0.16 03/19/2010 86,263,098
136,040,000 Straight-A Funding LLC^††(p) 0.17 04/05/2010 136,017,51678,000,000 Straight-A Funding LLC^††(p) 0.17 04/06/2010 77,986,74050,000,000 Straight-A Funding LLC^††(p) 0.17 04/08/2010 49,991,02850,156,000 Straight-A Funding LLC^††(p) 0.17 04/09/2010 50,146,763
5,070,000 Straight-A Funding LLC^††(p) 0.17 04/12/2010 5,068,994110,000,000 Straight-A Funding LLC^††(p) 0.16 04/19/2010 109,976,044
50,000,000 Straight-A Funding LLC^††(p) 0.17 04/20/2010 49,988,19440,026,000 Straight-A Funding LLC^††(p) 0.17 04/21/2010 40,016,36065,000,000 Straight-A Funding LLC^††(p) 0.16 04/22/2010 64,984,978
120,000,000 Straight-A Funding LLC^††(p) 0.18 05/04/2010 119,961,60090,000,000 Straight-A Funding LLC^††(p) 0.18 05/06/2010 89,970,300
100,105,000 Straight-A Funding LLC^††(p) 0.18 05/07/2010 100,071,46564,250,000 Straight-A Funding LLC^††(p) 0.19 05/10/2010 64,226,263
100,099,000 Straight-A Funding LLC^††(p) 0.19 05/12/2010 100,060,96291,000,000 Straight-A Funding LLC^††(p) 0.19 05/13/2010 90,964,940
100,000,000 Straight-A Funding LLC^††(p) 0.19 05/18/2010 99,958,83350,351,000 Straight-A Funding LLC^††(p) 0.19 05/19/2010 50,330,006
100,116,000 Straight-A Funding LLC^††(p) 0.19 05/20/2010 100,073,729130,078,000 Straight-A Funding LLC^††(p) 0.19 05/24/2010 130,020,332
Total Commercial Paper (Cost $2,478,221,885) 2,478,221,885
Total Investments in Securities
(Cost $26,810,908,882)* 99.96% 26,810,908,882
Other Assets and Liabilities, Net 0.04 11,808,124
Total Net Assets 100.00% $26,822,717,006

Portfolio of Investments—February 28, 2010 Wells Fargo Advantage Money Market Funds 57
GOVERNMENT MONEY MARKET FUND
^ Zero coupon security. Rate represents yield to maturity.
± Variable rate investments.
†† Securities that may be resold to “qualified institutional buyers” under rule 144A or securities offered pursuant to section 4(2) of the Securities Act of 1933, as amended.
(p) Asset-backed commercial paper.
(z) Collateralized by:
(1) U.S. government securities, 5.00%, 1/20/2040, market value including accrued interest is $1,341,060,000.
(2) U.S. government securities, 0.875% to 2.375%, 3/31/2011 to 3/31/2016, market value including accrued interest is $76,500,028.
(3) U.S. government securities, 0.00% to 4.25%, 6/3/2010 to 5/15/2039, market value including accrued interest is $198,277,819.
(4) U.S. government securities, 2.66% to 7.50%, 2/1/2013 to 1/1/2048, market value including accrued interest is $927,000,001.
(5) U.S. government securities, 5.50%, 6/1/2033 to 4/1/2039, market value including accrued interest is $596,370,000.
(6) U.S. government securities, 2.90% to 6.18%, 6/1/2018 to 3/1/2040, market value including accrued interest is $744,690,000.
(7) U.S. government securities, 1.375% to 2.625%, 10/31/2010 to 4/30/2016, market value including accrued interest is $102,001,519.
(8) U.S. government securities, 3.50% to 16.00%, 9/1/2011 to 11/1/2047, market value including accrued interest is $744,694,177.
(9) U.S. government securities, 0.00% to 3.13%, 2/10/2011 to 5/15/2019, market value including accrued interest is $51,000,003.
(10) U.S. government securities, 0.00% to 9.80%, 5/2/2010 to 6/1/2047, market value including accrued interest is $1,545,876,725.
(11) U.S. government securities, 4.375%, 8/15/2012, market value including accrued interest is $102,000,062.
(12) U.S. government securities, 5.00% to 6.00%, 3/15/2038 to 11/15/2039, market value including accrued interest is $949,021,401.
(13) U.S. government securities, 3.50% to 7.00%, 7/1/2032 to 10/1/2039, market value including accrued interest is $1,490,418,181.
(14) U.S. government securities, 4.00% to 9.00%, 7/11/2011 to 2/1/2040, market value including accrued interest is $992,922,585.
(15) U.S. government securities, 0.875% to 5.125%, 2/28/2011 to 6/30/2011, market value including accrued interest is $204,000,043.
(16) U.S. government securities, 0.875% to 5.125%, 2/28/2011 to 6/30/2011, market value including accrued interest is $102,000,022.
(17) U.S. government securities, 2.45% to 11.00%, 6/1/2010 to 2/1/2040, market value including accrued interest is $103,515,209.
(18) U.S. government securities, 0.00% to 9.375%, 3/26/2010 to 1/1/2040, market value including accrued interest is $1,469,194,463.
* Cost for federal income tax purposes is substantially the same as for financial reporting purposes.
The accompanying notes are an integral part of these financial statements.

58 Wells Fargo Advantage Money Market Funds Portfolio of Investments—February 28, 2010
HERITAGE MONEY MARKET FUND
Principal Security Name Interest Rate Maturity Date Value
Agency Notes - Interest Bearing: 0.27%
Federal Home Loan Mortgage Corporation: 0.27%$ 86,000,000 FHLMC±§ 0.15% 02/02/2012 $ 85,866,675
Total Agency Notes - Interest Bearing (Cost $85,866,675) 85,866,675
Bankers Acceptance Notes: 0.25%
Domestic Banks: 0.25%8,263,449 Bank of America NA^ 0.20 03/17/2010 8,262,714
23,128,740 Bank of America NA^ 0.20 03/18/2010 23,126,5563,000,000 Bank of America NA^ 0.37 04/08/2010 2,998,955
16,000,000 Bank of America NA^ 0.39 05/04/2010 15,988,6224,000,000 Bank of America NA^ 0.35 05/18/2010 3,996,967
23,515,245 Bank of America NA^ 0.33 05/24/2010 23,496,601
Total Bankers Acceptance Notes (Cost $77,870,415) 77,870,415
Certificates of Deposit: 10.73%37,000,000 Abbey National Treasury Service± 0.75 07/12/2010 37,056,981
290,000,000 Abbey National Treasury Services± 0.26 02/14/2011 290,000,00050,000,000 Abbey National Treasury Services± 0.50 05/05/2010 50,019,500
115,000,000 Abbey National Treasury Services± 0.27 12/10/2010 115,000,000129,000,000 Allied Irish Banks North America Incorporated±†† 0.25 03/03/2010 129,000,000107,000,000 Banco Bilbao Vizcaya Argentaria (London)†† 0.18 03/18/2010 106,990,400106,000,000 Banco Bilbao Vizcaya Argentaria (London) 0.30 03/16/2010 106,000,221
69,000,000 Banco Bilbao Vizcaya Argentaria (London)†† 0.29 04/22/2010 68,970,100172,000,000 Banco Bilbao Vizcaya Argentaria (New York) 0.23 04/12/2010 172,000,000155,000,000 Barclays Bank plc (New York)± 0.48 01/19/2011 155,000,000173,000,000 Barclays Bank plc (New York)± 0.78 11/08/2010 173,000,000
65,000,000 Barclays Bank plc (New York)± 0.00 06/24/2010 65,000,00043,000,000 BNP Paribas Euro 0.23 04/12/2010 43,000,50171,000,000 Calyon (New York) 0.25 06/02/2010 70,999,99720,500,000 Calyon (New York)± 0.29 06/29/2010 20,487,27050,000,000 Calyon (New York) 0.55 03/22/2010 50,001,45350,000,000 Calyon (New York)± 0.75 07/12/2010 50,061,89130,000,000 Calyon (New York)± 0.76 06/03/2010 30,032,034
113,000,000 Dexia Delaware 0.00 03/01/2010 113,000,00075,000,000 Lloyds TSB Bank plc (New York)± 0.35 05/10/2010 75,000,000
225,000,000 Lloyds TSB Bank plc (New York)± 0.46 11/12/2010 225,000,000150,000,000 Lloyds TSB Bank plc (New York)± 0.50 07/26/2010 150,000,000
37,000,000 Natixis Commercial Paper Corporation 0.28 04/05/2010 37,000,00070,000,000 Natixis Commercial Paper Corporation 0.30 03/02/2010 70,000,000
224,000,000 Nordea Bank Finland (New York) 1.86 04/28/2010 224,533,67250,000,000 Rabobank Nederland NV (New York)± 0.23 01/06/2011 50,000,00080,000,000 Rabobank Nederland NV (New York)± 0.23 01/07/2011 80,000,000
100,000,000 Rabobank Nederland NV (New York)± 0.23 10/19/2010 100,000,000176,000,000 Royal Bank Scotland plc (Connecticut)± 0.84 07/16/2010 176,000,000113,500,000 Societe Generale (New York)± 0.10 04/05/2010 113,500,000
75,000,000 Societe Generale (New York)±§ 0.55 05/05/2011 75,000,000157,000,000 Unicredit S.p.A (New York) 0.27 05/04/2010 157,000,000
Total Certificates of Deposit (Cost $3,378,654,020) 3,378,654,020
Commercial Paper: 58.11%32,000,000 Allied Irish Banks North America Incorporated††^ 0.13 03/02/2010 31,999,77091,000,000 Allied Irish Banks North America Incorporated††^ 0.20 03/04/2010 90,998,02872,000,000 Allied Irish Banks North America Incorporated††^ 0.21 03/05/2010 71,997,920

Portfolio of Investments—February 28, 2010 Wells Fargo Advantage Money Market Funds 59
HERITAGE MONEY MARKET FUND
Principal Security Name Interest Rate Maturity Date Value
Commercial Paper (continued)$ 72,000,000 Amstel Funding Corporation††(p)^ 0.00% 03/01/2010 $ 72,000,000
28,000,000 Amstel Funding Corporation††(p)^ 0.49 03/04/2010 27,998,48364,000,000 Amstel Funding Corporation††(p)^ 0.56 03/15/2010 63,985,06793,000,000 Amstel Funding Corporation††(p)^ 0.56 03/16/2010 92,976,75071,000,000 Amstel Funding Corporation††(p)^ 0.57 03/17/2010 70,981,067
102,000,000 Amstel Funding Corporation††(p)^ 0.57 03/18/2010 101,971,100197,000,000 Amstel Funding Corporation††(p)^ 0.79 04/30/2010 196,737,333
39,000,000 Amsterdam Funding Corporation††(p)^ 0.15 03/22/2010 38,996,36088,000,000 Amsterdam Funding Corporation††(p)^ 0.16 03/18/2010 87,992,93619,000,000 Amsterdam Funding Corporation††(p)^ 0.17 03/25/2010 18,997,72032,000,000 Amsterdam Funding Corporation††(p)^ 0.18 04/07/2010 31,994,08041,000,000 Amsterdam Funding Corporation††(p)^ 0.19 04/19/2010 40,989,39722,000,000 Amsterdam Funding Corporation††(p)^ 0.20 05/03/2010 21,992,300
154,000,000 Anglo Irish Bank Corporation Limited††^ 0.17 03/03/2010 153,997,86115,000,000 Antalis US Funding Corporation††(p)^ 0.14 03/05/2010 14,999,70014,000,000 Antalis US Funding Corporation††(p)^ 0.17 03/08/2010 13,999,483
7,000,000 Antalis US Funding Corporation††(p)^ 0.20 04/16/2010 6,998,21118,000,000 Antalis US Funding Corporation††(p)^ 0.20 03/08/2010 17,999,30016,900,000 Antalis US Funding Corporation††(p)^ 0.21 04/13/2010 16,895,76111,000,000 Antalis US Funding Corporation††(p)^ 0.21 04/23/2010 10,996,59928,000,000 Antalis US Funding Corporation††(p)^ 0.22 04/08/2010 27,993,49811,000,000 Antalis US Funding Corporation††(p)^ 0.22 04/12/2010 10,997,17730,000,000 Antalis US Funding Corporation††(p)^ 0.23 04/08/2010 29,992,527
280,000,000 ANZ National (International) Limited±†† 0.32 01/11/2011 280,000,000110,000,000 ANZ National (International) Limited±†† 0.38 10/20/2010 110,000,000
17,000,000 Arabella Finance LLC††(p)^ 0.47 03/18/2010 16,995,986105,000,000 ASB Finance Limited (London)±†† 0.33 01/12/2011 104,995,428118,000,000 ASB Finance Limited (London)±†† 0.33 01/10/2011 118,000,000
89,000,000 ASB Finance Limited (London)±†† 0.36 12/08/2010 89,007,15188,000,000 ASB Finance Limited (London)±†† 0.36 12/13/2010 88,007,02740,000,000 ASB Finance Limited (London)±†† 0.78 06/16/2010 40,000,00063,000,000 ASB Finance Limited (London)±†† 0.80 07/09/2010 63,000,00040,000,000 ASB Finance Limited (London)††^ 0.47 03/08/2010 39,995,80034,517,000 Aspen Funding Corporation††(p)^ 0.17 03/17/2010 34,514,23918,000,000 Aspen Funding Corporation††(p)^ 0.20 04/28/2010 17,994,20023,000,000 Atlantic Asset Securitization Corporation††(p)^ 0.15 03/10/2010 22,999,02321,000,000 Atlantic Asset Securitization Corporation††(p)^ 0.15 03/11/2010 20,999,00848,000,000 Atlantic Asset Securitization Corporation††(p)^ 0.18 03/18/2010 47,995,69340,303,000 Atlantic Asset Securitization Corporation††(p)^ 0.19 04/09/2010 40,294,70421,000,000 Atlantic Asset Securitization Corporation††(p)^ 0.19 04/14/2010 20,995,12348,000,000 Atlantic Asset Securitization Corporation††(p)^ 0.20 04/08/2010 47,989,867
268,750,000 Atlantis One Funding Corporation††(p)^ 0.23 03/11/2010 268,732,83026,750,000 Atlantis One Funding Corporation††(p)^ 0.20 03/08/2010 26,748,80448,000,000 Atlantis One Funding Corporation††(p)^ 0.20 03/09/2010 47,997,54761,000,000 Autobahn Funding Company LLC††(p)^ 0.00 03/01/2010 61,000,00010,000,000 Autobahn Funding Company LLC††(p)^ 0.14 03/02/2010 9,999,925
6,000,000 Autobahn Funding Company LLC††(p)^ 0.24 03/30/2010 5,998,7927,000,000 Autobahn Funding Company LLC††(p)^ 0.26 04/05/2010 6,998,1636,804,151 Bank of America NA^ 0.25 03/02/2010 6,804,057
24,066,032 Bank of America NA^ 0.18 03/10/2010 24,064,829153,000,000 Bank of Nova Scotia^ 0.18 04/14/2010 152,966,340124,750,000 Barclays US Funding LLC^ 0.00 03/01/2010 124,750,000
19,000,000 Barton Capital Corporation††(p)^ 0.17 04/06/2010 18,996,77019,000,000 Barton Capital Corporation††(p)^ 0.19 04/16/2010 18,995,387
5,000,000 Beethoven Funding Corporation††(p)^ 0.15 03/02/2010 4,999,95817,000,000 Beethoven Funding Corporation††(p)^ 0.20 03/03/2010 16,999,717

60 Wells Fargo Advantage Money Market Funds Portfolio of Investments—February 28, 2010
HERITAGE MONEY MARKET FUND
Principal Security Name Interest Rate Maturity Date Value
Commercial Paper (continued)$ 6,000,000 Beethoven Funding Corporation††(p)^ 0.23% 03/04/2010 $ 5,999,850
38,000,000 Beethoven Funding Corporation††(p)^ 0.24 03/05/2010 37,998,73334,000,000 Belmont Funding LLC††(p)^ 0.23 03/03/2010 33,999,339
107,000,000 BGL BNP Paribas SA^ 0.23 04/14/2010 106,969,92111,000,000 BGL BNP Paribas SA^ 0.23 04/21/2010 10,996,41695,000,000 BNZ International Funding††^ 0.20 03/04/2010 94,997,94246,000,000 BNZ International Funding††^ 0.29 04/09/2010 45,985,050
234,000,000 BPCE SA††^ 0.24 03/30/2010 233,952,87572,000,000 BPCE SA††^ 0.24 04/06/2010 71,982,00030,000,000 BPCE SA††^ 0.24 05/13/2010 29,985,096
8,000,000 CAFCO LLC††(p)^ 0.17 03/22/2010 7,999,16076,000,000 CAFCO LLC††(p)^ 0.20 05/03/2010 75,973,40038,750,000 CAFCO LLC††(p)^ 0.20 05/05/2010 38,736,00710,000,000 Cancara Asset Securitisation LLC††(p)^ 0.18 03/08/2010 9,999,61163,000,000 Cancara Asset Securitisation LLC††(p)^ 0.18 03/11/2010 62,996,50016,000,000 Cancara Asset Securitisation LLC††(p)^ 0.19 03/15/2010 15,998,75613,750,000 Cancara Asset Securitisation LLC††(p)^ 0.19 03/22/2010 13,748,39621,000,000 Cancara Asset Securitisation LLC††(p)^ 0.19 03/23/2010 20,997,43318,000,000 Cancara Asset Securitisation LLC††(p)^ 0.21 04/07/2010 17,995,93019,000,000 Cancara Asset Securitisation LLC††(p)^ 0.22 03/19/2010 18,997,81596,000,000 Cancara Asset Securitisation LLC††(p)^ 0.22 03/30/2010 95,982,213
6,000,000 Cancara Asset Securitisation LLC††(p)^ 0.22 05/11/2010 5,997,39763,000,000 Cancara Asset Securitisation LLC††(p)^ 0.22 05/12/2010 62,972,280
100,000,000 Cancara Asset Securitisation LLC††(p)^ 0.22 05/17/2010 99,952,9444,000,000 Cancara Asset Securitisation LLC††(p)^ 0.22 05/18/2010 3,998,093
25,000,000 Cancara Asset Securitisation LLC††(p)^ 0.22 05/20/2010 24,987,77833,000,000 Cancara Asset Securitisation LLC††(p)^ 0.23 04/05/2010 32,992,30071,500,000 Cancara Asset Securitisation LLC††(p)^ 0.23 04/19/2010 71,477,61737,000,000 Cancara Asset Securitisation LLC††(p)^ 0.26 03/12/2010 36,996,83456,000,000 Cancara Asset Securitization LLC††(p)^ 0.23 03/10/2010 55,996,36045,000,000 Charta LLC††(p)^ 0.19 04/07/2010 44,990,75032,000,000 Charta LLC††(p)^ 0.19 04/19/2010 31,991,72428,000,000 Charta LLC††(p)^ 0.20 04/12/2010 27,993,46739,000,000 Charta LLC††(p)^ 0.20 04/13/2010 38,990,68376,750,000 Charta LLC††(p)^ 0.20 05/03/2010 76,723,13825,000,000 Charta LLC††(p)^ 0.20 05/06/2010 24,990,83363,000,000 Charta LLC††(p)^ 0.20 05/12/2010 62,974,80090,500,000 Charta LLC††(p)^ 0.21 03/17/2010 90,491,15120,000,000 Charta LLC††(p)^ 0.20 03/09/2010 19,998,93345,000,000 Ciesco LLC††(p)^ 0.19 04/05/2010 44,991,25045,000,000 Ciesco LLC††(p)^ 0.19 04/13/2010 44,989,78838,400,000 Ciesco LLC††(p)^ 0.20 05/03/2010 38,386,56035,700,000 Ciesco LLC††(p)^ 0.20 05/04/2010 35,687,30738,750,000 Ciesco LLC††(p)^ 0.20 05/05/2010 38,736,007
229,000,000 Citibank Credit Card Issuance Trust††(p)^ 0.16 03/05/2010 228,994,927168,274,000 Citibank Credit Card Issuance Trust††(p)^ 0.18 03/08/2010 168,267,251
16,000,000 Citibank Credit Card Issuance Trust††(p)^ 0.20 04/05/2010 15,996,73344,000,000 Citibank Credit Card Issuance Trust††(p)^ 0.00 03/01/2010 44,000,00020,000,000 Citibank Credit Card Issuance Trust††(p)^ 0.12 03/02/2010 19,999,86199,000,000 Citibank Credit Card Issuance Trust††(p)^ 0.16 03/04/2010 98,997,938
110,000,000 Clipper Receivables Company LLC††(p)^ 0.22 04/23/2010 109,964,37236,500,000 Clipper Receivables Company LLC††(p)^ 0.24 03/25/2010 36,494,16066,000,000 Commonwealth Bank of Australia††^ 0.20 05/10/2010 65,974,33328,000,000 Concord Minutemen Capital Company††(p)^ 0.00 03/01/2010 28,000,00075,000,000 Concord Minutemen Capital Company††(p)^ 0.44 04/15/2010 74,957,81311,000,000 Concord Minutemen Capital Company††(p)^ 0.44 04/21/2010 10,992,988

Portfolio of Investments—February 28, 2010 Wells Fargo Advantage Money Market Funds 61
HERITAGE MONEY MARKET FUND
Principal Security Name Interest Rate Maturity Date Value
Commercial Paper (continued)38,000,000 Concord Minutemen Capital Company††(p)^ 0.44% 05/05/2010 $ 37,969,12565,000,000 Concord Minutemen Capital Company††(p)^ 0.33 03/03/2010 64,998,19437,000,000 CRC Funding LLC††(p)^ 0.19 04/14/2010 36,991,40811,000,000 CRC Funding LLC††(p)^ 0.19 04/15/2010 10,997,38824,750,000 CRC Funding LLC††(p)^ 0.19 04/16/2010 24,743,991
2,000,000 CRC Funding LLC††(p)^ 0.19 04/27/2010 1,999,39843,000,000 CRC Funding LLC††(p)^ 0.20 04/09/2010 42,990,68370,000,000 CRC Funding LLC††(p)^ 0.20 04/28/2010 69,977,44469,000,000 CRC Funding LLC††(p)^ 0.20 05/03/2010 68,975,85054,000,000 CRC Funding LLC††(p)^ 0.20 04/13/2010 53,987,100
110,000,000 Crown Point Capital Company††(p)^ 0.44 04/09/2010 109,946,37519,000,000 Crown Point Capital Company††(p)^ 0.44 04/13/2010 18,989,788
116,700,000 Crown Point Capital Company††(p)^ 0.44 04/15/2010 116,634,35644,000,000 Crown Point Capital Company††(p)^ 0.44 04/21/2010 43,971,95010,000,000 Crown Point Capital Company††(p)^ 0.44 04/27/2010 9,992,87512,000,000 Crown Point Capital Company††(p)^ 0.44 05/05/2010 11,990,250
155,000,000 Crown Point Capital Company††(p)^ 0.44 05/06/2010 154,872,1255,000,000 Crown Point Capital Company††(p)^ 0.45 05/19/2010 4,995,063
13,000,000 Crown Point Capital Company††(p)^ 0.45 05/21/2010 12,986,83894,000,000 Danske Corporation††^ 0.19 03/29/2010 93,985,37839,000,000 Danske Corporation††^ 0.19 04/07/2010 38,991,98369,000,000 Dexia Delaware^ 0.14 03/02/2010 68,999,463
151,000,000 Dexia Delaware^ 0.17 03/04/2010 150,997,23290,000,000 Dexia Delaware^ 0.25 03/10/2010 89,993,70086,000,000 Dexia Delaware^ 0.26 03/12/2010 85,992,51147,000,000 DnB Nor Bank ASA††^ 0.27 05/25/2010 46,970,03867,000,000 DnB Nor Bank ASA††^ 0.27 05/28/2010 66,955,78074,000,000 Ebbets Funding LLC††(p)^ 0.48 03/23/2010 73,977,38935,000,000 Ebbets Funding LLC††(p)^ 0.48 03/25/2010 34,988,33333,000,000 Ebbets Funding LLC††(p)^ 0.48 03/26/2010 32,988,54222,000,000 Elysian Funding LLC††(p)^ 0.36 03/05/2010 21,998,90031,000,000 Elysian Funding LLC††(p)^ 0.40 03/09/2010 30,996,90016,000,000 Elysian Funding LLC††(p)^ 0.43 03/19/2010 15,996,40020,000,000 ENI Coordination Center SA††^ 0.12 03/03/2010 19,999,80019,628,000 Enterprise Funding LLC††(p)^ 0.17 03/18/2010 19,626,33217,020,000 Enterprise Funding LLC††(p)^ 0.19 04/21/2010 17,015,419
119,137,000 Enterprise Funding LLC††(p)^ 0.21 03/25/2010 119,119,52724,036,000 Enterprise Funding LLC††(p)^ 0.22 04/12/2010 24,029,83118,500,000 Erasmus Capital Corporation††(p)^ 0.00 03/01/2010 18,500,00019,000,000 Erasmus Capital Corporation††(p)^ 0.14 03/04/2010 18,999,69932,000,000 Erasmus Capital Corporation††(p)^ 0.15 03/05/2010 31,999,32423,000,000 Erasmus Capital Corporation††(p)^ 0.17 03/10/2010 22,998,90810,000,000 Erasmus Capital Corporation††(p)^ 0.21 03/25/2010 9,998,53348,000,000 Erasmus Capital Corporation††(p)^ 0.22 04/09/2010 47,988,04042,000,000 Fairway Finance Corporation††(p)^ 0.15 03/11/2010 41,998,01723,000,000 Fairway Finance Corporation††(p)^ 0.19 04/05/2010 22,995,52831,000,000 GDF Suez††^ 0.17 03/19/2010 30,997,21043,000,000 GDF Suez††^ 0.17 03/22/2010 42,995,48524,000,000 GDF Suez††^ 0.17 03/23/2010 23,997,36022,000,000 Gemini Securitization Corporation LLC††(p)^ 0.18 04/19/2010 21,994,44710,000,000 Gemini Securitization Corporation LLC††(p)^ 0.18 04/26/2010 9,997,20074,000,000 Gemini Securitization Corporation LLC††(p)^ 0.19 04/29/2010 73,976,35115,000,000 Gotham Funding Corporation††(p)^ 0.11 03/03/2010 14,999,85834,000,000 Gotham Funding Corporation††(p)^ 0.17 03/23/2010 33,996,26076,000,000 Gotham Funding Corporation††(p)^ 0.17 03/24/2010 75,991,26050,000,000 Govco LLC††(p)^ 0.17 03/04/2010 49,999,083

62 Wells Fargo Advantage Money Market Funds Portfolio of Investments—February 28, 2010
Commercial Paper (continued)$ 27,000,000 Govco LLC††(p)^ 0.19% 04/12/2010 $ 26,994,015
4,400,000 Govco LLC††(p)^ 0.20 04/15/2010 4,398,9008,000,000 Govco LLC††(p)^ 0.20 04/21/2010 7,997,733
10,000,000 Govco LLC††(p)^ 0.20 04/26/2010 9,996,88919,000,000 Govco LLC††(p)^ 0.20 04/27/2010 18,993,98325,000,000 Govco LLC††(p)^ 0.20 04/28/2010 24,991,94474,000,000 Govco LLC††(p)^ 0.20 05/11/2010 73,970,81156,000,000 Govco LLC††(p)^ 0.22 03/24/2010 55,991,77135,000,000 Govco LLC††(p)^ 0.24 03/16/2010 34,996,50090,650,000 Govco LLC††(p)^ 0.00 03/01/2010 90,650,00066,000,000 Grampian Funding††(p)^ 0.21 03/19/2010 65,992,74014,750,000 Grampian Funding††(p)^ 0.24 03/22/2010 14,747,84945,000,000 Grampian Funding††(p)^ 0.26 04/23/2010 44,982,77510,000,000 Grampian Funding††(p)^ 0.26 05/04/2010 9,995,37816,000,000 Grampian Funding††(p)^ 0.26 05/07/2010 15,992,25846,000,000 Grampian Funding††(p)^ 0.26 05/20/2010 45,973,42246,000,000 Grampian Funding††(p)^ 0.26 05/21/2010 45,973,09075,000,000 Grampian Funding††(p)^ 0.28 04/15/2010 74,972,81320,000,000 Grampian Funding††(p)^ 0.29 04/01/2010 19,994,83391,000,000 Grampian Funding††(p)^ 0.30 04/08/2010 90,970,53918,000,000 Grampian Funding††(p)^ 0.31 03/17/2010 17,997,520
5,000,000 Grampian Funding††(p)^ 0.23 03/04/2010 4,999,87134,750,000 Groupe BPCE††^ 0.00 03/01/2010 34,750,00051,000,000 ICICI Bank Limited (Bahrain)^ 0.23 03/15/2010 50,995,04225,000,000 ICICI Bank Limited (Bahrain)^ 0.50 07/15/2010 24,952,77825,000,000 ICICI Bank Limited (Bahrain)^ 0.50 07/15/2010 24,952,77856,000,000 ICICI Bank Limited (Bahrain)^ 0.50 08/05/2010 55,877,88934,000,000 ICICI Bank Limited (Bahrain)^ 0.55 06/24/2010 33,940,26415,900,000 ICICI Bank Limited (Bahrain)^ 0.71 03/09/2010 15,897,17395,000,000 ING USA Funding LLC^ 0.16 03/12/2010 94,995,06533,000,000 ING USA Funding LLC^ 0.16 03/16/2010 32,997,66329,000,000 ING USA Funding LLC^ 0.24 03/19/2010 28,996,37585,000,000 Intesa Funding LLC^ 0.15 03/11/2010 84,996,22217,000,000 Kitty Hawk Funding Corporation††(p)^ 0.19 05/05/2010 16,994,16848,000,000 Kitty Hawk Funding Corporation††(p)^ 0.21 05/24/2010 47,976,480
155,700,000 Kitty Hawk Funding Corporation††(p)^ 0.24 03/19/2010 155,680,53766,300,000 Legacy Capital LLC††(p)^ 0.44 04/13/2010 66,264,364
192,000,000 Lexington Parker Capital††(p)^ 0.44 04/16/2010 191,889,60016,000,000 Lexington Parker Capital††(p)^ 0.44 04/21/2010 15,989,80026,000,000 Lexington Parker Capital††(p)^ 0.44 05/05/2010 25,978,87539,000,000 Lexington Parker Capital††(p)^ 0.44 05/07/2010 38,967,33821,000,000 Lexington Parker Capital††(p)^ 0.50 03/19/2010 20,994,75060,000,000 Lexington Parker Capital††(p)^ 0.40 03/05/2010 59,996,66754,000,000 Liberty Street Funding LLC††(p)^ 0.00 03/01/2010 54,000,00028,000,000 Liberty Street Funding LLC††(p)^ 0.19 04/12/2010 27,993,79336,000,000 Liberty Street Funding LLC††(p)^ 0.19 05/04/2010 35,987,84047,000,000 LMA Americas LLC††(p)^ 0.14 03/05/2010 46,999,11244,000,000 LMA Americas LLC††(p)^ 0.17 03/22/2010 43,995,38025,000,000 LMA Americas LLC††(p)^ 0.17 03/23/2010 24,997,25048,000,000 LMA Americas LLC††(p)^ 0.19 04/14/2010 47,988,85326,300,000 LMA Americas LLC††(p)^ 0.20 03/15/2010 26,297,85227,000,000 Los Angeles CA Department of Airports^ 0.25 05/03/2010 26,988,188
3,250,000 Louis Dreyfus Corporation^ 0.00 03/01/2010 3,250,00029,000,000 Louis Dreyfus Corporation^ 0.00 03/01/2010 29,000,000
4,000,000 Louis Dreyfus Corporation^ 0.00 03/01/2010 4,000,00012,000,000 Louis Dreyfus Corporation^ 0.28 03/19/2010 11,998,200
HERITAGE MONEY MARKET FUND
Principal Security Name Interest Rate Maturity Date Value

Portfolio of Investments—February 28, 2010 Wells Fargo Advantage Money Market Funds 63
Commercial Paper (continued)$ 8,000,000 Louis Dreyfus Corporation^ 0.28% 03/19/2010 $ 7,998,800
7,000,000 Louis Dreyfus Corporation^ 0.31 04/09/2010 6,997,5738,000,000 Louis Dreyfus Corporation^ 0.31 04/16/2010 7,996,729
25,000,000 Louis Dreyfus Corporation^ 0.31 04/16/2010 24,989,77812,000,000 Market Street Funding LLC††(p)^ 0.15 03/05/2010 11,999,74717,000,000 Market Street Funding LLC††(p)^ 0.19 03/18/2010 16,998,47576,094,000 Matchpoint Master Trust††(p)^ 0.19 04/06/2010 76,078,78126,000,000 Mont Blanc Capital Corporation††(p)^ 0.15 03/09/2010 25,999,01818,000,000 Mont Blanc Capital Corporation††(p)^ 0.17 03/25/2010 17,997,84038,900,000 Mont Blanc Capital Corporation††(p)^ 0.18 03/12/2010 38,897,622
6,000,000 Mont Blanc Capital Corporation††(p)^ 0.18 03/16/2010 5,999,52531,000,000 Mont Blanc Capital Corporation††(p)^ 0.20 05/12/2010 30,987,60020,000,000 National Bank of Canada^ 0.20 05/12/2010 19,992,00038,500,000 Nationwide Building Society††^ 0.20 04/15/2010 38,490,375
120,000,000 Nationwide Building Society††^ 0.20 04/16/2010 119,969,333111,000,000 Nationwide Building Society††^ 0.43 05/27/2010 110,884,653189,000,000 Nationwide Building Society††^ 0.48 03/22/2010 188,943,300
25,000,000 Nationwide Building Society††^ 0.39 04/05/2010 24,990,27817,600,000 Nationwide Building Society††^ 0.50 05/06/2010 17,583,54495,000,000 Natixis US Finance Company^ 0.26 04/13/2010 94,969,930
158,000,000 Natixis US Finance Company^ 0.28 05/06/2010 157,918,89344,000,000 Natixis US Finance Company^ 0.15 03/02/2010 43,999,63317,000,000 Newport Funding Corporation††(p)^ 0.17 03/23/2010 16,998,13035,000,000 Newport Funding Corporation††(p)^ 0.18 03/26/2010 34,995,382
5,000,000 Nieuw Amsterdam Receivables Corporation††(p)^ 0.16 03/05/2010 4,999,88951,000,000 Nieuw Amsterdam Receivables Corporation††(p)^ 0.19 03/18/2010 50,995,18315,000,000 Nieuw Amsterdam Receivables Corporation††(p)^ 0.20 04/14/2010 14,996,33350,000,000 Nieuw Amsterdam Receivables Corporation††(p)^ 0.21 04/15/2010 49,986,87561,600,000 Nordea North America Incorporated^ 0.16 03/17/2010 61,595,34619,000,000 Oakland-Alameda County± 0.20 03/02/2010 19,000,00094,000,000 Prudential plc††^ 0.23 05/12/2010 93,956,76016,000,000 Prudential plc††^ 0.30 03/24/2010 15,996,93316,000,000 Prudential plc††^ 0.00 03/01/2010 16,000,000
7,020,000 Ranger Funding Company LLC††(p)^ 0.20 05/03/2010 7,017,54327,000,000 Ranger Funding Company LLC††(p)^ 0.20 05/13/2010 26,989,05040,000,000 Ranger Funding Company LLC††(p)^ 0.22 04/21/2010 39,987,53387,084,000 Ranger Funding Company LLC††(p)^ 0.24 03/19/2010 87,073,11450,380,000 Regency Markets #1 LLC††(p)^ 0.13 03/05/2010 50,379,104
7,000,000 Regency Markets #1 LLC††(p)^ 0.16 03/08/2010 6,999,75582,000,000 Regency Markets #1 LLC††(p)^ 0.17 03/22/2010 81,991,390
6,000,000 Regency Markets #1 LLC††(p)^ 0.17 03/24/2010 5,999,31019,000,000 Rhein-Main Security Limited††(p)^ 0.18 03/05/2010 18,999,53658,000,000 Rhein-Main Security Limited††(p)^ 0.18 03/26/2010 57,992,34710,000,000 Rhein-Main Security Limited††(p)^ 0.23 03/29/2010 9,998,13314,000,000 Rheingold Securitization††(p)^ 0.23 04/20/2010 13,995,52826,000,000 Rheingold Securitization††(p)^ 0.24 03/29/2010 25,995,03037,000,000 Rheingold Securitization††(p)^ 0.24 04/12/2010 36,989,208
4,000,000 Rheingold Securitization††(p)^ 0.27 05/17/2010 3,997,69011,000,000 Rheingold Securitization††^(p) 0.29 03/31/2010 10,997,250
104,500,000 Rheingold Securitization††^(p) 0.31 03/31/2010 104,473,0042,000,000 Romulus Funding Corporation††(p)^ 0.15 03/04/2010 1,999,967
25,000,000 Romulus Funding Corporation††(p)^ 0.25 03/05/2010 24,999,13916,000,000 Romulus Funding Corporation††(p)^ 0.25 03/15/2010 15,998,320
5,000,000 Romulus Funding Corporation††(p)^ 0.26 03/25/2010 4,999,10012,000,000 Romulus Funding Corporation††(p)^ 0.29 03/09/2010 11,999,120
HERITAGE MONEY MARKET FUND
Principal Security Name Interest Rate Maturity Date Value

64 Wells Fargo Advantage Money Market Funds Portfolio of Investments—February 28, 2010
Commercial Paper (continued)$ 12,000,000 Romulus Funding Corporation††(p)^ 0.29% 03/26/2010 $ 11,997,500
19,000,000 Romulus Funding Corporation††(p)^ 0.29 03/30/2010 18,995,40861,000,000 Royal KPN NV(p)± 0.19 04/06/2010 60,988,41031,000,000 Royal KPN NV††(p)± 0.20 04/14/2010 30,992,42273,000,000 Royal KPN NV††(p)± 0.21 03/23/2010 72,990,63253,000,000 Royal KPN NV(p)± 0.22 05/11/2010 52,977,004
172,750,000 Royal Park Investment Funding Corporation††(p)± 0.21 03/25/2010 172,725,81517,000,000 Salisbury Receivables Company LLC††(p)^ 0.16 03/16/2010 16,998,79619,000,000 Salisbury Receivables Company LLC††(p)^ 0.17 03/18/2010 18,998,38551,700,000 Salisbury Receivables Company LLC††(p)^ 0.18 04/13/2010 51,688,88510,000,000 Salisbury Receivables Company LLC††(p)^ 0.20 05/03/2010 9,996,50023,091,000 San Jose City CA International Airport± 0.28 03/11/2010 23,091,00020,860,000 San Jose City CA International Airport± 0.28 03/11/2010 20,860,00080,000,000 Santander Central Hispano Finance (Delaware) Incorporated^ 0.60 06/15/2010 79,858,66734,000,000 Scaldis Capital LLC††(p)^ 0.16 03/08/2010 33,998,81027,000,000 Scaldis Capital LLC††(p)^ 0.21 03/23/2010 26,996,37043,000,000 Scaldis Capital LLC††(p)^ 0.22 04/09/2010 42,989,28627,000,000 Scaldis Capital LLC††(p)^ 0.22 04/12/2010 26,992,75551,250,000 Scaldis Capital LLC††(p)^ 0.22 04/13/2010 51,236,53338,000,000 Scaldis Capital LLC††(p)^ 0.22 04/15/2010 37,989,55037,000,000 Scaldis Capital LLC††(p)^ 0.22 04/19/2010 36,988,92111,000,000 Scaldis Capital LLC††(p)^ 0.22 04/22/2010 10,996,50426,000,000 Scaldis Capital LLC††(p)^ 0.22 04/28/2010 25,990,78422,000,000 Scaldis Capital LLC††(p)^ 0.22 04/29/2010 21,992,068
109,000,000 Scaldis Capital LLC††(p)^ 0.22 05/05/2010 108,956,70233,000,000 Scaldis Capital LLC††(p)^ 0.23 04/27/2010 32,987,98365,000,000 Scaldis Capital LLC††(p)^ 0.23 05/11/2010 64,970,51559,000,000 Scaldis Capital LLC††(p)^ 0.23 05/12/2010 58,972,860
8,000,000 Sheffield Receivables Corporation††(p)^ 0.18 04/08/2010 7,998,48037,000,000 Sheffield Receivables Corporation††(p)^ 0.19 04/13/2010 36,991,603
5,000,000 Sheffield Receivables Corporation††(p)^ 0.19 04/19/2010 4,998,70732,000,000 Sheffield Receivables Corporation††(p)^ 0.19 04/23/2010 31,991,04935,400,000 Sheffield Receivables Corporation††(p)^ 0.19 04/28/2010 35,389,16430,000,000 Sheffield Receivables Corporation††(p)^ 0.19 04/29/2010 29,990,65838,000,000 Sheffield Receivables Corporation††(p)^ 0.20 05/06/2010 37,986,06623,000,000 Sheffield Receivables Corporation††(p)^ 0.21 06/03/2010 22,987,388
153,000,000 Societe de Prise Participation de l’Etat††^ 0.19 05/11/2010 152,942,6687,000,000 Societe de Prise Participation de l’Etat††^ 0.20 05/18/2010 6,996,891
129,000,000 Societe de Prise Participation de l’Etat††^ 0.21 06/18/2010 128,917,9789,000,000 Societe Financement de L’economie Francaise^ 0.13 03/04/2010 8,999,873
121,000,000 Societe Financement de L’economie Francaise^ 0.23 04/07/2010 120,970,153164,000,000 Societe Financement de L’economie Francaise^ 0.25 04/07/2010 163,958,704
51,000,000 Solitaire Funding LLC††(p)^ 0.20 03/25/2010 50,992,860104,000,000 Solitaire Funding LLC††(p)^ 0.20 03/26/2010 103,984,833
78,000,000 Solitaire Funding LLC††(p)^ 0.23 04/06/2010 77,981,28024,000,000 Solitaire Funding LLC††(p)^ 0.23 04/08/2010 23,993,920
103,000,000 Solitaire Funding LLC††(p)^ 0.23 04/20/2010 102,967,09729,500,000 Solitaire Funding LLC††(p)^ 0.24 04/22/2010 29,489,774
9,000,000 Solitaire Funding LLC††(p)^ 0.25 05/20/2010 8,995,00027,000,000 Solitaire Funding LLC††(p)^ 0.31 03/19/2010 26,995,54521,000,000 Starbird Funding Corporation††(p)^ 0.20 04/09/2010 20,995,45034,000,000 Sumitomo Trust & Banking Company^ 0.13 03/03/2010 33,999,62211,000,000 Surrey Funding Corporation††(p)^ 0.19 04/12/2010 10,997,56231,000,000 Surrey Funding Corporation††(p)^ 0.19 04/13/2010 30,992,96520,000,000 Surrey Funding Corporation††(p)^ 0.20 04/21/2010 19,994,33343,000,000 Surrey Funding Corporation††(p)^ 0.20 04/26/2010 42,986,622
HERITAGE MONEY MARKET FUND
Principal Security Name Interest Rate Maturity Date Value

Portfolio of Investments—February 28, 2010 Wells Fargo Advantage Money Market Funds 65
Commercial Paper (continued)$ 18,000,000 Surrey Funding Corporation††(p)^ 0.20% 05/05/2010 $ 17,993,500
112,000,000 Svenska Handelsbanken Incorporated^ 0.20 04/08/2010 111,976,9476,000,000 Tasman Funding Incorporated††(p)^ 0.20 03/26/2010 5,999,125
10,000,000 Tasman Funding Incorporated††(p)^ 0.23 03/12/2010 9,999,23676,000,000 Tasman Funding Incorporated††(p)^ 0.24 04/14/2010 75,977,63313,000,000 Tasman Funding Incorporated††(p)^ 0.25 04/12/2010 12,996,05720,000,000 Thames Asset Global Securitization # 1 Incorporated††(p)^ 0.19 04/08/2010 19,995,98915,276,000 Thames Asset Global Securitization # 1 Incorporated††(p)^ 0.17 03/22/2010 15,274,39627,000,000 Thames Asset Global Securitization # 1 Incorporated††(p)^ 0.19 04/19/2010 26,993,018
9,000,000 Thames Asset Global Securitization # 1 Incorporated††(p)^ 0.19 04/26/2010 8,997,34023,238,000 Thames Asset Global Securitization # 1 Incorporated††(p)^ 0.23 03/12/2010 23,236,36718,463,000 Thames Asset Global Securitization # 1 Incorporated††(p)^ 0.23 03/18/2010 18,460,99536,873,000 Thames Asset Global Securitization # 1 Incorporated††(p)^ 0.25 06/07/2010 36,847,90610,000,000 Thames Asset Global Securitization #1 Incorporated††(p)^ 0.17 03/24/2010 9,998,85015,000,000 Thames Asset Global Securitization #1 Incorporated††(p)^ 0.19 04/07/2010 14,996,91741,000,000 Thames Asset Global Securitization #1 Incorporated††(p)^ 0.20 04/09/2010 40,991,11738,853,000 Thames Asset Global Securitization #1Incorporated††(p)^ 0.23 03/15/2010 38,849,52517,000,000 Ticonderoga Funding LLC††(p)^ 0.09 03/02/2010 16,999,91731,000,000 Ticonderoga Funding LLC††(p)^ 0.19 04/26/2010 30,990,83824,000,000 Toyota Financial Services de Puerto Rico Incorporated^ 0.20 03/10/2010 23,998,68024,000,000 Toyota Financial Services de Puerto Rico Incorporated^ 0.20 03/11/2010 23,998,53337,700,000 Toyota Motor Credit Corporation^ 0.19 04/21/2010 37,689,85225,000,000 Toyota Motor Credit Corporation^ 0.19 04/22/2010 24,993,13920,000,000 Toyota Motor Credit Corporation^ 0.21 04/26/2010 19,993,467
103,000,000 Toyota Motor Credit Corporation^ 0.23 05/05/2010 102,957,22681,000,000 Toyota Motor Credit Corporation^ 0.24 03/29/2010 80,984,25024,000,000 Toyota Motor Credit Corporation^ 0.20 03/12/2010 23,998,38720,000,000 Tulip Funding Corporation††(p)^ 0.15 03/10/2010 19,999,150
107,684,000 Tulip Funding Corporation††(p)^ 0.19 04/08/2010 107,662,10037,000,000 Tulip Funding Corporation††(p)^ 0.20 04/09/2010 36,991,98387,100,000 UBS Finance Delaware LLC^ 0.26 04/05/2010 87,077,13668,000,000 Unicredit Delaware Incorporated††^ 0.20 03/15/2010 67,994,447
109,000,000 Unicredit Delaware Incorporated††^ 0.19 03/03/2010 108,998,244130,000,000 Unicredit Delaware Incorporated††^ 0.29 03/11/2010 129,988,444118,000,000 UniCredito Italiano Bank Ireland††^ 0.29 04/06/2010 117,964,600
4,000,000 Versailles Commercial Paper LLC††(p)^ 0.18 03/23/2010 3,999,53658,000,000 Versailles Commercial Paper LLC††(p)^ 0.35 03/12/2010 57,993,79760,000,000 Versailles Commercial Paper LLC††(p)^ 0.35 03/24/2010 59,986,20026,000,000 Versailles Commercial Paper LLC††(p)^ 0.35 03/19/2010 25,995,45028,000,000 Versailles Commercial Paper LLC††(p)^ 0.28 03/05/2010 27,998,91185,000,000 Victory Receivables Corporation††(p)^ 0.13 03/04/2010 84,998,79626,000,000 Victory Receivables Corporation††(p)^ 0.14 03/08/2010 25,999,19136,000,000 Victory Receivables Corporation††(p)^ 0.14 03/09/2010 35,998,72077,000,000 Westpac Securities NZ Limited±†† 0.30 08/20/2010 77,000,000
125,000,000 Westpac Securities NZ Limited±†† 0.35 11/05/2010 125,000,00024,250,000 Windmill Funding Corporation††(p)^ 0.09 03/02/2010 24,249,885
9,000,000 Windmill Funding Corporation††(p)^ 0.15 03/17/2010 8,999,36023,000,000 Windmill Funding Corporation††(p)^ 0.16 03/18/2010 22,998,15438,000,000 Windmill Funding Corporation††(p)^ 0.18 04/07/2010 37,992,97029,000,000 Yorktown Capital LLC††(p)^ 0.20 05/10/2010 28,988,72272,000,000 Yorktown Capital LLC††(p)^ 0.20 05/17/2010 71,969,20011,000,000 Yorktown Capital LLC††(p)^ 0.22 04/12/2010 10,997,17737,000,000 Yorktown Capital LLC††(p)^ 0.23 04/20/2010 36,988,18160,400,000 Yorktown Capital LLC††(p)^ 0.24 03/19/2010 60,392,450
Total Commercial Paper (Cost $18,297,959,511) 18,297,959,511
HERITAGE MONEY MARKET FUND
Principal Security Name Interest Rate Maturity Date Value
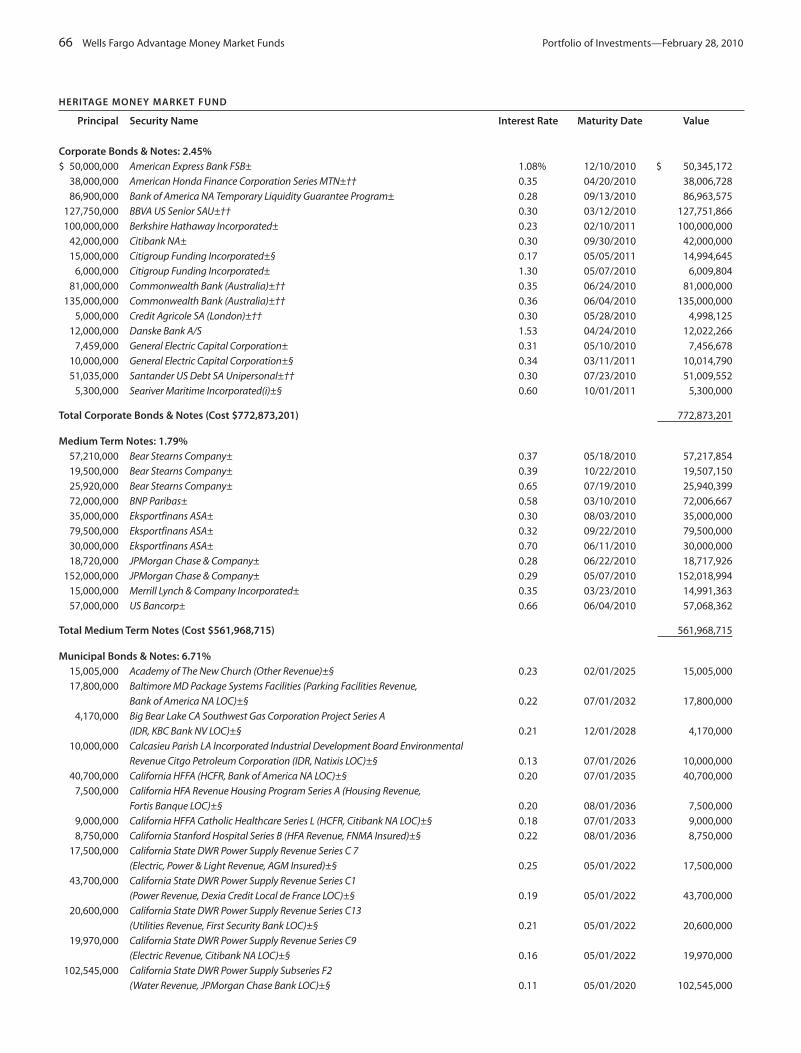
66 Wells Fargo Advantage Money Market Funds Portfolio of Investments—February 28, 2010
Corporate Bonds & Notes: 2.45%$ 50,000,000 American Express Bank FSB± 1.08% 12/10/2010 $ 50,345,172
38,000,000 American Honda Finance Corporation Series MTN±†† 0.35 04/20/2010 38,006,72886,900,000 Bank of America NA Temporary Liquidity Guarantee Program± 0.28 09/13/2010 86,963,575
127,750,000 BBVA US Senior SAU±†† 0.30 03/12/2010 127,751,866100,000,000 Berkshire Hathaway Incorporated± 0.23 02/10/2011 100,000,000
42,000,000 Citibank NA± 0.30 09/30/2010 42,000,00015,000,000 Citigroup Funding Incorporated±§ 0.17 05/05/2011 14,994,645
6,000,000 Citigroup Funding Incorporated± 1.30 05/07/2010 6,009,80481,000,000 Commonwealth Bank (Australia)±†† 0.35 06/24/2010 81,000,000
135,000,000 Commonwealth Bank (Australia)±†† 0.36 06/04/2010 135,000,0005,000,000 Credit Agricole SA (London)±†† 0.30 05/28/2010 4,998,125
12,000,000 Danske Bank A/S 1.53 04/24/2010 12,022,2667,459,000 General Electric Capital Corporation± 0.31 05/10/2010 7,456,678
10,000,000 General Electric Capital Corporation±§ 0.34 03/11/2011 10,014,79051,035,000 Santander US Debt SA Unipersonal±†† 0.30 07/23/2010 51,009,552
5,300,000 Seariver Maritime Incorporated(i)±§ 0.60 10/01/2011 5,300,000
Total Corporate Bonds & Notes (Cost $772,873,201) 772,873,201
Medium Term Notes: 1.79%57,210,000 Bear Stearns Company± 0.37 05/18/2010 57,217,85419,500,000 Bear Stearns Company± 0.39 10/22/2010 19,507,15025,920,000 Bear Stearns Company± 0.65 07/19/2010 25,940,39972,000,000 BNP Paribas± 0.58 03/10/2010 72,006,66735,000,000 Eksportfinans ASA± 0.30 08/03/2010 35,000,00079,500,000 Eksportfinans ASA± 0.32 09/22/2010 79,500,00030,000,000 Eksportfinans ASA± 0.70 06/11/2010 30,000,00018,720,000 JPMorgan Chase & Company± 0.28 06/22/2010 18,717,926
152,000,000 JPMorgan Chase & Company± 0.29 05/07/2010 152,018,99415,000,000 Merrill Lynch & Company Incorporated± 0.35 03/23/2010 14,991,36357,000,000 US Bancorp± 0.66 06/04/2010 57,068,362
Total Medium Term Notes (Cost $561,968,715) 561,968,715
Municipal Bonds & Notes: 6.71%15,005,000 Academy of The New Church (Other Revenue)±§ 0.23 02/01/2025 15,005,00017,800,000 Baltimore MD Package Systems Facilities (Parking Facilities Revenue,
Bank of America NA LOC)±§ 0.22 07/01/2032 17,800,0004,170,000 Big Bear Lake CA Southwest Gas Corporation Project Series A
(IDR, KBC Bank NV LOC)±§ 0.21 12/01/2028 4,170,00010,000,000 Calcasieu Parish LA Incorporated Industrial Development Board Environmental
Revenue Citgo Petroleum Corporation (IDR, Natixis LOC)±§ 0.13 07/01/2026 10,000,00040,700,000 California HFFA (HCFR, Bank of America NA LOC)±§ 0.20 07/01/2035 40,700,000
7,500,000 California HFA Revenue Housing Program Series A (Housing Revenue, Fortis Banque LOC)±§ 0.20 08/01/2036 7,500,000
9,000,000 California HFFA Catholic Healthcare Series L (HCFR, Citibank NA LOC)±§ 0.18 07/01/2033 9,000,0008,750,000 California Stanford Hospital Series B (HFA Revenue, FNMA Insured)±§ 0.22 08/01/2036 8,750,000
17,500,000 California State DWR Power Supply Revenue Series C 7 (Electric, Power & Light Revenue, AGM Insured)±§ 0.25 05/01/2022 17,500,000
43,700,000 California State DWR Power Supply Revenue Series C1 (Power Revenue, Dexia Credit Local de France LOC)±§ 0.19 05/01/2022 43,700,000
20,600,000 California State DWR Power Supply Revenue Series C13 (Utilities Revenue, First Security Bank LOC)±§ 0.21 05/01/2022 20,600,000
19,970,000 California State DWR Power Supply Revenue Series C9 (Electric Revenue, Citibank NA LOC)±§ 0.16 05/01/2022 19,970,000
102,545,000 California State DWR Power Supply Subseries F2 (Water Revenue, JPMorgan Chase Bank LOC)±§ 0.11 05/01/2020 102,545,000
HERITAGE MONEY MARKET FUND
Principal Security Name Interest Rate Maturity Date Value
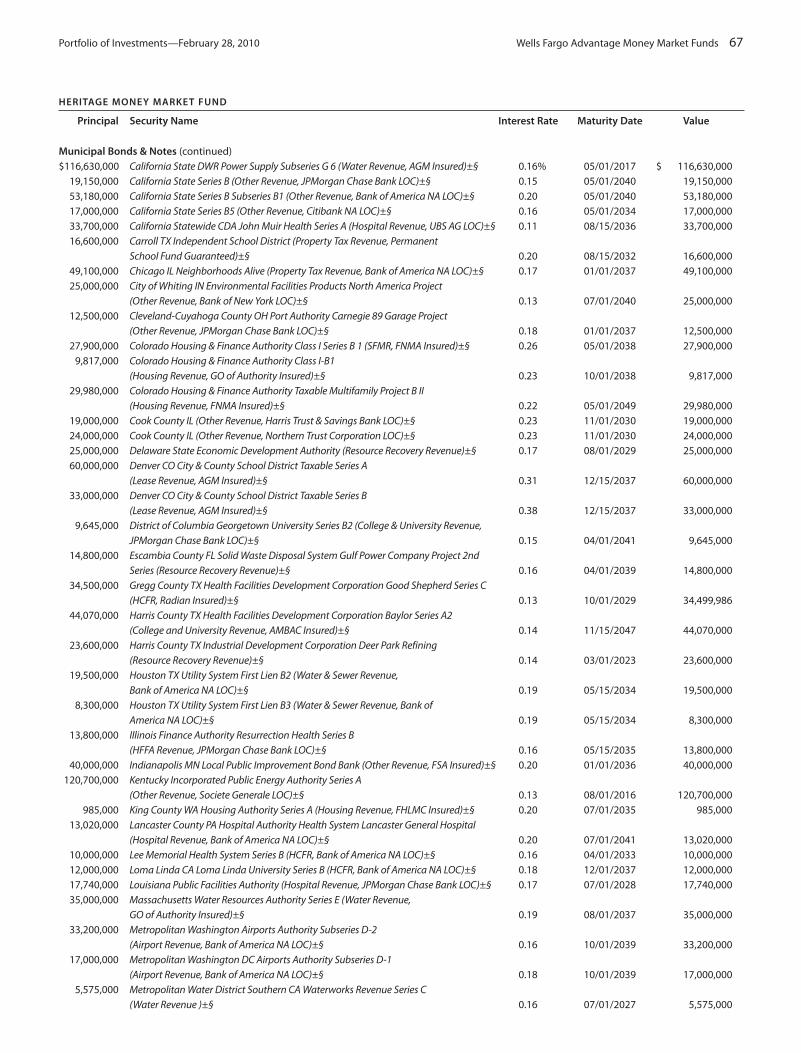
Portfolio of Investments—February 28, 2010 Wells Fargo Advantage Money Market Funds 67
Municipal Bonds & Notes (continued)$116,630,000 California State DWR Power Supply Subseries G 6 (Water Revenue, AGM Insured)±§ 0.16% 05/01/2017 $ 116,630,000
19,150,000 California State Series B (Other Revenue, JPMorgan Chase Bank LOC)±§ 0.15 05/01/2040 19,150,00053,180,000 California State Series B Subseries B1 (Other Revenue, Bank of America NA LOC)±§ 0.20 05/01/2040 53,180,00017,000,000 California State Series B5 (Other Revenue, Citibank NA LOC)±§ 0.16 05/01/2034 17,000,00033,700,000 California Statewide CDA John Muir Health Series A (Hospital Revenue, UBS AG LOC)±§ 0.11 08/15/2036 33,700,00016,600,000 Carroll TX Independent School District (Property Tax Revenue, Permanent
School Fund Guaranteed)±§ 0.20 08/15/2032 16,600,00049,100,000 Chicago IL Neighborhoods Alive (Property Tax Revenue, Bank of America NA LOC)±§ 0.17 01/01/2037 49,100,00025,000,000 City of Whiting IN Environmental Facilities Products North America Project
(Other Revenue, Bank of New York LOC)±§ 0.13 07/01/2040 25,000,00012,500,000 Cleveland-Cuyahoga County OH Port Authority Carnegie 89 Garage Project
(Other Revenue, JPMorgan Chase Bank LOC)±§ 0.18 01/01/2037 12,500,00027,900,000 Colorado Housing & Finance Authority Class I Series B 1 (SFMR, FNMA Insured)±§ 0.26 05/01/2038 27,900,000
9,817,000 Colorado Housing & Finance Authority Class I-B1 (Housing Revenue, GO of Authority Insured)±§ 0.23 10/01/2038 9,817,000
29,980,000 Colorado Housing & Finance Authority Taxable Multifamily Project B II (Housing Revenue, FNMA Insured)±§ 0.22 05/01/2049 29,980,000
19,000,000 Cook County IL (Other Revenue, Harris Trust & Savings Bank LOC)±§ 0.23 11/01/2030 19,000,00024,000,000 Cook County IL (Other Revenue, Northern Trust Corporation LOC)±§ 0.23 11/01/2030 24,000,00025,000,000 Delaware State Economic Development Authority (Resource Recovery Revenue)±§ 0.17 08/01/2029 25,000,00060,000,000 Denver CO City & County School District Taxable Series A
(Lease Revenue, AGM Insured)±§ 0.31 12/15/2037 60,000,00033,000,000 Denver CO City & County School District Taxable Series B
(Lease Revenue, AGM Insured)±§ 0.38 12/15/2037 33,000,0009,645,000 District of Columbia Georgetown University Series B2 (College & University Revenue,
JPMorgan Chase Bank LOC)±§ 0.15 04/01/2041 9,645,00014,800,000 Escambia County FL Solid Waste Disposal System Gulf Power Company Project 2nd
Series (Resource Recovery Revenue)±§ 0.16 04/01/2039 14,800,00034,500,000 Gregg County TX Health Facilities Development Corporation Good Shepherd Series C
(HCFR, Radian Insured)±§ 0.13 10/01/2029 34,499,98644,070,000 Harris County TX Health Facilities Development Corporation Baylor Series A2
(College and University Revenue, AMBAC Insured)±§ 0.14 11/15/2047 44,070,00023,600,000 Harris County TX Industrial Development Corporation Deer Park Refining
(Resource Recovery Revenue)±§ 0.14 03/01/2023 23,600,00019,500,000 Houston TX Utility System First Lien B2 (Water & Sewer Revenue,
Bank of America NA LOC)±§ 0.19 05/15/2034 19,500,0008,300,000 Houston TX Utility System First Lien B3 (Water & Sewer Revenue, Bank of
America NA LOC)±§ 0.19 05/15/2034 8,300,00013,800,000 Illinois Finance Authority Resurrection Health Series B
(HFFA Revenue, JPMorgan Chase Bank LOC)±§ 0.16 05/15/2035 13,800,00040,000,000 Indianapolis MN Local Public Improvement Bond Bank (Other Revenue, FSA Insured)±§ 0.20 01/01/2036 40,000,000
120,700,000 Kentucky Incorporated Public Energy Authority Series A (Other Revenue, Societe Generale LOC)±§ 0.13 08/01/2016 120,700,000
985,000 King County WA Housing Authority Series A (Housing Revenue, FHLMC Insured)±§ 0.20 07/01/2035 985,00013,020,000 Lancaster County PA Hospital Authority Health System Lancaster General Hospital
(Hospital Revenue, Bank of America NA LOC)±§ 0.20 07/01/2041 13,020,00010,000,000 Lee Memorial Health System Series B (HCFR, Bank of America NA LOC)±§ 0.16 04/01/2033 10,000,00012,000,000 Loma Linda CA Loma Linda University Series B (HCFR, Bank of America NA LOC)±§ 0.18 12/01/2037 12,000,00017,740,000 Louisiana Public Facilities Authority (Hospital Revenue, JPMorgan Chase Bank LOC)±§ 0.17 07/01/2028 17,740,00035,000,000 Massachusetts Water Resources Authority Series E (Water Revenue,
GO of Authority Insured)±§ 0.19 08/01/2037 35,000,00033,200,000 Metropolitan Washington Airports Authority Subseries D-2
(Airport Revenue, Bank of America NA LOC)±§ 0.16 10/01/2039 33,200,00017,000,000 Metropolitan Washington DC Airports Authority Subseries D-1
(Airport Revenue, Bank of America NA LOC)±§ 0.18 10/01/2039 17,000,0005,575,000 Metropolitan Water District Southern CA Waterworks Revenue Series C
(Water Revenue )±§ 0.16 07/01/2027 5,575,000
HERITAGE MONEY MARKET FUND
Principal Security Name Interest Rate Maturity Date Value

68 Wells Fargo Advantage Money Market Funds Portfolio of Investments—February 28, 2010
Municipal Bonds & Notes (continued)$ 13,500,000 Michigan State Strategic Fund Limited Taxable Waterfront Series A
(IDR, Deutsche Bank AG LOC)±§ 0.27% 03/01/2039 $ 13,500,0004,955,000 Minnesota State HFA Residential Housing Series E (Housing Revenue, GO of Authority)±§ 0.23 07/01/2038 4,955,0006,300,000 Minnesota State HFA Residential Housing Series T (Housing Revenue, GO of Authority)±§ 0.23 07/01/2048 6,300,000
37,995,000 Mississippi State Taxable Nissan Project B (Property Tax Revenue, Dexia Credit Local de France LOC)±§ 0.25 11/01/2028 37,995,000
23,700,000 Mobile AL Infirmary Health System Special Care Facilities Series A (HFFA Revenue, Bank of Nova Scotia LOC)±§ 0.16 02/01/2040 23,700,000
21,900,000 New Jersey State Turnpike Authority Series D (Tolls Road Revenue, Societe Generale LOC)±§ 0.23 01/01/2018 21,900,00018,000,000 New Mexico Finance Authority State Subseries A2 (Other Revenue, UBS AG LOC)±§ 0.15 06/15/2024 18,000,00016,900,000 New Mexico Finance Authority State Subseries B2 (Other Revenue, UBS AG LOC)±§ 0.19 12/15/2026 16,900,00065,000,000 New York City Municipal Water Finance Authority Subseries B-1 (Water & Sewer Revenue,
JPMorgan Chase Bank LOC)±§ 0.15 06/15/2024 65,000,00036,975,000 New York City Municipal Water Finance Various Subordinated Series B3
(Water Revenue)±§ 0.14 06/15/2025 36,975,00031,800,000 New York NY City Transitional Finance Authority Series 3 Subseries 3C
(Sales Tax Revenue)±§ 0.22 11/01/2022 31,800,00065,600,000 New York NY IDA Series B (IDR, Bank of America NA LOC)±§ 0.14 11/01/2039 65,600,00017,880,000 New York NY Municipal Water Finance Authority Subseries B2
(Water & Sewer Revenue, Lloyds TSB Bank plc LOC)±§ 0.14 06/15/2024 17,880,00015,150,000 New York NY Series e Subseries E-2 (Property Tax Revenue, Bank of America NA LOC)±§ 0.14 08/01/2034 15,150,00034,000,000 New York NY Subseries J3 (Property Tax Revenue, Allied Irish Bank plc LOC)±§ 0.18 08/01/2023 34,000,00013,000,000 Newport Beach CA Hoag Memorial Hospital Series D (HCFR, Bank of America NA LOC)±§ 0.15 12/01/2040 13,000,00021,000,000 North Texas Tollway Authority (Other Revenue, JPMorgan Chase Bank LOC)±§ 0.16 01/01/2049 21,000,00010,000,000 Pennsylvania Housing Finance Agency Series 85C (SFMR, FNMA Insured)±§ 0.18 10/01/2035 10,000,00025,000,000 Port Arthur TX Navy District Environmental Facilities Motiva Enterprises B
(Resource Recovery Revenue)±§ 0.14 12/01/2039 25,000,0005,000,000 Putnam County GA Development Authority Pollution Control (IDR)±§ 0.15 04/01/2032 5,000,000
10,285,000 Reno NV Sales Tax Revenue Various Refunding Senior Lien-Reno Transportation Rail Access Corridor Project (Sales Tax Revenue, Bank of New York LOC)±§ 0.14 06/01/2042 10,285,000
45,625,000 San Diego County CA Regional Transportation Community Limited Tax Series A (Sales Tax Revenue, JPMorgan Chase Bank LOC)±§ 0.18 04/01/2038 45,625,000
77,720,000 San Diego County CA Regional Transportation Community Limited Tax Series B (Sales Tax Revenue, JPMorgan Chase Bank LOC)±§ 0.17 04/01/2038 77,720,000
58,839,000 San Diego County CA Regional Transportation Community Limited Tax Series C (Sales Tax Revenue, Dexia Credit Local de France LOC)±§ 0.39 04/01/2038 58,839,000
10,000,000 San Jose CA Financing Authority Taxable Land Series F (Other Revenue, Bank of America NA LOC)±§ 0.20 06/01/2034 10,000,000
25,000,000 South Dakota State Health & Educational Facilities Authority Avera Health Subseries A1 (Other Revenue, US Bank NA LOC)±§ 0.19 07/01/2038 25,000,000
2,000,000 Texas State Taxable Product Development Program Series A (Other Revenue, National Australia Bank NA LOC)±§ 0.23 06/01/2045 2,000,000
18,000,000 Valdez AK Marine Terminal Revenue BP Pipelines Incorporated Project Series B (IDR)±§ 0.11 07/01/2037 18,000,00010,300,000 Valdez AK Marine Terminal Revenue BP Pipelines Incorporated Project Series C (IDR)±§ 0.11 07/01/2037 10,300,000
2,000,000 Waukesha WI Health System Incorporated (HFR, JPMorgan Chase Bank LOC)±§ 0.26 08/15/2026 2,000,000490,000 Wayne County MI Airport Authority Series F (Airport Revenue, JPMorgan Chase Bank LOC)±§ 0.19 12/01/2016 490,000
5,500,000 West Virginia State Hospital Finance Authority United Health Systems Series A (Hospital Revenue, Bank of America NA LOC)±§ 0.16 06/01/2041 5,500,000
Total Municipal Bonds & Notes (Cost $2,111,645,986) 2,111,645,986
Repurchase Agreements(z): 8.82%1,013,947,949 Bank of America NA, dated 02/26/2010, Maturity Value $1,013,958,088 (1) 0.12 03/01/2010 1,013,947,949
100,000,000 Bank of America Securities LLC, dated 02/26/2010, Maturity Value $100,002,000 (2) 0.24 03/01/2010 100,000,00085,000,000 Bank of America Securities LLC, dated 02/26/2010, Maturity Value $85,000,850 (3) 0.12 03/01/2010 85,000,00063,000,000 Barclays Capital Incorporated, dated 02/26/2010, Maturity Value $63,001,260 (4) 0.24 03/01/2010 63,000,000
HERITAGE MONEY MARKET FUND
Principal Security Name Interest Rate Maturity Date Value

Portfolio of Investments—February 28, 2010 Wells Fargo Advantage Money Market Funds 69
Repurchase Agreements(z): (continued)$ 507,000,000 BNP Paribas Securities, dated 02/26/2010, Maturity Value $507,005,070 (5) 0.12% 03/01/2010 $ 507,000,000
507,000,000 Citigroup Global Markets, dated 02/26/2010, Maturity Value $507,005,070 (6) 0.12 03/01/2010 507,000,000380,000,000 Credit Suisse First Boston Corporation, dated 02/26/2010,
Maturity Value $380,003,800 (7) 0.12 03/01/2010 380,000,000850,000 Deutsche Bank Securities, dated 02/26/2010, Maturity Value $850,009 (8) 0.12 03/01/2010 850,000
119,000,000 JPMorgan Securities, dated 02/26/2010, Maturity Value $119,002,380 (9) 0.24 03/01/2010 119,000,000
Total Repurchase Agreements (Cost $2,775,797,949) 2,775,797,949
Secured Master Note Agreement: 2.11%447,638,000 Bank of America Corporation±§ 0.29 09/09/2034 447,630,696217,947,000 Citigroup Global Markets Holdings DTC MMI±§ 0.64 09/09/2049 217,947,000
Total Secured Master Note Agreement (Cost $665,577,696) 665,577,696
Time Deposits: 9.17%55,000,000 Banco Bilbao Vizcaya London 0.14 03/01/2010 55,000,000
202,000,000 Bank of Ireland 0.35 03/01/2010 202,000,000160,000,000 Bank of Ireland 0.50 03/02/2010 160,000,000108,000,000 Bayer Hypo-und Vereinsbank AG Munich 0.15 03/02/2010 108,000,000
86,000,000 BNP Paribas Paris 0.14 03/02/2010 86,000,000116,000,000 Citibank NA Nassau 0.12 03/01/2010 116,000,000108,000,000 Danske Bank A/S Copenhagen 0.14 03/01/2010 108,000,000199,000,000 Danske Bank A/S Copenhagen 0.20 03/02/2010 199,000,000304,000,000 Danske Bank A/S Copenhagen 0.21 03/01/2010 304,000,000137,000,000 Dexia Bank Grand Cayman 0.22 03/05/2010 137,000,000257,000,000 Fortis Bank NV SA 0.18 03/01/2010 257,000,000
82,000,000 Fortis Bank NV SA 0.18 03/03/2010 82,000,000157,000,000 Fortis Bank NV SA 0.18 03/04/2010 157,000,000585,000,000 KBC Bank NV Brussels 0.16 03/01/2010 585,000,000182,000,000 Lloyds TSB Bank plc London 0.14 03/01/2010 182,000,000150,000,000 Societe Generale Paris 0.16 03/01/2010 150,000,000
Total Asset Backed Securities (Cost $2,888,000,000) 2,888,000,000
Total Investments in Securities
(Cost $31,616,214,168)* 100.41% 31,616,214,168
Other Assets and Liabilities, Net (0.41) (129,753,565)
Total Net Assets 100.00% $31,486,460,603
HERITAGE MONEY MARKET FUND
Principal Security Name Interest Rate Maturity Date Value

70 Wells Fargo Advantage Money Market Funds Portfolio of Investments—February 28, 2010
HERITAGE MONEY MARKET FUND
§ These securities are subject to a demand feature which reduces the effective maturity.
± Variable rate investments.
†† Securities that may be resold to “qualified institutional buyers” under rule 144A or securities offered pursuant to section 4(2) of the Securities Act of 1933, as amended.
(p) Asset-backed commercial paper.
^ Zero coupon security. Rate represents yield to maturity.
(i) Illiquid security (unaudited).
(z) Collateralized by:
(1) U.S. government securities, 5.00%, 1/20/2040, market value including accrued interest is $1,044,366,388.
(2) U.S. government securities, 2.58% to 10.00%, 10/1/2011 to 12/1/2048, market value including accrued interest is $103,000,000.
(3) U.S. government securities, 4.06% to 6.00%, 3/1/2025 to 2/1/2040, market value including accrued interest is $87,550,000.
(4) Commercial paper, 0.00%, 4/8/2010 to 8/18/2010, market value is $64,260,000.
(5) U.S. government securities, 5.50%, 6/1/2033 to 4/1/2039, market value including accrued interest is $522,210,000.
(6) U.S. government securities, 2.90% to 6.18%, 6/1/2018 to 3/1/2040, market value including accrued interest is $522,210,000.
(7) U.S. government securities, 3.50% to 16.00%, 9/1/2011 to 11/1/2047, market value including accrued interest is $391,402,196.
(8) U.S. government securities, 0.00% to 9.80%, 5/2/2010 to 6/1/2047, market value including accrued interest is $874,306.
(9) Commercial paper, 0.03% to 0.15%, 3/2/2010 to 5/25/2010, market value including accrued interest is $121,380,434.
* Cost for federal income tax purposes is $31,616,214,885.
The accompanying notes are an integral part of these financial statements.

Portfolio of Investments—February 28, 2010 Wells Fargo Advantage Money Market Funds 71
MUNICIPAL MONEY MARKET FUND
Principal Security Name Interest Rate Maturity Date Value
Commercial Paper: 3.26%$ 1,375,000 Hillsborough County FL 0.45% 05/06/2010 $ 1,375,000
3,000,000 Illinois Finance Authority 0.20 06/08/2010 3,000,0003,600,000 Montgomery County PA 0.38 03/09/2010 3,600,0004,500,000 San Joaquin CA Transportation Authority 0.18 03/10/2010 4,500,000
Total Commercial Paper (Cost $12,475,000) 12,475,000
Municipal Bonds & Notes: 97.14%
Arizona: 4.26%9,535,000 Arizona Sports & Tourism Authority Multipurpose Stadium
(Other Revenue, Allied Irish Bank plc LOC)§± 0.50 07/01/2036 9,535,0002,400,000 Maricopa County AZ IDA Trans-Matic Manufacturing Production Project
(IDR, National City Bank LOC)§± 0.26 10/01/2026 2,400,0003,080,000 Maricopa County AZ IDA Village At Sun Valley Apartments Project
(MFHR, FNMA Insured)§± 0.35 11/01/2043 3,080,000500,000 Phoenix AZ IDA Series A (HFA, Bank of America LOC)§± 0.31 04/01/2033 500,000800,000 Pima County AZ IDA Eastside Apartments Series B (MFHR, FNMA Insured)§± 0.29 02/15/2031 800,000
16,315,000
California: 8.74%1,700,000 California Infrastructure & Economic Development Bank California Academy Series B
(Other Revenue, Allied Irish Bank plc LOC)§± 0.18 09/01/2038 1,700,0002,150,000 California Infrastructure & Economic Development Bank San Francisco Ballet
(Other Revenue, Allied Irish Bank plc LOC)§± 0.18 08/01/2038 2,150,0003,300,000 California Infrastructure & Economic Development Bank St. Margarets Episcopal School
(Other Revenue, Allied Irish Bank plc LOC)§± 0.60 01/01/2038 3,300,000225,000 California Municipal Finance Authority (Private School Revenue, Allied Irish
Bank plc LOC)§± 0.60 09/01/2036 225,0003,500,000 California Municipal Finance Authority Serra Catholic School (Private School Revenue,
Allied Irish Bank plc LOC)§± 0.60 05/01/2039 3,500,0002,100,000 California Stanford Hospital Series B (HFFA Revenue, Allied Irish Bank plc LOC)§± 0.37 07/01/2034 2,100,000
200,000 California State DWR Power Supply Revenue Series B2 (Power Revenue, BNP Paribas LOC)§± 0.14 05/01/2022 200,000
6,600,000 California State DWR Power Supply Revenue Subseries G1 (Water Revenue, Bank of Nova Scotia LOC)§± 0.15 05/01/2011 6,600,000
2,400,000 California State DWR Power Supply Revenue Subseries F2 (Water Revenue, JPMorgan Chase Bank LOC)§± 0.11 05/01/2020 2,400,000
600,000 California State Economic Recovery Revenue Series C-5 (Other Revenue, Bank of America NA LOC)§± 0.14 07/01/2023 600,000
100,000 California State Kindergarten B-1 (Other Revenue, Allied Irish Bank plc LOC)§± 0.12 05/01/2034 100,0001,100,000 California State Series B5 (Other Revenue, Citibank NA LOC)§± 0.16 05/01/2034 1,100,000
200,000 California Statewide CDA Rady Childrens Hospital Series B (HCFR, Bank of the West LOC)§± 0.13 08/15/2047 200,000
460,000 California Statewide CDA Tyrella Gardens Apartments Series B (Housing Revenue, Citibank NA LOC)§± 0.25 06/01/2036 460,000
2,800,000 California Statewide CDA YMCA East Bay Project (Other Revenue, Allied Irish Bank plc LOC)§± 0.36 06/01/2027 2,800,000
2,500,000 Deutsche Bank Spears Lifers Trust DB-247 (Tax Revenue, FGIC Insured)§± 0.19 12/01/2030 2,500,0001,445,000 Irvine CA Improvement Board ACT 1915 Assessment District #85-7 Series A
(Other Revenue, First Security Bank LOC)§± 0.16 09/02/2032 1,445,000525,000 Roseville CA COP Series A (Electric Revenue, Bank of New York LOC)§± 0.19 02/01/2035 525,000460,000 San Francisco CA City & County Redevelopment Agency MFHR Leland Polk Senior
Community Series A (MFHR, Citibank NA LOC)§± 0.15 12/01/2019 460,0001,120,000 San Leandro CA Carlton Plaza Series A (MFHR, FNMA Insured)§± 0.26 09/15/2032 1,120,000
33,485,000

72 Wells Fargo Advantage Money Market Funds Portfolio of Investments—February 28, 2010
MUNICIPAL MONEY MARKET FUND
Principal Security Name Interest Rate Maturity Date Value
Colorado: 4.18%$ 1,575,000 Colorado College Investment Series I-A (Other Revenue, Lloyds TSB Bank plc LOC)§± 0.22% 12/01/2042 $ 1,575,000
8,310,000 Colorado Educational & Cultural Facilities Authority Lutheran Church Extension (Private School Revenue, Bank of America NA LOC)§± 0.17 05/15/2038 8,310,000
3,865,000 Colorado Housing & Finance Authority Ready Foods Incorporated Project Series A (Other Revenue, US Bank NA LOC)§± 0.25 01/01/2032 3,865,000
1,000,000 Fort Collins CO Economic Development Oakridge Project Series A (Housing Revenue, US Bank NA LOC)§± 0.50 12/01/2032 1,000,000
1,250,000 Hudson CO Series A (IDR, US Bank NA LOC)§± 0.60 11/01/2020 1,250,000
16,000,000
District of Columbia: 2.05%2,075,000 District of Columbia Carnegie Endowment For International Peace
(Other Revenue, Allied Irish Bank plc LOC)§± 0.25 11/01/2045 2,075,0002,030,000 District of Columbia Enterprise Zone 14th & Irving (IDR, Bank of America NA LOC)§± 0.50 05/01/2022 2,030,0003,755,000 Metropolitan Washington DC Airport Authority Series 2855
(Airport Revenue, First Security Bank LOC)§± 0.35 10/01/2014 3,755,000
7,860,000
Florida: 6.88%2,200,000 City of Tallahassee FL (IDR, Branch Banking & Trust LOC)§± 0.29 10/01/2015 2,200,0003,800,000 Deutsche Bank FL Spears Lifers Trust Series DB-563
(Other Revenue, First Security Bank LOC)§± 0.26 10/01/2022 3,800,0009,515,000 Florida Housing Finance Corporation Pinewood Pointe Series C
(State Agency Housing Revenue, Natixis LOC)§± 0.55 06/01/2044 9,515,0001,245,000 Jacksonville FL HFA Christine Cove Apartments (MFHR, FHLMC Insured)§± 0.27 09/15/2038 1,245,0007,130,000 Orange County FL HFA Lakeside Pointe Apartments Series B
(Housing Revenue, FNMA Insured)§± 0.25 05/15/2038 7,130,0002,465,000 Sarasota County FL Continuing Care Retirement Community Glenridge Palmer Project
(HFFA Revenue, Bank of Scotland LOC)§± 0.21 06/01/2036 2,465,000
26,355,000
Georgia: 2.78%2,780,000 Floyd County GA Development Authority Georgia Power Company Plant
Hammond Project (IDR)§± 0.12 09/01/2026 2,780,0003,900,000 Georgia State Ports Authority (Airport Revenue, Bankers Trust Corporation LOC)§± 0.30 06/01/2022 3,900,0003,960,000 Georgia State Ports Authority (IDR, Bankers Trust Corporation LOC)§± 0.30 10/01/2023 3,960,000
10,640,000
Illinois: 4.87%3,670,000 Chicago IL Enterprise Zone Gardner Gibson Project (Economic Development Revenue,
Harris Trust Savings Bank LOC)§± 0.28 07/01/2033 3,670,000280,000 Chicago IL Wastewater Transmission Subseries C-2
(Sewer Revenue, Bank of America NA LOC)§± 0.14 01/01/2039 280,000260,000 Des Plaines IL Finzer Roller Incorporated Project (IDR, Harris Trust Savings Bank LOC)§± 1.00 08/01/2021 260,000
2,535,000 Illinois Development Finance Authority MCL Incorporated Project (IDR, GE Capital Corporation LOC)§± 0.81 06/01/2017 2,535,000
1,600,000 Illinois Development Finance Authority Universal Press Incorporated Project Series A (IDR, LaSalle National Bank NA LOC)§± 0.50 07/01/2020 1,600,000
900,000 Illinois Finance Authority Inx International Ink Company (IDR, JPMorgan Chase Bank LOC)§± 0.31 01/01/2034 900,000
700,000 Illinois Finance Authority Merug LLC Series B (IDR, JPMorgan Chase Bank LOC)§± 0.81 12/01/2018 700,0001,455,000 Lake County IL Brown Paper Goods Project (IDR, Bank One Chicago NA LOC)§± 0.81 10/01/2021 1,455,0001,370,000 Lake County IL Countryside Landfill Incorporated (Solid Waste Revenue, JPMorgan
Chase Bank LOC)§± 0.20 04/01/2021 1,370,000

Portfolio of Investments—February 28, 2010 Wells Fargo Advantage Money Market Funds 73
MUNICIPAL MONEY MARKET FUND
Principal Security Name Interest Rate Maturity Date Value
Illinois (continued) $ 2,600,000 Lake County IL Northpoint Association (IDR, Northern Trust Corporation LOC)§± 0.31% 07/01/2029 $ 2,600,000
1,300,000 Lake Zurich IL (Economic Development Revenue, JPMorgan Chase Bank LOC)§± 0.81 12/01/2029 1,300,0001,960,000 Vernon Hills IL Northwestern Tool & Die Project (IDR, LaSalle National Bank NA LOC)§± 0.55 04/01/2025 1,960,000
18,630,000
Indiana: 3.45%1,000,000 City of Crawfordsville IN Economic Development (IDR, Bank of America NA LOC)§± 0.31 10/01/2018 1,000,0001,925,000 Greensburg IN Community Partners Village II (Housing Revenue, FHLMC Insured)§± 0.25 09/01/2029 1,925,0004,000,000 Indiana Bond Bank State Revenue Program Notes Series A (Other Revenue,
JPMorgan Chase Bank LOC) 2.00 01/06/2011 4,053,2412,040,000 Indiana State Development Finance Authority IN Shelby Gravel Incorporated Project
(IDR, National City Bank of Indiana LOC))§± 0.31 10/01/2017 2,040,0001,495,000 Noblesville IN Greystone Apartments Project Series B (Housing Revenue,
FHLB Insured)§± 0.23 03/01/2041 1,495,0002,715,000 St .Joseph County Midcorr Land Development LLC Project (IDR, National City Bank LOC)§± 0.31 10/01/2023 2,715,000
13,228,241
Iowa: 2.18%1,150,000 Cerro Gordo County IA Newman Catholic School System Project
(Private School Revenue, Allied Irish Bank plc LOC)§± 0.22 05/01/2032 1,150,0005,590,000 Des Moines IA Elliot Aviation Project (Other Revenue, US Bank NA LOC)§± 0.35 08/01/2027 5,590,000
125,000 Iowa Finance Authority Great River Medical Center Project(HCFR, Allied Irish Bank plc LOC)§± 0.24 06/01/2027 125,000
1,500,000 Iowa Finance Authority Industrial Development (IDR, Bank of America NA LOC)§± 0.30 06/01/2028 1,500,000
8,365,000
Kansas: 1.40%1,000,000 Olathe KS Diamant Boart Series A (IDR, Svenska Handelsbanken LOC)§± 0.35 03/01/2027 1,000,0004,350,000 Olathe KS ISL LLC Project (Other Revenue, US Bank NA LOC)§± 0.30 08/01/2027 4,350,000
5,350,000
Kentucky: 6.39%3,410,000 City of Bardstown KY (IDR, US Bank NA LOC)§± 0.23 10/01/2019 3,410,0005,250,000 Hopkins County KY LOK Corporation Project (IDR, PNC Bank NA LOC)§± 0.23 10/01/2017 5,250,0001,850,000 Jefferson County KY (IDR, National City Bank LOC)§± 0.28 09/01/2022 1,850,0006,225,000 Kentucky EDFA (Economic Development Revenue, JPMorgan Chase Bank LOC)§± 0.22 10/01/2028 6,225,000
300,000 Kentucky EDFA (Economic Development Revenue, PNC Bank NA LOC)§± 0.24 12/01/2037 300,0007,450,000 Logan County KY Solid Waste Management LLC Project
(Other Revenue, PNC Bank NA LOC)§± 0.23 03/01/2021 7,450,000
24,485,000
Michigan: 0.65%290,000 Green Lake Township, MI Economic Development Corporation
(Other Revenue, JPMorgan Chase Bank LOC)§± 0.14 06/01/2034 290,000970,000 Macomb County MI Economic Development Corporation (IDR, National City Bank LOC)§± 0.31 12/01/2017 970,000
1,220,000 Michigan State Strategic Fund Fitz Land LLC Project (IDR, National City Bank LOC)§± 0.31 08/01/2025 1,220,000
2,480,000
Minnesota: 9.08%2,185,000 Becker, MN Independent School District # 726 (Property Tax Revenue) 1.50 09/29/2010 2,195,7112,010,000 Bloomington MN Bristol Village (Housing Revenue, FNMA Insured)§± 0.29 11/15/2032 2,010,0001,805,000 Bloomington MN Norlan Partners Series B (Housing Revenue, LaSalle
National Bank NA LOC)§± 0.35 07/15/2032 1,805,0001,800,000 Coon Rapids MN Drake Apartments Project A (Other Revenue, FNMA Insured)§± 0.29 06/15/2038 1,800,000

74 Wells Fargo Advantage Money Market Funds Portfolio of Investments—February 28, 2010
MUNICIPAL MONEY MARKET FUND
Principal Security Name Interest Rate Maturity Date Value
Minnesota (continued)$ 1,985,000 Hennepin County MN Housing & RDA Stone Arch Apartments Project
(MFHR, LaSalle National Bank NA LOC)§± 0.25% 04/15/2035 $ 1,985,0002,400,000 Mahtomedi MN Briarcliff Manor Apartments Series A (Other Revenue, FNMA Insured)§± 0.29 06/15/2038 2,400,0002,740,000 Minneapolis MN Driftwood Apartments Project A (Housing Revenue, US Bank NA LOC)§± 0.30 10/01/2024 2,740,0002,780,000 Minneapolis MN Second Street Acquisition Series A (Housing Revenue,
LaSalle National Bank NA LOC)§± 0.35 01/01/2033 2,780,000230,000 Minneapolis St. Paul MN Housing & RDA Childrens Health Care Series B
(HCFR, First Security Bank LOC)§± 0.13 08/15/2025 230,0002,685,000 Minnesota State HFA Residential Housing Series C (Housing Revenue, FHLB Insured)§± 0.20 07/01/2048 2,685,000
295,000 Minnesota State Residential Housing Series G (Housing Revenue, GO of Authority Insured)§± 0.20 01/01/2032 295,000
140,000 Minnesota State University of St. Thomas Series 5C (College & University Revenue, Allied Irish Bank plc LOC)§± 0.50 04/01/2025 140,000
925,000 Plymouth MN The Lakes Apartments Project (Housing Revenue, FHLMC Insured)§± 0.29 08/01/2034 925,0002,900,000 Ramsey County MN Housing & Redevelopment MFHR Gateway Apartments LP Series A
(Housing Revenue, LaSalle National Bank NA LOC)§± 0.30 10/01/2038 2,900,0002,325,000 St. Anthony MN Landings Silver Lake Series A (MFHR, LaSalle National Bank NA LOC)§± 0.30 10/01/2037 2,325,0002,840,000 St. Paul MN Housing & RDA Hampden Square Apartments Series A
(Housing Revenue, FNMA Insured)§± 0.29 06/01/2032 2,840,0002,595,000 St. Paul MN Housing & RDA Leased Housing Association Series A (Housing Revenue,
LaSalle National Bank NA LOC)§± 0.35 09/01/2035 2,595,0001,000,000 St. Paul MN Port Authority (IDR, Deutsche Bank AG LOC)§± 0.28 12/01/2028 1,000,0001,100,000 St. Paul MN Port Authority (IDR, Deutsche Bank AG LOC)§± 0.28 03/01/2029 1,100,000
34,750,711
New Hampshire: 1.67%3,000,000 Merrimack County NH (Property Tax Revenue) 1.00 12/30/2010 3,009,9823,390,000 New Hampshire HEFA (Healthcare Facilities Revenue, Allied Irish Bank plc LOC)§± 0.62 07/01/2035 3,390,000
6,399,982
New Jersey: 3.20%3,000,000 Millburn Township NJ (Property Tax Revenue) 1.50 02/10/2011 3,030,2874,290,000 New Jersey Health Care Facilities Financing Authority Series A1
(HFFA, Commerce Bank NA LOC)§± 0.16 07/01/2014 4,290,0004,945,000 New Jersey State Transportation Series 146 (Fuel Sales Tax Revenue, First
Security Bank LOC)§± 0.23 12/15/2011 4,945,000
12,265,287
New Mexico: 1.25%4,800,000 New Mexico Educational Assistance Foundation (College & University Revenue, Royal
Bank of Canada LOC)§± 0.23 04/01/2034 4,800,000
New York: 1.25%2,470,000 City of New York NY (Property Tax Revenue, Toronto Dominion Bank LOC)§± 0.16 09/01/2027 2,470,0001,000,000 New York NY City Housing Development Corporation Pierrepont Development
Series A (MFHR)§± 0.19 05/01/2041 1,000,0001,300,000 New York NY City Housing Development Corporation Pierrepont Development
Series A (MFHR, Allied Irish Bank plc LOC)§± 0.22 01/01/2031 1,300,000
4,770,000
North Carolina: 5.77%2,825,000 Lee County NC Industrial Facilities & PCFA Challenge Printing Company Project
(Other Revenue, Wachovia Bank LOC)§±°° 0.40 07/01/2027 2,825,0002,605,000 North Carolina Capital Facilities Finance Agency Various-Elon College Series A
(College & University Revenue, Bank of America NA LOC)§± 0.50 01/01/2014 2,605,000

Portfolio of Investments—February 28, 2010 Wells Fargo Advantage Money Market Funds 75
North Carolina (continued)$ 9,345,000 North Carolina Medical Care Commission (HFFA)§± 0.16% 10/01/2028 $ 9,345,000
7,315,000 Stanley County NC Industrial Facilities & PCFA Chicago Tube Company (IDR, JPMorgan Chase Bank LOC)§± 0.31 04/01/2018 7,315,000
22,090,000
North Dakota: 2.33%3,000,000 North Dakota State HFA Home Mortgage Program Series A (Housing Revenue,
Lloyds TSB Bank plc LOC)§± 0.22 07/01/2037 3,000,0003,500,000 North Dakota State HFA Home Mortgage Program Series B (Housing Revenue)§± 0.24 01/01/2035 3,500,0001,505,000 North Dakota State Housing Finance Agency Home Mortgage Financing
(Housing Revenue, FHLB Insured)§± 0.21 01/01/2030 1,505,000900,000 North Dakota State Housing Finance Agency Housing Finance Program Series B
(Housing Revenue, FHLB Insured)§± 0.22 07/01/2033 900,000
8,905,000
Ohio: 0.61%1,155,000 Franklin County OH Lifeline Shelter Systems Project (IDR, Bank One Chicago NA LOC)§± 0.71 10/01/2021 1,155,0001,200,000 Montgomery County OH Cambridge Commons Apartments A
(Housing Revenue, FHLMC Insured)§± 0.23 04/01/2038 1,200,000
2,355,000
Other: 8.62%1,595,000 RBC Municipal Products Incorporated Trust Series E2
(Other Revenue, Royal Bank of Canada LOC)§± 0.32 01/01/2034 1,595,00031,400,000 SunAmerica Trust Certificates Various States Class A Series 2
(Other Revenue, FHLMC Insured)§± 0.30 07/01/2041 31,400,000
32,995,000
Puerto Rico: 1.31%5,000,000 Puerto Rico Sales Tax Financing Corporation Series 11829
(Sales Tax Revenue, AGM Insured)§±†† 0.22 02/01/2034 5,000,000
South Carolina: 1.31%5,000,000 South Carolina Jobs-Economic Development Authority
(IDR, Branch Banking & Trust LOC)§± 0.26 12/01/2038 5,000,000
Tennessee: 2.52%8,000,000 Huntingdon TN Industrial Development Board Behlen Manufacturing Company Project
(IDR, LaSalle Bank NA LOC)§± 0.34 05/01/2020 8,000,0001,645,000 Pulaski & Giles County TN Lomar Development Company Project (IDR, US Bank NA LOC)§± 0.55 01/01/2017 1,645,000
9,645,000
Texas: 3.45%80,000 Gregg County TX Health Facilities Development Corporation
(HCFR, JPMorgan Chase Bank LOC)§± 0.13 10/01/2029 80,0002,000,000 Port Corpus Christi TX Industrial Development Corporation (IDR, JPMorgan
Chase Bank LOC)§± 0.14 10/01/2036 2,000,00010,000,000 Port Arthur TX Navigation District (Resource Recovery Revenue)§± 0.17 11/01/2038 10,000,000
1,145,000 Texas Housing Options Incorporated Mill City Series A (Housing Revenue, Bank of America NA LOC)§± 0.30 05/01/2036 1,145,000
13,225,000
Vermont: 0.30%1,155,000 Vermont Educational & Health Buildings North County Hospital Project A
(HCFR, Banknorth NA LOC)§± 0.13 10/01/2034 1,155,000
MUNICIPAL MONEY MARKET FUND
Principal Security Name Interest Rate Maturity Date Value

76 Wells Fargo Advantage Money Market Funds Portfolio of Investments—February 28, 2010
MUNICIPAL MONEY MARKET FUND
Principal Security Name Interest Rate Maturity Date Value
Virginia: 1.19%$ 2,250,000 Norfolk VA Economic Development Authority (HFFA)§± 0.36% 11/01/2034 $ 2,250,000
775,000 Virginia Commonwealth University Health System Authority Series B (HCFR, Branch Banking & Trust LOC)§± 0.17 07/01/2037 775,000
1,550,000 Virginia Small Business Financing Authority (IDR, Branch Banking & Trust LOC)§± 0.29 07/01/2024 1,550,000
4,575,000
Washington: 2.61%1,300,000 Washington State EDFA Island Partners LLC Project (IDR, US Bank NA LOC)§± 0.50 06/01/2027 1,300,0005,000,000 Washington State EDFA Waste Management Incorporated Project (Other Revenue,
PNC Bank NA LOC)§± 0.30 06/01/2020 5,000,0001,590,000 Washington State Housing Finance Commission Whisperwood Apartments Project
Series A (MFHR, FNMA Insured)§± 0.25 05/15/2035 1,590,0002,100,000 Yakima County WA Public Corporation Revenue Valley Processing Project
(IDR, Bank of America NA LOC)§± 0.50 02/01/2015 2,100,000
9,990,000
West Virginia: 1.84%7,055,000 Pleasants County WV Simonton Building Products Project (IDR, PNC Bank NA LOC)§± 0.26 12/01/2019 7,055,000
Wisconsin: 0.61%2,330,000 Two Rivers WI Riverside Foods Incorporated Project (IDR, FHLB Insured)§± 0.32 12/01/2022 2,330,000
Wyoming: 0.39%1,500,000 Cheyenne WY Grobet File Company of America Incorporated Project
(IDR, National City Bank LOC)§± 0.31 08/01/2017 1,500,000
Total Municipal Bonds & Notes (Cost $371,999,221) 371,999,221
Total Investments in Securities
(Cost $384,474,221)* 100.40% 384,474,221
Other Assets and Liabilities, Net (0.40) (1,544,705)
Total Net Assets 100.00% $382,929,516
§ These securities are subject to a demand feature which reduces the effective maturity.
± Variable rate investments.
°° Credit enhancement is provided by a non-controlled affiliate.
†† Securities that may be resold to “qualified institutional buyers” under rule 144A or securities offered pursuant to section 4(2) of the Securities Act of 1933, as amended.
* Cost for federal income tax purposes is substantially the same as for financial reporting purposes.
The accompanying notes are an integral part of these financial statements.

Portfolio of Investments—February 28, 2010 Wells Fargo Advantage Money Market Funds 77
Commercial Paper: 4.32%$ 14,750,000 Hillsborough County FL 0.45% 05/06/2010 $ 14,750,000
18,870,000 Illinois Educational Facilities Authority 0.40 03/11/2010 18,870,00037,000,000 Illinois Finance Authority 0.20 06/08/2010 37,000,00010,750,000 Massachusetts Development Finance Authority 0.75 03/01/2010 10,750,00010,000,000 Rochester MN Health Care 0.25 03/03/2010 10,000,00015,900,000 Rochester MN Health Care 0.25 04/01/2010 15,900,00032,400,000 Rochester MN Health Care 0.20 04/05/2010 32,400,00011,300,000 Rochester MN Health Care 0.25 04/06/2010 11,300,00010,600,000 Rochester MN Health Care 0.28 06/03/2010 10,600,00023,500,000 Rochester MN Health Care 0.28 06/09/2010 23,500,00011,165,000 University of Virginia 0.22 04/07/2010 11,165,000
Total Commercial Paper (Cost $196,235,000) 196,235,000
Municipal Bonds & Notes: 95.79%
Alabama: 1.15%12,000,000 Mobile AL Industrial Development Board Alabama Power
Company Project Series C (IDR)§± 0.18 08/01/2017 12,000,0006,300,000 Mobile AL Infirmary Health System Special Care Facilities Series A
(HFFA, Bank of Nova Scotia LOC)§± 0.16 02/01/2040 6,300,00034,000,000 Southeast Alabama Gas District Alabama Revenue Supply Project Series A (IDR) §± 0.15 08/01/2027 34,000,000
52,300,000
Alaska: 0.57%8,550,000 Deutsche Bank Spears Lifers Trust Series DB-507 (Other Revenue, FGIC Insured)§± 0.23 12/01/2034 8,550,000
15,850,000 Deutsche Bank Spears Lifers Trust Series DB-532 (Other Revenue, NATL-RE Insured)§± 0.23 12/01/2041 15,850,0001,300,000 Valdez AK Marine Terminal Revenue BP Pipelines Incorporated Project Series B (IDR)§± 0.11 07/01/2037 1,300,000
25,700,000
Arizona: 0.29%10,125,000 Maricopa County AZ IDA Series A (Housing Revenue, FNMA Insured)§± 0.26 04/15/2030 10,125,000
2,900,000 Yavapai County AZ IDA Northern Arizona Healthcare Series B (HCFR, Banco Bilbao Vizcaya LOC)§± 0.17 12/01/2039 2,900,000
13,025,000
California: 13.72%700,000 ABAG Finance Authority for Nonprofit Corporation California Oshman Family Jewish
Community (Economic Development Revenue, LaSalle National Bank NA LOC)§± 0.15 06/01/2037 700,0001,680,000 ABAG Finance Authority for Nonprofit Corporation California St. Anthony Foundation
(Other Revenue, Bank of America NA LOC)§± 0.19 03/01/2037 1,680,00023,050,000 Bakersfield CA Series B (Water & Wastewater Authority Revenue, First Security Bank LOC)§± 0.24 09/01/2035 23,050,00011,200,000 California Educational Facilities Authority University Judaism Series A
(College & University Revenue, Allied Irish Bank plc LOC)§± 0.52 12/01/2028 11,200,00016,190,000 California HFFA (HCFR, Bank of America NA LOC)§± 0.20 07/01/2035 16,190,000
3,145,000 California Infrastructure & Economic Development Bank ROCS RR II R-11527 (Toll Road Revenue, AMBAC Insured)§± 0.18 07/01/2030 3,145,000
2,700,000 California Series I (HFA Revenue, Bank of America NA LOC)§± 0.15 07/01/2035 2,700,0007,200,000 California Stanford Hospital Series B (HFFA Revenue, First Security Bank LOC)§± 0.22 11/15/2036 7,200,000
31,600,000 California Stanford Hospital Series B (Recreational Revenue, JPMorgan Chase Bank LOC)§± 0.11 06/01/2034 31,600,000
4,995,000 California State (Property Tax Revenue, AMBAC Insured)§± 0.18 04/01/2012 4,995,0009,450,000 California State DWR Power Supply Revenue Series B6 (Water & Wastewater Authority
Revenue, State Street Bank & Trust Company NA LOC)§± 0.15 05/01/2022 9,450,00029,555,000 California State DWR Power Supply Revenue Series C 7 (Electric, Power &
Light Revenue, AGM Insured)§± 0.25 05/01/2022 29,555,000
NATIONAL TAX-FREE MONEY MARKET FUND
Principal Security Name Interest Rate Maturity Date Value

78 Wells Fargo Advantage Money Market Funds Portfolio of Investments—February 28, 2010
NATIONAL TAX-FREE MONEY MARKET FUND
Principal Security Name Interest Rate Maturity Date Value
California (continued)$ 24,350,000 California State DWR Power Supply Revenue Series C1 (Power Revenue, Dexia Credit
Local de France LOC)§± 0.19% 05/01/2022 $ 24,350,0004,535,000 California State DWR Power Supply Revenue Series C13 (Utilities Revenue,
First Security Bank LOC)§± 0.21 05/01/2022 4,535,000600,000 California State Economic Recovery Revenue Series C-5 (Other Revenue,
Bank of America NA LOC)§± 0.14 07/01/2023 600,0002,070,000 California State Series B (Other Revenue, JPMorgan Chase Bank LOC)§± 0.15 05/01/2040 2,070,000
17,220,000 California State Series B Subseries B 3 (Other Revenue, JPMorgan Chase Bank LOC)§± 0.17 05/01/2040 17,220,00053,790,000 California Statewide CDA Azusa Pacific University Project
(College & University Revenue, Allied Irish Bank plc LOC)§± 0.49 04/01/2039 53,790,0003,900,000 California Statewide CDA John Muir Health Series B (Hospital Revenue, UBS AG LOC)§± 0.16 08/15/2036 3,900,0003,700,000 California Statewide CDA University Retirement Community Project (Hospital Revenue,
Bank of America NA LOC)§± 0.11 11/15/2038 3,700,0007,970,000 City of Los Angeles CA (Private School Revenue, Allied Irish Bank plc LOC)§± 0.62 02/01/2034 7,970,000
11,600,000 City of Newport Beach CA (Hospital Revenue, Bank of America NA LOC)§± 0.15 12/01/2040 11,600,00016,840,000 Deutsche Bank Spears Lifers Trust DB-362 (Other Revenue, AMBAC Insured)§± 0.19 06/01/2022 16,840,00018,540,000 Deutsche Bank Spears Lifers Trust DB-363 (Other Revenue, FSA Insured)§± 0.19 09/01/2030 18,540,000
9,530,000 East Bay CA MUD Subseries A2 (Water Revenue, Dexia Credit Local de France LOC)§± 0.20 06/01/2038 9,530,00010,225,000 East Bay CA MUD Subseries A3 (Other Revenue, Dexia Credit Local de France LOC)§± 0.20 06/01/2038 10,225,00020,595,000 El Dorado CA Irrigation District & El Dorado Water Agency Series A (Lease Revenue,
Dexia Credit Local de France LOC)§± 0.21 03/01/2036 20,595,00015,900,000 Golden State Tobacco Securitization Corporation California Tobacco Settlement ROCS
RR II R-11442 (Other Revenue, Citibank NA LOC)§± 0.24 06/01/2035 15,900,0006,085,000 Hesperia CA USD COP Interim School Facility Funding Program
(Lease Revenue, First Security Bank LOC)§± 0.45 02/01/2038 6,085,0004,710,000 Kings County CA Housing Authority Edgewater LLSE Apartments Series A
(MFHR, FNMA Insured)§± 0.16 02/15/2031 4,710,0007,850,000 Los Angeles CA Power System Subseries A5 (Electric Revenue, Lloyds TSB Bank plc LOC)§± 0.16 07/01/2035 7,850,000
15,825,000 Los Angeles CA ROCS RR II R-11281 (Other Revenue, AMBAC Insured)§± 0.21 07/01/2015 15,825,0006,500,000 Los Angeles CA Waste Water Subseries D (Sewer Revenue, Bank of Nova Scotia LOC)§± 0.16 06/01/2028 6,500,0003,055,000 Los Angeles CA USD COP Administration Building Project Series A (Other Revenue,
Bank of America NA LOC)§± 0.18 10/01/2024 3,055,0009,255,000 Manteca CA RDA Amended Merger Project (Tax Allocation Revenue,
State Street Bank & Trust NA LOC)§± 0.13 10/01/2042 9,255,00028,620,000 Menlo Park CA CDA Las Pulgas Community Development
(Tax Allocation Revenue, AMBAC Insured)§± 0.13 01/01/2031 28,620,0002,000,000 Metropolitan Water District Southern CA Waterworks Series B3 (Water Revenue)§± 0.10 07/01/2035 2,000,0003,965,000 Monterey Peninsula CA Water Management District
(Lease Revenue, Bank of America NA LOC)§± 0.22 07/01/2022 3,965,00011,670,000 Northern CA Power Agency Hydroelectric Project 1 Series A (Electric Revenue,
Dexia Credit Local de France LOC)§± 0.21 07/01/2032 11,670,00018,100,000 Riverside CA COP (Lease Revenue, Bank of America NA LOC)§± 0.18 03/01/2037 18,100,000
5,515,000 Roseville CA COP Series A (Electric Revenue, Bank of New York LOC)§± 0.19 02/01/2035 5,515,00024,953,000 Roseville CA Electric System COP Series B (Other Revenue,
Dexia Credit Local de France LOC)§± 0.19 02/01/2035 24,953,0004,120,000 San Diego County CA Regional Transportation Community Limited Tax Series C
(Sales Tax Revenue, Dexia Credit Local de France LOC)§± 0.39 04/01/2038 4,120,00028,630,000 San Diego County CA Regional Transportation Community Limited Tax Series D
(Sales Tax Revenue, Dexia Credit Local de France LOC)§± 0.35 04/01/2038 28,630,0007,500,000 San Francisco CA City & County Finance Corporation Moscone Center
(Lease Revenue, State Street Bank & Trust Company NA LOC)§± 0.17 04/01/2030 7,500,00054,500,000 Southern CA Public Power Authority Transmission Project Revenue (Utilities Revenue,
Lloyds TSB Bank plc LOC)§± 0.20 07/01/2019 54,500,0001,880,000 Sweetwater CA Union High School District ROCS RR II 11484 (Property Tax Revenue,
First Security Bank LOC)§± 0.23 02/01/2013 1,880,0003,600,000 University of California (College & University Revenue, First Security Bank LOC)§± 0.21 05/15/2032 3,600,000

Portfolio of Investments—February 28, 2010 Wells Fargo Advantage Money Market Funds 79
NATIONAL TAX-FREE MONEY MARKET FUND
Principal Security Name Interest Rate Maturity Date Value
California (continued)$ 12,300,000 Whittier CA Health Facilities Presbyterian Intercommunity Series B
(HCFR, US Bank NA LOC)§± 0.16% 06/01/2036 $ 12,300,000
623,463,000
Colorado: 2.35%2,765,000 Aurora CO Centretech Metropolitan District (Other Revenue, US Bank NA LOC)§± 0.20 12/01/2017 2,765,0001,895,000 Aurora CO Centretech Metropolitan District (Other Revenue, US Bank NA LOC)§± 0.20 12/01/2028 1,895,000
13,785,000 Broomfield CO Urban Renewal Authority Event Center Project (Tax Incremental Revenue, Banque Nationale Paris LOC)§± 0.20 12/01/2030 13,785,000
1,270,000 Colorado ECFA National Jewish Federation Series A4 (Recreational Facilities Revenue, Bank of America NA LOC)§± 0.17 02/01/2034 1,270,000
3,840,000 Colorado Educational & Cultural Facilities Authority Lutheran Church Extension (Private School Revenue, Bank of America NA LOC)§± 0.17 05/15/2038 3,840,000
5,900,000 Colorado Health Facilities Authority Crossroads Maranatha Projects (Other Revenue, US Bank NA LOC)§± 0.20 12/01/2043 5,900,000
8,625,000 Commerce City CO Northern Infrastructure General Improvement District (Other Revenue, US Bank NA LOC)§± 0.20 12/01/2038 8,625,000
5,000,000 Commerce City CO Northern Infrastructure General Improvement District (Property Tax Revenue, US Bank NA LOC)§± 0.20 12/01/2028 5,000,000
7,560,000 Cornerstone CO Metropolitan District #1 (Other Revenue, Bank of America NA LOC)§± 0.23 12/01/2036 7,560,0006,600,000 Denver CO City & County Cottonwood Creek Series A (MHFR, FHLMC Insured)§± 0.21 04/15/2014 6,600,000
13,890,000 Fitzsimons CO RDA Colorado University Physicians Incorporated (College & University Revenue, Allied Irish Bank plc LOC)§± 0.37 01/01/2025 13,890,000
11,250,000 Moffat County CO Tri State General Association Project (IDR, Bank of America NA LOC)§± 0.19 03/01/2036 11,250,0006,520,000 Mountain Village CO Housing Authority Village Court Apartments Project
(MFHR, US Bank NA LOC)§± 0.20 11/01/2033 6,520,00010,600,000 South Glenn CO Metropolitan District (Other Revenue, Banque Nationale Paris LOC)§± 0.20 12/01/2030 10,600,000
7,075,000 Southeast CO Public Improvement Metropolitan District (Property Tax Revenue, US Bank NA LOC)§± 0.20 11/15/2034 7,075,000
106,575,000
Connecticut: 0.52%15,350,000 Connecticut State HEFA Revenue Series T-2 (College and University Revenue)§± 0.17 07/01/2029 15,350,000
4,555,000 Connecticut State Series A1 (Property Tax Revenue)§± 0.18 03/01/2023 4,555,0003,890,000 Connecticut Regional School District # 4 (Property Tax Revenue, State Aid Withholding) 1.25 12/01/2010 3,910,473
23,815,473
District of Columbia: 0.53%13,700,000 District of Columbia Ballpark Series B2 (Recreational Facilities Revenue,
Bank of America NA LOC)§± 0.20 02/01/2036 13,700,00010,225,000 District of Columbia Carnegie Endowment For International Peace
(Other Revenue, Allied Irish Bank plc LOC)§± 0.25 11/01/2045 10,225,000
23,925,000
Florida: 6.05%21,810,000 Alachua County FL Oak Hammock University of Florida Project Series A
(HCFR, BNP Paribas LOC)§± 0.21 10/01/2032 21,810,0005,710,000 Brevard County FL Wuesthoff Memorial Hospital Project
(HFFA Revenue, Wachovia Bank LOC)§±°° 0.18 08/01/2031 5,710,0007,725,000 Broward County FL Educational Facilities Authority (College & University Revenue,
Bank of America NA LOC)§± 0.19 04/01/2020 7,725,00011,055,000 Capital Transfer Agency Florida Portofino Villas Series A (Other Revenue, FNMA Insured)§± 0.26 04/15/2036 11,055,000
6,365,000 Deutsche Bank Spears Lifers Trust Series DB-547 (Other Revenue, NATL - RE Insured)§± 0.23 10/01/2026 6,365,0004,530,000 Deutsche Bank Spears Lifers Trust Series DBE-538 (Other Revenue, AMBAC Insured)§± 0.23 04/01/2027 4,530,000

80 Wells Fargo Advantage Money Market Funds Portfolio of Investments—February 28, 2010
NATIONAL TAX-FREE MONEY MARKET FUND
Principal Security Name Interest Rate Maturity Date Value
Florida (continued)$ 4,000,000 Duval County FL HFA Sunbeam Road Apartments Project (Housing Revenue,
US Bank NA LOC)§± 0.20% 07/01/2025 $ 4,000,00010,000,000 Eclipse Funding Trust 2006-0002-Solar Eclipse (Sales Tax Revenue, US Bank NA LOC)§± 0.20 03/01/2014 10,000,00012,490,000 Florida Gulf Coast University Financing Corporation Housing Project Series A
(College & University Revenue, Wachovia Bank LOC)§±°° 0.16 02/01/2038 12,490,0005,100,000 Florida HFA (MFHR, FHLMC Insured)§± 0.19 12/01/2013 5,100,000
11,375,000 Florida USF Financing Corporation COP Master Lease Program Series B1 (Lease Revenue, AMBAC Insured)§± 0.18 07/01/2035 11,375,000
310,000 Fort Lauderdale FL Ann Storck Center Incorporated Project (HCFR, Wachovia Bank LOC)§±°° 0.33 12/01/2014 310,000
19,500,000 Halifax FL Hospital Medical Center (HCFR, Wachovia Bank LOC)§±°° 0.18 06/01/2048 19,500,0005,565,000 Highlands County FL Health Facilities Authority (HFFA, PNC Bank NA LOC)§± 0.17 11/15/2012 5,565,000
10,135,000 Miami Dade County FL Expressway Authority Series 1339 (Toll Road Revenue,AGC-ICC FGIC Insured)§± 0.40 07/01/2012 10,135,000
10,000,000 Miami Dade County FL Special Obligation Juvenile Courthouse Series B (Other Revenue, AMBAC Insured)§± 0.17 04/01/2043 10,000,000
16,300,000 North Broward FL Hospital District (HCFR, Wells Fargo Bank NA LOC)§±°° 0.15 01/15/2027 16,300,00013,800,000 North Broward FL Hospital District Series A (HCFR, Wells Fargo Bank NA LOC)§±°° 0.15 01/15/2027 13,800,000
1,415,000 Orange County FL Central Florida YMCA Project Series A (IDR, Bank of America NA LOC)§± 0.22 05/01/2027 1,415,0003,625,000 Orange County FL Educational Facilities Authority Rollins College Project
(College & University Revenue, Bank of America NA LOC)§± 0.20 12/01/2034 3,625,0007,480,000 Orange County FL Health Facilities Authority Presbyterian Retirement Series A
(HCFR, Branch Banking & Trust LOC)§± 0.18 11/01/2028 7,480,0006,700,000 Orange County FL Health Facilities Authority Presbyterian Retirement Series B
(Housing Revenue, Branch Banking & Trust LOC)§± 0.18 11/01/2035 6,700,0002,785,000 Orange County FL IDA Jewish Federation of Greater Orlando Project
(Private School Revenue, Bank of America NA LOC)§± 0.20 01/01/2028 2,785,0009,450,000 Orange County FL IDA Lake Highland School Incorporated
(Other Revenue, Bank of America NA LOC)§± 0.20 08/01/2032 9,450,0002,000,000 Orange County FL School Board COP Series E
(Lease Revenue, Wachovia Bank LOC)§±°° 0.13 08/01/2022 2,000,0004,055,000 Palm Beach County FL Childrens Home Project (Other Revenue,
Bank of America NA LOC)§± 0.20 05/01/2038 4,055,0002,885,000 Palm Beach County FL Jupiter Medical Center Incorporated Series B
(HCFR, Wachovia Bank LOC)§±°° 0.28 08/01/2020 2,885,0003,200,000 Palm Beach County FL Kings Academy Incorporated Project
(Private School Revenue, Wachovia Bank LOC)§±°° 0.18 08/01/2031 3,200,000300,000 Palm Beach County FL Norton Gallery Incorporated (College & University Revenue,
Northern Trust Corporation LOC)§± 0.26 05/01/2025 300,0007,520,000 Palm Beach County FL School Board Series 2089
(Other Revenue, First Security Bank LOC)§± 0.25 08/01/2026 7,520,0007,845,000 Palm Beach County FL School Board Series 2925Z
(Lease Revenue, First Security Bank LOC)§± 0.25 08/01/2011 7,845,0002,500,000 Palm Beach County FL Zoological Society Incorporated Project
(Recreational Facilities Revenue, Northern Trust Corporation LOC)§± 0.20 05/01/2031 2,500,0005,000,000 St. Petersburg FL Health Facilities Authority Presbyterian Retirement
(Other Revenue, Branch Banking & Trust LOC)§± 0.18 11/01/2039 5,000,0007,480,000 Sarasota County FL Continuing Care Retirement Community Glenridge Palmer
Project (HFFA Revenue, Bank of Scotland LOC)§± 0.21 06/01/2036 7,480,0003,890,000 Sarasota County FL Planned Parenthood Incorporated Project
(Other Revenue, Wachovia Bank LOC)§±°° 0.30 10/01/2041 3,890,0001,255,000 Sarasota County FL Sarasota Military Academy (Private School Revenue,
Wachovia Bank LOC)§±°° 0.28 02/01/2034 1,255,00019,820,000 Tampa Bay FL Water Utility System (Water Revenue, FGIC Insured)§± 0.45 10/01/2023 19,820,000
274,975,000

Portfolio of Investments—February 28, 2010 Wells Fargo Advantage Money Market Funds 81
NATIONAL TAX-FREE MONEY MARKET FUND
Principal Security Name Interest Rate Maturity Date Value
Georgia: 3.02%$ 12,650,000 Atlanta GA Airport Passenger Facility Charge (Other Revenue, First Security Bank LOC)§± 0.23% 01/01/2013 $ 12,650,000
5,790,000 Atlanta GA Westside Project Series B (Tax Incremental Revenue, Wachovia Bank LOC)§±°° 0.18 12/01/2023 5,790,0009,100,000 Bartow County GA Development Authority (IDR)§± 0.12 09/01/2029 9,100,0003,195,000 Cobb County GA Housing Authority Tamarron Apartments Project
(Housing Revenue, FHLMC Insured)§± 0.20 03/01/2024 3,195,0004,620,000 Dekalb County Newtown Gwinett County GA Joint Real Estate Student I
(College & University Revenue, Wachovia Bank LOC)§±°° 0.18 06/01/2035 4,620,0008,375,000 Dekalb Newtown Gwinett Counties GA Real Estate Package I LLC
(College & University Revenue, Wachovia Bank LOC)§±°° 0.18 06/01/2032 8,375,0007,300,000 Floyd County GA Development Authority Georgia Power Company
Plant Hammond Project (IDR)§± 0.12 09/01/2026 7,300,00014,670,000 Fulton County GA Development Authority Catholic School Properties Incorporated
(Private School Revenue, Wachovia Bank LOC)§±°° 0.18 04/01/2024 14,670,00011,260,000 Fulton County GA Northside Series B (Hospital Revenue, Wachovia Bank LOC)§±°° 0.13 10/01/2033 11,260,00012,190,000 Fulton County GA Series 1474 (Water & Sewer Revenue, AGC-ICC FGIC Insured)§± 0.25 07/01/2012 12,190,000
5,500,000 Georgia Private Colleges & University Authority Mercer University Project Series A (Other Revenue, Branch Banking & Trust LOC)§± 0.19 10/01/2036 5,500,000
5,000,000 Gwinnett County GA Development Authority Goodwill North GA Incorporated Project (Other Revenue, Branch Banking & Trust LOC)§± 0.20 10/01/2033 5,000,000
10,000,000 Gwinnett County GA Hospital Authority Series A (HFFA, FHLB Insured)§± 0.19 07/01/2036 10,000,0006,000,000 Macon-Bibb County GA Hospital Authority Antic Medical Center Series B
(HCFR, Branch Banking & Trust LOC)§± 0.19 07/01/2028 6,000,00010,000,000 Putnam County GA Development Authority Pollution Control (IDR)§± 0.12 03/01/2024 10,000,000
2,100,000 Putnam County GA Development Authority Pollution Control (IDR)§± 0.15 04/01/2032 2,100,0009,285,000 Rosell GA Housing Authority (Housing Revenue, FHLMC Insured)§± 0.20 01/01/2034 9,285,000
137,035,000
Hawaii: 0.11%5,000,000 Hawaii State Housing Finance & Development Corporation Lokahi Kau
(MFHR, FHLMC Insured)§± 0.19 12/01/2041 5,000,000
Idaho: 0.23%10,400,000 Coeur d’Alene ID (Other Revenue, Bank of America NA LOC)§± 0.20 08/15/2022 10,400,000
Illinois: 8.26%2,950,000 Aurora IL Economic Development (College & University Revenue, Harris
Trust Savings Bank LOC)§± 0.20 03/01/2035 2,950,00017,000,000 Chicago IL Board of Education (Property Tax Revenue, JPMorgan Chase Bank LOC)§± 0.12 03/01/2036 17,000,00016,215,000 Chicago IL Board of Education Series 3010 (Property Tax Revenue, AMBAC Insured)§± 0.45 12/01/2030 16,215,000
2,000,000 Chicago IL Neighborhoods Alive (Property Tax Revenue, Bank of America NA LOC)§± 0.17 01/01/2037 2,000,000500,000 City of Chicago IL (Property Tax Revenue, JPMorgan Chase Bank LOC)§± 0.12 01/01/2034 500,000
18,580,000 Cook County IL (Property Tax Revenue, First Security Bank LOC)§±†† 0.21 11/15/2011 18,580,0003,140,000 Deutsche Bank Spears Lifers Trust Series DB-502
(Other Revenue, First Security Bank LOC)§± 0.23 01/01/2033 3,140,0001,605,000 Deutsche Bank Spears Lifers Trust Series DB-555
(Other Revenue, First Security Bank LOC)§± 0.23 12/01/2021 1,605,0004,560,000 Deutsche Bank Spears Lifers Trust Series DBE-534 (Other Revenue, AMBAC Insured)§± 0.23 01/01/2022 4,560,0002,585,000 Illinois Development Finance Authority (Other Revenue, Bank of America NA LOC)§± 0.20 01/01/2029 2,585,0004,370,000 Illinois Development Finance Authority Aurora Cent Catholic High School
(Other Revenue, JPMorgan Chase Bank LOC)§± 0.25 04/01/2024 4,370,0005,480,000 Illinois Development Finance Authority Chicago Academy of Sciences
(Recreational Facilities Revenue, JPMorgan Chase Bank LOC)§± 0.25 01/01/2033 5,480,0004,500,000 Illinois Development Finance Authority Cook Communications Project
(Other Revenue, Bank of America NA LOC)§± 0.50 03/01/2017 4,500,0001,000,000 Illinois Development Finance Authority Lake Forest Academy
(Other Revenue, Northern Trust Corporation LOC)§± 0.25 12/01/2024 1,000,000

82 Wells Fargo Advantage Money Market Funds Portfolio of Investments—February 28, 2010
NATIONAL TAX-FREE MONEY MARKET FUND
Principal Security Name Interest Rate Maturity Date Value
Illinois (continued) $ 4,300,000 Illinois Development Finance Authority Loyala Academy Project
(Private School Revenue, JPMorgan Chase Bank LOC)§± 0.25% 10/01/2031 $ 4,300,00022,435,000 Illinois Development Finance Authority McCormick Theological Project B
(College & University Revenue, Northern Trust Corporation LOC)§± 0.25 06/01/2035 22,435,0009,000,000 Illinois Development Finance Authority Presbyterian Homes Project
(HCFR, Northern Trust Corporation LOC)§± 0.25 04/01/2035 9,000,00010,000,000 Illinois Development Finance Authority St. Ignatius College
(Other Revenue, Northern Trust Corporation LOC)§± 0.25 06/01/2024 10,000,00034,600,000 Illinois Development Finance Authority YMCA Metropolitan Chicago Project
(Recreational Facilities Revenue, Harris Trust Savings Bank LOC)§± 0.21 06/01/2029 34,600,0005,000,000 Illinois Educational Facilities Authority Chicago Zoological Society Series B
(Other Revenue, Northern Trust Corporation LOC)§± 0.25 12/15/2025 5,000,000180,000 Illinois Educational Facilities Authority Newberry Library Project
(Other Revenue, Northern Trust Corporation LOC)§± 0.21 03/01/2028 180,0008,385,000 Illinois Finance Authority Bradley University Series A
(Other Revenue, Northern Trust Corporation LOC)§± 0.17 04/01/2033 8,385,0005,040,000 Illinois Finance Authority British Home Retired Men (HCFR,
LaSalle National Bank NA LOC)§± 0.20 11/01/2027 5,040,0008,600,000 Illinois Finance Authority Elmhurst Memorial Healthcare Series D
(HCFR, Northern Trust Corporation LOC)§± 0.16 01/01/2048 8,600,00012,750,000 Illinois Finance Authority Lake Forest Country Day School Project
(Private School Revenue, Northern Trust Corporation LOC)§± 0.25 07/01/2035 12,750,00011,500,000 Illinois Finance Authority Loyola Academy (Private School Revenue,
JPMorgan Chase Bank LOC)§± 0.25 10/01/2037 11,500,0008,305,000 Illinois Finance Authority Pollution Control (PCR, JPMorgan Chase Bank LOC)§± 0.20 05/01/2021 8,305,000
23,815,000 Illinois Finance Authority Presbyterian Homes (HFFA Revenue, NorthernTrust Corporation LOC)§± 0.25 09/01/2024 23,815,000
20,000,000 Illinois Finance Authority Presbyterian Homes Project (Other Revenue, First Security Bank LOC)§± 0.35 09/01/2031 20,000,000
10,100,000 Illinois Finance Authority Richard H. Driehaus Museum(Other Revenue, Northern Trust Corporation LOC)§± 0.25 02/01/2035 10,100,000
43,570,000 Illinois Finance Authority Spertus Institute (GO - States, Territories, Northern Trust Corporation LOC)§± 0.25 09/01/2035 43,570,000
13,000,000 Illinois Finance Authority St. Ignatius College (Private School Revenue, JPMorgan Chase Bank LOC)§± 0.25 12/01/2036 13,000,000
5,820,000 Illinois Finance Authority The Catherine Cook School Project (Private School Revenue, Northern Trust Corporation LOC)§± 0.25 01/01/2037 5,820,000
7,000,000 Illinois Finance Authority Thresholds Project (HCFR, Northern Trust Corporation LOC)§± 0.25 11/01/2035 7,000,0003,500,000 Illinois Finance Authority Xavier University (College & University Revenue,
LaSalle National Bank NA LOC)§± 0.20 10/01/2033 3,500,0003,660,000 Illinois State Xavier University Project Series A (College & University Revenue,
LaSalle National Bank NA LOC)§± 0.20 10/01/2032 3,660,0002,700,000 Lake Villa IL Allendale Association Project (Other Revenue, LaSalle
National Bank NA LOC)§± 0.24 10/01/2026 2,700,0005,810,000 Monmouth IL Industrial Project Monmouth College Project (College & University
Revenue, Allied Irish Bank plc LOC)§± 0.45 06/01/2035 5,810,0003,415,000 St. Clair County IL Mckendree College Project (College & University Revenue,
Bank of America NA LOC)§± 0.20 06/01/2034 3,415,0008,315,000 Warren County IL Monmouth College Project (College & University
Revenue, Allied Irish Bank plc LOC)§± 0.45 12/01/2032 8,315,000
375,285,000

Portfolio of Investments—February 28, 2010 Wells Fargo Advantage Money Market Funds 83
NATIONAL TAX-FREE MONEY MARKET FUND
Principal Security Name Interest Rate Maturity Date Value
Indiana: 2.25%$ 2,900,000 Deutsche Bank Spears Lifers Trust Series DBE-549 (Other Revenue, FGIC Insured)§± 0.23% 07/10/2021 $ 2,900,000
21,300,000 Goshen IN Economic Development Goshen College Project (College & University Revenue, JPMorgan Chase Bank LOC)§± 0.21 10/01/2042 21,300,000
24,000,000 Indiana Bond Bank State Revenue Program Notes Series A (Other Revenue, JPMorgan Chase Bank LOC) 2.00 01/06/2011 24,319,451
5,470,000 Indiana Finance Authority Northshore Health Center Project (HCFR, Harris NA LOC)§± 0.20 07/01/2038 5,470,0007,100,000 Indiana Finance Authority Sisters of St. Francis Series H
(HCFR, JPMorgan Chase Bank LOC)§± 0.18 09/01/2048 7,100,0005,275,000 Indiana HEFA Clarian Health Series C (Other Revenue, Branch Banking & Trust LOC)§± 0.18 02/15/2030 5,275,0008,880,000 Indiana HEFA Clarian Health Series D (Other Revenue,
Branch Banking & Trust LOC)§± 0.18 02/15/2030 8,880,0004,495,000 Indiana HFFA Revenue Fayette Memorial Hospital Association Series A
(HCFR, US Bank NA LOC)§± 0.14 10/01/2032 4,495,0003,425,000 Indiana State Development Finance Authority Sycamore School Project
(Private School Revenue, US Bank NA LOC)§± 0.19 08/01/2024 3,425,00011,905,000 Indianapolis IN Canal Square Apartments (MFHR, FHLMC Insured)§± 0.20 04/01/2033 11,905,000
3,400,000 Indianapolis IN Industrial Multifamily Housing Washington Pointe Project A (Other Revenue, FNMA Insured)§± 0.19 04/15/2039 3,400,000
3,800,000 Marion IN Economic Development Wesleyan University Project (College & University Revenue, Bank of America NA LOC)§± 0.20 06/01/2036 3,800,000
102,269,451
Iowa: 2.16%13,900,000 Iowa Finance Authority Care Initiatives Project (Other Revenue, KBC Bank NV LOC)§± 0.16 11/01/2026 13,900,000
2,960,000 Iowa Finance Authority Cedarwood Hills Project Series A (MFHR, FHLMC Insured)§± 0.26 05/01/2031 2,960,00012,000,000 Iowa Finance Authority Great River Medical Center Project
(HCFR, Allied Irish Bank plc LOC)§± 0.24 06/01/2027 12,000,0009,465,000 Iowa Finance Authority Holy Family Catholic Schools
(Educational Facilities Revenue, Allied Irish Bank plc LOC)§± 0.24 03/01/2036 9,465,00015,715,000 Iowa Finance Authority Student Housing Des Moines LLC Project A
(Housing Revenue, Citibank NA LOC)§± 0.19 06/01/2039 15,715,0002,000,000 Iowa Higher Education Loan Authority Mount Mercy College Project
(College & University Revenue, Bank of America NA LOC)§± 0.14 07/01/2025 2,000,0008,295,000 Iowa Higher Education Loan Authority Private College Dubuque Project
(College & University Revenue, Northern Trust Corporation LOC)§± 0.14 05/01/2029 8,295,000395,000 Iowa Higher Education Loan Authority Private College Project
(Other Revenue, JPMorgan Chase Bank LOC)§± 0.15 10/01/2038 395,00014,705,000 Iowa Higher Education Loan Authority Private Colleges Ambrose
(College & University Revenue, Northern Trust LOC)§± 0.14 04/01/2033 14,705,0003,985,000 Iowa Higher Education Loan Authority Private Colleges Des Moines University Project
(College & University Revenue, Allied Irish Bank plc LOC)§± 0.24 10/01/2033 3,985,00014,815,000 Iowa Higher Education Loan Authority Private Colleges University of Dubuque
(College & University Revenue, Northern Trust Corporation LOC)§± 0.14 04/01/2035 14,815,000
98,235,000
Kentucky: 0.75%3,890,000 Christian County KY Association of Counties Leasing Trust Series B
(Other Revenue, US Bank NA LOC)§± 0.14 08/01/2037 3,890,00010,960,000 Jefferson County KY Student Housing University of Louisville Project Series
(Lease Revenue, Wachovia Bank LOC)§±°° 0.20 09/01/2029 10,960,0009,425,000 Louisville & Jefferson County KY Metropolitan Government Waterford Place
Apartments Project (Housing Revenue, FHLMC Insured)§± 0.20 01/01/2034 9,425,0004,865,000 Williamstown KY League of Cities Funding Trust Series A
(Other Revenue, US Bank NA LOC)§± 0.18 07/01/2038 4,865,000

84 Wells Fargo Advantage Money Market Funds Portfolio of Investments—February 28, 2010
NATIONAL TAX-FREE MONEY MARKET FUND
Principal Security Name Interest Rate Maturity Date Value
Kentucky (continued)$ 4,900,000 Williamstown KY League of Cities Funding Trust Series B
(Lease Revenue, US Bank NA LOC)§± 0.18% 12/01/2038 $ 4,900,000
34,040,000
Louisiana: 0.91%870,000 Deutsche Bank Spears Lifers Trust Series DBE-577 (Other Revenue, AMBAC Insured)§± 0.23 12/01/2020 870,000
7,845,000 Louisiana HFA Woodward (Housing Revenue, FHLB Insured)§± 0.20 09/01/2033 7,845,0009,745,000 Louisiana Public Facilities Authority Thibodaux Project
(Other Revenue, Allied Irish Bank plc LOC)§± 0.50 12/01/2036 9,745,00023,100,000 Louisiana State Series A (Property Tax Revenue, Banque Nationale Paris LOC)§± 0.17 07/15/2026 23,100,000
41,560,000
Maine: 0.30%12,000,000 Maine Finance Authority Foxcroft Academy (Private Schools Revenue,
TD Banknorth NA LOC)§± 0.20 06/01/2038 12,000,0001,700,000 South Berwick ME Berwick Academy Issue (Private School Revenue,
Allied Irish Bank plc LOC)§± 0.62 08/01/2024 1,700,000
13,700,000
Maryland: 0.31%8,000,000 Maryland Health & Higher Educational Facilities Authority
(HFFA, TD Banknorth NA LOC)§± 0.14 07/01/2041 8,000,0002,565,000 Montgomery County MD Economic Development
(Hospital Revenue, Wachovia Bank LOC)§±°° 0.28 03/01/2032 2,565,0003,555,000 Westminster MD (College & University Revenue, Wachovia Bank LOC)§±°° 0.18 04/01/2030 3,555,000
14,120,000
Massachusetts: 1.63%4,085,000 Deutsche Bank Spears Lifers Trust Series DBE-528
(Other Revenue, XLCA Insured)§± 0.21 05/01/2039 4,085,0004,650,000 Massachusetts HEFA (College & University Revenue)§± 0.16 11/01/2028 4,650,0006,600,000 Massachusetts State Development Finance Agency Buckingham Brown & Nichols
(Economic Development Revenue, JPMorgan Chase Bank LOC)§± 0.19 06/01/2036 6,600,00010,600,000 Massachusetts State Development Finance Agency Shady Hill School (Other Revenue,
TD Banknorth NA LOC)§± 0.20 06/01/2038 10,600,0006,375,000 Massachusetts State Development Finance Agency Solomon Schechter Day School
(Other Revenue, Allied Irish Bank plc LOC)§± 0.62 11/01/2037 6,375,0007,600,000 Massachusetts State HEFA Baystate Medical Center Series J1
(HCFR, JPMorgan Chase Bank LOC)§± 0.16 07/01/2044 7,600,00024,000,000 Massachusetts State HEFA Revenue Amherst College Series F (College & University
Revenue, GO of Institution Insured)§± 0.16 11/01/2026 24,000,00010,000,000 Massachusetts State HEFA South Shore Property Series A
(HCFR, Wachovia Bank LOC)§±°° 0.16 07/01/2033 10,000,000
73,910,000
Michigan: 1.55%28,070,000 Detroit MI (Sewer Revenue, First Security Bank LOC)± 0.23 07/01/2010 28,070,000
1,660,000 Green Lake Township MI Economic Development Corporation (Other Revenue, JPMorgan Chase Bank LOC)§± 0.14 06/01/2034 1,660,000
9,585,000 Kentwood MI Public Schools Class A (Property Tax Revenue, First Security Bank LOC)§± 0.21 05/01/2022 9,585,0005,500,000 Michigan State Hospital Finance Authority Holland Community Hospital Series B
(Hospital Revenue, Bank One Michigan LOC)§± 0.19 01/01/2034 5,500,0008,000,000 Michigan State Hospital Finance Authority Mclaren Health Care Series B
(Other Revenue, JPMorgan Chase Bank LOC)§± 0.17 10/15/2030 8,000,00017,395,000 University of Michigan Revenue Series A (College & University Revenue)§± 0.12 04/01/2038 17,395,000
70,210,000

Portfolio of Investments—February 28, 2010 Wells Fargo Advantage Money Market Funds 85
NATIONAL TAX-FREE MONEY MARKET FUND
Principal Security Name Interest Rate Maturity Date Value
Minnesota: 5.41%$ 8,925,000 Andover MN Presbyterian Homes Incorporated Project
(Housing Revenue, FNMA Insured)§± 0.26% 11/15/2033 $ 8,925,0001,685,000 Arden Hills MN Housing & Healthcare Facilities Presbyterian Homes
Series A (HCFR, US Bank NA LOC)§± 0.14 09/01/2029 1,685,000704,000 Arden Hills MN Presbyterian Homes Series B (HCFR, US Bank NA LOC)§± 0.14 09/01/2029 704,000
1,650,000 Bloomington MN Bristol Village (Housing Revenue, FNMA Insured)§± 0.29 11/15/2032 1,650,0005,725,000 Bloomington MN Presbyterian Homes (Other Revenue, FHLMC Insured)§± 0.26 07/01/2038 5,725,000
500,000 Brooklyn Center MN Brookdale Corporation II Project (IDR, Firstar Bank NA LOC)§± 0.14 12/01/2014 500,0003,495,000 Burnsville MN Berkshire Project Series A (MFHR, FNMA Insured)§± 0.26 07/15/2030 3,495,0008,350,000 Burnsville MN Southwind Apartments Project (MFHR, FHLMC Insured)§± 0.26 01/01/2035 8,350,0003,010,000 Center City MN Hazelden Foundation Project (HCFR, Bank of New York LOC)§± 0.14 11/01/2035 3,010,0006,900,000 Center City MN Health Care Facilities Hazelden Foundation Project
(HCFR, Allied Irish Bank plc LOC)§± 0.55 11/01/2020 6,900,0002,750,000 Center City MN Health Care Facilities Hazelden Foundation Project
(Hospital Revenue, Allied Irish Bank plc LOC)§± 0.55 11/01/2027 2,750,0003,250,000 Crystal MN MFHR Crystal Apartments Project (MFHR, FHLB Insured)§± 0.20 05/01/2027 3,250,0004,530,000 Dakota County MN CDA Catholic Finance Corporation (Economic Development
Revenue, US Bank NA LOC)§± 0.28 01/01/2012 4,530,0003,685,000 Dakota County MN RDA (Other Revenue, Merrill Lynch Capital Services LOC)§± 0.25 06/01/2029 3,685,0003,340,000 Deutsche Bank Spears Lifers Trust Series DB-489 (Other Revenue, AMBAC Insured)§± 0.23 01/01/2030 3,340,000
800,000 Eden Prairie MN Eden Glen Apartments Project (MFHR, FNMA Insured)§± 0.26 02/15/2031 800,0003,080,000 Edina MN Edina Park Plaza (MFHR, FHLMC Insured)§± 0.20 12/01/2029 3,080,0008,485,000 Inver Grove Heights MN Inver Grove Incorporated Project
(Housing Revenue, FNMA Insured)§± 0.26 05/15/2035 8,485,0001,620,000 Maple Grove MN MFHR Basswood Trails Project (Housing Revenue)§± 0.26 03/01/2029 1,620,000
610,000 Maplewood MN Educational Facilities Mounds Park Academy Project (Private School Revenue, US Bank NA LOC)§± 0.25 10/01/2023 610,000
2,940,000 Maplewood MN Educational Facilities Mounds Park Academy Project (Private School Revenue, US Bank NA LOC)§± 0.25 10/01/2031 2,940,000
11,915,000 Minneapolis & St. Paul MN Housing & RDA Childrens Hospitals Clinics Series A (Other Revenue, First Security Bank LOC)§± 0.14 08/15/2037 11,915,000
1,075,000 Minneapolis & St. Paul MN Housing & RDA Health Care Facilities Series A (HCFR, First Security Bank LOC)§± 0.14 08/15/2034 1,075,000
800,000 Minneapolis MN MacPhail Center for Music Project (State & Local Governments, US Bank NA LOC)§± 0.14 08/01/2036 800,000
175,000 Minneapolis MN Minnehaha Academy Project (Private School Revenue, US Bank NA LOC)§± 0.14 05/01/2026 175,000
20,220,000 Minneapolis & St. Paul MN Housing & RDA Childrens Health Care Series B (HCFR, First Security Bank LOC)§± 0.13 08/15/2025 20,220,000
7,320,000 Minnesota Agriculture & Economic Development Board Evangelical Lutheran Project (HCFR, Allied Irish Bank plc LOC)§± 0.55 09/01/2021 7,320,000
955,000 Minnesota State Concordia University Series P1 (College & UniversityRevenue, US Bank NA LOC)§± 0.14 04/01/2027 955,000
1,400,000 Minnesota State HEFAR St. Olaf College Series 5H (College & University Revenue, Harris Trust & Saving Bank LOC)§± 0.14 10/01/2030 1,400,000
140,000 Minnesota State HEFAR Trustees Hamline University Series 6E3 (College & University Revenue, Harris Trust Savings Bank LOC)§± 0.20 10/01/2016 140,000
5,205,000 Minnesota State University of St. Thomas Series 4O (College & University Revenue, Allied Irish Bank plc LOC)§± 0.50 10/01/2021 5,205,000
19,330,000 Minnesota State University of St. Thomas Series 5L (College & University Revenue, Allied Irish Bank plc LOC)§± 0.50 04/01/2027 19,330,000
2,550,000 Minnesota State University of St. Thomas Series 6H (Other Revenue, Bank of New York LOC)§± 0.18 10/01/2032 2,550,000
5,520,000 Minnetonka MN (Housing Revenue, FNMA Insured)§± 0.26 05/15/2034 5,520,0002,665,000 Minnetonka MN Minnetonka Hills Apartments (MFHR, FNMA Insured)§± 0.26 11/15/2031 2,665,0009,480,000 Oak Park Heights MN Boutwells Landing Project (Housing Revenue, FHLMC Insured)§± 0.26 11/01/2035 9,480,000

86 Wells Fargo Advantage Money Market Funds Portfolio of Investments—February 28, 2010
NATIONAL TAX-FREE MONEY MARKET FUND
Principal Security Name Interest Rate Maturity Date Value
Minnesota (continued) $ 5,150,000 Pine City MN State Agency (Housing Revenue, FNMA Insured)§± 0.26% 04/15/2036 $ 5,150,000
2,865,000 Plymouth MN Lancaster Village Apartments Project (Housing Revenue, FNMA Insured)§± 0.26 09/15/2031 2,865,000300,000 Roseville MN Presbyterian Homes Care Project (HCFR, US Bank NA LOC)§± 0.14 10/01/2029 300,000
8,580,000 Rosewell MN Roswell LLC Project Series A (College & University Revenue, Sovereign Bank FSB LOC)§± 0.20 07/01/2036 8,580,000
1,165,000 Spring Lake Park MN Senior Housing Oak Crest Apartments Project (Housing Revenue, US Bank NA LOC)§± 0.26 02/15/2033 1,165,000
2,000,000 St. Anthony MN Autumn Woods Housing Project (MFHR, FNMA Insured)§± 0.26 05/15/2032 2,000,0004,780,000 St. Louis Park MN Catholic Finance Corporation (Educational Facilities Revenue,
Allied Irish Bank plc LOC)§± 0.45 10/01/2025 4,780,0008,000,000 St. Louis Park MN Independent School District # 283 Series D
(Property Tax Revenue, School District Credit Program Insured) 1.50 09/29/2010 8,042,47011,300,000 St. Louis Park MN Knollwood Place (MFHR, FNMA Insured)§± 0.26 10/01/2035 11,300,000
1,045,000 St. Louis Park MN Parkshore Project (MFHR, FNMA Insured)§± 0.26 08/01/2034 1,045,0001,000,000 St. Paul MN Housing & RDA Highland Ridge Project (MFHR, FNMA Insured)§± 0.26 10/01/2033 1,000,0005,510,000 St. Paul MN Housing & RDA Public Radio Project
(Other Revenue, Allied Irish Bank plc LOC)§± 0.24 05/01/2022 5,510,0005,020,000 St. Paul MN Housing & RDA Public Radio Project
(MFHR, Allied Irish Bank plc LOC)§± 0.24 10/01/2025 5,020,000400,000 St. Paul MN Housing & RDA Science Museum of Minnesota Series A
(Recreational Facilities Revenue, US Bank NA LOC)§± 0.22 05/01/2027 400,000625,000 St. Paul MN Port Authority (Other Revenue, Deutsche Bank AG LOC)§± 0.20 12/01/2028 625,000650,000 St. Paul MN Port Authority Amherst H Wilder Foundation Series 06-3
(Recreational Facilities Revenue, Bank of New York LOC)§± 0.14 04/01/2036 650,0001,680,000 St. Paul MN Port Authority District Cooling Series 13-FF (IDR, Deutsche Bank AG LOC)§± 0.20 03/01/2029 1,680,0001,765,000 St. Paul MN Port Authority District Heating Series 14-S
(Other Revenue, Deutsche Bank AG LOC)§± 0.20 12/01/2028 1,765,0001,000,000 St. Paul MN Port Authority District Series 11Dd (Other Revenue, Deutsche Bank AG LOC)§± 0.20 03/01/2029 1,000,0003,070,000 St. Paul MN Port Authority District Series 9Bb (Other Revenue, Deutsche Bank AG LOC)§± 0.20 03/01/2029 3,070,0001,000,000 St. Paul MN Port Authority Tax Increment Westgate Office & Industrial Center Project
(IDR, US Bank NA LOC)§± 0.35 02/01/2015 1,000,0008,310,000 St. Paul MN Public Radio Project Series 7 (Other Revenue, Allied Irish Bank plc LOC)§± 0.24 05/01/2025 8,310,0005,720,000 University of Minnesota Series A (College & University Revenue, GO of University)§± 0.22 08/15/2031 5,720,000
245,761,470
Mississippi: 0.61%100,000 Jackson County MS Port Facility Revenue Chevron USA Incorporated Project (lDR)§± 0.13 06/01/2023 100,000
10,000,000 Mississippi Business Finance Corporation Chevron USA (IDR)§± 0.11 12/01/2030 10,000,00017,600,000 Mississippi Business Finance Corporation Tindall Corporation Project
(IDR, Wachovia Bank LOC)§±°° 0.18 04/01/2028 17,600,000
27,700,000
Missouri: 2.40%4,300,000 Independence MO IDA The Mansions Project (MFHR, FHLMC Insured)§± 0.20 08/01/2035 4,300,0006,000,000 Jackson County MO IDA Kansas City Hospice (Other Revenue, Fifth Third Bank LOC)§± 0.20 01/01/2030 6,000,000
17,700,000 Kansas City MO IDA Revenue Ewing Marion Kauffman Foundation (Other Revenue)§± 0.14 04/01/2027 17,700,0001,905,000 Kansas City MO IDA Revenue Ewing Marion Kauffman Foundation Series A
(Other Revenue)§± 0.14 04/01/2027 1,905,0007,820,000 Missouri State Development Finance Board Association of Municipal Utilities
(Lease Revenue, US Bank NA LOC)§± 0.14 06/01/2033 7,820,00013,000,000 Missouri State Development Finance Board Ewing Marion Kauffman Foundation
Project Series A (Other Revenue)§± 0.14 06/01/2037 13,000,0005,300,000 Missouri State HEFA Childrens Mercy Hospital Series A (HCFR, UBS AG LOC)§± 0.19 05/15/2032 5,300,0002,000,000 Missouri State HEFA Childrens Mercy Hospital Series B (HCFR, UBS AG LOC)§± 0.19 05/15/2023 2,000,000
10,000,000 Missouri State HEFA Mother of Good Counsel Home Project (HCFR, Allied Irish Bank plc LOC)§± 0.50 07/01/2037 10,000,000
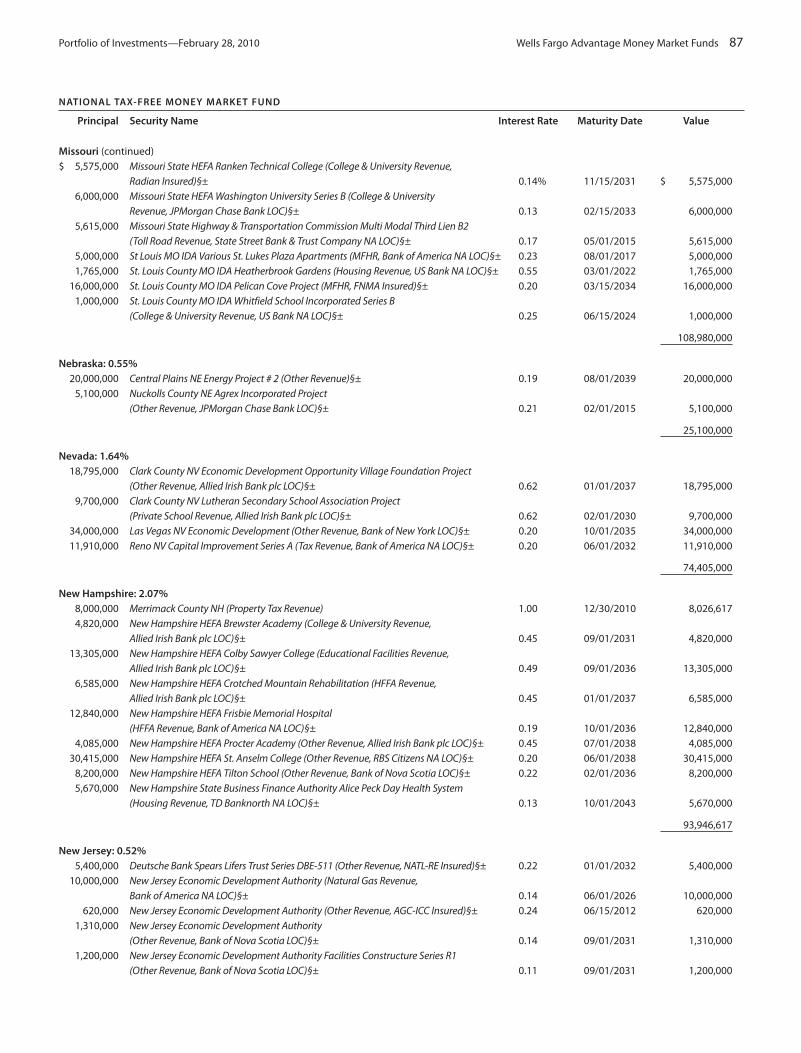
Portfolio of Investments—February 28, 2010 Wells Fargo Advantage Money Market Funds 87
NATIONAL TAX-FREE MONEY MARKET FUND
Principal Security Name Interest Rate Maturity Date Value
Missouri (continued)$ 5,575,000 Missouri State HEFA Ranken Technical College (College & University Revenue,
Radian Insured)§± 0.14% 11/15/2031 $ 5,575,0006,000,000 Missouri State HEFA Washington University Series B (College & University
Revenue, JPMorgan Chase Bank LOC)§± 0.13 02/15/2033 6,000,0005,615,000 Missouri State Highway & Transportation Commission Multi Modal Third Lien B2
(Toll Road Revenue, State Street Bank & Trust Company NA LOC)§± 0.17 05/01/2015 5,615,0005,000,000 St Louis MO IDA Various St. Lukes Plaza Apartments (MFHR, Bank of America NA LOC)§± 0.23 08/01/2017 5,000,0001,765,000 St. Louis County MO IDA Heatherbrook Gardens (Housing Revenue, US Bank NA LOC)§± 0.55 03/01/2022 1,765,000
16,000,000 St. Louis County MO IDA Pelican Cove Project (MFHR, FNMA Insured)§± 0.20 03/15/2034 16,000,0001,000,000 St. Louis County MO IDA Whitfield School Incorporated Series B
(College & University Revenue, US Bank NA LOC)§± 0.25 06/15/2024 1,000,000
108,980,000
Nebraska: 0.55%20,000,000 Central Plains NE Energy Project # 2 (Other Revenue)§± 0.19 08/01/2039 20,000,000
5,100,000 Nuckolls County NE Agrex Incorporated Project (Other Revenue, JPMorgan Chase Bank LOC)§± 0.21 02/01/2015 5,100,000
25,100,000
Nevada: 1.64%18,795,000 Clark County NV Economic Development Opportunity Village Foundation Project
(Other Revenue, Allied Irish Bank plc LOC)§± 0.62 01/01/2037 18,795,0009,700,000 Clark County NV Lutheran Secondary School Association Project
(Private School Revenue, Allied Irish Bank plc LOC)§± 0.62 02/01/2030 9,700,00034,000,000 Las Vegas NV Economic Development (Other Revenue, Bank of New York LOC)§± 0.20 10/01/2035 34,000,00011,910,000 Reno NV Capital Improvement Series A (Tax Revenue, Bank of America NA LOC)§± 0.20 06/01/2032 11,910,000
74,405,000
New Hampshire: 2.07%8,000,000 Merrimack County NH (Property Tax Revenue) 1.00 12/30/2010 8,026,6174,820,000 New Hampshire HEFA Brewster Academy (College & University Revenue,
Allied Irish Bank plc LOC)§± 0.45 09/01/2031 4,820,00013,305,000 New Hampshire HEFA Colby Sawyer College (Educational Facilities Revenue,
Allied Irish Bank plc LOC)§± 0.49 09/01/2036 13,305,0006,585,000 New Hampshire HEFA Crotched Mountain Rehabilitation (HFFA Revenue,
Allied Irish Bank plc LOC)§± 0.45 01/01/2037 6,585,00012,840,000 New Hampshire HEFA Frisbie Memorial Hospital
(HFFA Revenue, Bank of America NA LOC)§± 0.19 10/01/2036 12,840,0004,085,000 New Hampshire HEFA Procter Academy (Other Revenue, Allied Irish Bank plc LOC)§± 0.45 07/01/2038 4,085,000
30,415,000 New Hampshire HEFA St. Anselm College (Other Revenue, RBS Citizens NA LOC)§± 0.20 06/01/2038 30,415,0008,200,000 New Hampshire HEFA Tilton School (Other Revenue, Bank of Nova Scotia LOC)§± 0.22 02/01/2036 8,200,0005,670,000 New Hampshire State Business Finance Authority Alice Peck Day Health System
(Housing Revenue, TD Banknorth NA LOC)§± 0.13 10/01/2043 5,670,000
93,946,617
New Jersey: 0.52%5,400,000 Deutsche Bank Spears Lifers Trust Series DBE-511 (Other Revenue, NATL-RE Insured)§± 0.22 01/01/2032 5,400,000
10,000,000 New Jersey Economic Development Authority (Natural Gas Revenue, Bank of America NA LOC)§± 0.14 06/01/2026 10,000,000
620,000 New Jersey Economic Development Authority (Other Revenue, AGC-ICC Insured)§± 0.24 06/15/2012 620,0001,310,000 New Jersey Economic Development Authority
(Other Revenue, Bank of Nova Scotia LOC)§± 0.14 09/01/2031 1,310,0001,200,000 New Jersey Economic Development Authority Facilities Constructure Series R1
(Other Revenue, Bank of Nova Scotia LOC)§± 0.11 09/01/2031 1,200,000

88 Wells Fargo Advantage Money Market Funds Portfolio of Investments—February 28, 2010
NATIONAL TAX-FREE MONEY MARKET FUND
Principal Security Name Interest Rate Maturity Date Value
New Jersey (continued)$ 2,550,000 New Jersey State Transportation Series 146 (Fuel Sales Tax Revenue, First
Security Bank LOC)§± 0.23% 12/15/2011 $ 2,550,0002,500,000 South River Borough NJ (Property Tax Revenue) 1.50 12/21/2010 2,516,047
23,596,047
New Mexico: 1.71%5,000,000 New Mexico Finance Authority State Subseries A1 (Other Revenue, State
Street Bank & Trust Company NA LOC)§± 0.18 06/15/2024 5,000,0006,000,000 New Mexico Finance Authority State Subseries A2 (Other Revenue, UBS AG LOC)§± 0.15 06/15/2024 6,000,000
26,575,000 New Mexico Finance Authority State Subseries B2 (Other Revenue, UBS AG LOC)§± 0.19 12/15/2026 26,575,00040,000,000 New Mexico Municipal Energy Acquisition Authority (Natural Gas Revenue)§± 0.19 11/01/2039 40,000,000
77,575,000
New York: 7.66%10,300,000 Buffalo NY Municipal Water Finance Authority
(Water Revenue, JPMorgan Chase Bank LOC)§± 0.17 07/01/2035 10,300,00038,970,000 City of New York NY (Property Tax Revenue, Toronto Dominion Bank LOC)§± 0.16 09/01/2027 38,970,000
4,000,000 Indian River Central School District at Philadelphia (New York) (Property Tax Revenue, State Aid Withholding) 1.50 07/15/2010 4,010,610
2,545,000 Long Beach NY (Property Tax Revenue) 1.00 06/25/2010 2,549,7485,000,000 Marlboro Central School District (New York) (Property Tax Revenue, State Aid Withholding) 1.50 07/23/2010 5,016,1755,000,000 Marlboro Central School District (New York) (Property Tax Revenue, State Aid Withholding) 1.50 10/21/2010 5,026,523
11,215,000 Metropolitan NY Transition Authority (Transportation Revenue, AMBAC Insured)§± 0.45 11/15/2023 11,215,0004,000,000 New York City Municipal Water Finance Authority (Water Revenue)§± 0.14 06/15/2038 4,000,000
43,905,000 New York City Transitional Finance Authority (Tax Incremental Revenue, Dexia Credit Local de France LOC)§± 0.22 11/01/2022 43,905,000
14,800,000 New York City Transitional Finance Authority Building Aid Class A (Tax Revenue, First Security Bank LOC)§± 0.21 01/15/2037 14,800,000
18,335,000 New York Convention Center Development Corporation Floater Series 3095 (Hotel Occupancy Tax Revenue, AMBAC Insured)§±†† 0.20 11/15/2044 18,335,000
39,605,000 New York Metropolitan Transportation Authority (Transportation Revenue, First Security Bank LOC)§± 0.23 11/15/2025 39,605,000
16,170,000 New York NY City Transitional Finance Authority NYC Recovery Series 1 Sub 1C (Income Tax Revenue)§± 0.12 11/01/2022 16,170,000
21,750,000 New York NY City Transitional Finance Authority NYC Recovery Series 3 (Tax Revenue)§± 0.22 11/01/2022 21,750,000400,000 New York NY Series J4 (Property Tax Revenue)§± 0.14 08/01/2028 400,000
10,900,000 New York NY Series L5 (Property Tax Revenue)§± 0.12 04/01/2035 10,900,0009,400,000 New York NY Subseries B2 (Property Tax Revenue, JPMorgan Chase Bank LOC)§± 0.14 08/15/2018 9,400,000
74,405,000 New York NY Subseries E4 (Other Revenue, Fortis Banque LOC)§± 0.18 03/01/2034 74,405,0006,700,000 New York NY Subseries F4 (Property Tax Revenue, Royal Bank of Scotland LOC)§± 0.18 09/01/2035 6,700,0003,500,000 Pembroke Central School District (Property Tax Revenue, State Aid Withholding) 1.00 06/21/2010 3,502,2687,000,000 Watervliet City School District (New York) (Property Tax Revenue, State Aid Withholding) 1.50 01/27/2011 7,044,820
348,005,144
North Carolina: 1.65%10,000,000 Durham County NC CTFS Participation (Other Revenue, Suntrust Bank LOC)§± 0.19 06/01/2034 10,000,000
6,000,000 North Carolina Capital Facilities Finance Agency Campbell University (College & University Revenue, Branch Banking & Trust LOC)§± 0.19 10/01/2034 6,000,000
6,835,000 North Carolina Capital Facilities Finance Agency O’Neal School Project (Other Revenue, Wachovia Bank LOC)§±°° 0.18 09/01/2029 6,835,000
1,045,000 North Carolina Educational Facilities Finance Agency Charlotte Day School (Private School Revenue, Bank of America NA LOC)§± 0.20 08/01/2020 1,045,000
11,725,000 North Carolina Medical Care Commission Carol Woods Project (HCFR, Radian Insured)§± 0.13 04/01/2031 11,725,0009,115,000 North Carolina Medical Care Commission Pooled Equipment Financing Project
(HCFR, KBC Bank NV LOC)§± 0.18 12/01/2025 9,115,000

Portfolio of Investments—February 28, 2010 Wells Fargo Advantage Money Market Funds 89
NATIONAL TAX-FREE MONEY MARKET FUND
Principal Security Name Interest Rate Maturity Date Value
North Carolina (continued)$ 4,800,000 North Carolina Medical Care Commission University Health System Series B1
(HCFR, Branch Banking & Trust LOC)§± 0.16% 12/01/2036 $ 4,800,00015,300,000 North Carolina Medical Care Commission University Health System Series B2
(HCFR, Branch Banking & Trust LOC)§± 0.18 12/01/2036 15,300,0004,680,000 North Carolina Medical Care Commission Wayne Memorial Hospital
(HCFR, Branch Banking & Trust LOC)§± 0.17 10/01/2036 4,680,0002,170,000 North Carolina Medical Care Community Presbyterian Home Project
(HCFR, Wachovia Bank LOC)§±°° 0.18 08/01/2024 2,170,0003,500,000 Piedmont Triad NC Airport Authority Series A (Airport Revenue,
Branch Banking & Trust LOC)§± 0.20 07/01/2032 3,500,000
75,170,000
Ohio: 3.29%8,600,000 Cleveland OH Airport System Series D (Airport Revenue, KBC Bank NV LOC)§± 0.28 01/01/2024 8,600,000
11,365,000 Cuyahoga County OH Economic Development Cleveland Botanical Gardens Project (College & University Revenue, Allied Irish Bank plc LOC)§± 0.49 07/01/2031 11,365,000
5,400,000 Cuyahoga County OH Housing Corporation Series A (College & University Revenue, PNC Bank NA LOC)§± 0.17 08/01/2042 5,400,000
6,665,000 Franklin County OH Chelsea First Community Village Project (HFFA Revenue, Bank of America NA LOC)§± 0.20 03/01/2036 6,665,000
15,555,000 Franklin County OH Health Care Facilities Mother Angeline Mccrory Project (HCFR, Allied Irish Bank plc LOC)§± 0.50 04/01/2035 15,555,000
9,025,000 Franklin County OH US Health Corporation Series A (HCFR, US Bank NA LOC)§± 0.16 12/01/2021 9,025,0004,575,000 Geauga County OH Sisters of Notre Dame Project
(Other Revenue, Allied Irish Bank plc LOC)§± 0.54 08/01/2016 4,575,00012,390,000 Hamilton County OH Parking System (Other Revenue, JPMorgan Chase Bank LOC)§± 0.20 12/01/2026 12,390,00022,350,000 Lancaster OH Port Authority (Other Revenue)§± 0.19 05/01/2038 22,350,00013,805,000 Ohio State Higher Education Facilities Ohio Dominican University Project
(Other Revenue, JPMorgan Chase Bank LOC)§± 0.20 12/01/2037 13,805,0009,800,000 Portage County OH Robinson Memorial Hospital (HCFR, JPMorgan Chase Bank LOC)§± 0.23 09/01/2033 9,800,0002,810,000 Warren County OH Cincinnati Electricity Corporation Project
(IDR, Bank of Nova Scotia LOC)§± 0.40 09/01/2015 2,810,30816,552,000 Warren County OH Health Care Facilities Otterbein Homes Series B
(HCFR, US Bank NA LOC)§± 0.18 07/01/2023 16,552,00010,535,000 Washington County OH Marietta Area Health Project
(Other Revenue, JPMorgan Chase Bank LOC)§± 0.18 03/01/2033 10,535,000
149,427,308
Oklahoma: 0.55%8,155,000 Edmond OK Economic Development Authority Edmond Project Series A
(College & University Revenue, Allied Irish Bank plc LOC)§± 0.39 06/01/2031 8,155,0004,695,000 Oklahoma State IDA Teal Ridge Manor Corporation Project
(HCFR, Bank of America NA LOC)§± 0.50 11/01/2018 4,695,00010,090,000 Oklahoma State Municipal Power Authority Series 1880
(Electric Revenue, FGIC Insured)§± 0.40 01/01/2015 10,090,0002,100,000 Oklahoma Turnpike Authority (Highway Toll Revenue)§± 0.14 01/01/2028 2,100,000
25,040,000
Oregon: 0.28%4,140,000 Medford OR Hospital Facilities Authority Cascade Manor Project
(HCFR, KBC Bank NV LOC)§± 0.17 07/01/2036 4,140,000800,000 Multnomah County OR Hospital Facilities Authority Holladay Park Plaza Project
(HCFR, Allied Irish Bank plc LOC)§± 0.25 11/15/2033 800,0003,995,000 Multnomah County OR Hospital Facilities Authority Oregon Baptist Retirement
(HCFR, US Bank NA LOC)§± 0.19 11/01/2034 3,995,000

90 Wells Fargo Advantage Money Market Funds Portfolio of Investments—February 28, 2010
NATIONAL TAX-FREE MONEY MARKET FUND
Principal Security Name Interest Rate Maturity Date Value
Oregon (continued)$ 3,700,000 Oregon State Facilities Authority Hazelden Springbrook Project A
(Other Revenue, Allied Irish Bank plc LOC)§± 0.55% 11/01/2025 $ 3,700,000
12,635,000
Other: 0.23%10,475,000 Puttable Floating Option Tax Exempt Receipts 4202 (Property Tax Revenue, FGIC Insured)§± 0.45 06/01/2034 10,475,000
Pennsylvania: 3.69%13,275,000 Allegheny County PA Hospital Development Authority UPMC Senior Living Corporation
(HCFR, FNMA Insured)§± 0.19 07/15/2028 13,275,00010,000,000 Beaver County PA IDA Electric Company Project Series A (Electric Power & Light
Revenue, Bank of Nova Scotia LOC)§± 0.18 11/01/2020 10,000,00022,200,000 Beaver County PA IDA Firstenergy Nuclear Series B (IDR, Citibank NA LOC)§± 0.17 12/01/2035 22,200,00010,000,000 Beaver County PA IDA Met Edison Company Project Series A (Other Revenue,
Bank of Scotland LOC)§± 0.18 07/15/2021 10,000,0002,800,000 Delaware County PA Authority Elwyn Project Series B
(Other Revenue, Wachovia Bank LOC)§±°° 0.13 06/01/2020 2,800,00011,150,000 Deutsche Bank Spears Lifers Trust DB-247 (Other Revenue, AMBAC Insured)§± 0.19 10/01/2025 11,150,000
5,110,000 Grove City PA Area Hospital Authority John XXIII Home Project (HCFR, Allied Irish Bank plc LOC)§± 0.54 02/01/2030 5,110,000
3,135,000 Lancaster County PA Hospital Authority Health System Lancaster General Hospital (Hospital Revenue, Bank of America NA LOC)§± 0.20 07/01/2041 3,135,000
10,320,000 Lancaster County PA Convention Center Hotel Room Rent Tax (Other Revenue, Wachovia Bank LOC)§±°° 0.18 03/01/2047 10,320,000
3,530,000 Lancaster County PA Hospital Authority Masonic Homes Project Series A (HCFR, Wachovia Bank LOC)§±°° 0.13 09/01/2031 3,530,000
2,160,000 Lancaster County PA Hospital Authority Masonic Homes Project Series B (HCFR, Wachovia Bank LOC)§±°° 0.13 05/01/2032 2,160,000
15,095,000 Lancaster County PA Hospital Authority Masonic Homes Project Series C (HCFR, Wachovia Bank LOC)§±°° 0.13 11/01/2019 15,095,000
7,250,000 Pennsylvania State HEFAR Honeysuckle Student Holding Series A (College & University Revenue, Allied Irish Bank plc LOC)§± 0.29 07/01/2034 7,250,000
4,170,000 Pennsylvania State HEFAR Student Housing Revenue Series A (Other Revenue, Sovereign Bank FSB LOC)§± 0.20 11/01/2036 4,170,000
8,425,000 Philadelphia PA Authority for Industrial Development Chestnut Hill College Series B (Educational Facilities Revenue, Wachovia Bank LOC)§±°° 0.28 10/01/2036 8,425,000
20,000,000 Philadelphia PA School District Subseries A2 (Property Tax Revenue, State Aid Withholding)§± 0.18 12/01/2030 20,000,000
2,360,000 Puttable Floating Option Tax-Exempt Receipts Series P-Floats-MT-636 (Other Revenue, Bank of America NA LOC)§±†† 0.24 02/01/2031 2,360,000
9,000,000 RBC Municipal Products Incorporated Trust Series C13 (HCFR, Royal Bank of Canada LOC)§±†† 0.20 11/01/2011 9,000,000
7,505,000 RBC Municipal Products Incorporated Trust Series E11 (HCFR, Royal Bank of Canada LOC)§±†† 0.20 12/01/2011 7,505,000
167,485,000
Puerto Rico: 0.16%7,395,000 Puerto Rico Commonwealth Highway & Transportation Authority Series A
(Fuel Sales Tax Revenue, Bank of Nova Scotia LOC)§± 0.20 07/01/2028 7,395,000
South Carolina: 1.09%9,520,000 South Carolina Educational Facilities Authority For Private Nonprofit Institutions
(Other Revenue, Bank of America NA LOC)§± 0.20 06/01/2025 9,520,0002,620,000 South Carolina Jobs Economic Development Authority Columbia Jewish
Community Center (Economic Development Revenue, Wachovia Bank LOC)§±°° 0.28 12/01/2024 2,620,000

Portfolio of Investments—February 28, 2010 Wells Fargo Advantage Money Market Funds 91
NATIONAL TAX-FREE MONEY MARKET FUND
Principal Security Name Interest Rate Maturity Date Value
South Carolina (continued)$ 8,300,000 South Carolina Jobs Economic Development Authority Economic Development
Revenue Heartland Hall Episcopal (IDR, Wells Fargo Bank NA LOC)§±°° 0.18% 08/01/2029 $ 8,300,0006,000,000 South Carolina Jobs Economic Development Authority Goodwill Industrials
Incorporated Project (HCFR, Wachovia Bank LOC)§±°° 0.28 10/01/2032 6,000,0006,500,000 South Carolina Jobs Economic Development Authority Greenville Baptist Project
(HCFR, Wachovia Bank LOC)§±°° 0.18 10/01/2019 6,500,00012,260,000 South Carolina Job Economic Development Authority WUREF Development
Project Series A (College & University Revenue, Wachovia Bank LOC)§±°° 0.18 07/01/2033 12,260,0004,540,000 South Carolina Jobs-Economic Development Authority SC State University
Housing LLC Series A (College & University Revenue, Bank of America NA LOC)§± 0.20 03/01/2027 4,540,000
49,740,000
South Dakota: 0.66%3,200,000 Lawrence County SD Homestake Mining Series B (IDR, Bank of Montreal LOC)§± 0.16 07/01/2032 3,200,0006,495,000 South Dakota Housing Development Authority (MFHR, FNMA Insured)§± 0.20 02/15/2031 6,495,0008,000,000 South Dakota State HEFA Regional Health (Other Revenue, US Bank NA LOC)§± 0.14 09/01/2027 8,000,0007,500,000 South Dakota State HEFA Sioux Valley Hospitals & Health Series C
(HCFR, US Bank NA LOC)§± 0.19 11/01/2019 7,500,0004,800,000 South Dakota State HEFA Sioux Valley Series B (HCFR, US Bank NA LOC)§± 0.19 11/01/2034 4,800,000
29,995,000
Tennessee: 1.49%6,450,000 Blount County TN Public Building Authority Local Government Public Import E1
Series A (Other Revenue, Branch Banking & Trust LOC)§± 0.19 06/01/2037 6,450,0005,910,000 Chattanooga TN Industrial Development Board Aquarium Project
(Recreational Revenue, Bank of America NA LOC)§± 0.20 04/01/2024 5,910,00011,330,000 Chattanooga TN Industrial Development Board Series 2055
(Other Revenue, First Security Bank LOC)§± 0.25 04/01/2015 11,330,00019,985,000 Metropolitan Government Nashville & Davidson County TN Stewarts
Ferry Apartments (IDR, FHLMC Insured)§± 0.20 01/01/2034 19,985,0003,300,000 Montgomery County TN Public Building Authority Pooled Financing Loan Pool
(Other Revenue, Bank of America NA LOC)§± 0.24 11/01/2027 3,300,0009,135,000 Sevier County TN Public Building Authority (Other Revenue, Allied Irish Bank plc LOC)§± 0.40 06/01/2032 9,135,0004,775,000 Sevier County TN Public Building Authority Local Government Public
Improvement Series A4 (Other Revenue, KBC Bank NV LOC)§± 0.17 06/01/2025 4,775,0006,690,000 Shelby County TN Industrial Development Board YMCA Projects
(Other Revenue, Wachovia Bank LOC)§±°° 0.28 10/01/2022 6,690,000
67,575,000
Texas: 5.41%12,165,000 Austin TX Subseries A (Tax Revenue, Dexia Credit Local de France LOC)§± 0.20 11/15/2029 12,165,000
6,400,000 Bexar County TX Housing Finance Corporation Vista Meadows Project (Housing Revenue, FHLMC Insured)§± 0.26 09/01/2036 6,400,000
2,275,000 Deutsche Bank Spears Lifers Trust Series DB-514 (Other Revenue, Permanent School Fund Guaranteed)§± 0.23 02/15/2038 2,275,000
9,380,000 Deutsche Bank Spears Lifers Trust Series DBE-526 (Other Revenue, FGIC Insured)§± 0.23 07/01/2026 9,380,0001,250,000 Deutsche Bank Spears Lifers Trust Series DBE-548 (Other Revenue, FGIC Insured)§± 0.23 11/15/2029 1,250,0001,800,000 Fort Bend TX Independent School District Series 2852 (Property Tax Revenue,
Permanent School Fund Guaranteed)§±†† 0.20 02/15/2016 1,800,0005,090,000 Galveston County TX Housing Finance Corporation Village By The Sea Apartments
Project (Housing Revenue, FNMA Insured)§± 0.20 02/15/2032 5,090,0002,550,000 Gulf Coast TX Waste Disposal Authority Amoco Oil (Resource Recovery Revenue)§± 0.11 10/01/2017 2,550,000
32,800,000 Harris County TX Cultural Education Facilities Finance Corporation Herman Health Series D2 (HCFR, Allied Irish Bank plc LOC)§± 0.45 06/01/2029 32,800,000
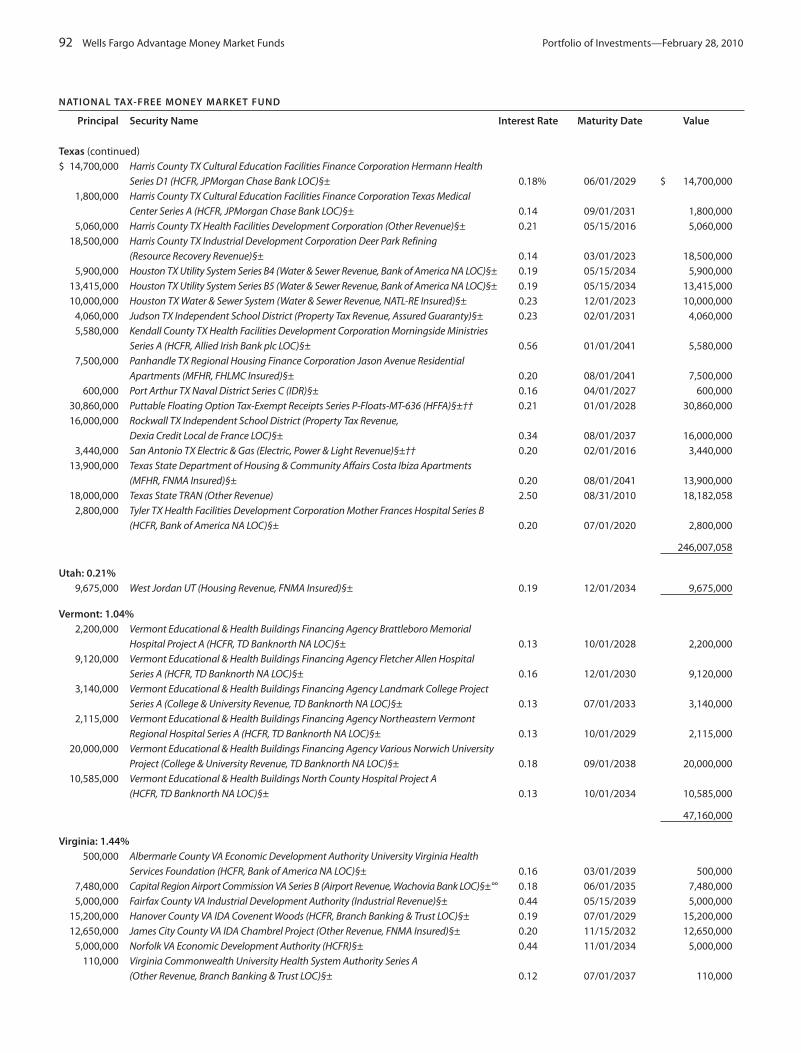
92 Wells Fargo Advantage Money Market Funds Portfolio of Investments—February 28, 2010
NATIONAL TAX-FREE MONEY MARKET FUND
Principal Security Name Interest Rate Maturity Date Value
Texas (continued) $ 14,700,000 Harris County TX Cultural Education Facilities Finance Corporation Hermann Health
Series D1 (HCFR, JPMorgan Chase Bank LOC)§± 0.18% 06/01/2029 $ 14,700,0001,800,000 Harris County TX Cultural Education Facilities Finance Corporation Texas Medical
Center Series A (HCFR, JPMorgan Chase Bank LOC)§± 0.14 09/01/2031 1,800,0005,060,000 Harris County TX Health Facilities Development Corporation (Other Revenue)§± 0.21 05/15/2016 5,060,000
18,500,000 Harris County TX Industrial Development Corporation Deer Park Refining (Resource Recovery Revenue)§± 0.14 03/01/2023 18,500,000
5,900,000 Houston TX Utility System Series B4 (Water & Sewer Revenue, Bank of America NA LOC)§± 0.19 05/15/2034 5,900,00013,415,000 Houston TX Utility System Series B5 (Water & Sewer Revenue, Bank of America NA LOC)§± 0.19 05/15/2034 13,415,00010,000,000 Houston TX Water & Sewer System (Water & Sewer Revenue, NATL-RE Insured)§± 0.23 12/01/2023 10,000,000
4,060,000 Judson TX Independent School District (Property Tax Revenue, Assured Guaranty)§± 0.23 02/01/2031 4,060,0005,580,000 Kendall County TX Health Facilities Development Corporation Morningside Ministries
Series A (HCFR, Allied Irish Bank plc LOC)§± 0.56 01/01/2041 5,580,0007,500,000 Panhandle TX Regional Housing Finance Corporation Jason Avenue Residential
Apartments (MFHR, FHLMC Insured)§± 0.20 08/01/2041 7,500,000600,000 Port Arthur TX Naval District Series C (IDR)§± 0.16 04/01/2027 600,000
30,860,000 Puttable Floating Option Tax-Exempt Receipts Series P-Floats-MT-636 (HFFA)§±†† 0.21 01/01/2028 30,860,00016,000,000 Rockwall TX Independent School District (Property Tax Revenue,
Dexia Credit Local de France LOC)§± 0.34 08/01/2037 16,000,0003,440,000 San Antonio TX Electric & Gas (Electric, Power & Light Revenue)§±†† 0.20 02/01/2016 3,440,000
13,900,000 Texas State Department of Housing & Community Affairs Costa Ibiza Apartments (MFHR, FNMA Insured)§± 0.20 08/01/2041 13,900,000
18,000,000 Texas State TRAN (Other Revenue) 2.50 08/31/2010 18,182,0582,800,000 Tyler TX Health Facilities Development Corporation Mother Frances Hospital Series B
(HCFR, Bank of America NA LOC)§± 0.20 07/01/2020 2,800,000
246,007,058
Utah: 0.21%9,675,000 West Jordan UT (Housing Revenue, FNMA Insured)§± 0.19 12/01/2034 9,675,000
Vermont: 1.04%2,200,000 Vermont Educational & Health Buildings Financing Agency Brattleboro Memorial
Hospital Project A (HCFR, TD Banknorth NA LOC)§± 0.13 10/01/2028 2,200,0009,120,000 Vermont Educational & Health Buildings Financing Agency Fletcher Allen Hospital
Series A (HCFR, TD Banknorth NA LOC)§± 0.16 12/01/2030 9,120,0003,140,000 Vermont Educational & Health Buildings Financing Agency Landmark College Project
Series A (College & University Revenue, TD Banknorth NA LOC)§± 0.13 07/01/2033 3,140,0002,115,000 Vermont Educational & Health Buildings Financing Agency Northeastern Vermont
Regional Hospital Series A (HCFR, TD Banknorth NA LOC)§± 0.13 10/01/2029 2,115,00020,000,000 Vermont Educational & Health Buildings Financing Agency Various Norwich University
Project (College & University Revenue, TD Banknorth NA LOC)§± 0.18 09/01/2038 20,000,00010,585,000 Vermont Educational & Health Buildings North County Hospital Project A
(HCFR, TD Banknorth NA LOC)§± 0.13 10/01/2034 10,585,000
47,160,000
Virginia: 1.44%500,000 Albermarle County VA Economic Development Authority University Virginia Health
Services Foundation (HCFR, Bank of America NA LOC)§± 0.16 03/01/2039 500,0007,480,000 Capital Region Airport Commission VA Series B (Airport Revenue, Wachovia Bank LOC)§±°° 0.18 06/01/2035 7,480,0005,000,000 Fairfax County VA Industrial Development Authority (Industrial Revenue)§± 0.44 05/15/2039 5,000,000
15,200,000 Hanover County VA IDA Covenent Woods (HCFR, Branch Banking & Trust LOC)§± 0.19 07/01/2029 15,200,00012,650,000 James City County VA IDA Chambrel Project (Other Revenue, FNMA Insured)§± 0.20 11/15/2032 12,650,000
5,000,000 Norfolk VA Economic Development Authority (HCFR)§± 0.44 11/01/2034 5,000,000110,000 Virginia Commonwealth University Health System Authority Series A
(Other Revenue, Branch Banking & Trust LOC)§± 0.12 07/01/2037 110,000

Portfolio of Investments—February 28, 2010 Wells Fargo Advantage Money Market Funds 93
NATIONAL TAX-FREE MONEY MARKET FUND
Principal Security Name Interest Rate Maturity Date Value
Virginia (continued)$ 6,665,000 Virginia Commonwealth University Health System Authority Series B
(HCFR, Branch Banking & Trust LOC)§± 0.17% 07/01/2037 $ 6,665,00012,900,000 Virginia Small Business Financing Authority Friendship Foundation
(HCFR, Wachovia Bank LOC)§±°° 0.18 07/01/2022 12,900,000
65,505,000
Washington: 2.29%9,730,000 Eclipse Funding Trust 2006-0002-Solar Eclipse-Seattle
(Water Revenue, US Bank NA LOC)§± 0.17 09/01/2029 9,730,0001,980,000 Everett WA (Property Tax Revenue, Bank of America NA LOC)§± 0.25 12/01/2021 1,980,0006,930,000 King City County WA Public Hospital District #1 (Property Tax Revenue,
Assured Guaranty)§± 0.23 12/01/2015 6,930,0005,005,000 King County WA Housing Authority Series A (Housing Revenue, FHLMC Insured)§± 0.20 07/01/2035 5,005,0005,860,000 King County WA School District #415 (Property Tax Revenue, First Security Bank LOC)§± 0.45 12/01/2018 5,860,0007,920,000 Seattle WA (Electric Revenue, First Security Bank LOC)§± 0.21 03/02/2021 7,920,000
12,530,000 Seattle WA Water System (Water Revenue, First Security Bank LOC)§±†† 0.20 09/01/2012 12,530,00018,440,000 Washington HEFAR Seattle Pacific University
(College & University Revenue, US Bank NA LOC)§± 0.15 10/01/2030 18,440,0007,650,000 Washington State (College & University Revenue, Citibank NA LOC)§±†† 0.20 01/01/2016 7,650,000
12,000,000 Washington State HEFAR University of Puget Sound Series B (College & University Revenue, Bank of America NA LOC)§± 0.22 10/01/2036 12,000,000
6,675,000 Washington State HEFAR University Puget Sound Project A Puttable (College & University Revenue, Bank of America NA LOC)§± 0.22 10/01/2030 6,675,000
5,775,000 Washington State Housing Finance Commission Nonprofit Tacoma Art Museum Project (Recreational Facilities Revenue, Northern Trust Corporation LOC)§± 0.13 06/01/2032 5,775,000
3,400,000 Washington State Sunnyside Community Hospital (HCFR, US Bank NA LOC)§± 0.35 10/01/2017 3,400,000
103,895,000
West Virginia: 0.70%15,820,000 Monongalia County WV Building Commission Series A
(HCFR, JPMorgan Chase Bank LOC)§± 0.20 07/01/2040 15,820,0006,000,000 Weirton WV Municipal Hospital Building Commission Weirton Medical
Center Incorporated (HCFR, PNC Bank NA LOC)§± 0.19 12/01/2031 6,000,00010,000,000 West Virginia State Hospital Finance Authority Cabell Hospital Series A
(HCFR, Branch Banking & Trust LOC)§± 0.18 01/01/2034 10,000,000
31,820,000
Wisconsin: 2.38%7,750,000 Milwaukee WI RDA University of Wisconsin Kenilworth Project
(College & University Revenue, US Bank NA LOC)§± 0.20 09/01/2040 7,750,0006,000,000 Wisconsin HEFA (Hospital Revenue, Bank of America NA LOC)§± 0.14 08/01/2030 6,000,000
10,000,000 Wisconsin HEFA St. Norbert College Incorporated (College & University Revenue, JPMorgan Chase Bank LOC)§± 0.25 02/01/2038 10,000,000
6,565,000 Wisconsin State HEFA Beloit Memorial Hospital Incorporated (HCFR, JPMorgan Chase Bank LOC)§± 0.15 04/01/2036 6,565,000
30,720,000 Wisconsin State HEFA Gundersen Lutheran Series B (HCFR, First Security Bank LOC)§± 0.44 12/01/2029 30,720,0004,045,000 Wisconsin State HEFA Lawrence University (College & University Revenue,
JPMorgan Chase Bank LOC)§± 0.21 02/01/2039 4,045,0002,400,000 Wisconsin State HEFA Alverno College Project (College & University Revenue,
Allied Irish Bank plc LOC)§± 0.24 11/01/2017 2,400,00010,745,000 Wisconsin State HEFA Custodial Receipts Beloit College (College & University Revenue,
XLCA Insured)§± 0.24 06/01/2037 10,745,0006,935,000 Wisconsin State HEFA Fort Healthcare Incorporated Series A
(Other Revenue, JPMorgan Chase Bank LOC)§± 0.15 05/01/2037 6,935,000
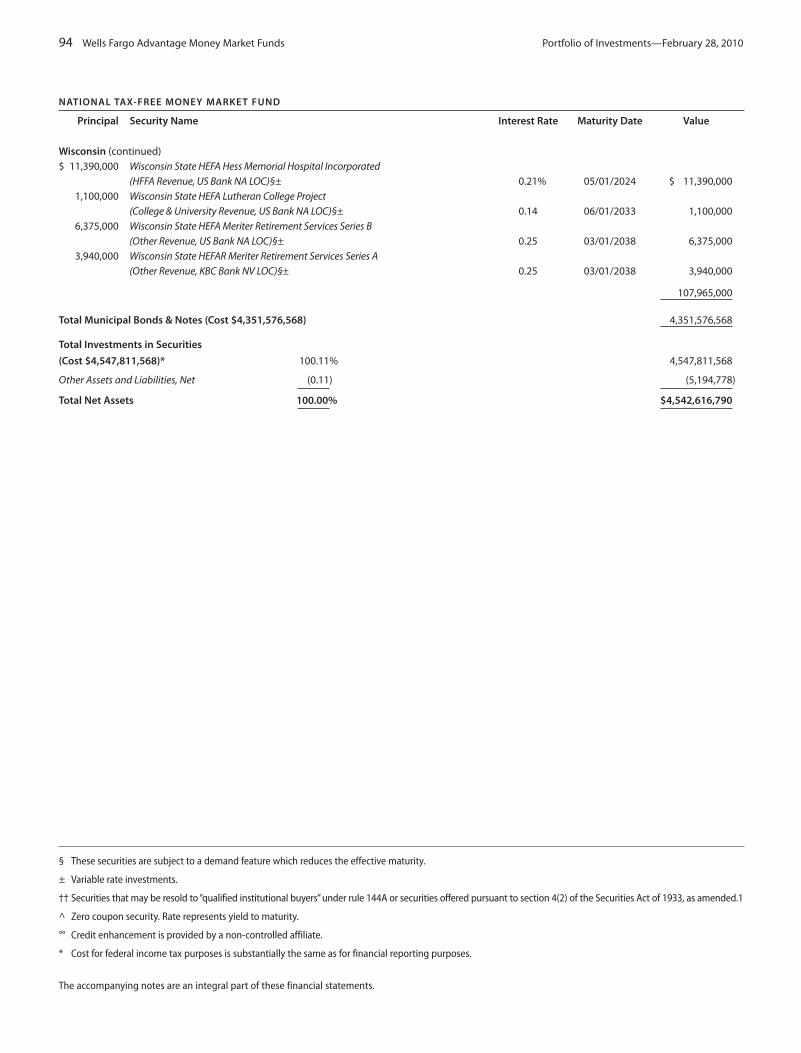
94 Wells Fargo Advantage Money Market Funds Portfolio of Investments—February 28, 2010
§ These securities are subject to a demand feature which reduces the effective maturity.
± Variable rate investments.
†† Securities that may be resold to “qualified institutional buyers” under rule 144A or securities offered pursuant to section 4(2) of the Securities Act of 1933, as amended.1
^ Zero coupon security. Rate represents yield to maturity.
°° Credit enhancement is provided by a non-controlled affiliate.
* Cost for federal income tax purposes is substantially the same as for financial reporting purposes.
The accompanying notes are an integral part of these financial statements.
NATIONAL TAX-FREE MONEY MARKET FUND
Principal Security Name Interest Rate Maturity Date Value
Wisconsin (continued)$ 11,390,000 Wisconsin State HEFA Hess Memorial Hospital Incorporated
(HFFA Revenue, US Bank NA LOC)§± 0.21% 05/01/2024 $ 11,390,0001,100,000 Wisconsin State HEFA Lutheran College Project
(College & University Revenue, US Bank NA LOC)§± 0.14 06/01/2033 1,100,0006,375,000 Wisconsin State HEFA Meriter Retirement Services Series B
(Other Revenue, US Bank NA LOC)§± 0.25 03/01/2038 6,375,0003,940,000 Wisconsin State HEFAR Meriter Retirement Services Series A
(Other Revenue, KBC Bank NV LOC)§± 0.25 03/01/2038 3,940,000
107,965,000
Total Municipal Bonds & Notes (Cost $4,351,576,568) 4,351,576,568
Total Investments in Securities
(Cost $4,547,811,568)* 100.11% 4,547,811,568
Other Assets and Liabilities, Net (0.11) (5,194,778)
Total Net Assets 100.00% $4,542,616,790

Portfolio of Investments—February 28, 2010 Wells Fargo Advantage Money Market Funds 95
Agency Notes - Interest Bearing: 0.27%
Federal Home Loan Mortgage Corporation: 0.27%$ 30,000,000 FHLMC±§ 0.15% 02/02/2012 $ 29,953,491
Total Agency Notes - Interest Bearing (Cost $29,953,491) 29,953,491
Bankers Acceptance Notes: 0.76%
Domestic Banks: 0.76%3,000,000 Bank of America NA^ 0.19 03/17/2010 2,999,7339,000,000 Bank of America NA^ 0.19 03/18/2010 8,999,1505,306,454 Bank of America NA^ 0.32 08/20/2010 5,298,3411,486,493 Bank of America NA^ 0.32 08/23/2010 1,484,181
41,349,418 Bank of America NA^ 0.44 03/29/2010 41,334,9462,461,551 Bank of America NA^ 0.37 04/08/2010 2,460,6949,000,000 Bank of America NA^ 0.39 05/04/2010 8,993,600
12,000,000 Bank of America NA^ 0.35 05/18/2010 11,990,900
Total Bankers Acceptance Notes (Cost $83,561,545) 83,561,545
Certificates of Deposit: 11.01%94,000,000 Abbey National Treasury Services± 0.26 02/14/2011 94,000,00045,000,000 Abbey National Treasury Services± 0.27 12/10/2010 45,000,00025,000,000 Abbey National Treasury Services± 0.50 05/05/2010 25,009,75047,000,000 Allied Irish Banks North America Incorporated±†† 0.25 03/03/2010 47,000,00050,000,000 Banco Bilbao Vizcaya (London)†† 0.18 03/18/2010 49,995,51418,000,000 Banco Bilbao Vizcaya Argentaria (London)†† 0.29 04/22/2010 17,992,20015,000,000 Banco Bilbao Vizcaya Argentaria (New York) 0.23 04/12/2010 15,000,00053,000,000 Barclays Bank plc (New York)± 0.48 01/19/2011 53,000,00060,000,000 Barclays Bank plc (New York)± 0.78 11/08/2010 60,000,00042,000,000 Barclays Bank plc (New York)± 1.00 06/24/2010 42,000,000
6,000,000 BNP Paribas Euro 0.23 04/12/2010 6,000,0707,000,000 Calyon (New York) 0.25 06/02/2010 7,000,000
13,000,000 Calyon (New York)± 0.29 06/29/2010 12,991,92737,000,000 Calyon (New York) 0.55 03/22/2010 37,001,07510,000,000 Calyon (New York)± 0.76 06/03/2010 10,010,67825,000,000 Dexia Delaware LLC 1.00 03/01/2010 25,000,00038,000,000 Lloyds TSB Bank plc (New York)± 0.35 05/10/2010 38,000,00070,000,000 Lloyds TSB Bank plc (New York)± 0.46 11/12/2010 70,000,00084,000,000 Lloyds TSB Bank plc (New York)± 0.50 07/26/2010 84,000,00012,000,000 Natixis Commercial Paper Corporation 0.28 04/05/2010 12,000,00045,000,000 Nordea Bank Finland (New York) 1.86 04/28/2010 45,107,21117,000,000 Rabobank Nederland NV (New York)± 0.23 01/06/2011 17,000,00024,000,000 Rabobank Nederland NV (New York)± 0.23 01/07/2011 24,000,00035,000,000 Rabobank Nederland NV (New York)± 0.23 10/19/2010 35,000,00074,000,000 Royal Bank of Scotland Group plc (Connecticut)± 0.84 07/16/2010 74,000,00085,000,000 Societe Generale (New York)± 0.10 04/05/2010 85,000,00037,000,000 Societe Generale (New York)±§ 0.55 05/05/2011 37,000,000
146,000,000 Unicredit S.p.A (New York) 0.27 05/04/2010 146,000,000
Total Certificates of Deposit (Cost $1,214,108,425) 1,214,108,425
Commercial Paper: 61.16%12,000,000 Allied Irish Banks North America Incorporated^†† 0.12 03/02/2010 11,999,91732,000,000 Allied Irish Banks North America Incorporated^†† 0.20 03/04/2010 31,999,30726,000,000 Allied Irish Banks North America Incorporated^†† 0.21 03/05/2010 25,999,24926,000,000 Amstel Funding Corporation^††(p) 0.00 03/01/2010 26,000,00015,000,000 Amstel Funding Corporation^††(p) 0.49 03/04/2010 14,999,188
PRIME INVESTMENT MONEY MARKET FUND
Principal Security Name Interest Rate Maturity Date Value

96 Wells Fargo Advantage Money Market Funds Portfolio of Investments—February 28, 2010
PRIME INVESTMENT MONEY MARKET FUND
Principal Security Name Interest Rate Maturity Date Value
Commercial Paper (continued)$ 26,000,000 Amstel Funding Corporation^††(p) 0.56% 03/15/2010 $ 25,993,933
50,000,000 Amstel Funding Corporation^††(p) 0.57 03/17/2010 49,986,66714,000,000 Amstel Funding Corporation^††(p) 0.57 03/18/2010 13,996,03387,000,000 Amstel Funding Corporation^††(p) 0.79 04/30/2010 86,884,00025,000,000 Amsterdam Funding Corporation^††(p) 0.15 03/22/2010 24,997,667
9,750,000 Amsterdam Funding Corporation^††(p) 0.16 03/18/2010 9,749,2173,000,000 Amsterdam Funding Corporation^††(p) 0.17 03/25/2010 2,999,6408,050,000 Amsterdam Funding Corporation^††(p) 0.18 04/07/2010 8,048,511
21,000,000 Amsterdam Funding Corporation^††(p) 0.19 04/19/2010 20,994,56913,000,000 Amsterdam Funding Corporation^††(p) 0.20 05/03/2010 12,995,45055,000,000 Anglo Irish Bank Corporation Limited^†† 0.17 03/03/2010 54,999,236
5,650,000 Antalis US Funding Corporation^††(p) 0.14 03/05/2010 5,649,8875,000,000 Antalis US Funding Corporation^††(p) 0.17 03/08/2010 4,999,815
13,000,000 Antalis US Funding Corporation^††(p) 0.17 03/09/2010 12,999,4511,080,000 Antalis US Funding Corporation^††(p) 0.17 03/17/2010 1,079,9142,000,000 Antalis US Funding Corporation^††(p) 0.17 03/24/2010 1,999,7707,000,000 Antalis US Funding Corporation^††(p) 0.20 04/16/2010 6,998,2112,000,000 Antalis US Funding Corporation^††(p) 0.20 03/08/2010 1,999,9221,800,000 Antalis US Funding Corporation^††(p) 0.21 04/13/2010 1,799,549
15,000,000 Antalis US Funding Corporation^††(p) 0.21 04/23/2010 14,995,3632,000,000 Antalis US Funding Corporation^††(p) 0.22 04/12/2010 1,999,4871,000,000 Antalis US Funding Corporation^††(p) 0.22 04/08/2010 999,7658,000,000 Antalis US Funding Corporation^††(p) 0.24 04/08/2010 7,997,953
70,000,000 ANZ National (International) Limited±†† 0.32 01/11/2011 70,000,00044,000,000 ANZ National (International) Limited±†† 0.38 10/20/2010 44,000,000
6,000,000 Arabella Finance LLC^††(p) 0.47 03/18/2010 5,998,58344,000,000 Arabella Finance LLC^††(p) 0.53 05/19/2010 43,948,82624,000,000 Arabella Finance LLC^††(p) 0.53 05/24/2010 23,970,32030,000,000 ASB Finance Limited (London)±†† 0.33 01/12/2011 29,998,69420,000,000 ASB Finance Limited (London)±†† 0.33 01/10/2011 20,000,00028,000,000 ASB Finance Limited (London)±†† 0.36 12/08/2010 28,002,25029,000,000 ASB Finance Limited (London)±†† 0.36 12/13/2010 29,002,31638,000,000 ASB Finance Limited (London)±†† 0.78 07/09/2010 38,000,000
4,000,000 Aspen Funding Corporation^††(p) 0.17 03/17/2010 3,999,68026,000,000 Aspen Funding Corporation^††(p) 0.20 04/28/2010 25,991,622
3,000,000 Atlantic Asset Securitization Corporation^††(p) 0.15 03/10/2010 2,999,8732,000,000 Atlantic Asset Securitization Corporation^††(p) 0.15 03/11/2010 1,999,906
17,000,000 Atlantic Asset Securitization Corporation^††(p) 0.18 03/18/2010 16,998,4754,000,000 Atlantic Asset Securitization Corporation^††(p) 0.19 04/09/2010 3,999,1772,000,000 Atlantic Asset Securitization Corporation^††(p) 0.19 04/14/2010 1,999,536
14,000,000 Atlantic Asset Securitization Corporation^††(p) 0.20 04/08/2010 13,997,04421,000,000 Autobahn Funding Company LLC^††(p) 0.00 03/01/2010 21,000,000
5,000,000 Autobahn Funding Company LLC^††(p) 0.13 03/02/2010 4,999,9633,500,000 Autobahn Funding Company LLC^††(p) 0.24 03/30/2010 3,499,2951,000,000 Autobahn Funding Company LLC^††(p) 0.26 04/05/2010 999,7382,000,000 Autobahn Funding Company LLC^††(p) 0.27 05/10/2010 1,998,9508,000,000 Autobahn Funding Company LLC^††(p) 0.27 05/17/2010 7,995,380
96,000,000 Bank of Nova Scotia^ 0.18 04/14/2010 95,978,88020,000,000 Barclays US Funding LLC^ 0.00 03/01/2010 20,000,000
9,000,000 Barton Capital Corporation^††(p) 0.17 04/06/2010 8,998,4703,000,000 Barton Capital Corporation^††(p) 0.19 04/16/2010 2,999,2722,000,000 Beethoven Funding Corporation^††(p) 0.15 03/02/2010 1,999,9836,000,000 Beethoven Funding Corporation^††(p) 0.20 03/03/2010 5,999,9002,000,000 Beethoven Funding Corporation^††(p) 0.23 03/04/2010 1,999,950
14,000,000 Beethoven Funding Corporation^††(p) 0.24 03/05/2010 13,999,53312,000,000 Belmont Funding LLC^††(p) 0.23 03/03/2010 11,999,76711,000,000 BGL BNP Paribas SA^ 0.23 04/14/2010 10,996,908
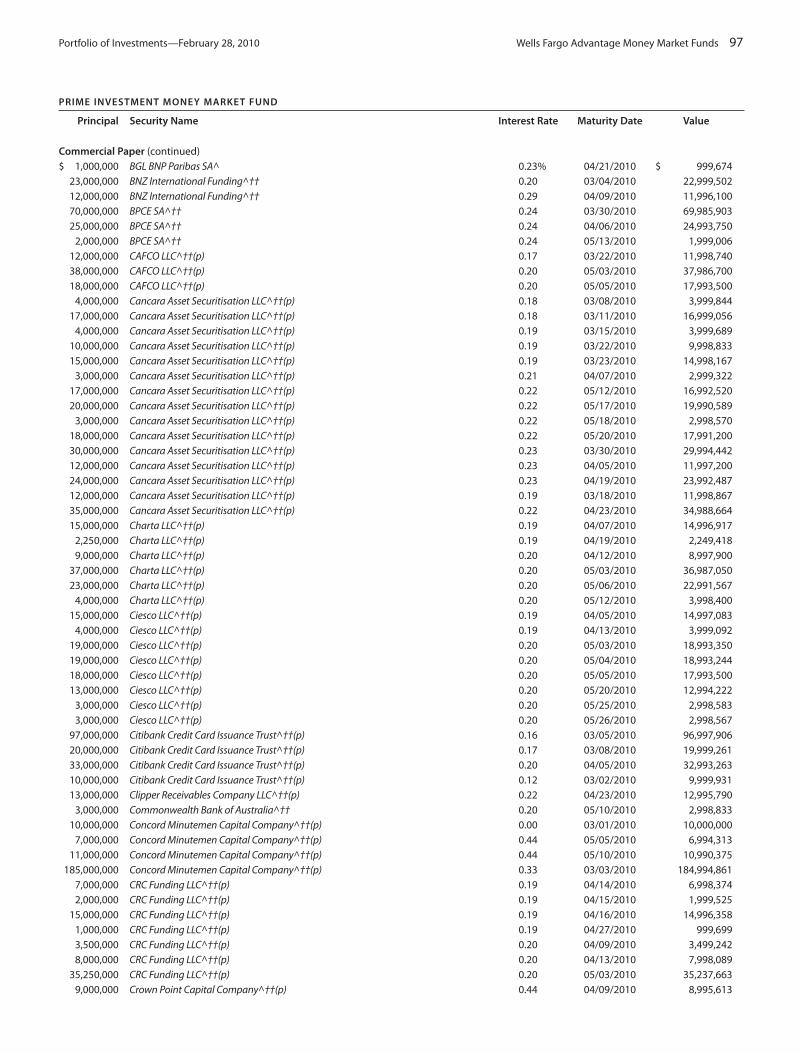
Portfolio of Investments—February 28, 2010 Wells Fargo Advantage Money Market Funds 97
Commercial Paper (continued)$ 1,000,000 BGL BNP Paribas SA^ 0.23% 04/21/2010 $ 999,674
23,000,000 BNZ International Funding^†† 0.20 03/04/2010 22,999,50212,000,000 BNZ International Funding^†† 0.29 04/09/2010 11,996,10070,000,000 BPCE SA^†† 0.24 03/30/2010 69,985,90325,000,000 BPCE SA^†† 0.24 04/06/2010 24,993,750
2,000,000 BPCE SA^†† 0.24 05/13/2010 1,999,00612,000,000 CAFCO LLC^††(p) 0.17 03/22/2010 11,998,74038,000,000 CAFCO LLC^††(p) 0.20 05/03/2010 37,986,70018,000,000 CAFCO LLC^††(p) 0.20 05/05/2010 17,993,500
4,000,000 Cancara Asset Securitisation LLC^††(p) 0.18 03/08/2010 3,999,84417,000,000 Cancara Asset Securitisation LLC^††(p) 0.18 03/11/2010 16,999,056
4,000,000 Cancara Asset Securitisation LLC^††(p) 0.19 03/15/2010 3,999,68910,000,000 Cancara Asset Securitisation LLC^††(p) 0.19 03/22/2010 9,998,83315,000,000 Cancara Asset Securitisation LLC^††(p) 0.19 03/23/2010 14,998,167
3,000,000 Cancara Asset Securitisation LLC^††(p) 0.21 04/07/2010 2,999,32217,000,000 Cancara Asset Securitisation LLC^††(p) 0.22 05/12/2010 16,992,52020,000,000 Cancara Asset Securitisation LLC^††(p) 0.22 05/17/2010 19,990,589
3,000,000 Cancara Asset Securitisation LLC^††(p) 0.22 05/18/2010 2,998,57018,000,000 Cancara Asset Securitisation LLC^††(p) 0.22 05/20/2010 17,991,20030,000,000 Cancara Asset Securitisation LLC^††(p) 0.23 03/30/2010 29,994,44212,000,000 Cancara Asset Securitisation LLC^††(p) 0.23 04/05/2010 11,997,20024,000,000 Cancara Asset Securitisation LLC^††(p) 0.23 04/19/2010 23,992,48712,000,000 Cancara Asset Securitisation LLC^††(p) 0.19 03/18/2010 11,998,86735,000,000 Cancara Asset Securitisation LLC^††(p) 0.22 04/23/2010 34,988,66415,000,000 Charta LLC^††(p) 0.19 04/07/2010 14,996,917
2,250,000 Charta LLC^††(p) 0.19 04/19/2010 2,249,4189,000,000 Charta LLC^††(p) 0.20 04/12/2010 8,997,900
37,000,000 Charta LLC^††(p) 0.20 05/03/2010 36,987,05023,000,000 Charta LLC^††(p) 0.20 05/06/2010 22,991,567
4,000,000 Charta LLC^††(p) 0.20 05/12/2010 3,998,40015,000,000 Ciesco LLC^††(p) 0.19 04/05/2010 14,997,083
4,000,000 Ciesco LLC^††(p) 0.19 04/13/2010 3,999,09219,000,000 Ciesco LLC^††(p) 0.20 05/03/2010 18,993,35019,000,000 Ciesco LLC^††(p) 0.20 05/04/2010 18,993,24418,000,000 Ciesco LLC^††(p) 0.20 05/05/2010 17,993,50013,000,000 Ciesco LLC^††(p) 0.20 05/20/2010 12,994,222
3,000,000 Ciesco LLC^††(p) 0.20 05/25/2010 2,998,5833,000,000 Ciesco LLC^††(p) 0.20 05/26/2010 2,998,567
97,000,000 Citibank Credit Card Issuance Trust^††(p) 0.16 03/05/2010 96,997,90620,000,000 Citibank Credit Card Issuance Trust^††(p) 0.17 03/08/2010 19,999,26133,000,000 Citibank Credit Card Issuance Trust^††(p) 0.20 04/05/2010 32,993,26310,000,000 Citibank Credit Card Issuance Trust^††(p) 0.12 03/02/2010 9,999,93113,000,000 Clipper Receivables Company LLC^††(p) 0.22 04/23/2010 12,995,790
3,000,000 Commonwealth Bank of Australia^†† 0.20 05/10/2010 2,998,83310,000,000 Concord Minutemen Capital Company^††(p) 0.00 03/01/2010 10,000,000
7,000,000 Concord Minutemen Capital Company^††(p) 0.44 05/05/2010 6,994,31311,000,000 Concord Minutemen Capital Company^††(p) 0.44 05/10/2010 10,990,375
185,000,000 Concord Minutemen Capital Company^††(p) 0.33 03/03/2010 184,994,8617,000,000 CRC Funding LLC^††(p) 0.19 04/14/2010 6,998,3742,000,000 CRC Funding LLC^††(p) 0.19 04/15/2010 1,999,525
15,000,000 CRC Funding LLC^††(p) 0.19 04/16/2010 14,996,3581,000,000 CRC Funding LLC^††(p) 0.19 04/27/2010 999,6993,500,000 CRC Funding LLC^††(p) 0.20 04/09/2010 3,499,2428,000,000 CRC Funding LLC^††(p) 0.20 04/13/2010 7,998,089
35,250,000 CRC Funding LLC^††(p) 0.20 05/03/2010 35,237,6639,000,000 Crown Point Capital Company^††(p) 0.44 04/09/2010 8,995,613
PRIME INVESTMENT MONEY MARKET FUND
Principal Security Name Interest Rate Maturity Date Value

98 Wells Fargo Advantage Money Market Funds Portfolio of Investments—February 28, 2010
PRIME INVESTMENT MONEY MARKET FUND
Principal Security Name Interest Rate Maturity Date Value
Commercial Paper (continued)$ 44,000,000 Crown Point Capital Company^††(p) 0.44% 04/15/2010 $ 43,975,250
5,000,000 Crown Point Capital Company^††(p) 0.44 04/21/2010 4,996,81384,000,000 Crown Point Capital Company^††(p) 0.44 04/27/2010 83,940,15045,000,000 Crown Point Capital Company^††(p) 0.44 05/06/2010 44,962,875
7,000,000 Crown Point Capital Company^††(p) 0.45 04/13/2010 6,996,23822,000,000 Crown Point Capital Company^††(p) 0.45 05/19/2010 21,978,27510,000,000 Crown Point Capital Company^††(p) 0.45 05/21/2010 9,989,87527,000,000 Danske Corporation^†† 0.19 03/29/2010 26,995,80011,000,000 Danske Corporation^†† 0.19 04/07/2010 10,997,73924,000,000 Dexia Delaware^ 0.14 03/02/2010 23,999,81363,000,000 Dexia Delaware^ 0.17 03/04/2010 62,998,84531,000,000 Dexia Delaware^ 0.25 03/10/2010 30,997,83029,000,000 Dexia Delaware^ 0.26 03/12/2010 28,997,47525,000,000 DnB Nor Bank ASA^†† 0.27 05/25/2010 24,984,06336,000,000 DnB Nor Bank ASA^†† 0.27 05/28/2010 35,976,24046,000,000 E.ON AG^†† 0.23 05/18/2010 45,977,07729,000,000 Ebbets Funding LLC^††(p) 0.48 03/23/2010 28,991,13913,000,000 Ebbets Funding LLC^††(p) 0.48 03/25/2010 12,995,66713,000,000 Ebbets Funding LLC^††(p) 0.48 03/26/2010 12,995,486
8,000,000 Elysian Funding LLC^††(p) 0.36 03/05/2010 7,999,60011,000,000 Elysian Funding LLC^††(p) 0.40 03/09/2010 10,998,900
6,000,000 Elysian Funding LLC^††(p) 0.43 03/19/2010 5,998,6504,000,000 ENI Coordination Center SA^†† 0.12 03/03/2010 3,999,9602,000,000 Enterprise Funding LLC^††(p) 0.17 03/18/2010 1,999,8302,000,000 Enterprise Funding LLC^††(p) 0.19 04/21/2010 1,999,4629,000,000 Enterprise Funding LLC^††(p) 0.22 04/12/2010 8,997,6903,500,000 Erasmus Capital Corporation^††(p) 0.00 03/01/2010 3,500,0004,000,000 Erasmus Capital Corporation^††(p) 0.14 03/04/2010 3,999,937
11,000,000 Erasmus Capital Corporation^††(p) 0.15 03/05/2010 10,999,7684,500,000 Erasmus Capital Corporation^††(p) 0.17 03/10/2010 4,499,7864,000,000 Erasmus Capital Corporation^††(p) 0.21 03/25/2010 3,999,413
22,000,000 Erasmus Capital Corporation^††(p) 0.22 04/09/2010 21,994,51851,000,000 Erasmus Capital Corporation^††(p) 0.24 04/22/2010 50,982,32012,000,000 Fairway Finance Corporation^††(p) 0.15 03/11/2010 11,999,433
7,000,000 Fairway Finance Corporation^††(p) 0.19 04/05/2010 6,998,6393,000,000 GDF Suez^†† 0.17 03/19/2010 2,999,7303,000,000 GDF Suez^†† 0.17 03/22/2010 2,999,6853,000,000 GDF Suez^†† 0.17 03/23/2010 2,999,670
10,808,000 Gemini Securitization Corporation LLC^††(p) 0.18 04/19/2010 10,805,3279,000,000 Gemini Securitization Corporation LLC^††(p) 0.18 04/26/2010 8,997,480
47,000,000 Gemini Securitization Corporation LLC^††(p) 0.19 04/29/2010 46,984,9805,000,000 Gotham Funding Corporation^††(p) 0.11 03/03/2010 4,999,953
12,000,000 Gotham Funding Corporation^††(p) 0.17 03/23/2010 11,998,68027,000,000 Gotham Funding Corporation^††(p) 0.17 03/24/2010 26,996,895
3,000,000 Govco LLC^††(p) 0.19 04/12/2010 2,999,3354,000,000 Govco LLC^††(p) 0.20 04/15/2010 3,999,0007,000,000 Govco LLC^††(p) 0.20 04/21/2010 6,998,0179,000,000 Govco LLC^††(p) 0.20 04/26/2010 8,997,200
26,000,000 Govco LLC^††(p) 0.20 04/27/2010 25,991,76712,600,000 Govco LLC^††(p) 0.20 04/28/2010 12,595,940
4,000,000 Govco LLC^††(p) 0.20 05/11/2010 3,998,42225,000,000 Govco LLC^††(p) 0.20 05/18/2010 24,989,16791,000,000 Govco LLC^††(p) 0.00 03/01/2010 91,000,00027,000,000 Grampian Funding^††(p) 0.21 03/19/2010 26,997,03010,000,000 Grampian Funding^††(p) 0.24 03/22/2010 9,998,542

Portfolio of Investments—February 28, 2010 Wells Fargo Advantage Money Market Funds 99
PRIME INVESTMENT MONEY MARKET FUND
Principal Security Name Interest Rate Maturity Date Value
Commercial Paper (continued)$ 20,000,000 Grampian Funding^††(p) 0.26% 04/22/2010 $ 19,992,489
25,000,000 Grampian Funding^††(p) 0.26 04/23/2010 24,990,43110,000,000 Grampian Funding^††(p) 0.26 05/04/2010 9,995,37812,000,000 Grampian Funding^††(p) 0.26 05/07/2010 11,994,19362,000,000 Grampian Funding^††(p) 0.26 05/20/2010 61,964,17837,000,000 Grampian Funding^††(p) 0.26 05/21/2010 36,978,355
8,000,000 Grampian Funding^††(p) 0.28 04/13/2010 7,997,22925,500,000 Grampian Funding^††(p) 0.28 04/15/2010 25,490,757
6,000,000 Grampian Funding^††(p) 0.29 03/17/2010 5,999,1732,000,000 Grampian Funding^††(p) 0.29 04/01/2010 1,999,4834,000,000 Grampian Funding^††(p) 0.29 04/08/2010 3,998,733
10,000,000 ICICI Bank Limited (Bahrain)^ 0.23 03/15/2010 9,999,0288,750,000 ICICI Bank Limited (Bahrain)^ 0.50 07/15/2010 8,733,4728,500,000 ICICI Bank Limited (Bahrain)^ 0.50 07/15/2010 8,483,944
21,000,000 ICICI Bank Limited (Bahrain)^ 0.50 08/05/2010 20,954,2087,700,000 ICICI Bank Limited (Bahrain)^ 0.71 03/09/2010 7,698,631
26,000,000 ING USA Funding LLC^ 0.16 03/12/2010 25,998,64912,000,000 ING USA Funding LLC^ 0.16 03/16/2010 11,999,15029,000,000 Intesa Funding LLC^ 0.15 03/11/2010 28,998,71110,028,000 Kitty Hawk Funding Corporation^††(p) 0.19 05/05/2010 10,024,56042,000,000 Kitty Hawk Funding Corporation^††(p) 0.22 05/24/2010 41,978,55711,000,000 Legacy Capital LLC^††(p) 0.44 04/13/2010 10,994,08871,000,000 Legacy Capital LLC^††(p) 0.44 04/22/2010 70,953,85023,000,000 Lexington Parker Capital^††(p) 0.44 04/16/2010 22,986,775
1,000,000 Lexington Parker Capital^††(p) 0.44 04/21/2010 999,3635,000,000 Lexington Parker Capital^††(p) 0.44 05/05/2010 4,995,938
20,000,000 Lexington Parker Capital^††(p) 0.44 05/07/2010 19,983,2508,000,000 Lexington Parker Capital^††(p) 0.44 05/11/2010 7,992,900
31,000,000 Lexington Parker Capital^††(p) 0.40 03/05/2010 30,998,27819,000,000 Liberty Street Funding LLC^††(p) 0.00 03/01/2010 19,000,000
7,000,000 Liberty Street Funding LLC^††(p) 0.19 05/04/2010 6,997,6367,000,000 Liberty Street Funding LLC^††(p) 0.20 05/05/2010 6,997,472
17,000,000 LMA Americas LLC^††(p) 0.14 03/05/2010 16,999,6798,000,000 LMA Americas LLC^††(p) 0.17 03/22/2010 7,999,1609,750,000 LMA Americas LLC^††(p) 0.17 03/23/2010 9,748,928
38,700,000 LMA Americas LLC^††(p) 0.19 04/14/2010 38,691,0138,000,000 LMA Americas LLC^††(p) 0.20 03/15/2010 7,999,3473,000,000 Los Angeles CA Department of Airports^ 0.25 05/03/2010 2,998,688
12,000,000 Louis Dreyfus Corporation^ 0.00 03/01/2010 12,000,0003,000,000 Louis Dreyfus Corporation^ 0.28 03/19/2010 2,999,5505,000,000 Louis Dreyfus Corporation^ 0.31 04/09/2010 4,998,2673,000,000 Louis Dreyfus Corporation^ 0.31 04/16/2010 2,998,773
10,000,000 Louis Dreyfus Corporation^ 0.31 04/16/2010 9,995,91122,000,000 Louis Dreyfus Corporation^ 0.32 04/27/2010 21,988,853
1,000,000 Market Street Funding LLC^††(p) 0.19 03/18/2010 999,9101,000,000 Market Street Funding LLC^††(p) 0.19 03/05/2010 999,998
24,000,000 Matchpoint Master Trust^††(p) 0.19 04/06/2010 23,995,2002,000,000 Matchpoint Master Trust^††(p) 0.20 05/24/2010 1,999,067
13,000,000 Mont Blanc Capital Corporation^††(p) 0.15 03/09/2010 12,999,5096,000,000 Mont Blanc Capital Corporation^††(p) 0.17 03/25/2010 5,999,280
14,000,000 Mont Blanc Capital Corporation^††(p) 0.18 03/12/2010 13,999,1459,000,000 Mont Blanc Capital Corporation^††(p) 0.18 03/16/2010 8,999,2883,000,000 Mont Blanc Capital Corporation^††(p) 0.20 05/12/2010 2,998,800
33,750,000 Mont Blanc Capital Corporation^††(p) 0.20 03/09/2010 33,748,35026,000,000 Nationwide Building Society^†† 0.20 04/16/2010 25,993,356
100,000,000 Nationwide Building Society^†† 0.39 04/05/2010 99,961,111

100 Wells Fargo Advantage Money Market Funds Portfolio of Investments—February 28, 2010
PRIME INVESTMENT MONEY MARKET FUND
Principal Security Name Interest Rate Maturity Date Value
Commercial Paper (continued)$ 2,000,000 Nationwide Building Society^†† 0.50% 05/06/2010 $ 1,998,130
15,000,000 Natixis Commercial Paper Corporation^†† 0.26 05/18/2010 14,991,55075,000,000 Natixis US Finance Company^ 0.26 04/13/2010 74,976,260
111,000,000 Natixis US Finance Company^ 0.28 05/06/2010 110,943,0206,000,000 Newport Funding Corporation†† 0.17 03/23/2010 5,999,3402,000,000 Nieuw Amsterdam Receivables Corporation^††(p) 0.16 03/05/2010 1,999,956
19,000,000 Nieuw Amsterdam Receivables Corporation^††(p) 0.19 03/18/2010 18,998,2067,000,000 Nieuw Amsterdam Receivables Corporation^††(p) 0.20 04/14/2010 6,998,2893,000,000 Nieuw Amsterdam Receivables Corporation^††(p) 0.21 04/15/2010 2,999,2135,700,000 Nordea North America Incorporated^ 0.16 03/17/2010 5,699,5697,000,000 Oakland-Alameda County± 0.20 03/02/2010 7,000,000
28,000,000 Prudential plc^†† 0.23 05/12/2010 27,987,120140,000,000 Prudential plc^†† 0.00 03/01/2010 140,000,000
22,664,000 Ranger Funding Company LLC^††(p) 0.19 04/26/2010 22,657,3026,000,000 Ranger Funding Company LLC^††(p) 0.20 05/03/2010 5,997,900
21,000,000 Ranger Funding Company LLC^††(p) 0.20 05/13/2010 20,991,4832,000,000 Ranger Funding Company LLC^††(p) 0.21 05/26/2010 1,998,9973,000,000 Ranger Funding Company LLC^††(p) 0.22 04/21/2010 2,999,065
18,000,000 Regency Markets #1 LLC^††(p) 0.13 03/05/2010 17,999,6802,878,000 Regency Markets #1 LLC^††(p) 0.16 03/08/2010 2,877,899
31,000,000 Regency Markets #1 LLC^††(p) 0.17 03/22/2010 30,996,7452,000,000 Regency Markets #1 LLC^††(p) 0.17 03/24/2010 1,999,7706,000,000 Rhein-Main Security Limited^††(p) 0.18 03/05/2010 5,999,853
12,000,000 Rhein-Main Security Limited^††(p) 0.18 03/26/2010 11,998,41713,000,000 Rhein-Main Security Limited^††(p) 0.23 03/29/2010 12,997,57327,090,000 Rhein-Main Security Limited^††(p) 0.24 04/12/2010 27,082,09956,000,000 Rhein-Main Security Limited^††(p) 0.27 05/17/2010 55,967,66047,000,000 Rhein-Main Security Limited^††(p) 0.28 05/20/2010 46,970,756
2,000,000 Rheingold Securitization^††(p) 0.23 04/20/2010 1,999,36142,000,000 Rheingold Securitization^††(p) 0.24 03/22/2010 41,993,87518,000,000 Rheingold Securitization^††(p) 0.24 03/29/2010 17,996,578
6,000,000 Rheingold Securitization^††(p) 0.24 04/12/2010 5,998,2506,000,000 Rheingold Securitization^††(p) 0.27 05/17/2010 5,996,5355,000,000 Rheingold Securitization^††(p) 0.29 03/31/2010 4,998,7501,000,000 Romulus Funding Corporation^††(p) 0.15 03/04/2010 999,9838,000,000 Romulus Funding Corporation^††(p) 0.25 03/05/2010 7,999,7246,000,000 Romulus Funding Corporation^††(p) 0.25 03/15/2010 5,999,3702,000,000 Romulus Funding Corporation^††(p) 0.26 03/25/2010 1,999,6405,000,000 Romulus Funding Corporation^††(p) 0.29 03/26/2010 4,998,958
11,000,000 Romulus Funding Corporation^††(p) 0.29 03/30/2010 10,997,34224,000,000 Romulus Funding Corporation^††(p) 0.29 04/20/2010 23,990,00024,000,000 Romulus Funding Corporation^††(p) 0.32 05/18/2010 23,983,36013,000,000 Royal KPN NV±††(p) 0.21 03/23/2010 12,998,33217,000,000 Royal KPN NV±(p) 0.22 05/11/2010 16,992,62430,000,000 Royal Park Investment Funding Corporation±††(p) 0.21 03/25/2010 29,995,800
2,000,000 Salisbury Receivables Company LLC^††(p) 0.16 03/16/2010 1,999,85826,000,000 Salisbury Receivables Company LLC^††(p) 0.17 03/18/2010 25,997,79028,000,000 Salisbury Receivables Company LLC^††(p) 0.18 04/13/2010 27,993,980
9,000,000 Salisbury Receivables Company LLC^††(p) 0.20 05/03/2010 8,996,8501,000,000 San Jose City CA International Airport± 0.28 03/11/2010 1,000,0001,000,000 San Jose City CA International Airport± 0.28 03/11/2010 1,000,000
34,000,000 Santander Central Hispano Finance (Delaware) Incorporated^ 0.60 06/15/2010 33,939,93312,000,000 Scaldis Capital LLC^††(p) 0.16 03/08/2010 11,999,580
2,000,000 Scaldis Capital LLC^††(p) 0.21 03/23/2010 1,999,7314,000,000 Scaldis Capital LLC^††(p) 0.22 04/09/2010 3,999,003

Portfolio of Investments—February 28, 2010 Wells Fargo Advantage Money Market Funds 101
Commercial Paper (continued)$ 8,000,000 Scaldis Capital LLC^††(p) 0.22% 04/13/2010 $ 7,997,898
12,000,000 Scaldis Capital LLC^††(p) 0.22 04/15/2010 11,996,7004,000,000 Scaldis Capital LLC^††(p) 0.22 04/19/2010 3,998,8024,000,000 Scaldis Capital LLC^††(p) 0.22 04/22/2010 3,998,729
17,000,000 Scaldis Capital LLC^††(p) 0.22 04/28/2010 16,993,97420,000,000 Scaldis Capital LLC^††(p) 0.22 04/29/2010 19,992,78933,000,000 Scaldis Capital LLC^††(p) 0.22 05/05/2010 32,986,891
2,000,000 Scaldis Capital LLC^††(p) 0.23 04/12/2010 1,999,46325,000,000 Scaldis Capital LLC^††(p) 0.23 04/27/2010 24,990,89645,000,000 Scaldis Capital LLC^††(p) 0.23 05/11/2010 44,979,58812,000,000 Scaldis Capital LLC^††(p) 0.23 05/12/2010 11,994,480
4,000,000 Sheffield Receivables Corporation^††(p) 0.18 04/08/2010 3,999,2405,000,000 Sheffield Receivables Corporation^††(p) 0.19 04/13/2010 4,998,8654,000,000 Sheffield Receivables Corporation^††(p) 0.19 04/19/2010 3,998,966
11,000,000 Sheffield Receivables Corporation^††(p) 0.19 04/23/2010 10,996,92319,300,000 Sheffield Receivables Corporation^††(p) 0.19 04/28/2010 19,294,09219,000,000 Sheffield Receivables Corporation^††(p) 0.19 04/29/2010 18,994,08418,000,000 Sheffield Receivables Corporation^††(p) 0.20 05/06/2010 17,993,40016,000,000 Sheffield Receivables Corporation^††(p) 0.21 06/03/2010 15,991,22716,500,000 Societe de Prise Participation de l’Etat^†† 0.19 05/11/2010 16,493,817
135,000,000 Societe de Prise Participation de l’Etat^†† 0.20 05/18/2010 134,940,0387,000,000 Societe de Prise Participation de l’Etat^†† 0.21 06/18/2010 6,995,5493,000,000 Societe Financement de L’economie Francaise^ 0.13 03/04/2010 2,999,958
42,000,000 Societe Financement de L’economie Francaise^ 0.23 04/07/2010 41,989,64026,000,000 Societe Financement de L’economie Francaise^ 0.25 04/07/2010 25,993,45316,000,000 Solitaire Funding LLC^††(p) 0.20 03/25/2010 15,997,760
8,000,000 Solitaire Funding LLC^††(p) 0.23 04/20/2010 7,997,44487,000,000 Solitaire Funding LLC^††(p) 0.24 04/22/2010 86,969,84050,000,000 Solitaire Funding LLC^††(p) 0.25 05/20/2010 49,972,22259,000,000 Solitaire Funding LLC^††(p) 0.31 03/19/2010 58,990,265
9,000,000 Starbird Funding Corporation^††(p) 0.20 04/09/2010 8,998,05018,000,000 Starbird Funding Corporation^††(p) 0.20 04/22/2010 17,994,800
4,000,000 Starbird Funding Corporation^††(p) 0.20 05/11/2010 3,998,42212,000,000 Sumitomo Trust & Banking Company^ 0.13 03/03/2010 11,999,867
2,000,000 Surrey Funding Corporation^††(p) 0.19 04/12/2010 1,999,5576,000,000 Surrey Funding Corporation^††(p) 0.19 04/13/2010 5,998,6383,000,000 Surrey Funding Corporation^††(p) 0.20 04/21/2010 2,999,1506,000,000 Surrey Funding Corporation^††(p) 0.20 04/26/2010 5,998,133
10,000,000 Surrey Funding Corporation^††(p) 0.20 05/05/2010 9,996,3896,000,000 Svenska Handelsbanken Incorporated^ 0.20 04/08/2010 5,998,765
40,000,000 Tasman Funding Incorporated^††(p) 0.20 03/17/2010 39,996,2674,000,000 Tasman Funding Incorporated^††(p) 0.20 03/26/2010 3,999,417
12,000,000 Tasman Funding Incorporated^††(p) 0.23 03/12/2010 11,999,08317,000,000 Tasman Funding Incorporated^††(p) 0.23 04/14/2010 16,995,038
1,000,000 Tasman Funding Incorporated^††(p) 0.24 04/27/2010 999,6202,000,000 Tasman Funding Incorporated^††(p) 0.25 04/12/2010 1,999,393
11,000,000 Thames Asset Global Securitization # 1 Incorporated^††(p) 0.19 04/08/2010 10,997,79413,000,000 Thames Asset Global Securitization # 1 Incorporated^††(p) 0.17 03/22/2010 12,998,635
2,384,000 Thames Asset Global Securitization # 1 Incorporated^††(p) 0.19 04/19/2010 2,383,3836,000,000 Thames Asset Global Securitization # 1 Incorporated^††(p) 0.19 04/26/2010 5,998,227
40,746,000 Thames Asset Global Securitization # 1 Incorporated^††(p) 0.24 06/07/2010 40,718,8629,000,000 Thames Asset Global Securitization #1 Incorporated^††(p) 0.17 03/24/2010 8,998,9651,000,000 Thames Asset Global Securitization #1 Incorporated^††(p) 0.20 04/07/2010 999,7942,619,000 Thames Asset Global Securitization #1 Incorporated^††(p) 0.20 04/09/2010 2,618,432
14,000,000 Thames Asset Global Securitization #1Incorporated^††(p) 0.23 03/15/2010 13,998,74813,000,000 Ticonderoga Funding LLC^††(p) 0.09 03/02/2010 12,999,938
PRIME INVESTMENT MONEY MARKET FUND
Principal Security Name Interest Rate Maturity Date Value

102 Wells Fargo Advantage Money Market Funds Portfolio of Investments—February 28, 2010
Commercial Paper (continued)$ 4,400,000 Toyota Motor Credit Corporation^ 0.19% 04/21/2010 $ 4,398,816
3,000,000 Toyota Motor Credit Corporation^ 0.19 04/22/2010 2,999,17718,000,000 Toyota Motor Credit Corporation^ 0.21 04/26/2010 17,994,12050,500,000 Toyota Motor Credit Corporation^ 0.23 05/05/2010 50,479,02828,000,000 Toyota Motor Credit Corporation^ 0.24 03/29/2010 27,994,556
3,370,000 Tulip Funding Corporation^††(p) 0.15 03/10/2010 3,369,85723,000,000 Tulip Funding Corporation^††(p) 0.19 04/08/2010 22,995,302
5,000,000 Tulip Funding Corporation^††(p) 0.19 04/08/2010 4,998,99711,000,000 Tulip Funding Corporation^††(p) 0.20 04/09/2010 10,997,61746,000,000 UBS Finance Delaware LLC^ 0.26 04/05/2010 45,987,92528,000,000 Unicredit Delaware Incorporated^†† 0.20 03/15/2010 27,997,71339,000,000 UniCredito Italiano Bank Ireland^†† 0.29 04/06/2010 38,988,300
1,000,000 Versailles Commercial Paper LLC^††(p) 0.18 03/23/2010 999,88414,000,000 Versailles Commercial Paper LLC^††(p) 0.28 03/05/2010 13,999,45624,000,000 Victory Receivables Corporation^††(p) 0.13 03/04/2010 23,999,660
9,000,000 Victory Receivables Corporation^††(p) 0.14 03/08/2010 8,999,72012,000,000 Victory Receivables Corporation^††(p) 0.14 03/09/2010 11,999,57340,000,000 Westpac Securities NZ Limited±†† 0.30 08/20/2010 40,000,00037,000,000 Westpac Securities NZ Limited±†† 0.35 11/05/2010 37,000,000
2,500,000 Windmill Funding Corporation^††(p) 0.09 03/02/2010 2,499,9886,000,000 Windmill Funding Corporation^††(p) 0.15 03/17/2010 5,999,5733,438,000 Windmill Funding Corporation^††(p) 0.16 03/18/2010 3,437,7247,000,000 Windmill Funding Corporation^††(p) 0.18 04/07/2010 6,998,705
39,696,000 Yorktown Capital LLC^††(p) 0.19 04/26/2010 39,684,26814,238,000 Yorktown Capital LLC^††(p) 0.20 05/10/2010 14,232,46321,000,000 Yorktown Capital LLC^††(p) 0.20 05/17/2010 20,990,99810,000,000 Yorktown Capital LLC^††(p) 0.22 04/12/2010 9,997,43312,000,000 Yorktown Capital LLC^††(p) 0.23 04/20/2010 11,996,167
Total Commercial Paper (Cost $6,742,894,133) 6,742,894,133
Corporate Bonds & Notes: 2.53%18,000,000 American Honda Finance Corporation Series MTN±†† 0.35 04/20/2010 18,003,18735,000,000 BBVA US Senior SAU±†† 0.30 03/12/2010 35,000,51627,000,000 Berkshire Hathaway Incorporated± 0.23 02/10/2011 27,000,00033,000,000 Citibank NA± 0.30 09/30/2010 33,000,000
3,000,000 Citigroup Funding Incorporated± 1.30 05/07/2010 3,004,90230,000,000 Commonwealth Bank (Australia)±†† 0.35 06/24/2010 30,000,00090,000,000 Commonwealth Bank (Australia)±†† 0.36 06/04/2010 90,000,000
3,500,000 Credit Agricole SA (London)±†† 0.30 05/28/2010 3,498,6882,500,000 Danske Bank A/S 1.53 04/24/2010 2,504,6395,000,000 General Electric Capital Corporation±§ 0.38 03/11/2011 5,007,395
28,000,000 Santander US Debt SA Unipersonal±†† 0.30 07/23/2010 27,983,8614,000,000 Seariver Maritime Incorporated(i)±§ 0.60 10/01/2011 4,000,000
Total Corporate Bonds & Notes (Cost $279,003,188) 279,003,188
Medium Term Notes: 1.94%10,000,000 Bear Stearns Company± 0.37 05/18/2010 10,001,04935,000,000 BNP Paribas± 0.58 03/10/2010 35,003,24135,000,000 Eksportfinans ASA± 0.30 08/03/2010 35,000,00015,000,000 Eksportfinans ASA± 0.32 09/22/2010 15,000,00019,000,000 Eksportfinans ASA± 0.70 06/11/2010 19,000,00060,000,000 JPMorgan Chase & Company± 0.29 05/07/2010 60,007,49740,000,000 US Bancorp± 0.66 06/04/2010 40,047,973
Total Medium Term Notes (Cost $214,059,760) 214,059,760
PRIME INVESTMENT MONEY MARKET FUND
Principal Security Name Interest Rate Maturity Date Value

Portfolio of Investments—February 28, 2010 Wells Fargo Advantage Money Market Funds 103
Municipal Bonds & Notes: 7.24%$ 9,585,000 Academy of The New Church (Other Revenue)±§ 0.23% 02/01/2025 $ 9,585,000
4,900,000 Baltimore MD Package Systems Facilities (Parking Facilities Revenue, Bank of America NA LOC)±§ 0.22 07/01/2032 4,900,000
2,000,000 Big Bear Lake CA Southwest Gas Corporation Project Series A (IDR, KBC Bank NV LOC)±§ 0.21 12/01/2028 2,000,000
9,000,000 Calcasieu Parish LA Incorporated Industrial Development Board Environmental Revenue Citgo Petroleum Corporation (IDR, Natixis LOC)±§ 0.13 07/01/2026 9,000,000
3,000,000 California HFA Revenue Housing Program Series A (Housing Revenue, Fortis Banque LOC)±§ 0.20 08/01/2036 3,000,000
3,000,000 California HFFA Catholic Healthcare Series L (HCFR, Citibank NA LOC)±§ 0.18 07/01/2033 3,000,00036,900,000 California Stanford Hospital Series B (Recreational Revenue,
JPMorgan Chase Bank LOC)±§ 0.11 06/01/2034 36,900,00010,400,000 California State DWR Power Supply Revenue Series C 7 (Electric, Power &
Light Revenue, AGM Insured)±§ 0.25 05/01/2022 10,400,0009,000,000 California State DWR Power Supply Revenue Series C1 (Power Revenue,
Dexia Credit Local de France LOC)±§ 0.19 05/01/2022 9,000,00016,100,000 California State DWR Power Supply Revenue Series C13 (Utilities Revenue,
First Security Bank LOC)±§ 0.21 05/01/2022 16,100,0008,000,000 California State DWR Power Supply Revenue Series C9
(Electric Revenue, Citibank NA LOC)±§ 0.16 05/01/2022 8,000,00020,000,000 California State Economic Recovery Revenue Series C-5
(Other Revenue, Bank of America NA LOC)±§ 0.14 07/01/2023 20,000,0007,000,000 California State Series B (Other Revenue, JPMorgan Chase Bank LOC)±§ 0.15 05/01/2040 7,000,000
23,000,000 California State Series B Subseries B1 (Other Revenue, Bank of America NA LOC)±§ 0.20 05/01/2040 23,000,0006,000,000 California State Series B5 (Other Revenue, Citibank NA LOC)±§ 0.16 05/01/2034 6,000,0005,000,000 California Statewide CDA John Muir Health Series A
(Hospital Revenue, UBS AG LOC)±§ 0.11 08/15/2036 5,000,00014,725,000 Colorado Housing & Finance Authority Class I-B1
(Housing Revenue, GO of Authority Insured)±§ 0.23 10/01/2038 14,725,00019,990,000 Colorado Housing & Finance Authority Taxable Multifamily Project B II
(Housing Revenue, FNMA Insured)±§ 0.22 05/01/2049 19,990,0006,400,000 Cook County IL (Other Revenue, Harris Trust & Savings Bank LOC)±§ 0.23 11/01/2030 6,400,0003,600,000 Cook County IL (Other Revenue, Northern Trust Corporation LOC)±§ 0.23 11/01/2030 3,600,000
10,000,000 Delaware State Economic Development Authority (Resource Recovery Revenue)±§ 0.17 08/01/2029 10,000,00040,000,000 Denver CO City & County School District Taxable Series A
(Lease Revenue, AGM Insured)±§ 0.31 12/15/2037 40,000,0005,000,000 Escambia County FL Solid Waste Disposal System Gulf Power Company Project 2nd
Series (Resource Recovery Revenue)±§ 0.16 04/01/2039 5,000,0008,000,000 Gregg County TX Health Facilities Development Corporation Good Shepherd Series C
(HCFR, Radian Insured)±§ 0.13 10/01/2029 8,000,00028,440,000 Harris County Health Facilities Development Corporation Various Baylor College
Medicine Series B (College & University Revenue, JPMorgan Chase Bank LOC)±§ 0.14 11/15/2047 28,440,00020,000,000 Harris County TX Health Facilities Development Corporation Baylor Series A2
(College and University Revenue, AMBAC Insured)±§ 0.14 11/15/2047 20,000,00015,000,000 Harris County TX Industrial Development Corporation Deer Park Refining
(Resource Recovery Revenue)±§ 0.14 03/01/2023 15,000,00011,000,000 Houston TX Utility System First Lien B2 (Water & Sewer Revenue,
Bank of America NA LOC)±§ 0.19 05/15/2034 11,000,0008,900,000 Houston TX Utility System First Lien B3 (Water & Sewer Revenue,
Bank of America NA LOC)±§ 0.19 05/15/2034 8,900,00017,290,000 Iowa Financial Authority SFMR (Housing Revenue, GNMA Insured)±§ 0.20 01/01/2039 17,290,00040,000,000 Kentucky Incorporated Public Energy Authority Series A
(Other Revenue, Societe Generale LOC)±§ 0.13 08/01/2016 40,000,0001,970,000 King County WA Housing Authority Series A (Housing Revenue, FHLMC Insured)±§ 0.20 07/01/2035 1,970,000
10,000,000 Lancaster County PA Hospital Authority Health System Lancaster General Hospital (Hospital Revenue, Bank of America NA LOC)±§ 0.20 07/01/2041 10,000,000
PRIME INVESTMENT MONEY MARKET FUND
Principal Security Name Interest Rate Maturity Date Value
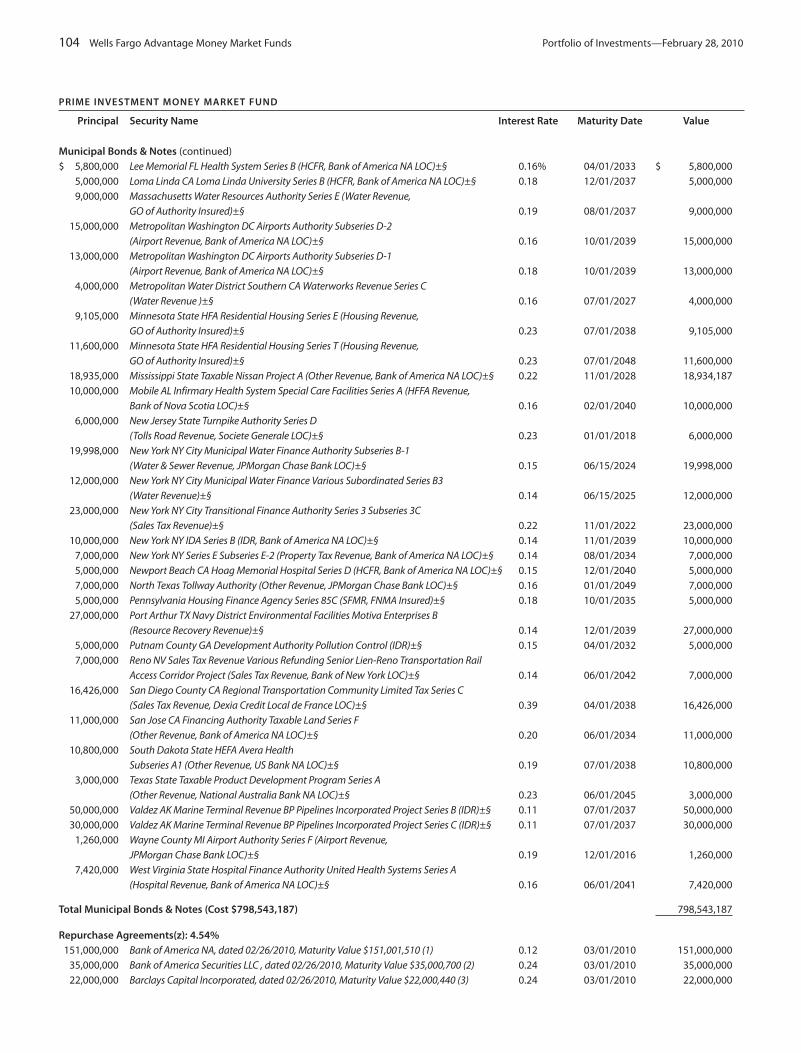
104 Wells Fargo Advantage Money Market Funds Portfolio of Investments—February 28, 2010
Municipal Bonds & Notes (continued)$ 5,800,000 Lee Memorial FL Health System Series B (HCFR, Bank of America NA LOC)±§ 0.16% 04/01/2033 $ 5,800,000
5,000,000 Loma Linda CA Loma Linda University Series B (HCFR, Bank of America NA LOC)±§ 0.18 12/01/2037 5,000,0009,000,000 Massachusetts Water Resources Authority Series E (Water Revenue,
GO of Authority Insured)±§ 0.19 08/01/2037 9,000,00015,000,000 Metropolitan Washington DC Airports Authority Subseries D-2
(Airport Revenue, Bank of America NA LOC)±§ 0.16 10/01/2039 15,000,00013,000,000 Metropolitan Washington DC Airports Authority Subseries D-1
(Airport Revenue, Bank of America NA LOC)±§ 0.18 10/01/2039 13,000,0004,000,000 Metropolitan Water District Southern CA Waterworks Revenue Series C
(Water Revenue )±§ 0.16 07/01/2027 4,000,0009,105,000 Minnesota State HFA Residential Housing Series E (Housing Revenue,
GO of Authority Insured)±§ 0.23 07/01/2038 9,105,00011,600,000 Minnesota State HFA Residential Housing Series T (Housing Revenue,
GO of Authority Insured)±§ 0.23 07/01/2048 11,600,00018,935,000 Mississippi State Taxable Nissan Project A (Other Revenue, Bank of America NA LOC)±§ 0.22 11/01/2028 18,934,18710,000,000 Mobile AL Infirmary Health System Special Care Facilities Series A (HFFA Revenue,
Bank of Nova Scotia LOC)±§ 0.16 02/01/2040 10,000,0006,000,000 New Jersey State Turnpike Authority Series D
(Tolls Road Revenue, Societe Generale LOC)±§ 0.23 01/01/2018 6,000,00019,998,000 New York NY City Municipal Water Finance Authority Subseries B-1
(Water & Sewer Revenue, JPMorgan Chase Bank LOC)±§ 0.15 06/15/2024 19,998,00012,000,000 New York NY City Municipal Water Finance Various Subordinated Series B3
(Water Revenue)±§ 0.14 06/15/2025 12,000,00023,000,000 New York NY City Transitional Finance Authority Series 3 Subseries 3C
(Sales Tax Revenue)±§ 0.22 11/01/2022 23,000,00010,000,000 New York NY IDA Series B (IDR, Bank of America NA LOC)±§ 0.14 11/01/2039 10,000,000
7,000,000 New York NY Series E Subseries E-2 (Property Tax Revenue, Bank of America NA LOC)±§ 0.14 08/01/2034 7,000,0005,000,000 Newport Beach CA Hoag Memorial Hospital Series D (HCFR, Bank of America NA LOC)±§ 0.15 12/01/2040 5,000,0007,000,000 North Texas Tollway Authority (Other Revenue, JPMorgan Chase Bank LOC)±§ 0.16 01/01/2049 7,000,0005,000,000 Pennsylvania Housing Finance Agency Series 85C (SFMR, FNMA Insured)±§ 0.18 10/01/2035 5,000,000
27,000,000 Port Arthur TX Navy District Environmental Facilities Motiva Enterprises B (Resource Recovery Revenue)±§ 0.14 12/01/2039 27,000,000
5,000,000 Putnam County GA Development Authority Pollution Control (IDR)±§ 0.15 04/01/2032 5,000,0007,000,000 Reno NV Sales Tax Revenue Various Refunding Senior Lien-Reno Transportation Rail
Access Corridor Project (Sales Tax Revenue, Bank of New York LOC)±§ 0.14 06/01/2042 7,000,00016,426,000 San Diego County CA Regional Transportation Community Limited Tax Series C
(Sales Tax Revenue, Dexia Credit Local de France LOC)±§ 0.39 04/01/2038 16,426,00011,000,000 San Jose CA Financing Authority Taxable Land Series F
(Other Revenue, Bank of America NA LOC)±§ 0.20 06/01/2034 11,000,00010,800,000 South Dakota State HEFA Avera Health
Subseries A1 (Other Revenue, US Bank NA LOC)±§ 0.19 07/01/2038 10,800,0003,000,000 Texas State Taxable Product Development Program Series A
(Other Revenue, National Australia Bank NA LOC)±§ 0.23 06/01/2045 3,000,00050,000,000 Valdez AK Marine Terminal Revenue BP Pipelines Incorporated Project Series B (IDR)±§ 0.11 07/01/2037 50,000,00030,000,000 Valdez AK Marine Terminal Revenue BP Pipelines Incorporated Project Series C (IDR)±§ 0.11 07/01/2037 30,000,000
1,260,000 Wayne County MI Airport Authority Series F (Airport Revenue, JPMorgan Chase Bank LOC)±§ 0.19 12/01/2016 1,260,000
7,420,000 West Virginia State Hospital Finance Authority United Health Systems Series A (Hospital Revenue, Bank of America NA LOC)±§ 0.16 06/01/2041 7,420,000
Total Municipal Bonds & Notes (Cost $798,543,187) 798,543,187
Repurchase Agreements(z): 4.54%151,000,000 Bank of America NA, dated 02/26/2010, Maturity Value $151,001,510 (1) 0.12 03/01/2010 151,000,000
35,000,000 Bank of America Securities LLC , dated 02/26/2010, Maturity Value $35,000,700 (2) 0.24 03/01/2010 35,000,00022,000,000 Barclays Capital Incorporated, dated 02/26/2010, Maturity Value $22,000,440 (3) 0.24 03/01/2010 22,000,000
PRIME INVESTMENT MONEY MARKET FUND
Principal Security Name Interest Rate Maturity Date Value

Portfolio of Investments—February 28, 2010 Wells Fargo Advantage Money Market Funds 105
Repurchase Agreements (continued)$ 76,000,000 BNP Paribas Securities, dated 02/26/2010, Maturity Value $76,000,760 (4) 0.12% 03/01/2010 $ 76,000,000
76,000,000 Citigroup Global Markets, dated 02/26/2010, Maturity Value $76,000,760 (5) 0.12 03/01/2010 76,000,00057,000,000 Credit Suisse First Boston Corporation, dated 02/26/2010,
Maturity Value $57,000,570 (6) 0.12 03/01/2010 57,000,00041,600,000 Deutsche Bank Securities, dated 02/26/2010, Maturity Value $41,600,416 (7) 0.12 03/01/2010 41,600,00042,000,000 JPMorgan Securities, dated 02/26/2010, Maturity Value $42,000,840 (8) 0.24 03/01/2010 42,000,000
Total Repurchase Agreements (Cost $500,600,000) 500,600,000
Secured Master Note Agreement: 1.62%100,509,000 Bank of America Corporation±§ 0.29 09/09/2034 100,509,000
77,589,000 Citigroup Global Markets Holdings DTC MMI±§ 0.64 09/09/2049 77,589,000
Total Secured Master Note Agreement (Cost $178,098,000) 178,098,000
Time Deposits: 9.80%100,000,000 Banco Bilbao Vizcaya London 0.14 03/01/2010 100,000,000
71,000,000 Bank of Ireland 0.35 03/01/2010 71,000,00060,000,000 Bank of Ireland 0.50 03/02/2010 60,000,00038,000,000 Bayer Hypo-und Vereinsbank AG Munich 0.15 03/02/2010 38,000,00030,000,000 BNP Paribas Paris 0.14 03/02/2010 30,000,00053,000,000 Citibank NA Nassau 0.12 03/01/2010 53,000,00038,000,000 Danske Bank A/S Copenhagen 0.14 03/01/2010 38,000,00068,000,000 Danske Bank A/S Copenhagen 0.20 03/02/2010 68,000,000
107,000,000 Danske Bank A/S Copenhagen 0.21 03/01/2010 107,000,00057,500,000 Dexia Bank Grand Cayman 0.22 03/05/2010 57,500,000
115,000,000 Fortis Bank NV SA 0.18 03/01/2010 115,000,00029,000,000 Fortis Bank NV SA 0.18 03/03/2010 29,000,00053,000,000 Fortis Bank NV SA 0.18 03/04/2010 53,000,000
204,000,000 KBC Bank NV Brussels 0.16 03/01/2010 204,000,00024,000,000 Lloyds TSB Bank plc London 0.14 03/01/2010 24,000,00033,000,000 Societe Generale Paris 0.16 03/01/2010 33,000,000
Total Time Deposits (Cost $1,080,500,000) 1,080,500,000
Total Investments in Securities
(Cost $11,121,321,729)* 100.87% 11,121,321,729
Other Assets and Liabilities, Net (0.87) (96,024,998)
Total Net Assets 100.00% $11,025,296,731
PRIME INVESTMENT MONEY MARKET FUND
Principal Security Name Interest Rate Maturity Date Value
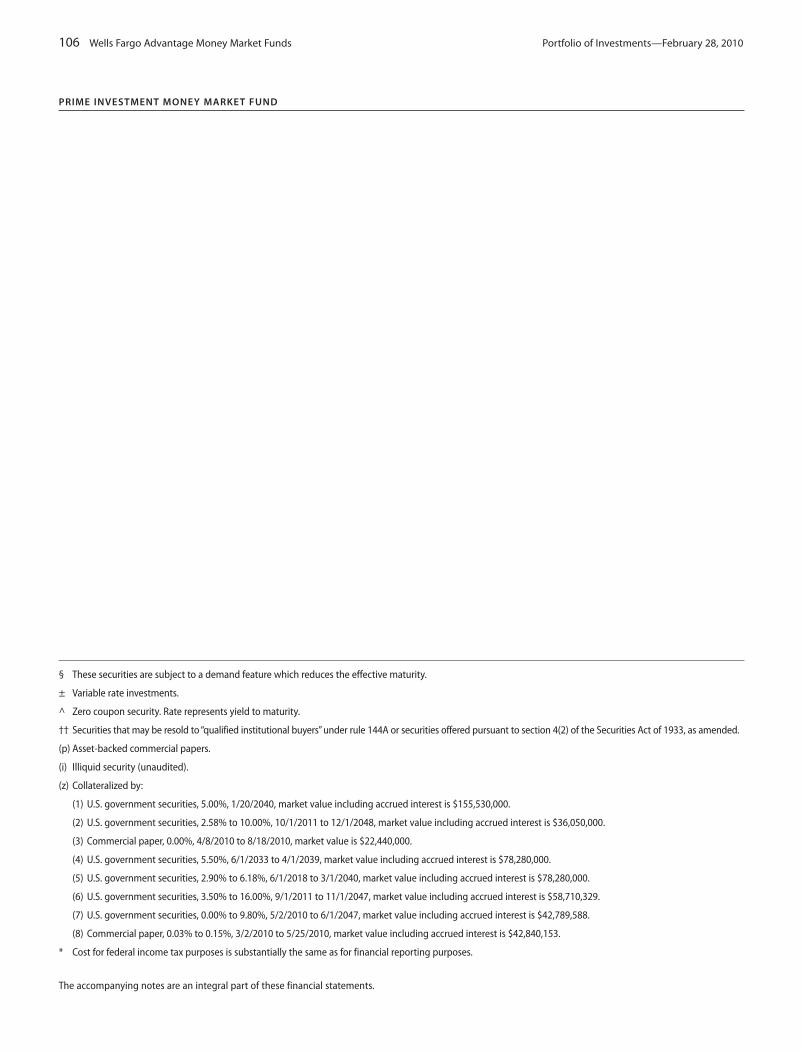
106 Wells Fargo Advantage Money Market Funds Portfolio of Investments—February 28, 2010
PRIME INVESTMENT MONEY MARKET FUND
§ These securities are subject to a demand feature which reduces the effective maturity.
± Variable rate investments.
^ Zero coupon security. Rate represents yield to maturity.
†† Securities that may be resold to “qualified institutional buyers” under rule 144A or securities offered pursuant to section 4(2) of the Securities Act of 1933, as amended.
(p) Asset-backed commercial papers.
(i) Illiquid security (unaudited).
(z) Collateralized by:
(1) U.S. government securities, 5.00%, 1/20/2040, market value including accrued interest is $155,530,000.
(2) U.S. government securities, 2.58% to 10.00%, 10/1/2011 to 12/1/2048, market value including accrued interest is $36,050,000.
(3) Commercial paper, 0.00%, 4/8/2010 to 8/18/2010, market value is $22,440,000.
(4) U.S. government securities, 5.50%, 6/1/2033 to 4/1/2039, market value including accrued interest is $78,280,000.
(5) U.S. government securities, 2.90% to 6.18%, 6/1/2018 to 3/1/2040, market value including accrued interest is $78,280,000.
(6) U.S. government securities, 3.50% to 16.00%, 9/1/2011 to 11/1/2047, market value including accrued interest is $58,710,329.
(7) U.S. government securities, 0.00% to 9.80%, 5/2/2010 to 6/1/2047, market value including accrued interest is $42,789,588.
(8) Commercial paper, 0.03% to 0.15%, 3/2/2010 to 5/25/2010, market value including accrued interest is $42,840,153.
* Cost for federal income tax purposes is substantially the same as for financial reporting purposes.
The accompanying notes are an integral part of these financial statements.

Portfolio of Investments—February 28, 2010 Wells Fargo Advantage Money Market Funds 107
TREASURY PLUS MONEY MARKET FUND
Principal Security Name Interest Rate Maturity Date Value
US Treasury Securities: 15.48%
US Treasury Bills: 9.73%$ 25,000,000 US Treasury Bill^ 0.25% 03/04/2010 $ 24,999,479
100,000 US Treasury Bill^ 0.00 03/11/2010 100,000250,000,000 US Treasury Bill^ 0.08 03/18/2010 249,991,146
25,000,000 US Treasury Bill^ 0.19 04/29/2010 24,992,42060,000,000 US Treasury Bill^ 0.11 05/27/2010 59,984,050
250,000,000 US Treasury Bill^ 0.18 08/12/2010 249,795,00030,000,000 US Treasury Bill^ 0.20 08/26/2010 29,971,075
639,833,170
US Treasury Notes: 5.75%150,000,000 US Treasury Note 1.75 03/31/2010 150,206,250100,000,000 US Treasury Note 2.88 06/30/2010 100,867,091125,000,000 US Treasury Note 3.88 07/15/2010 126,685,985
377,759,326
Total US Treasury Securities (Cost $1,017,592,496) 1,017,592,496
Repurchase Agreements: 84.50%607,610,000 Barclays Capital Incorporated, dated 02/26/2010, Maturity Value $607,615,063 (1) 0.10 03/01/2010 607,610,000802,000,000 BNP Paribas Securities , dated 02/26/2010, Maturity Value $802,006,683 (2) 0.10 03/01/2010 802,000,000268,000,000 Credit Suisse First Boston Corporation, dated 02/26/2010,
Maturity Value $268,002,233 (3) 0.10 03/01/2010 268,000,000802,000,000 Deutsche Bank Securities, dated 02/26/2010, Maturity Value $802,006,683 (4) 0.10 03/01/2010 802,000,000802,000,000 HSBC Securities, dated 02/26/2010, Maturity Value $802,006,683 (5) 0.10 03/01/2010 802,000,000535,000,000 JPMorgan Securities, dated 02/26/2010, Maturity Value $535,004,458 (6) 0.10 03/01/2010 535,000,000669,000,000 Morgan Stanley & Company, dated 02/26/2010, Maturity Value $669,005,575 (7) 0.10 03/01/2010 669,000,000802,000,000 RBS Securities, dated 02/26/2010, Maturity Value $802,006,683 (8) 0.10 03/01/2010 802,000,000268,000,000 UBS Securities, dated 02/26/2010, Maturity Value $268,002,233 (9) 0.10 03/01/2010 268,000,000
Total Repurchase Agreements (Cost $5,555,610,000) 5,555,610,000
Total Investments in Securities
(Cost $6,573,202,496)* 99.98% 6,573,202,496
Other Assets and Liabilities, Net 0.02 1,290,265
Total Net Assets 100.00% $6,574,492,761
^ Zero coupon security. Rate represents yield to maturity.
(z) Collateralized by:
(1) U.S. government securities, 0.00% to 4.25%, 6/3/2010 to 5/15/2039, market value including accrued interest is $619,762,258.
(2) U.S. government securities, 2.625% to 4.375%, 12/15/2010 to 6/30/2014, market value including accrued interest is $818,040,019.
(3) U.S. government securities, 1.375% to 2.625%, 10/31/2010 to 4/30/2016, market value including accrued interest is $273,361,183.
(4) U.S. government securities, 0.00% to 3.13%, 2/10/2011 to 5/15/2019, market value including accrued interest is $818,040,044.
(5) U.S. government securities, 0.00% to 8.125%, 5/15/2010 to 2/15/2040, market value including accrued interest is $818,041,096.
(6) U.S. government securities, 0.875% to 3.625%, 4/30/2011 to 4/15/2028, market value including accrued interest is $545,704,148.
(7) U.S. government securities, 0.875% to 5.125%, 2/28/2011 to 6/30/2011, market value including accrued interest is $682,380,144.
(8) U.S. government securities, 1.75% to 3.875%, 1/15/2025 to 2/15/2040, market value including accrued interest is $818,041,304.
(9) U.S. government securities, 0.00%, 7/22/2010 to 8/26/2010, market value is $273,362,581.
* Cost for federal income tax purposes is substantially the same as for financial reporting purposes.
The accompanying notes are an integral part of these financial statements.

^ Zero coupon security. Rate represents yield to maturity.
* Cost for federal income tax purposes is substantially the same as for financial reporting purposes.
The accompanying notes are an integral part of these financial statements.
108 Wells Fargo Advantage Money Market Funds Portfolio of Investments—February 28, 2010
100% TREASURY MONEY MARKET FUND
Principal Security Name Interest Rate Maturity Date Value
US Treasury Securities: 99.97%
US Treasury Bills: 98.48%
$200,000,000 US Treasury Bill^ 0.02% 03/04/2010 $ 199,999,750426,970,000 US Treasury Bill^ 0.07 03/04/2010 426,967,433464,740,000 US Treasury Bill^ 0.05 03/11/2010 464,735,329185,080,000 US Treasury Bill^ 0.05 03/11/2010 185,077,301
99,900,000 US Treasury Bill^ 0.08 03/11/2010 99,897,780307,255,000 US Treasury Bill^ 0.04 03/18/2010 307,249,196291,735,000 US Treasury Bill^ 0.11 03/18/2010 291,726,118240,270,000 US Treasury Bill^ 0.06 03/25/2010 240,261,259411,460,000 US Treasury Bill^ 0.06 03/25/2010 411,443,542525,000,000 US Treasury Bill^ 0.11 04/01/2010 524,962,865478,990,000 US Treasury Bill^ 0.12 04/08/2010 478,951,737
75,000,000 US Treasury Bill^ 0.15 04/08/2010 74,988,125419,365,000 US Treasury Bill^ 0.05 04/15/2010 419,339,192726,295,000 US Treasury Bill^ 0.11 04/22/2010 726,214,114461,575,000 US Treasury Bill^ 0.07 04/29/2010 461,521,303415,175,000 US Treasury Bill^ 0.10 05/06/2010 415,108,594486,695,000 US Treasury Bill^ 0.12 05/13/2010 486,585,008
37,485,000 US Treasury Bill^ 0.17 05/13/2010 37,472,078609,410,000 US Treasury Bill^ 0.11 05/20/2010 609,265,373
20,400,000 US Treasury Bill^ 0.17 05/20/2010 20,392,520500,000,000 US Treasury Bill^ 0.11 05/27/2010 499,867,083
75,000,000 US Treasury Bill^ 0.17 06/17/2010 74,962,87575,000,000 US Treasury Bill^ 0.18 06/24/2010 74,957,474
125,000,000 US Treasury Bill^ 0.20 07/01/2010 124,917,396100,000,000 US Treasury Bill^ 0.19 07/08/2010 99,933,708100,000,000 US Treasury Bill^ 0.14 07/15/2010 99,949,000
75,000,000 US Treasury Bill^ 0.15 07/22/2010 74,955,31375,000,000 US Treasury Bill^ 0.14 07/29/2010 74,956,25075,000,000 US Treasury Bill^ 0.17 08/05/2010 74,946,03175,000,000 US Treasury Bill^ 0.18 08/12/2010 74,940,20875,000,000 US Treasury Bill^ 0.19 08/19/2010 74,934,09475,000,000 US Treasury Bill^ 0.20 08/26/2010 74,927,688
8,306,405,737
US Treasury Notes: 1.49%50,000,000 US Treasury Note 4.00 03/15/2010 50,075,94475,000,000 US Treasury Note 4.00 04/15/2010 75,354,159
125,430,103
Total US Treasury Securities (Cost $8,431,835,840) 8,431,835,840
Total Investments in Securities
(Cost $8,431,835,840)* 99.97% 8,431,835,840
Other Assets and Liabilities, Net 0.03 2,175,254
Total Net Assets 100.00% $8,434,011,094

This page is intentionally left blank.

110 Wells Fargo Advantage Money Market Funds Statements of Assets and Liabilities—February 28, 2010
California Municipal Cash InvestmentMoney Market Money Market
Fund Fund_____________________________________________________________________________________________________________________________
AssetsInvestments
in unaffiliated securities . . . . . . . . . . . . . . . . . . . . . . . . . . . . . . . . . . . . . . . . . . . . . . . . . . . . . . . . . . . . . . . . . . . . . . . . . $ 2,580,658,500 $ 18,794,522,547 in repurchase agreements . . . . . . . . . . . . . . . . . . . . . . . . . . . . . . . . . . . . . . . . . . . . . . . . . . . . . . . . . . . . . . . . . . . . . . 0 216,950,000
-------------------------------------------------------------------------------------------------------Total investments at amortized cost . . . . . . . . . . . . . . . . . . . . . . . . . . . . . . . . . . . . . . . . . . . . . . . . . . . . . . . . . . . . . . 2,580,658,500 19,011,472,547 Cash . . . . . . . . . . . . . . . . . . . . . . . . . . . . . . . . . . . . . . . . . . . . . . . . . . . . . . . . . . . . . . . . . . . . . . . . . . . . . . . . . . . . . . . . . . . . . 10,803,806 134,721 Receivable from Fund shares issued . . . . . . . . . . . . . . . . . . . . . . . . . . . . . . . . . . . . . . . . . . . . . . . . . . . . . . . . . . . . . . . 1,132 1,700,099 Receivable for investment sold . . . . . . . . . . . . . . . . . . . . . . . . . . . . . . . . . . . . . . . . . . . . . . . . . . . . . . . . . . . . . . . . . . . . 1,405,000 7,569,000 Receivable for interest . . . . . . . . . . . . . . . . . . . . . . . . . . . . . . . . . . . . . . . . . . . . . . . . . . . . . . . . . . . . . . . . . . . . . . . . . . . . 619,702 3,470,690 Prepaid expenses and other assets . . . . . . . . . . . . . . . . . . . . . . . . . . . . . . . . . . . . . . . . . . . . . . . . . . . . . . . . . . . . . . . . 0 0
–––––––––––––––––––––––––––––––––––––––––––––––––––Total assets . . . . . . . . . . . . . . . . . . . . . . . . . . . . . . . . . . . . . . . . . . . . . . . . . . . . . . . . . . . . . . . . . . . . . . . . . . . . . . . . . . . . . . . . . 2,593,488,140 19,024,347,057
–––––––––––––––––––––––––––––––––––––––––––––––––––
LiabilitiesPayable for fund shares redeemed . . . . . . . . . . . . . . . . . . . . . . . . . . . . . . . . . . . . . . . . . . . . . . . . . . . . . . . . . . . . . . . . 113,538 1,851,397 Payable for investment purchased . . . . . . . . . . . . . . . . . . . . . . . . . . . . . . . . . . . . . . . . . . . . . . . . . . . . . . . . . . . . . . . . 10,700,985 205,029,728 Dividends payable . . . . . . . . . . . . . . . . . . . . . . . . . . . . . . . . . . . . . . . . . . . . . . . . . . . . . . . . . . . . . . . . . . . . . . . . . . . . . . . . 5,151 406,580 Payable to affiliates . . . . . . . . . . . . . . . . . . . . . . . . . . . . . . . . . . . . . . . . . . . . . . . . . . . . . . . . . . . . . . . . . . . . . . . . . . . . . . . 388,312 3,030,768 Accrued expenses and other liabilities . . . . . . . . . . . . . . . . . . . . . . . . . . . . . . . . . . . . . . . . . . . . . . . . . . . . . . . . . . . . 106,501 164,644
–––––––––––––––––––––––––––––––––––––––––––––––––––Total liabilities . . . . . . . . . . . . . . . . . . . . . . . . . . . . . . . . . . . . . . . . . . . . . . . . . . . . . . . . . . . . . . . . . . . . . . . . . . . . . . . . . . . . . . 11,314,487 210,483,117
–––––––––––––––––––––––––––––––––––––––––––––––––––Total net assets . . . . . . . . . . . . . . . . . . . . . . . . . . . . . . . . . . . . . . . . . . . . . . . . . . . . . . . . . . . . . . . . . . . . . . . . . . . . . . . . $2,582,173,653 $18,813,863,940
––––––––––––––––––––––––––––––––––––––––––––––
NET ASSETS CONSIST OFPaid-in capital . . . . . . . . . . . . . . . . . . . . . . . . . . . . . . . . . . . . . . . . . . . . . . . . . . . . . . . . . . . . . . . . . . . . . . . . . . . . . . . . . . . . $ 2,582,179,568 $ 18,813,855,273Undistributed/(overdistributed) net investment income . . . . . . . . . . . . . . . . . . . . . . . . . . . . . . . . . . . . . . . . . . . (1,037) (6,470)Accumulated net realized gain (loss) on investments . . . . . . . . . . . . . . . . . . . . . . . . . . . . . . . . . . . . . . . . . . . . . . (4,878) 15,137
–––––––––––––––––––––––––––––––––––––––––––––––––––Total net assets . . . . . . . . . . . . . . . . . . . . . . . . . . . . . . . . . . . . . . . . . . . . . . . . . . . . . . . . . . . . . . . . . . . . . . . . . . . . . . . . $2,582,173,653 $18,813,863,940
––––––––––––––––––––––––––––––––––––––––––––––
COMPUTATION OF NET ASSET VALUE AND OFFERING PRICE PER SHARE1
Net assets – Class A . . . . . . . . . . . . . . . . . . . . . . . . . . . . . . . . . . . . . . . . . . . . . . . . . . . . . . . . . . . . . . . . . . . . . . . . . . . . . . . $ 1,948,312,942 NAShares outstanding – Class A . . . . . . . . . . . . . . . . . . . . . . . . . . . . . . . . . . . . . . . . . . . . . . . . . . . . . . . . . . . . . . . . . . . . . . 1,948,201,819 NANet asset value and offering price per share – Class A . . . . . . . . . . . . . . . . . . . . . . . . . . . . . . . . . . . . . . . . . . . . . . $1.00 NANet assets – Administrator Class . . . . . . . . . . . . . . . . . . . . . . . . . . . . . . . . . . . . . . . . . . . . . . . . . . . . . . . . . . . . . . . . . . NA $ 1,013,057,866 Shares outstanding – Administrator Class . . . . . . . . . . . . . . . . . . . . . . . . . . . . . . . . . . . . . . . . . . . . . . . . . . . . . . . . . NA 1,013,138,971Net asset value and offering price per share – Administrator Class . . . . . . . . . . . . . . . . . . . . . . . . . . . . . . . . . NA $1.00 Net assets – Institutional Class . . . . . . . . . . . . . . . . . . . . . . . . . . . . . . . . . . . . . . . . . . . . . . . . . . . . . . . . . . . . . . . . . . . . $ 236,353,047 $ 8,887,844,190 Shares outstanding – Institutional Class . . . . . . . . . . . . . . . . . . . . . . . . . . . . . . . . . . . . . . . . . . . . . . . . . . . . . . . . . . 236,373,718 8,887,834,891Net asset value and offering price per share – Institutional Class . . . . . . . . . . . . . . . . . . . . . . . . . . . . . . . . . . . $1.00 $1.00 Net assets – Investor Class . . . . . . . . . . . . . . . . . . . . . . . . . . . . . . . . . . . . . . . . . . . . . . . . . . . . . . . . . . . . . . . . . . . . . . . . NA NAShares outstanding – Investor Class . . . . . . . . . . . . . . . . . . . . . . . . . . . . . . . . . . . . . . . . . . . . . . . . . . . . . . . . . . . . . . NA NANet asset value and offering price per share – Investor Class . . . . . . . . . . . . . . . . . . . . . . . . . . . . . . . . . . . . . . . NA NANet assets – Select Class . . . . . . . . . . . . . . . . . . . . . . . . . . . . . . . . . . . . . . . . . . . . . . . . . . . . . . . . . . . . . . . . . . . . . . . . . . NA $ 4,897,724,700 Shares outstanding – Select Class . . . . . . . . . . . . . . . . . . . . . . . . . . . . . . . . . . . . . . . . . . . . . . . . . . . . . . . . . . . . . . . . NA 4,897,455,843Net asset value and offering price per share – Select Class . . . . . . . . . . . . . . . . . . . . . . . . . . . . . . . . . . . . . . . . NA $1.00 Net assets – Service Class . . . . . . . . . . . . . . . . . . . . . . . . . . . . . . . . . . . . . . . . . . . . . . . . . . . . . . . . . . . . . . . . . . . . . . . . $ 397,507,664 $ 4,015,237,184 Shares outstanding – Service Class . . . . . . . . . . . . . . . . . . . . . . . . . . . . . . . . . . . . . . . . . . . . . . . . . . . . . . . . . . . . . . . 397,551,487 4,015,893,641Net asset value and offering price per share – Service Class . . . . . . . . . . . . . . . . . . . . . . . . . . . . . . . . . . . . . . . $1.00 $1.00
–––––––––––––––––––––––––––––––––––––––––––––––––––
1. Each Fund has an unlimited number of authorized shares.
The accompanying notes are an integral part of these financial statements.

Statements of Assets and Liabilities—February 28, 2010 Wells Fargo Advantage Money Market Funds 111
Government Heritage Municipal National Tax-Free Prime Investment Treasury PlusMoney Market Money Market Money Market Money Market Money Market Money Market
Fund Fund Fund Fund Fund Fund_____________________________________________________________________________________________________________________________
$ 15,382,238,882 $ 28,840,416,219 $ 384,474,221 $ 4,547,811,568 $ 10,620,721,729 $ 1,017,592,49611,428,670,000 2,775,797,949 0 0 500,600,000 5,555,610,000
––––––––––––––––––––––––––––––––––––––––––––––––––––––––––––––––––––––––––––––––––––––––––––––––––––––––––––––––––––––––––––––––––––––––––––––––––––––––––––26,810,908,882 31,616,214,168 384,474,221 4,547,811,568 11,121,321,729 6,573,202,496
124,380 89,867 111,621 88,334 57,734 54,59165,638 145,130,084 317,809 1,572,531 0 6,975
0 3,561,000 415,000 2,655,000 324,000 0 14,957,125 6,409,685 138,399 1,593,788 1,819,775 2,221,094
0 55,403 0 0 0 24,646––––––––––––––––––––––––––––––––––––––––––––––––––––––––––––––––––––––––––––––––––––––––––––––––––––––––––––––––––––––––––––––––––––––––––––––––––––––––––––
26,826,056,025 31,771,460,207 385,457,050 4,553,721,221 11,123,523,238 6,575,509,802––––––––––––––––––––––––––––––––––––––––––––––––––––––––––––––––––––––––––––––––––––––––––––––––––––––––––––––––––––––––––––––––––––––––––––––––––––––––––––
453,779 218,156 208,893 368,103 0 546,8390 279,984,250 2,250,000 10,000,000 95,994,556 0
144,285 1,130,406 206 47,222 435,583 33,145 2,725,750 3,666,792 46,011 660,703 1,745,131 437,057
15,205 0 22,424 28,403 51,237 0 ––––––––––––––––––––––––––––––––––––––––––––––––––––––––––––––––––––––––––––––––––––––––––––––––––––––––––––––––––––––––––––––––––––––––––––––––––––––––––––
3,339,019 284,999,604 2,527,534 11,104,431 98,226,507 1,017,041––––––––––––––––––––––––––––––––––––––––––––––––––––––––––––––––––––––––––––––––––––––––––––––––––––––––––––––––––––––––––––––––––––––––––––––––––––––––––––$26,822,717,006 $31,486,460,603 $382,929,516 $4,542,616,790 $11,025,296,731 $6,574,492,761–––––––––––––––––––––––––––––––––––––––––––––––––––––––––––––––––––––––––––––––––––––––––––––––––––––––––––––––––––––––––––––––––––––––––––––––––––––––––––––––––––––––––
$ 26,822,676,650 $ 31,486,421,344 $ 382,929,675 $ 4,542,590,541 $ 11,025,288,542 $ 6,574,553,242 31,023 4,473 0 15 1,278 20,213
9,333 34,786 (159) 26,234 6,911 (80,694)––––––––––––––––––––––––––––––––––––––––––––––––––––––––––––––––––––––––––––––––––––––––––––––––––––––––––––––––––––––––––––––––––––––––––––––––––––––––––––$26,822,717,006 $31,486,460,603 $382,929,516 $4,542,616,790 $11,025,296,731 $6,574,492,761–––––––––––––––––––––––––––––––––––––––––––––––––––––––––––––––––––––––––––––––––––––––––––––––––––––––––––––––––––––––––––––––––––––––––––––––––––––––––––––––––––––––––
$ 777,461,877 NA NA $ 1,018,469,596 NA $ 1,600,618,520 777,443,317 NA NA 1,018,454,312 NA 1,600,700,454
$1.00 NA NA $1.00 NA $1.00 $ 788,478,456 $ 1,201,157,612 NA $ 419,953,837 NA $ 180,020,875
788,465,487 1,201,123,265 NA 419,910,729 NA 180,020,981 $1.00 $1.00 NA $1.00 NA $1.00
$ 20,661,469,830 $ 7,795,658,755 $ 128,955,789 $ 2,048,773,766 $ 10,124,806,644 $ 4,091,490,011 20,661,551,513 7,795,581,865 128,955,806 2,048,795,499 10,124,808,110 4,091,659,366
$1.00 $1.00 $1.00 $1.00 $1.00 $1.00 NA NA $ 253,973,727 NA NA NA NA NA 253,973,762 NA NA NA NA NA $1.00 NA NA NA NA $ 22,489,644,236 NA NA NA NA NA 22,489,691,110 NA NA NA NA NA $1.00 NA NA NA NA
$ 4,595,306,843 NA NA $ 1,055,419,591 $ 900,490,087 $ 702,363,355 4,595,254,535 NA NA 1,055,228,074 900,487,894 702,388,536
$1.00 NA NA $1.00 $1.00 $1.00––––––––––––––––––––––––––––––––––––––––––––––––––––––––––––––––––––––––––––––––––––––––––––––––––––––––––––––––––––––––––––––––––––––––––––––––––––––––––––

112 Wells Fargo Advantage Money Market Funds Statements of Assets and Liabilities—February 28, 2010
100% TreasuryMoney Market
Fund——————————————————————————————————————————————————————————————————————————————————————————————————————————————————————————————————————————————————————————————
AssetsInvestments in unaffiliated securities at amortized cost . . . . . . . . . . . . . . . . . . . . . . . . . . . . . . . . . . . . . . . . . . . . . . . . . . . . . . . . . . . . . . . . . . . . . . . . $ 8,431,835,840Cash . . . . . . . . . . . . . . . . . . . . . . . . . . . . . . . . . . . . . . . . . . . . . . . . . . . . . . . . . . . . . . . . . . . . . . . . . . . . . . . . . . . . . . . . . . . . . . . . . . . . . . . . . . . . . . . . . . . . . . . . . . 51,100 Receivable from Fund shares issued . . . . . . . . . . . . . . . . . . . . . . . . . . . . . . . . . . . . . . . . . . . . . . . . . . . . . . . . . . . . . . . . . . . . . . . . . . . . . . . . . . . . . . . . . . . 1,392,847 Receivable for interest . . . . . . . . . . . . . . . . . . . . . . . . . . . . . . . . . . . . . . . . . . . . . . . . . . . . . . . . . . . . . . . . . . . . . . . . . . . . . . . . . . . . . . . . . . . . . . . . . . . . . . . . 2,051,773
–––––––––––––––Total assets . . . . . . . . . . . . . . . . . . . . . . . . . . . . . . . . . . . . . . . . . . . . . . . . . . . . . . . . . . . . . . . . . . . . . . . . . . . . . . . . . . . . . . . . . . . . . . . . . . . . . . . . . . . . . . . . . . . . . 8,435,331,560
–––––––––––––––
LiabilitiesPayable for fund shares redeemed . . . . . . . . . . . . . . . . . . . . . . . . . . . . . . . . . . . . . . . . . . . . . . . . . . . . . . . . . . . . . . . . . . . . . . . . . . . . . . . . . . . . . . . . . . . . . 856,974 Dividends payable . . . . . . . . . . . . . . . . . . . . . . . . . . . . . . . . . . . . . . . . . . . . . . . . . . . . . . . . . . . . . . . . . . . . . . . . . . . . . . . . . . . . . . . . . . . . . . . . . . . . . . . . . . . . 36,674 Payable to affiliates . . . . . . . . . . . . . . . . . . . . . . . . . . . . . . . . . . . . . . . . . . . . . . . . . . . . . . . . . . . . . . . . . . . . . . . . . . . . . . . . . . . . . . . . . . . . . . . . . . . . . . . . . . . 417,601 Accrued expenses and other liabilities . . . . . . . . . . . . . . . . . . . . . . . . . . . . . . . . . . . . . . . . . . . . . . . . . . . . . . . . . . . . . . . . . . . . . . . . . . . . . . . . . . . . . . . . . 9,217
–––––––––––––––Total liabilities . . . . . . . . . . . . . . . . . . . . . . . . . . . . . . . . . . . . . . . . . . . . . . . . . . . . . . . . . . . . . . . . . . . . . . . . . . . . . . . . . . . . . . . . . . . . . . . . . . . . . . . . . . . . . . . . . . 1,320,466
–––––––––––––––Total net assets . . . . . . . . . . . . . . . . . . . . . . . . . . . . . . . . . . . . . . . . . . . . . . . . . . . . . . . . . . . . . . . . . . . . . . . . . . . . . . . . . . . . . . . . . . . . . . . . . . . . . . . . . . $8,434,011,094
–––––––––––––––
NET ASSETS CONSIST OFPaid-in capital . . . . . . . . . . . . . . . . . . . . . . . . . . . . . . . . . . . . . . . . . . . . . . . . . . . . . . . . . . . . . . . . . . . . . . . . . . . . . . . . . . . . . . . . . . . . . . . . . . . . . . . . . . . . . . . . $ 8,433,935,115Accumulated net realized gain on investments . . . . . . . . . . . . . . . . . . . . . . . . . . . . . . . . . . . . . . . . . . . . . . . . . . . . . . . . . . . . . . . . . . . . . . . . . . . . . . . . 75,979
–––––––––––––––Total net assets . . . . . . . . . . . . . . . . . . . . . . . . . . . . . . . . . . . . . . . . . . . . . . . . . . . . . . . . . . . . . . . . . . . . . . . . . . . . . . . . . . . . . . . . . . . . . . . . . . . . . . . . . . $8,434,011,094
–––––––––––––––
COMPUTATION OF NET ASSET VALUE AND OFFERING PRICE PER SHARE1
Net assets – Class A . . . . . . . . . . . . . . . . . . . . . . . . . . . . . . . . . . . . . . . . . . . . . . . . . . . . . . . . . . . . . . . . . . . . . . . . . . . . . . . . . . . . . . . . . . . . . . . . . . . . . . . . . . . $ 272,399,014 Shares outstanding – Class A . . . . . . . . . . . . . . . . . . . . . . . . . . . . . . . . . . . . . . . . . . . . . . . . . . . . . . . . . . . . . . . . . . . . . . . . . . . . . . . . . . . . . . . . . . . . . . . . . . 272,342,045 Net asset value and offering price per share – Class A . . . . . . . . . . . . . . . . . . . . . . . . . . . . . . . . . . . . . . . . . . . . . . . . . . . . . . . . . . . . . . . . . . . . . . . . . . $1.00 Net assets – Service Class . . . . . . . . . . . . . . . . . . . . . . . . . . . . . . . . . . . . . . . . . . . . . . . . . . . . . . . . . . . . . . . . . . . . . . . . . . . . . . . . . . . . . . . . . . . . . . . . . . . . . $ 8,161,612,080 Shares outstanding – Service Class . . . . . . . . . . . . . . . . . . . . . . . . . . . . . . . . . . . . . . . . . . . . . . . . . . . . . . . . . . . . . . . . . . . . . . . . . . . . . . . . . . . . . . . . . . . . 8,161,380,783Net asset value and offering price per share – Service Class . . . . . . . . . . . . . . . . . . . . . . . . . . . . . . . . . . . . . . . . . . . . . . . . . . . . . . . . . . . . . . . . . . . . $1.00
–––––––––––––––
1. The Fund has an unlimited number of authorized shares.
The accompanying notes are an integral part of these financial statements.

This page is intentionally left blank.

114 Wells Fargo Advantage Money Market Funds Statements of Operations—For the Year Ended February 28, 2010
The accompanying notes are an integral part of these financial statements.The accompanying notes are an integral part of these financial statements.
California Municipal Cash InvestmentMoney Market Money Market
Fund Fund_____________________________________________________________________________________________________________________________
Investment incomeInterest . . . . . . . . . . . . . . . . . . . . . . . . . . . . . . . . . . . . . . . . . . . . . . . . . . . . . . . . . . . . . . . . . . . . . . . . . . . . . . . . . . . . . . . . . . . . . . . . . . $ 14,174,471 $126,283,780
–––––––––––––––––––––––––––––––––––––
ExpensesAdvisory fees . . . . . . . . . . . . . . . . . . . . . . . . . . . . . . . . . . . . . . . . . . . . . . . . . . . . . . . . . . . . . . . . . . . . . . . . . . . . . . . . . . . . . . . . . . . . 8,873,354 21,496,405 Administration fees
Fund level . . . . . . . . . . . . . . . . . . . . . . . . . . . . . . . . . . . . . . . . . . . . . . . . . . . . . . . . . . . . . . . . . . . . . . . . . . . . . . . . . . . . . . . . . . . . . 1,568,007 7,944,802 Class A . . . . . . . . . . . . . . . . . . . . . . . . . . . . . . . . . . . . . . . . . . . . . . . . . . . . . . . . . . . . . . . . . . . . . . . . . . . . . . . . . . . . . . . . . . . . . . . . 5,028,594 NA Administration Class . . . . . . . . . . . . . . . . . . . . . . . . . . . . . . . . . . . . . . . . . . . . . . . . . . . . . . . . . . . . . . . . . . . . . . . . . . . . . . . . . . . NA 1,292,052 Institutional Class . . . . . . . . . . . . . . . . . . . . . . . . . . . . . . . . . . . . . . . . . . . . . . . . . . . . . . . . . . . . . . . . . . . . . . . . . . . . . . . . . . . . . . 270,391 7,932,595 Investor Class . . . . . . . . . . . . . . . . . . . . . . . . . . . . . . . . . . . . . . . . . . . . . . . . . . . . . . . . . . . . . . . . . . . . . . . . . . . . . . . . . . . . . . . . . . NA NA Select Class . . . . . . . . . . . . . . . . . . . . . . . . . . . . . . . . . . . . . . . . . . . . . . . . . . . . . . . . . . . . . . . . . . . . . . . . . . . . . . . . . . . . . . . . . . . . NA 2,071,534 Service Class . . . . . . . . . . . . . . . . . . . . . . . . . . . . . . . . . . . . . . . . . . . . . . . . . . . . . . . . . . . . . . . . . . . . . . . . . . . . . . . . . . . . . . . . . . . 614,762 6,131,729
Custody fees . . . . . . . . . . . . . . . . . . . . . . . . . . . . . . . . . . . . . . . . . . . . . . . . . . . . . . . . . . . . . . . . . . . . . . . . . . . . . . . . . . . . . . . . . . . . 565,381 3,793,136 Shareholder servicing fees
Class A . . . . . . . . . . . . . . . . . . . . . . . . . . . . . . . . . . . . . . . . . . . . . . . . . . . . . . . . . . . . . . . . . . . . . . . . . . . . . . . . . . . . . . . . . . . . . . . . 5,686,531 NA Administrator Class . . . . . . . . . . . . . . . . . . . . . . . . . . . . . . . . . . . . . . . . . . . . . . . . . . . . . . . . . . . . . . . . . . . . . . . . . . . . . . . . . . . . NA 1,287,884 Investor Class . . . . . . . . . . . . . . . . . . . . . . . . . . . . . . . . . . . . . . . . . . . . . . . . . . . . . . . . . . . . . . . . . . . . . . . . . . . . . . . . . . . . . . . . . . NA NA Service Class . . . . . . . . . . . . . . . . . . . . . . . . . . . . . . . . . . . . . . . . . . . . . . . . . . . . . . . . . . . . . . . . . . . . . . . . . . . . . . . . . . . . . . . . . . . 1,275,842 12,774,436
Accounting fees . . . . . . . . . . . . . . . . . . . . . . . . . . . . . . . . . . . . . . . . . . . . . . . . . . . . . . . . . . . . . . . . . . . . . . . . . . . . . . . . . . . . . . . . . 176,790 1,059,351 Professional fees . . . . . . . . . . . . . . . . . . . . . . . . . . . . . . . . . . . . . . . . . . . . . . . . . . . . . . . . . . . . . . . . . . . . . . . . . . . . . . . . . . . . . . . . . 46,863 56,497 Registration fees . . . . . . . . . . . . . . . . . . . . . . . . . . . . . . . . . . . . . . . . . . . . . . . . . . . . . . . . . . . . . . . . . . . . . . . . . . . . . . . . . . . . . . . . 11,090 16,865 Shareholder reports . . . . . . . . . . . . . . . . . . . . . . . . . . . . . . . . . . . . . . . . . . . . . . . . . . . . . . . . . . . . . . . . . . . . . . . . . . . . . . . . . . . . . 147,424 264,721 Trustee fees . . . . . . . . . . . . . . . . . . . . . . . . . . . . . . . . . . . . . . . . . . . . . . . . . . . . . . . . . . . . . . . . . . . . . . . . . . . . . . . . . . . . . . . . . . . . . 16,578 16,578 Temporary guarantee program fee . . . . . . . . . . . . . . . . . . . . . . . . . . . . . . . . . . . . . . . . . . . . . . . . . . . . . . . . . . . . . . . . . . . . . . . 1,072,457 4,231,788 Other fees and expenses . . . . . . . . . . . . . . . . . . . . . . . . . . . . . . . . . . . . . . . . . . . . . . . . . . . . . . . . . . . . . . . . . . . . . . . . . . . . . . . . . 72,606 489,716
–––––––––––––––––––––––––––––––––––––Total expenses . . . . . . . . . . . . . . . . . . . . . . . . . . . . . . . . . . . . . . . . . . . . . . . . . . . . . . . . . . . . . . . . . . . . . . . . . . . . . . . . . . . . . . . . . . . 25,426,670 70,860,089
–––––––––––––––––––––––––––––––––––––
LessWaived fees and/or reimbursed expenses . . . . . . . . . . . . . . . . . . . . . . . . . . . . . . . . . . . . . . . . . . . . . . . . . . . . . . . . . . . . . . . . (12,698,317) (13,525,113)
–––––––––––––––––––––––––––––––––––––Net expenses . . . . . . . . . . . . . . . . . . . . . . . . . . . . . . . . . . . . . . . . . . . . . . . . . . . . . . . . . . . . . . . . . . . . . . . . . . . . . . . . . . . . . . . . . . . . 12,728,353 57,334,976
–––––––––––––––––––––––––––––––––––––Net investment income . . . . . . . . . . . . . . . . . . . . . . . . . . . . . . . . . . . . . . . . . . . . . . . . . . . . . . . . . . . . . . . . . . . . . . . . . . . . . . . . . . 1,446,118 68,948,804
–––––––––––––––––––––––––––––––––––––
REALIZED AND UNREALIZED GAIN (LOSS) ON INVESTMENTSNet realized gain (loss) in securities of unaffiliated issuers . . . . . . . . . . . . . . . . . . . . . . . . . . . . . . . . . . . . . . . . . . . . . . . . (4,878) 1,305,502
––––––––––––––––––––––––––––––––––––––Net increase in net assets resulting from operations . . . . . . . . . . . . . . . . . . . . . . . . . . . . . . . . . . . . . . . . . . . . . . . . . . . $ 1,441,240 $70,254,306
––––––––––––––––––––––––––––––––––––––
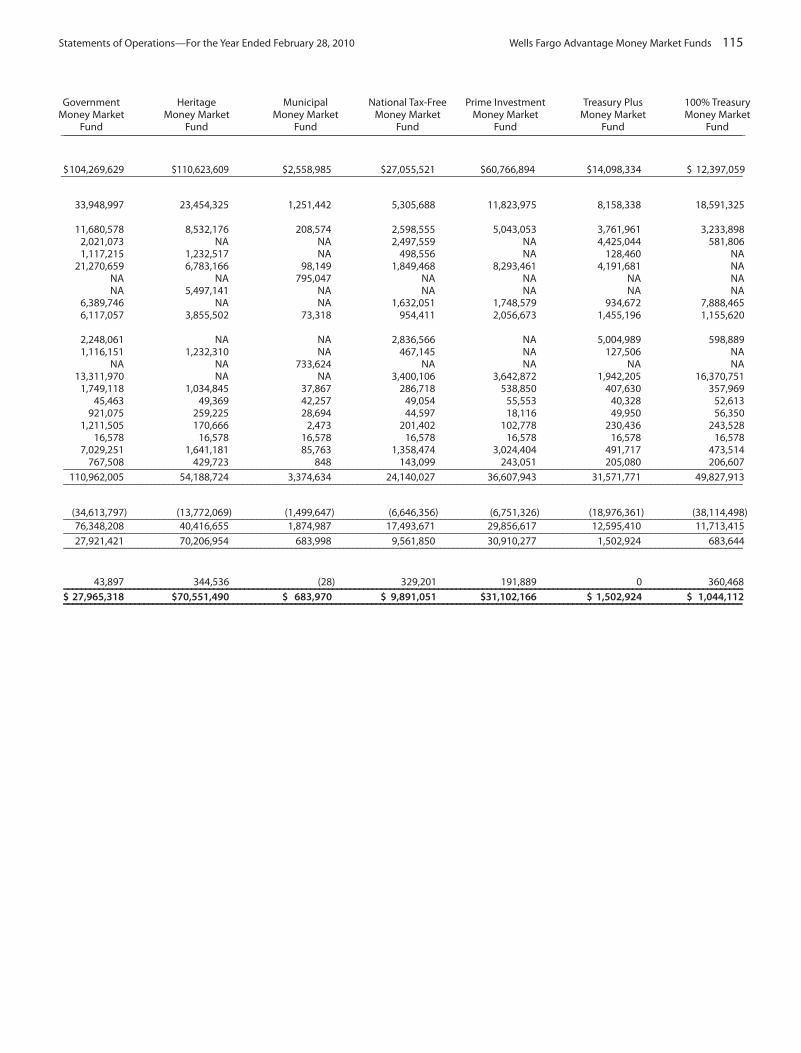
Statements of Operations—For the Year Ended February 28, 2010 Wells Fargo Advantage Money Market Funds 115
Government Heritage Municipal National Tax-Free Prime Investment Treasury Plus 100% TreasuryMoney Market Money Market Money Market Money Market Money Market Money Market Money Market
Fund Fund Fund Fund Fund Fund Fund________________________________________________________________________________________________________________________________________________________________________________________________________________________________
$104,269,629 $110,623,609 $2,558,985 $27,055,521 $60,766,894 $14,098,334 $ 12,397,059––––––––––––––––––––––––––––––––––––––––––––––––––––––––––––––––––––––––––––––––––––––––––––––––––––––––––––––––––––––––––––––––––––––––––––––––––––
33,948,997 23,454,325 1,251,442 5,305,688 11,823,975 8,158,338 18,591,325
11,680,578 8,532,176 208,574 2,598,555 5,043,053 3,761,961 3,233,898 2,021,073 NA NA 2,497,559 NA 4,425,044 581,806 1,117,215 1,232,517 NA 498,556 NA 128,460 NA
21,270,659 6,783,166 98,149 1,849,468 8,293,461 4,191,681 NA NA NA 795,047 NA NA NA NA NA 5,497,141 NA NA NA NA NA
6,389,746 NA NA 1,632,051 1,748,579 934,672 7,888,465 6,117,057 3,855,502 73,318 954,411 2,056,673 1,455,196 1,155,620
2,248,061 NA NA 2,836,566 NA 5,004,989 598,889 1,116,151 1,232,310 NA 467,145 NA 127,506 NA
NA NA 733,624 NA NA NA NA 13,311,970 NA NA 3,400,106 3,642,872 1,942,205 16,370,751
1,749,118 1,034,845 37,867 286,718 538,850 407,630 357,969 45,463 49,369 42,257 49,054 55,553 40,328 52,613
921,075 259,225 28,694 44,597 18,116 49,950 56,350 1,211,505 170,666 2,473 201,402 102,778 230,436 243,528
16,578 16,578 16,578 16,578 16,578 16,578 16,578 7,029,251 1,641,181 85,763 1,358,474 3,024,404 491,717 473,514
767,508 429,723 848 143,099 243,051 205,080 206,607 –––––––––––––––––––––––––––––––––––––––––––––––––––––––––––––––––––––––––––––––––––––––––––––––––––––––––––––––––––––––––––––––––––––––––––––––––––––––––––
110,962,005 54,188,724 3,374,634 24,140,027 36,607,943 31,571,771 49,827,913 –––––––––––––––––––––––––––––––––––––––––––––––––––––––––––––––––––––––––––––––––––––––––––––––––––––––––––––––––––––––––––––––––––––––––––––––––––––––––––
(34,613,797) (13,772,069) (1,499,647) (6,646,356) (6,751,326) (18,976,361) (38,114,498)–––––––––––––––––––––––––––––––––––––––––––––––––––––––––––––––––––––––––––––––––––––––––––––––––––––––––––––––––––––––––––––––––––––––––––––––––––––––––––
76,348,208 40,416,655 1,874,987 17,493,671 29,856,617 12,595,410 11,713,415 –––––––––––––––––––––––––––––––––––––––––––––––––––––––––––––––––––––––––––––––––––––––––––––––––––––––––––––––––––––––––––––––––––––––––––––––––––––––––––
27,921,421 70,206,954 683,998 9,561,850 30,910,277 1,502,924 683,644 –––––––––––––––––––––––––––––––––––––––––––––––––––––––––––––––––––––––––––––––––––––––––––––––––––––––––––––––––––––––––––––––––––––––––––––––––––––––––––
43,897 344,536 (28) 329,201 191,889 0 360,468––––––––––––––––––––––––––––––––––––––––––––––––––––––––––––––––––––––––––––––––––––––––––––––––––––––––––––––––––––––––––––––––––––––––––––––––––––––––––$ 27,965,318 $70,551,490 $ 683,970 $ 9,891,051 $31,102,166 $ 1,502,924 $ 1,044,112 ––––––––––––––––––––––––––––––––––––––––––––––––––––––––––––––––––––––––––––––––––––––––––––––––––––––––––––––––––––––––––––––––––––––––––––––––––––––––

116 Wells Fargo Advantage Money Market Funds Statements of Changes in Net Assets
The accompanying notes are an integral part of these financial statements.
California Municipal Money Market Fund——————————————————————————————————————————————————————————————————————
For the For theYear Ended Year Ended
February 28, 2010 February 28, 2009–––––––––--------------------------------------------------------------------------------------------------------------------------------------------------------------------------------------------------------------------------------------------------------------
INCREASE (DECREASE) IN NET ASSETSBeginning net assets . . . . . . . . . . . . . . . . . . . . . . . . . . . . . . . . . . . . . . . . . . . . . . . . . . . . . . . . . . . . . . . . . . . . . . . . . . . . . . . . . . . $ 4,371,522,330 $ 4,808,408,788
OperationsNet investment income . . . . . . . . . . . . . . . . . . . . . . . . . . . . . . . . . . . . . . . . . . . . . . . . . . . . . . . . . . . . . . . . . . . . . . . . . . . . . . . . 1,446,118 63,179,147 Net realized gain (loss) on investments . . . . . . . . . . . . . . . . . . . . . . . . . . . . . . . . . . . . . . . . . . . . . . . . . . . . . . . . . . . . . . . . . (4,878) 666,351 Net realized gain of capital support agreement . . . . . . . . . . . . . . . . . . . . . . . . . . . . . . . . . . . . . . . . . . . . . . . . . . . . . . . . . 0 0 Net change in unrealized appreciation of capital support agreement . . . . . . . . . . . . . . . . . . . . . . . . . . . . . . . . . . . . 0 0 Net change in unrealized depreciation of investments . . . . . . . . . . . . . . . . . . . . . . . . . . . . . . . . . . . . . . . . . . . . . . . . . . 0 0
——————————————————————————————————————————————Net increase in net assets resulting from operations . . . . . . . . . . . . . . . . . . . . . . . . . . . . . . . . . . . . . . . . . . . . . . . . . . . . . . 1,441,240 63,845,498
————————————————————————————————————————————————————————————————————————
Distribution to shareholders fromNet investment income
Class A . . . . . . . . . . . . . . . . . . . . . . . . . . . . . . . . . . . . . . . . . . . . . . . . . . . . . . . . . . . . . . . . . . . . . . . . . . . . . . . . . . . . . . . . . . . . . . . (321,031) (45,403,227)Administrator Class . . . . . . . . . . . . . . . . . . . . . . . . . . . . . . . . . . . . . . . . . . . . . . . . . . . . . . . . . . . . . . . . . . . . . . . . . . . . . . . . . . . NA NA Institutional Class . . . . . . . . . . . . . . . . . . . . . . . . . . . . . . . . . . . . . . . . . . . . . . . . . . . . . . . . . . . . . . . . . . . . . . . . . . . . . . . . . . . . (765,282) (4,676,760)Select Class . . . . . . . . . . . . . . . . . . . . . . . . . . . . . . . . . . . . . . . . . . . . . . . . . . . . . . . . . . . . . . . . . . . . . . . . . . . . . . . . . . . . . . . . . . NA NA Service Class . . . . . . . . . . . . . . . . . . . . . . . . . . . . . . . . . . . . . . . . . . . . . . . . . . . . . . . . . . . . . . . . . . . . . . . . . . . . . . . . . . . . . . . . . (359,805) (13,097,748)
Net realized gain on sales of investmentsClass A . . . . . . . . . . . . . . . . . . . . . . . . . . . . . . . . . . . . . . . . . . . . . . . . . . . . . . . . . . . . . . . . . . . . . . . . . . . . . . . . . . . . . . . . . . . . . . . (123,014) (521,362)Administrator Class . . . . . . . . . . . . . . . . . . . . . . . . . . . . . . . . . . . . . . . . . . . . . . . . . . . . . . . . . . . . . . . . . . . . . . . . . . . . . . . . . . . NA NA Institutional Class . . . . . . . . . . . . . . . . . . . . . . . . . . . . . . . . . . . . . . . . . . . . . . . . . . . . . . . . . . . . . . . . . . . . . . . . . . . . . . . . . . . . (17,769) (45,226)Select Class . . . . . . . . . . . . . . . . . . . . . . . . . . . . . . . . . . . . . . . . . . . . . . . . . . . . . . . . . . . . . . . . . . . . . . . . . . . . . . . . . . . . . . . . . . NA NA Service Class . . . . . . . . . . . . . . . . . . . . . . . . . . . . . . . . . . . . . . . . . . . . . . . . . . . . . . . . . . . . . . . . . . . . . . . . . . . . . . . . . . . . . . . . . (27,272) (130,023)
————————————————————————————————————————————————————————————————————————Total distributions to shareholders . . . . . . . . . . . . . . . . . . . . . . . . . . . . . . . . . . . . . . . . . . . . . . . . . . . . . . . . . . . . . . . . . . . . . . . (1,614,173) (63,874,346)
————————————————————————————————————————————————————————————————————————
Capital shares transactionsProceeds from shares sold – Class A . . . . . . . . . . . . . . . . . . . . . . . . . . . . . . . . . . . . . . . . . . . . . . . . . . . . . . . . . . . . . . . . . . . . 2,402,281,400 4,548,812,448 Reinvestment of distributions – Class A . . . . . . . . . . . . . . . . . . . . . . . . . . . . . . . . . . . . . . . . . . . . . . . . . . . . . . . . . . . . . . . . . 417,490 43,357,812 Cost of shares redeemed – Class A . . . . . . . . . . . . . . . . . . . . . . . . . . . . . . . . . . . . . . . . . . . . . . . . . . . . . . . . . . . . . . . . . . . . . . (3,746,180,886) (5,137,690,921)
————————————————————————————————————————————————————————————————————————Net decrease in net assets resulting from capital share transactions – Class A . . . . . . . . . . . . . . . . . . . . . . . . . . . . (1,343,481,996) (545,520,661)
————————————————————————————————————————————————————————————————————————Proceeds from shares sold – Administrator Class . . . . . . . . . . . . . . . . . . . . . . . . . . . . . . . . . . . . . . . . . . . . . . . . . . . . . . . NA NA Reinvestment of distributions – Administrator Class . . . . . . . . . . . . . . . . . . . . . . . . . . . . . . . . . . . . . . . . . . . . . . . . . . . . . NA NA Cost of shares redeemed – Administrator Class . . . . . . . . . . . . . . . . . . . . . . . . . . . . . . . . . . . . . . . . . . . . . . . . . . . . . . . . . NA NA
————————————————————————————————————————————————————————————————————————Net decrease in net assets resulting from capital shares transactions – Administrator Class . . . . . . . . . . . . . . . NA NA
————————————————————————————————————————————————————————————————————————Proceeds from shares sold – Institutional Class . . . . . . . . . . . . . . . . . . . . . . . . . . . . . . . . . . . . . . . . . . . . . . . . . . . . . . . . . 1,790,297,628 2,067,029,869 Reinvestment of distributions – Institutional Class . . . . . . . . . . . . . . . . . . . . . . . . . . . . . . . . . . . . . . . . . . . . . . . . . . . . . . 464,816 3,288,168 Cost of shares redeemed – Institutional Class . . . . . . . . . . . . . . . . . . . . . . . . . . . . . . . . . . . . . . . . . . . . . . . . . . . . . . . . . . . (1,924,963,024) (1,699,743,739)
————————————————————————————————————————————————————————————————————————Net increase (decrease) in net assets resulting from capital shares transactions – Institutional Class . . . . . . (134,200,580) 370,574,298
————————————————————————————————————————————————————————————————————————Proceeds from shares sold – Select Class . . . . . . . . . . . . . . . . . . . . . . . . . . . . . . . . . . . . . . . . . . . . . . . . . . . . . . . . . . . . . . . NA NA Reinvestment of distributions – Select Class . . . . . . . . . . . . . . . . . . . . . . . . . . . . . . . . . . . . . . . . . . . . . . . . . . . . . . . . . . . . NA NA Cost of shares redeemed – Select Class . . . . . . . . . . . . . . . . . . . . . . . . . . . . . . . . . . . . . . . . . . . . . . . . . . . . . . . . . . . . . . . . . NA NA
————————————————————————————————————————————————————————————————————————Net increase (decrease) in net assets resulting from capital shares transactions – Select Class . . . . . . . . . . . . NA NA
————————————————————————————————————————————————————————————————————————Proceeds from shares sold – Service Class . . . . . . . . . . . . . . . . . . . . . . . . . . . . . . . . . . . . . . . . . . . . . . . . . . . . . . . . . . . . . . 742,085,161 1,881,382,541 Reinvestment of distributions – Service Class . . . . . . . . . . . . . . . . . . . . . . . . . . . . . . . . . . . . . . . . . . . . . . . . . . . . . . . . . . . 108,140 4,343,250 Cost of shares redeemed – Service Class . . . . . . . . . . . . . . . . . . . . . . . . . . . . . . . . . . . . . . . . . . . . . . . . . . . . . . . . . . . . . . . . (1,053,686,469) (2,147,637,038)
————————————————————————————————————————————————————————————————————————Net increase (decrease) in net assets resulting from capital shares transactions – Service Class . . . . . . . . . . . (311,493,168) (261,911,247)
————————————————————————————————————————————————————————————————————————Net increase (decrease) in net assets resulting from capital shares transactions – Total . . . . . . . . . . . . . . . . . . . . . (1,789,175,744) (436,857,610)
————————————————————————————————————————————————————————————————————————Net increase (decrease) in net assets . . . . . . . . . . . . . . . . . . . . . . . . . . . . . . . . . . . . . . . . . . . . . . . . . . . . . . . . . . . . . . . . (1,789,348,677) (436,886,458)
——————————————————————————————————————————————————————————————————————————————Ending net assets . . . . . . . . . . . . . . . . . . . . . . . . . . . . . . . . . . . . . . . . . . . . . . . . . . . . . . . . . . . . . . . . . . . . . . . . . . . . . . . . . . $2,582,173,653 $4,371,522,330
——————————————————————————————————————————————————————————————————————————————
Ending balance of undistributed/(overdistributed) net investment income . . . . . . . . . . . . . . . . . . . . . . . . . . . . . . . . $ (1,037) $ (1,037)————————————————————————————————————————————————————————————————————————
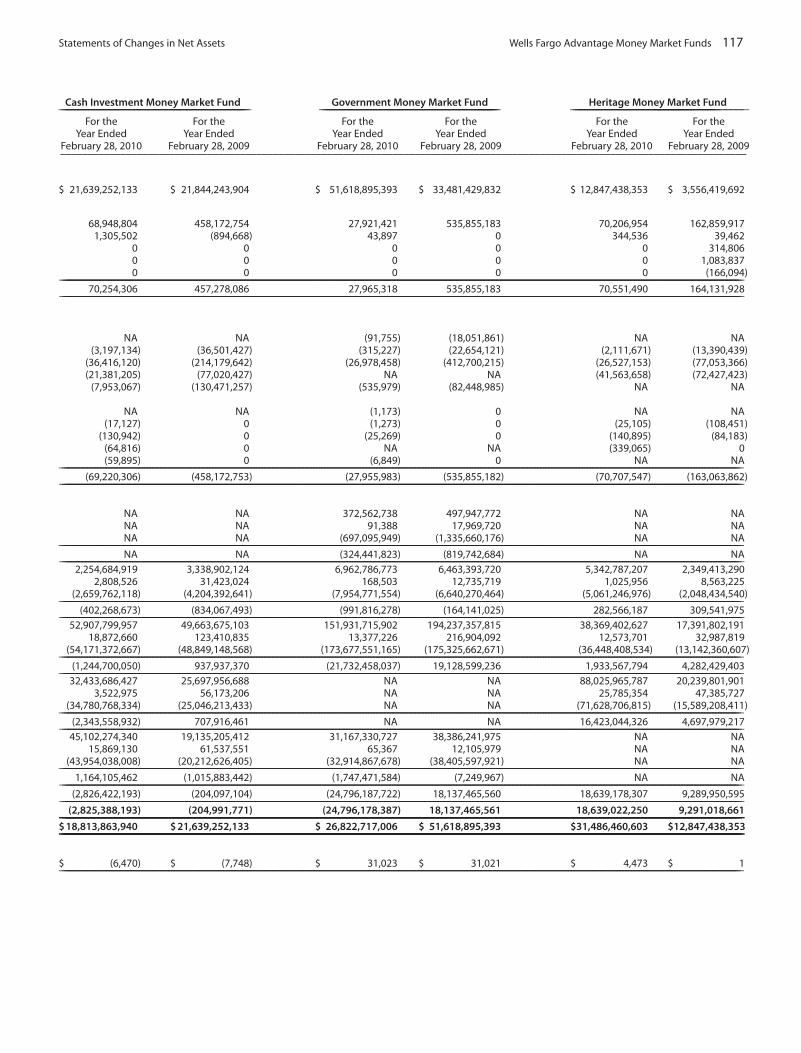
Statements of Changes in Net Assets Wells Fargo Advantage Money Market Funds 117
Cash Investment Money Market Fund Government Money Market Fund Heritage Money Market Fund———————————————————————————————————————————————————————————————————————— ———————————————————————————————————————————————————————————————————————— ————————————————————————————————————————————————————————————————————
For the For the For the For the For the For theYear Ended Year Ended Year Ended Year Ended Year Ended Year Ended
February 28, 2010 February 28, 2009 February 28, 2010 February 28, 2009 February 28, 2010 February 28, 2009––––––––––––––––––––––––––––––––––––––––––––––––––––––––––––––––––––––––––––––––––––––––––––––––––––––––––––––––––––––––––––––
$ 21,639,252,133 $ 21,844,243,904 $ 51,618,895,393 $ 33,481,429,832 $ 12,847,438,353 $ 3,556,419,692
68,948,804 458,172,754 27,921,421 535,855,183 70,206,954 162,859,917 1,305,502 (894,668) 43,897 0 344,536 39,462
0 0 0 0 0 314,806 0 0 0 0 0 1,083,837 0 0 0 0 0 (166,094)
—————————————————————————————————————————————————————————————————————————————————————————————————————————————————————————————————————————————————————————————————————————————————————————————————————————————————————————————————————————————————————————————70,254,306 457,278,086 27,965,318 535,855,183 70,551,490 164,131,928
—————————————————————————————————————————————————————————————————————————————————————————————————————————————————————————————————————————————————————————————————————————————————————————————————————————————————————————————————————————————————————————————
NA NA (91,755) (18,051,861) NA NA (3,197,134) (36,501,427) (315,227) (22,654,121) (2,111,671) (13,390,439)
(36,416,120) (214,179,642) (26,978,458) (412,700,215) (26,527,153) (77,053,366)(21,381,205) (77,020,427) NA NA (41,563,658) (72,427,423)
(7,953,067) (130,471,257) (535,979) (82,448,985) NA NA
NA NA (1,173) 0 NA NA (17,127) 0 (1,273) 0 (25,105) (108,451)
(130,942) 0 (25,269) 0 (140,895) (84,183)(64,816) 0 NA NA (339,065) 0(59,895) 0 (6,849) 0 NA NA
————————————————————————————————————————————————————————————————————————————————————————————————————————————————————————————————————————————————————————————————————————————————————————————————————————————————————————————————————————————————————————(69,220,306) (458,172,753) (27,955,983) (535,855,182) (70,707,547) (163,063,862)
—————————————————————————————————————————————————————————————————————————————————————————————————————————————————————————————————————————————————————————————————————————————————————————————————————————————————————————————————————————————————————————————
NA NA 372,562,738 497,947,772 NA NANA NA 91,388 17,969,720 NA NANA NA (697,095,949) (1,335,660,176) NA NA
————————————————————————————————————————————————————————————————————————————————————————————————————————————————————————————————————————————————————————————————————————————————————————————————————————————————————————————————————————————————————————NA NA (324,441,823) (819,742,684) NA NA
—————————————————————————————————————————————————————————————————————————————————————————————————————————————————————————————————————————————————————————————————————————————————————————————————————————————————————————————————————————————————————————————2,254,684,919 3,338,902,124 6,962,786,773 6,463,393,720 5,342,787,207 2,349,413,290
2,808,526 31,423,024 168,503 12,735,719 1,025,956 8,563,225 (2,659,762,118) (4,204,392,641) (7,954,771,554) (6,640,270,464) (5,061,246,976) (2,048,434,540)
————————————————————————————————————————————————————————————————————————————————————————————————————————————————————————————————————————————————————————————————————————————————————————————————————————————————————————————————————————————————————————(402,268,673) (834,067,493) (991,816,278) (164,141,025) 282,566,187 309,541,975
—————————————————————————————————————————————————————————————————————————————————————————————————————————————————————————————————————————————————————————————————————————————————————————————————————————————————————————————————————————————————————————————52,907,799,957 49,663,675,103 151,931,715,902 194,237,357,815 38,369,402,627 17,391,802,191
18,872,660 123,410,835 13,377,226 216,904,092 12,573,701 32,987,819 (54,171,372,667) (48,849,148,568) (173,677,551,165) (175,325,662,671) (36,448,408,534) (13,142,360,607)
————————————————————————————————————————————————————————————————————————————————————————————————————————————————————————————————————————————————————————————————————————————————————————————————————————————————————————————————————————————————————————(1,244,700,050) 937,937,370 (21,732,458,037) 19,128,599,236 1,933,567,794 4,282,429,403
————————————————————————————————————————————————————————————————————————————————————————————————————————————————————————————————————————————————————————————————————————————————————————————————————————————————————————————————————————————————————————32,433,686,427 25,697,956,688 NA NA 88,025,965,787 20,239,801,901
3,522,975 56,173,206 NA NA 25,785,354 47,385,727 (34,780,768,334) (25,046,213,433) NA NA (71,628,706,815) (15,589,208,411)
————————————————————————————————————————————————————————————————————————————————————————————————————————————————————————————————————————————————————————————————————————————————————————————————————————————————————————————————————————————————————————(2,343,558,932) 707,916,461 NA NA 16,423,044,326 4,697,979,217
—————————————————————————————————————————————————————————————————————————————————————————————————————————————————————————————————————————————————————————————————————————————————————————————————————————————————————————————————————————————————————————————45,102,274,340 19,135,205,412 31,167,330,727 38,386,241,975 NA NA
15,869,130 61,537,551 65,367 12,105,979 NA NA (43,954,038,008) (20,212,626,405) (32,914,867,678) (38,405,597,921) NA NA
————————————————————————————————————————————————————————————————————————————————————————————————————————————————————————————————————————————————————————————————————————————————————————————————————————————————————————————————————————————————————————1,164,105,462 (1,015,883,442) (1,747,471,584) (7,249,967) NA NA
—————————————————————————————————————————————————————————————————————————————————————————————————————————————————————————————————————————————————————————————————————————————————————————————————————————————————————————————————————————————————————————————(2,826,422,193) (204,097,104) (24,796,187,722) 18,137,465,560 18,639,178,307 9,289,950,595
—————————————————————————————————————————————————————————————————————————————————————————————————————————————————————————————————————————————————————————————————————————————————————————————————————————————————————————————————————————————————————————————(2,825,388,193) (204,991,771) (24,796,178,387) 18,137,465,561 18,639,022,250 9,291,018,661
——————————————————————————————————————————————————————————————————————————————————————————————————————————————————————————————————————————————————————————————————————————————————————————————————————————————————————————————————————————————————————————————$ 18,813,863,940 $ 21,639,252,133 $ 26,822,717,006 $ 51,618,895,393 $31,486,460,603 $12,847,438,353 ——————————————————————————————————————————————————————————————————————————————————————————————————————————————————————————————————————————————————————————————————————————————————————————————————————————————————————————————————————————————————————————————
$ (6,470) $ (7,748) $ 31,023 $ 31,021 $ 4,473 $ 1 ————————————————————————————————————————————————————————————————————————————————————————————————————————————————————————————————————————————————————————————————————————————————————————————————————————————————————————————————————————————————————————

118 Wells Fargo Advantage Money Market Funds Statements of Changes in Net Assets
The accompanying notes are an integral part of these financial statements.The accompanying notes are an integral part of these financial statements.
California Municipal Money Market Fund——————————————————————————————————————————————————————————————————————
For the For theYear Ended Year Ended
February 28, 2010 February 28, 2009-----------------------------------------------------------------------------------------------------------------------------------------------------------------------------------------------------------------------------------------------------------------------
Shares issued and redeemedShares sold – Class A . . . . . . . . . . . . . . . . . . . . . . . . . . . . . . . . . . . . . . . . . . . . . . . . . . . . . . . . . . . . . . . . . . . . . . . . . . . . . . . . . . . 2,402,281,400 4,548,812,448 Shares issued in reinvestment of distributions – Class A . . . . . . . . . . . . . . . . . . . . . . . . . . . . . . . . . . . . . . . . . . . . . . . . . 417,490 43,357,812 Shares redeemed – Class A . . . . . . . . . . . . . . . . . . . . . . . . . . . . . . . . . . . . . . . . . . . . . . . . . . . . . . . . . . . . . . . . . . . . . . . . . . . . . (3,746,180,886) (5,137,690,921)
—————————————————————————————————————————————————————————————————————Net decrease in shares outstanding – Class A . . . . . . . . . . . . . . . . . . . . . . . . . . . . . . . . . . . . . . . . . . . . . . . . . . . . . . . . . . . (1,343,481,996) (545,520,661)
—————————————————————————————————————————————————————————————————————Shares sold – Administrator Class . . . . . . . . . . . . . . . . . . . . . . . . . . . . . . . . . . . . . . . . . . . . . . . . . . . . . . . . . . . . . . . . . . . . . . . NA NA Shares issued in reinvestment of distributions – Administrator Class . . . . . . . . . . . . . . . . . . . . . . . . . . . . . . . . . . . . . NA NA Shares redeemed – Administrator Class . . . . . . . . . . . . . . . . . . . . . . . . . . . . . . . . . . . . . . . . . . . . . . . . . . . . . . . . . . . . . . . . NA NA
—————————————————————————————————————————————————————————————————————Net increase (decrease) in shares outstanding – Administrator Class . . . . . . . . . . . . . . . . . . . . . . . . . . . . . . . . . . . . . NA NA
—————————————————————————————————————————————————————————————————————Shares sold – Institutional Class . . . . . . . . . . . . . . . . . . . . . . . . . . . . . . . . . . . . . . . . . . . . . . . . . . . . . . . . . . . . . . . . . . . . . . . . 1,790,297,628 2,067,029,869 Shares issued in reinvestment of distributions – Institutional Class . . . . . . . . . . . . . . . . . . . . . . . . . . . . . . . . . . . . . . 464,816 3,288,168 Shares redeemed – Institutional Class . . . . . . . . . . . . . . . . . . . . . . . . . . . . . . . . . . . . . . . . . . . . . . . . . . . . . . . . . . . . . . . . . . (1,924,963,024) (1,699,743,739)
—————————————————————————————————————————————————————————————————————Net increase (decrease) in shares outstanding – Institutional Class . . . . . . . . . . . . . . . . . . . . . . . . . . . . . . . . . . . . . . (134,200,580) 370,574,298
—————————————————————————————————————————————————————————————————————Shares sold – Select Class . . . . . . . . . . . . . . . . . . . . . . . . . . . . . . . . . . . . . . . . . . . . . . . . . . . . . . . . . . . . . . . . . . . . . . . . . . . . . . NA NA Shares issued in reinvestment of distributions – Select Class . . . . . . . . . . . . . . . . . . . . . . . . . . . . . . . . . . . . . . . . . . . . NA NA Shares redeemed – Select Class . . . . . . . . . . . . . . . . . . . . . . . . . . . . . . . . . . . . . . . . . . . . . . . . . . . . . . . . . . . . . . . . . . . . . . . . NA NA
—————————————————————————————————————————————————————————————————————Net increase in shares outstanding – Select Class . . . . . . . . . . . . . . . . . . . . . . . . . . . . . . . . . . . . . . . . . . . . . . . . . . . . . . . NA NA
—————————————————————————————————————————————————————————————————————Shares sold – Service Class . . . . . . . . . . . . . . . . . . . . . . . . . . . . . . . . . . . . . . . . . . . . . . . . . . . . . . . . . . . . . . . . . . . . . . . . . . . . . 742,085,161 1,881,382,541 Shares issued in reinvestment of distributions – Service Class . . . . . . . . . . . . . . . . . . . . . . . . . . . . . . . . . . . . . . . . . . . 108,140 4,343,250 Shares redeemed – Service Class . . . . . . . . . . . . . . . . . . . . . . . . . . . . . . . . . . . . . . . . . . . . . . . . . . . . . . . . . . . . . . . . . . . . . . . (1,053,686,469) (2,147,637,038)
—————————————————————————————————————————————————————————————————————Net decrease in shares outstanding – Service Class . . . . . . . . . . . . . . . . . . . . . . . . . . . . . . . . . . . . . . . . . . . . . . . . . . . . . (311,493,168) (261,911,247)
—————————————————————————————————————————————————————————————————————Net increase (decrease) in shares outstanding resulting from capital shares transactions . . . . . . . . . . . . . . (1,789,175,744) (436,857,610)
——————————————————————————————————————————————————————————————————————————————

Statements of Changes in Net Assets Wells Fargo Advantage Money Market Funds 119
Cash Investment Money Market Fund Government Money Market Fund Heritage Money Market Fund———————————————————————————————————————————————————————————————————————— ———————————————————————————————————————————————————————————————————————— ————————————————————————————————————————————————————————————————————
For the For the For the For the For the For theYear Ended Year Ended Year Ended Year Ended Year Ended Year Ended
February 28, 2010 February 28, 2009 February 28, 2010 February 28, 2009 February 28, 2010 February 28, 2009––––––––––––––––––––––––––––––––––––––––––––––––––––––––––––––––––––––––––––––––––––––––––––––––––––––––––––––––––––––––––––––
NA NA 372,562,738 497,947,772 NA NA NA NA 91,388 17,969,720 NA NA NA NA (697,095,949) (1,335,660,176) NA NA
————————————————————————————————————————————————————————————————————————————————————————————————————————————————————————————————————————————————————————————————————————————————————————————————————————————————————————————————————————————————————————NA NA (324,441,823) (819,742,684) NA NA
————————————————————————————————————————————————————————————————————————————————————————————————————————————————————————————————————————————————————————————————————————————————————————————————————————————————————————————————————————————————————————2,254,684,919 3,338,902,124 6,962,786,773 6,463,393,720 5,342,787,207 2,349,413,290
2,808,526 31,423,024 168,503 12,735,719 1,025,956 8,563,225 (2,659,762,118) (4,204,392,641) (7,954,771,554) (6,640,270,464) (5,061,246,976) (2,048,434,540)
———————————————————————————————————————————————————————————————————————————————————————————————————————————————————————————————————————————————————————————————————————————————————————————————————————————————————————————————————————————————————(402,268,673) (834,067,493) (991,816,278) (164,141,025) 282,566,187 309,541,975
————————————————————————————————————————————————————————————————————————————————————————————————————————————————————————————————————————————————————————————————————————————————————————————————————————————————————————————————————————————————————————52,907,799,957 49,663,675,103 151,931,715,902 194,237,357,816 38,369,402,627 17,391,802,192
18,872,660 123,410,835 13,377,226 216,904,092 12,573,701 32,987,819 (54,171,372,667) (48,849,148,568) (173,677,551,165) (175,325,662,671) (36,448,408,534) (13,142,360,607)
————————————————————————————————————————————————————————————————————————————————————————————————————————————————————————————————————————————————————————————————————————————————————————————————————————————————————————————————————————————————————————(1,244,700,050) 937,937,370 (21,732,458,037) 19,128,599,237 1,933,567,794 4,282,429,404
————————————————————————————————————————————————————————————————————————————————————————————————————————————————————————————————————————————————————————————————————————————————————————————————————————————————————————————————————————————————————————32,433,686,427 25,697,956,688 NA NA 88,025,965,787 20,239,801,900
3,522,975 56,173,206 NA NA 25,785,354 47,385,727 (34,780,768,334) (25,046,213,433) NA NA (71,628,706,815) (15,589,208,411)
————————————————————————————————————————————————————————————————————————————————————————————————————————————————————————————————————————————————————————————————————————————————————————————————————————————————————————————————————————————————————————(2,343,558,932) 707,916,461 NA NA 16,423,044,326 4,697,979,216
————————————————————————————————————————————————————————————————————————————————————————————————————————————————————————————————————————————————————————————————————————————————————————————————————————————————————————————————————————————————————————45,102,274,340 19,135,201,385 31,167,330,727 38,386,241,975 NA NA
15,869,130 61,537,551 65,367 12,105,979 NA NA (43,954,038,008) (20,212,626,405) (32,914,867,678) (38,405,597,921) NA NA
————————————————————————————————————————————————————————————————————————————————————————————————————————————————————————————————————————————————————————————————————————————————————————————————————————————————————————————————————————————————————————1,164,105,462 (1,015,887,469) (1,747,471,584) (7,249,967) NA NA
————————————————————————————————————————————————————————————————————————————————————————————————————————————————————————————————————————————————————————————————————————————————————————————————————————————————————————————————————————————————————————(2,826,422,193) (204,101,128) (24,796,187,722) 18,137,465,561 18,639,178,307 9,289,950,595
——————————————————————————————————————————————————————————————————————————————————————————————————————————————————————————————————————————————————————————————————————————————————————————————————————————————————————————————————————————————————————————————

120 Wells Fargo Advantage Money Market Funds Statements of Changes in Net Assets
The accompanying notes are an integral part of these financial statements.The accompanying notes are an integral part of these financial statements.
Municipal Money Market Fund————————————————————————————————————————————————————————————————————
For the For theYear Ended Year Ended
February 28, 2010 February 28, 2009-----------------------------------------------------------------------------------------------------------------------------------------------------------------------------------------------------------------------------------------------------------------------
INCREASE (DECREASE) IN NET ASSETSBeginning net assets . . . . . . . . . . . . . . . . . . . . . . . . . . . . . . . . . . . . . . . . . . . . . . . . . . . . . . . . . . . . . . . . . . . . . . . . . . . . . . . . . . . . . $390,783,207 $388,515,904
OperationsNet investment income . . . . . . . . . . . . . . . . . . . . . . . . . . . . . . . . . . . . . . . . . . . . . . . . . . . . . . . . . . . . . . . . . . . . . . . . . . . . . . . . . . . 683,998 6,267,957 Net realized gain (loss) on investments . . . . . . . . . . . . . . . . . . . . . . . . . . . . . . . . . . . . . . . . . . . . . . . . . . . . . . . . . . . . . . . . . . . . (28) 413 Net realized gain of capital support agreement . . . . . . . . . . . . . . . . . . . . . . . . . . . . . . . . . . . . . . . . . . . . . . . . . . . . . . . . . . . 0 0 Net change in unrealized appreciation of capital support agreement . . . . . . . . . . . . . . . . . . . . . . . . . . . . . . . . . . . . . . 0 0 Net change in unrealized depreciation of investments . . . . . . . . . . . . . . . . . . . . . . . . . . . . . . . . . . . . . . . . . . . . . . . . . . . . . 0 0
—————————————————————————————————————————————————————————————————Net increase in net assets resulting from operations . . . . . . . . . . . . . . . . . . . . . . . . . . . . . . . . . . . . . . . . . . . . . . . . . . . . . . . . . 683,970 6,268,370
—————————————————————————————————————————————————————————————————
Distributions to shareholders fromNet investment income
Class A . . . . . . . . . . . . . . . . . . . . . . . . . . . . . . . . . . . . . . . . . . . . . . . . . . . . . . . . . . . . . . . . . . . . . . . . . . . . . . . . . . . . . . . . . . . . . . . . . NA NA Administrator Class . . . . . . . . . . . . . . . . . . . . . . . . . . . . . . . . . . . . . . . . . . . . . . . . . . . . . . . . . . . . . . . . . . . . . . . . . . . . . . . . . . . . . NA NA Institutional Class . . . . . . . . . . . . . . . . . . . . . . . . . . . . . . . . . . . . . . . . . . . . . . . . . . . . . . . . . . . . . . . . . . . . . . . . . . . . . . . . . . . . . . . (390,112) (489,012)Investor Class . . . . . . . . . . . . . . . . . . . . . . . . . . . . . . . . . . . . . . . . . . . . . . . . . . . . . . . . . . . . . . . . . . . . . . . . . . . . . . . . . . . . . . . . . . . (293,889) (5,778,945)Select Class . . . . . . . . . . . . . . . . . . . . . . . . . . . . . . . . . . . . . . . . . . . . . . . . . . . . . . . . . . . . . . . . . . . . . . . . . . . . . . . . . . . . . . . . . . . . . NA NA Service Class . . . . . . . . . . . . . . . . . . . . . . . . . . . . . . . . . . . . . . . . . . . . . . . . . . . . . . . . . . . . . . . . . . . . . . . . . . . . . . . . . . . . . . . . . . . NA NA
Net realized gain on sales of investmentsClass A . . . . . . . . . . . . . . . . . . . . . . . . . . . . . . . . . . . . . . . . . . . . . . . . . . . . . . . . . . . . . . . . . . . . . . . . . . . . . . . . . . . . . . . . . . . . . . . . . NA NA Administrator Class . . . . . . . . . . . . . . . . . . . . . . . . . . . . . . . . . . . . . . . . . . . . . . . . . . . . . . . . . . . . . . . . . . . . . . . . . . . . . . . . . . . . . NA NA Institutional Class . . . . . . . . . . . . . . . . . . . . . . . . . . . . . . . . . . . . . . . . . . . . . . . . . . . . . . . . . . . . . . . . . . . . . . . . . . . . . . . . . . . . . . . 0 0 Select Class . . . . . . . . . . . . . . . . . . . . . . . . . . . . . . . . . . . . . . . . . . . . . . . . . . . . . . . . . . . . . . . . . . . . . . . . . . . . . . . . . . . . . . . . . . . . . NA NAService Class . . . . . . . . . . . . . . . . . . . . . . . . . . . . . . . . . . . . . . . . . . . . . . . . . . . . . . . . . . . . . . . . . . . . . . . . . . . . . . . . . . . . . . . . . . . NA NA
—————————————————————————————————————————————————————————————————Total distribution to shareholders . . . . . . . . . . . . . . . . . . . . . . . . . . . . . . . . . . . . . . . . . . . . . . . . . . . . . . . . . . . . . . . . . . . . . . . . . . . (684,001) (6,267,957)
–––––––––––––––––––––––––––––––––––––
Capital shares transactionsProceeds from shares sold – Class A . . . . . . . . . . . . . . . . . . . . . . . . . . . . . . . . . . . . . . . . . . . . . . . . . . . . . . . . . . . . . . . . . . . . . . . NA NAReinvestment of distributions – Class A . . . . . . . . . . . . . . . . . . . . . . . . . . . . . . . . . . . . . . . . . . . . . . . . . . . . . . . . . . . . . . . . . . . NA NACost of shares redeemed – Class A . . . . . . . . . . . . . . . . . . . . . . . . . . . . . . . . . . . . . . . . . . . . . . . . . . . . . . . . . . . . . . . . . . . . . . . . NA NA
—————————————————————————————————————————————————————————————————Net increase (decrease) in net assets resulting from capital shares transactions – Class A . . . . . . . . . . . . . . . . . . . NA NA
—————————————————————————————————————————————————————————————————Proceeds from shares sold – Administrator Class . . . . . . . . . . . . . . . . . . . . . . . . . . . . . . . . . . . . . . . . . . . . . . . . . . . . . . . . . . NA NAReinvestment of distributions – Administrator Class . . . . . . . . . . . . . . . . . . . . . . . . . . . . . . . . . . . . . . . . . . . . . . . . . . . . . . . NA NACost of shares redeemed – Administrator Class . . . . . . . . . . . . . . . . . . . . . . . . . . . . . . . . . . . . . . . . . . . . . . . . . . . . . . . . . . . . NA NA
—————————————————————————————————————————————————————————————————Net increase (decrease) in net assets resulting from capital shares transactions – Administrator Class . . . . . . . NA NA
—————————————————————————————————————————————————————————————————Proceeds from shares sold – Institutional Class . . . . . . . . . . . . . . . . . . . . . . . . . . . . . . . . . . . . . . . . . . . . . . . . . . . . . . . . . . . . 438,013,289 152,067,708 Reinvestment of distributions – Institutional Class . . . . . . . . . . . . . . . . . . . . . . . . . . . . . . . . . . . . . . . . . . . . . . . . . . . . . . . . . 387,606 466,151 Cost of shares redeemed – Institutional Class . . . . . . . . . . . . . . . . . . . . . . . . . . . . . . . . . . . . . . . . . . . . . . . . . . . . . . . . . . . . . (359,115,841) (102,863,106)
—————————————————————————————————————————————————————————————————Net increase (decrease) in net assets resulting from capital shares transactions – Institutional Class . . . . . . . . . 79,285,054 49,670,753
—————————————————————————————————————————————————————————————————Proceeds from shares sold – Investor Class . . . . . . . . . . . . . . . . . . . . . . . . . . . . . . . . . . . . . . . . . . . . . . . . . . . . . . . . . . . . . . . . 102,788,396 279,131,426 Reinvestment of distributions – Investor Class . . . . . . . . . . . . . . . . . . . . . . . . . . . . . . . . . . . . . . . . . . . . . . . . . . . . . . . . . . . . . 288,439 5,623,380 Cost of shares redeemed – Investor Class . . . . . . . . . . . . . . . . . . . . . . . . . . . . . . . . . . . . . . . . . . . . . . . . . . . . . . . . . . . . . . . . . (190,215,549) (332,158,669)
—————————————————————————————————————————————————————————————————Net decrease in net assets resulting from capital shares transactions – Investor Class . . . . . . . . . . . . . . . . . . . . . . . (87,138,714) (47,403,863)
—————————————————————————————————————————————————————————————————Proceeds from shares sold – Service Class . . . . . . . . . . . . . . . . . . . . . . . . . . . . . . . . . . . . . . . . . . . . . . . . . . . . . . . . . . . . . . . . NA NAReinvestment of distributions – Service Class . . . . . . . . . . . . . . . . . . . . . . . . . . . . . . . . . . . . . . . . . . . . . . . . . . . . . . . . . . . . . . NA NACost of shares redeemed – Service Class . . . . . . . . . . . . . . . . . . . . . . . . . . . . . . . . . . . . . . . . . . . . . . . . . . . . . . . . . . . . . . . . . . NA NA
—————————————————————————————————————————————————————————————————Net increase (decrease) in net assets resulting from capital shares transactions – Service Class . . . . . . . . . . . . . . NA NA
—————————————————————————————————————————————————————————————————Net increase (decrease) in net assets resulting from capital shares transactions – Total . . . . . . . . . . . . . . . . . . . . . . . (7,853,660) 2,266,890
—————————————————————————————————————————————————————————————————Net increase (decrease) in net assets . . . . . . . . . . . . . . . . . . . . . . . . . . . . . . . . . . . . . . . . . . . . . . . . . . . . . . . . . . . . . . . . . . . (7,853,691) 2,267,303
—————————————————————————————————————————————————————————————————————————————————————————————————Ending net assets . . . . . . . . . . . . . . . . . . . . . . . . . . . . . . . . . . . . . . . . . . . . . . . . . . . . . . . . . . . . . . . . . . . . . . . . . . . . . . . . . . . . . $382,929,516 $390,783,207
—————————————————————————————————————————————————————————————————————————
Ending balance of undistributed/(overdistributed) net investment income . . . . . . . . . . . . . . . . . . . . . . . . . . . . . . . . . . $ 0 $ 3 —————————————————————————————————————————————————————————————————

Statements of Changes in Net Assets Wells Fargo Advantage Money Market Funds 121
National Tax-Free Money Market Fund Prime Investment Money Market Fund Treasury Plus Money Market Fund————————————————————————————————————————————————————————————————————— ————————————————————————————————————————————————————————————————————— —————————————————————————————————————————————————————————————
For the For the For the For the For the For theYear Ended Year Ended Year Ended Year Ended Year Ended Year Ended
February 28, 2010 February 28, 2009 February 28, 2010 February 28, 2009 February 28, 2010 February 28, 2009––––––––––––––––––––––––––––––––––––––––––––––––––––––––––––––––––––––––––––––––––––––––––––––––––––––––––––––––––––––––––––––
$ 6,341,982,747 $ 5,158,034,269 $ 10,649,227,443 $ 8,927,810,131 $ 8,569,692,575 $ 6,774,952,740
9,561,850 95,033,256 30,910,277 194,615,732 1,502,924 66,685,987 329,201 723,479 191,889 (25,184,437) 0 0
0 0 0 26,968,360 0 0 0 0 0 17,341,096 0 0 0 0 0 (14,228,707) 0 0
————————————————————————————————————————————————————————————————————————————————————————————————————————————————————————————————————————————————————————————————————————————————————————————————————————————————————————————————————————————————————————9,891,051 95,756,735 31,102,166 199,512,044 1,502,924 66,685,987
————————————————————————————————————————————————————————————————————————————————————————————————————————————————————————————————————————————————————————————————————————————————————————————————————————————————————————————————————————————————————————
(556,154) (20,489,704) NA NA (202,070) (19,300,283)(910,229) (8,905,643) NA NA (12,911) (614,370)
(6,501,763) (39,431,748) (29,986,894) (162,366,889) (1,209,797) (35,734,600)NA NA NA NA NA NA NA NA NA NA NA NA
(1,593,687) (26,206,163) (922,105) (33,217,896) (78,147) (11,036,735)
(84,941) (293,961) NA NA 0 0 (38,014) (96,168) NA NA 0 0
(169,665) (359,482) (289,017) (766,699) 0 0 NA NA NA NA NA NA
(90,859) (330,682) (25,091) (221,766) 0 0————————————————————————————————————————————————————————————————————————————————————————————————————————————————————————————————————————————————————————————————————————————————————————————————————————————————————————————————————————————————————————
(9,945,312) (96,113,551) (31,223,107) (196,573,250) (1,502,925) (66,685,988)------------------------------------------------------------------------------------------------------------------------------------------------------------------------------------------------------------------------------------------------------------------------------------------------------------
1,205,818,801 2,123,658,304 NA NA 9,129,776,256 16,042,997,923 644,234 20,254,527 NA NA 71,085 5,484,813
(1,756,338,646) (2,137,935,035) NA NA (10,011,375,553) (16,202,411,965)————————————————————————————————————————————————————————————————————————————————————————————————————————————————————————————————————————————————————————————————————————————————————————————————————————————————————————————————————————————————————————
(549,875,611) 5,977,796 NA NA (881,528,212) (153,929,229)————————————————————————————————————————————————————————————————————————————————————————————————————————————————————————————————————————————————————————————————————————————————————————————————————————————————————————————————————————————————————————
470,840,097 634,488,238 NA NA 580,986,791 621,596,071 916,869 8,739,557 NA NA 12,674 613,450
(569,314,030) (643,344,000) NA NA (533,401,775) (489,786,230)————————————————————————————————————————————————————————————————————————————————————————————————————————————————————————————————————————————————————————————————————————————————————————————————————————————————————————————————————————————————————————
(97,557,064) (116,205) NA NA 47,597,690 132,423,291 ————————————————————————————————————————————————————————————————————————————————————————————————————————————————————————————————————————————————————————————————————————————————————————————————————————————————————————————————————————————————————————
8,019,262,600 10,580,163,832 88,393,755,276 73,064,512,821 35,941,648,948 44,427,682,682 3,701,725 19,983,612 10,209,420 51,231,205 530,506 14,105,020
(8,355,250,035) (9,622,792,083) (87,701,480,100) (71,221,048,152) (36,943,126,319) (42,300,759,328)————————————————————————————————————————————————————————————————————————————————————————————————————————————————————————————————————————————————————————————————————————————————————————————————————————————————————————————————————————————————————————
(332,285,710) 977,355,361 702,484,596 1,894,695,874 (1,000,946,865) 2,141,028,374 ————————————————————————————————————————————————————————————————————————————————————————————————————————————————————————————————————————————————————————————————————————————————————————————————————————————————————————————————————————————————————————
NA NA NA NA NA NANA NA NA NA NA NANA NA NA NA NA NA
————————————————————————————————————————————————————————————————————————————————————————————————————————————————————————————————————————————————————————————————————————————————————————————————————————————————————————————————————————————————————————NA NA NA NA NA NA
————————————————————————————————————————————————————————————————————————————————————————————————————————————————————————————————————————————————————————————————————————————————————————————————————————————————————————————————————————————————————————1,614,119,092 2,883,412,321 87,384,178,808 133,263,105,578 7,688,485,834 13,764,905,639
248,690 4,852,802 51,310 1,822,623 8,743 948,304 (2,433,961,093) (2,687,176,781) (87,710,524,485) (133,441,145,857) (7,848,817,003) (14,090,636,543)
————————————————————————————————————————————————————————————————————————————————————————————————————————————————————————————————————————————————————————————————————————————————————————————————————————————————————————————————————————————————————————(819,593,311) 201,088,342 (326,294,367) (176,217,656) (160,322,426) (324,782,600)
——————————————————————————————————————————————————————————————————————————————————————————————————————————————————————————————————————————————————————————————————————————————————————————————————————————————————————————————————————————————————————————————(1,799,311,696) 1,184,305,294 376,190,229 1,718,478,218 (1,995,199,813) 1,794,739,836
————————————————————————————————————————————————————————————————————————————————————————————————————————————————————————————————————————————————————————————————————————————————————————————————————————————————————————————————————————————————————————(1,799,365,957) 1,183,948,478 376,069,288 1,721,417,012 (1,995,199,814) 1,794,739,835
——————————————————————————————————————————————————————————————————————————————————————————————————————————————————————————————————————————————————————————————————————————————————————————————————————————————————————————————————————————————————————————————--$ 4,542,616,790 $6,341,982,747 $11,025,296,731 $ 10,649,227,143 $ 6,574,492,761 $ 8,569,692,575
——————————————————————————————————————————————————————————————————————————————————————————————————————————————————————————————————————————————————————————————————————————————————————————————————————————————————————————————————————————————————————————————--
$ 15 $ (2) $ 1,278 $ 0 $ 20,213 $ 20,214 ————————————————————————————————————————————————————————————————————————————————————————————————————————————————————————————————————————————————————————————————————————————————————————————————————————————————————————————————————————————————————————

122 Wells Fargo Advantage Money Market Funds Statements of Changes in Net Assets
The accompanying notes are an integral part of these financial statements.The accompanying notes are an integral part of these financial statements.
Municipal Money Market Fund————————————————————————————————————————————————————————————————————
For the For theYear Ended Year Ended
February 28, 2010 February 28, 2009-----------------------------------------------------------------------------------------------------------------------------------------------------------------------------------------------------------------------------------------------------------------------
Shares issued and redeemedShares sold – Class A . . . . . . . . . . . . . . . . . . . . . . . . . . . . . . . . . . . . . . . . . . . . . . . . . . . . . . . . . . . . . . . . . . . . . . . . . . . . . . . . . . . . . NA NA Shares issued in reinvestment of distributions – Class A . . . . . . . . . . . . . . . . . . . . . . . . . . . . . . . . . . . . . . . . . . . . . . . . . . . NA NA Shares redeemed – Class A . . . . . . . . . . . . . . . . . . . . . . . . . . . . . . . . . . . . . . . . . . . . . . . . . . . . . . . . . . . . . . . . . . . . . . . . . . . . . . . NA NA
—————————————————————————————————————————————————————————————————Net increase (decrease) in shares outstanding – Class A . . . . . . . . . . . . . . . . . . . . . . . . . . . . . . . . . . . . . . . . . . . . . . . . . . . NA NA
—————————————————————————————————————————————————————————————————Shares sold – Administrator Class . . . . . . . . . . . . . . . . . . . . . . . . . . . . . . . . . . . . . . . . . . . . . . . . . . . . . . . . . . . . . . . . . . . . . . . . . NA NA Shares issued in reinvestment of distributions – Administrator Class . . . . . . . . . . . . . . . . . . . . . . . . . . . . . . . . . . . . . . . NA NA Shares redeemed – Administrator Class . . . . . . . . . . . . . . . . . . . . . . . . . . . . . . . . . . . . . . . . . . . . . . . . . . . . . . . . . . . . . . . . . . NA NA
—————————————————————————————————————————————————————————————————Net increase (decrease) in shares outstanding – Administrator Class . . . . . . . . . . . . . . . . . . . . . . . . . . . . . . . . . . . . . . . NA NA
—————————————————————————————————————————————————————————————————Shares sold – Institutional Class . . . . . . . . . . . . . . . . . . . . . . . . . . . . . . . . . . . . . . . . . . . . . . . . . . . . . . . . . . . . . . . . . . . . . . . . . . . 438,013,289 152,067,708 Shares issued in reinvestment of distributions – Institutional Class . . . . . . . . . . . . . . . . . . . . . . . . . . . . . . . . . . . . . . . . . 387,606 466,151 Shares redeemed – Institutional Class . . . . . . . . . . . . . . . . . . . . . . . . . . . . . . . . . . . . . . . . . . . . . . . . . . . . . . . . . . . . . . . . . . . . (359,115,841) (102,863,106)
—————————————————————————————————————————————————————————————————Net increase (decrease) in shares outstanding – Institutional Class . . . . . . . . . . . . . . . . . . . . . . . . . . . . . . . . . . . . . . . . 79,285,054 49,670,753
—————————————————————————————————————————————————————————————————Shares sold – Investor Class . . . . . . . . . . . . . . . . . . . . . . . . . . . . . . . . . . . . . . . . . . . . . . . . . . . . . . . . . . . . . . . . . . . . . . . . . . . . . . . 102,788,396 279,131,426 Shares issued in reinvestment of distributions – Investor Class . . . . . . . . . . . . . . . . . . . . . . . . . . . . . . . . . . . . . . . . . . . . . 288,439 5,623,380 Shares redeemed – Investor Class . . . . . . . . . . . . . . . . . . . . . . . . . . . . . . . . . . . . . . . . . . . . . . . . . . . . . . . . . . . . . . . . . . . . . . . . (190,215,549) (332,158,669)
—————————————————————————————————————————————————————————————————Net decrease in shares outstanding – Investor Class . . . . . . . . . . . . . . . . . . . . . . . . . . . . . . . . . . . . . . . . . . . . . . . . . . . . . . (87,138,714) (47,403,863)
—————————————————————————————————————————————————————————————————Shares sold – Service Class . . . . . . . . . . . . . . . . . . . . . . . . . . . . . . . . . . . . . . . . . . . . . . . . . . . . . . . . . . . . . . . . . . . . . . . . . . . . . . . . NA NA Shares issued in reinvestment of distributions – Service Class . . . . . . . . . . . . . . . . . . . . . . . . . . . . . . . . . . . . . . . . . . . . . . NA NA Shares redeemed – Service Class . . . . . . . . . . . . . . . . . . . . . . . . . . . . . . . . . . . . . . . . . . . . . . . . . . . . . . . . . . . . . . . . . . . . . . . . . NA NA
—————————————————————————————————————————————————————————————————Net increase (decrease) in shares outstanding – Service Class . . . . . . . . . . . . . . . . . . . . . . . . . . . . . . . . . . . . . . . . . . . . . NA NA
—————————————————————————————————————————————————————————————————Net increase (decrease) in shares outstanding resulting from capital shares transactions . . . . . . . . . . . . . . . . . (7,853,660) 2,266,890
—————————————————————————————————————————————————————————————————————————
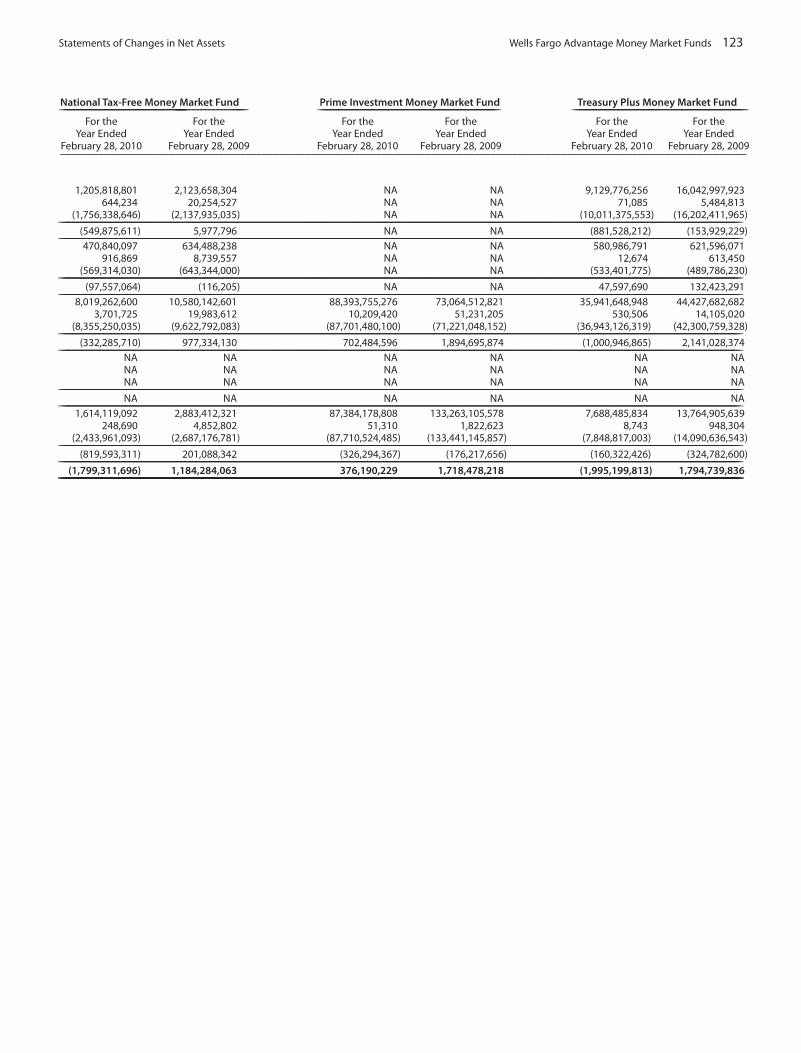
Statements of Changes in Net Assets Wells Fargo Advantage Money Market Funds 123
National Tax-Free Money Market Fund Prime Investment Money Market Fund Treasury Plus Money Market Fund————————————————————————————————————————————————————————————————————— ————————————————————————————————————————————————————————————————————— ——————————————————————————————————————————————————————————————————
For the For the For the For the For the For theYear Ended Year Ended Year Ended Year Ended Year Ended Year Ended
February 28, 2010 February 28, 2009 February 28, 2010 February 28, 2009 February 28, 2010 February 28, 2009––––––––––––––––––––––––––––––––––––––––––––––––––––––––––––––––––––––––––––––––––––––––––––––––––––––––––––––––––––––––––––––
1,205,818,801 2,123,658,304 NA NA 9,129,776,256 16,042,997,923 644,234 20,254,527 NA NA 71,085 5,484,813
(1,756,338,646) (2,137,935,035) NA NA (10,011,375,553) (16,202,411,965)————————————————————————————————————————————————————————————————————————————————————————————————————————————————————————————————————————————————————————————————————————————————————————————————————————————————————————————————————————————————————————
(549,875,611) 5,977,796 NA NA (881,528,212) (153,929,229)————————————————————————————————————————————————————————————————————————————————————————————————————————————————————————————————————————————————————————————————————————————————————————————————————————————————————————————————————————————————————————
470,840,097 634,488,238 NA NA 580,986,791 621,596,071 916,869 8,739,557 NA NA 12,674 613,450
(569,314,030) (643,344,000) NA NA (533,401,775) (489,786,230)————————————————————————————————————————————————————————————————————————————————————————————————————————————————————————————————————————————————————————————————————————————————————————————————————————————————————————————————————————————————————————
(97,557,064) (116,205) NA NA 47,597,690 132,423,291 ————————————————————————————————————————————————————————————————————————————————————————————————————————————————————————————————————————————————————————————————————————————————————————————————————————————————————————————————————————————————————————
8,019,262,600 10,580,142,601 88,393,755,276 73,064,512,821 35,941,648,948 44,427,682,682 3,701,725 19,983,612 10,209,420 51,231,205 530,506 14,105,020
(8,355,250,035) (9,622,792,083) (87,701,480,100) (71,221,048,152) (36,943,126,319) (42,300,759,328)————————————————————————————————————————————————————————————————————————————————————————————————————————————————————————————————————————————————————————————————————————————————————————————————————————————————————————————————————————————————————————
(332,285,710) 977,334,130 702,484,596 1,894,695,874 (1,000,946,865) 2,141,028,374 ————————————————————————————————————————————————————————————————————————————————————————————————————————————————————————————————————————————————————————————————————————————————————————————————————————————————————————————————————————————————————————
NA NA NA NA NA NA NA NA NA NA NA NA NA NA NA NA NA NA
————————————————————————————————————————————————————————————————————————————————————————————————————————————————————————————————————————————————————————————————————————————————————————————————————————————————————————————————————————————————————————NA NA NA NA NA NA
————————————————————————————————————————————————————————————————————————————————————————————————————————————————————————————————————————————————————————————————————————————————————————————————————————————————————————————————————————————————————————1,614,119,092 2,883,412,321 87,384,178,808 133,263,105,578 7,688,485,834 13,764,905,639
248,690 4,852,802 51,310 1,822,623 8,743 948,304 (2,433,961,093) (2,687,176,781) (87,710,524,485) (133,441,145,857) (7,848,817,003) (14,090,636,543)
————————————————————————————————————————————————————————————————————————————————————————————————————————————————————————————————————————————————————————————————————————————————————————————————————————————————————————————————————————————————————————(819,593,311) 201,088,342 (326,294,367) (176,217,656) (160,322,426) (324,782,600)
————————————————————————————————————————————————————————————————————————————————————————————————————————————————————————————————————————————————————————————————————————————————————————————————————————————————————————————————————————————————————————(1,799,311,696) 1,184,284,063 376,190,229 1,718,478,218 (1,995,199,813) 1,794,739,836
——————————————————————————————————————————————————————————————————————————————————————————————————————————————————————————————————————————————————————————————————————————————————————————————————————————————————————————————————————————————————————————————

124 Wells Fargo Advantage Money Market Funds Statements of Changes in Net Assets
The accompanying notes are an integral part of these financial statements.The accompanying notes are an integral part of these financial statements.
INCREASE IN NET ASSETSBeginning net assets . . . . . . . . . . . . . . . . . . . . . . . . . . . . . . . . . . . . . . . . . . . . . . . . . . . . . . . . . . . . . . . . . . . . . . . . . . . . . . . . . $ 7,947,801,874 $ 6,337,429,815
OperationsNet investment income . . . . . . . . . . . . . . . . . . . . . . . . . . . . . . . . . . . . . . . . . . . . . . . . . . . . . . . . . . . . . . . . . . . . . . . . . . . . . . 683,644 55,720,253 Net realized gain on investments . . . . . . . . . . . . . . . . . . . . . . . . . . . . . . . . . . . . . . . . . . . . . . . . . . . . . . . . . . . . . . . . . . . . . 360,468 2,323,870
—————————————————————————————————————————————————————————————————————————Net increase in net assets resulting from operations . . . . . . . . . . . . . . . . . . . . . . . . . . . . . . . . . . . . . . . . . . . . . . . . . . . . 1,044,112 58,044,123
—————————————————————————————————————————————————————————————————————————
Distributions to shareholders fromNet investment income
Class A . . . . . . . . . . . . . . . . . . . . . . . . . . . . . . . . . . . . . . . . . . . . . . . . . . . . . . . . . . . . . . . . . . . . . . . . . . . . . . . . . . . . . . . . . . . . . (26,382) (2,207,216)Service Class . . . . . . . . . . . . . . . . . . . . . . . . . . . . . . . . . . . . . . . . . . . . . . . . . . . . . . . . . . . . . . . . . . . . . . . . . . . . . . . . . . . . . . . (657,259) (53,513,039)
Net realized gain on sales of investmentsClass A . . . . . . . . . . . . . . . . . . . . . . . . . . . . . . . . . . . . . . . . . . . . . . . . . . . . . . . . . . . . . . . . . . . . . . . . . . . . . . . . . . . . . . . . . . . . . (61,610) (35,390)Service Class . . . . . . . . . . . . . . . . . . . . . . . . . . . . . . . . . . . . . . . . . . . . . . . . . . . . . . . . . . . . . . . . . . . . . . . . . . . . . . . . . . . . . . . (1,569,437) (976,855)
—————————————————————————————————————————————————————————————————————————Total distribution to shareholders . . . . . . . . . . . . . . . . . . . . . . . . . . . . . . . . . . . . . . . . . . . . . . . . . . . . . . . . . . . . . . . . . . . . . . (2,314,688) (56,732,500)
—————————————————————————————————————————————————————————————————————————
Capital shares transactionsProceeds from shares sold – Class A . . . . . . . . . . . . . . . . . . . . . . . . . . . . . . . . . . . . . . . . . . . . . . . . . . . . . . . . . . . . . . . . . . 373,885,007 792,379,687 Reinvestment of distributions – Class A . . . . . . . . . . . . . . . . . . . . . . . . . . . . . . . . . . . . . . . . . . . . . . . . . . . . . . . . . . . . . . . 85,089 2,185,272 Cost of shares redeemed – Class A . . . . . . . . . . . . . . . . . . . . . . . . . . . . . . . . . . . . . . . . . . . . . . . . . . . . . . . . . . . . . . . . . . . . (407,974,452) (786,394,353)
—————————————————————————————————————————————————————————————————————————Net increase (decrease) in net assets resulting from capital shares transactions – Class A . . . . . . . . . . . . . . . . . (34,004,356) 8,170,606
—————————————————————————————————————————————————————————————————————————Proceeds from shares sold – Service Class . . . . . . . . . . . . . . . . . . . . . . . . . . . . . . . . . . . . . . . . . . . . . . . . . . . . . . . . . . . . 18,506,252,685 36,467,177,144Reinvestment of distributions – Service Class . . . . . . . . . . . . . . . . . . . . . . . . . . . . . . . . . . . . . . . . . . . . . . . . . . . . . . . . . 757,091 9,944,383 Cost of shares redeemed – Service Class . . . . . . . . . . . . . . . . . . . . . . . . . . . . . . . . . . . . . . . . . . . . . . . . . . . . . . . . . . . . . . (17,985,525,624) (34,876,231,697)
—————————————————————————————————————————————————————————————————————————Net increase in net assets resulting from capital shares transactions – Service Class . . . . . . . . . . . . . . . . . . . . 521,484,152 1,600,889,830
—————————————————————————————————————————————————————————————————————————Net increase in net assets resulting from capital shares transactions – Total . . . . . . . . . . . . . . . . . . . . . . . . . . . . . . 487,479,796 1,609,060,436
—————————————————————————————————————————————————————————————————————————Net increase in net assets . . . . . . . . . . . . . . . . . . . . . . . . . . . . . . . . . . . . . . . . . . . . . . . . . . . . . . . . . . . . . . . . . . . . . . . . . 486,209,220 1,610,372,059
—————————————————————————————————————————————————————————————————————————Ending net assets . . . . . . . . . . . . . . . . . . . . . . . . . . . . . . . . . . . . . . . . . . . . . . . . . . . . . . . . . . . . . . . . . . . . . . . . . . . . . . . . . $ 8,434,011,094 $ 7,947,801,874
—————————————————————————————————————————————————————————————————————————
Ending balance of undistributed net investment income . . . . . . . . . . . . . . . . . . . . . . . . . . . . . . . . . . . . . . . . . . . . . . . $ 0 $ 203,584 —————————————————————————————————————————————————————————————————————————
100% Treasury Money Market Fund————————————————————————————————————————————————————————————————————————
For the For theYear Ended Year Ended
February 28, 2010 February 28, 2009_____________________________________________________________________________________________________________________________

Statements of Changes in Net Assets Wells Fargo Advantage Money Market Funds 125
Shares issued and redeemedShares sold – Class A . . . . . . . . . . . . . . . . . . . . . . . . . . . . . . . . . . . . . . . . . . . . . . . . . . . . . . . . . . . . . . . . . . . . . . . . . . . . . . . . . 373,885,007 792,379,688 Shares issued in reinvestment of distributions – Class A . . . . . . . . . . . . . . . . . . . . . . . . . . . . . . . . . . . . . . . . . . . . . . . 85,089 2,185,272 Shares redeemed – Class A . . . . . . . . . . . . . . . . . . . . . . . . . . . . . . . . . . . . . . . . . . . . . . . . . . . . . . . . . . . . . . . . . . . . . . . . . . . (407,974,452) (786,394,353)
—————————————————————————————————————————————————————————————————————————Net increase (decrease) in shares outstanding – Class A . . . . . . . . . . . . . . . . . . . . . . . . . . . . . . . . . . . . . . . . . . . . . . . (34,004,356) 8,170,607
—————————————————————————————————————————————————————————————————————————Shares sold – Service Class . . . . . . . . . . . . . . . . . . . . . . . . . . . . . . . . . . . . . . . . . . . . . . . . . . . . . . . . . . . . . . . . . . . . . . . . . . . 18,506,252,685 36,467,163,543 Shares issued in reinvestment of distributions – Service Class . . . . . . . . . . . . . . . . . . . . . . . . . . . . . . . . . . . . . . . . . 757,091 9,944,383 Shares redeemed – Service Class . . . . . . . . . . . . . . . . . . . . . . . . . . . . . . . . . . . . . . . . . . . . . . . . . . . . . . . . . . . . . . . . . . . . . (17,985,525,624) (34,876,231,697)
—————————————————————————————————————————————————————————————————————————Net increase in shares outstanding – Service Class . . . . . . . . . . . . . . . . . . . . . . . . . . . . . . . . . . . . . . . . . . . . . . . . . . . 521,484,152 1,600,876,229
—————————————————————————————————————————————————————————————————————————Net increase in shares outstanding resulting from capital shares transactions . . . . . . . . . . . . . . . . . . . . . . . 487,479,796 1,609,046,836
—————————————————————————————————————————————————————————————————————————
100% Treasury Money Market Fund————————————————————————————————————————————————————————————————————————
For the For theYear Ended Year Ended
February 28, 2010 February 28, 2009___________________________________________________________________________________________________________________________

126 Wells Fargo Advantage Money Market Funds Financial Highlights
1. Total return calculations would have been lower had certain expenses not been waived or reimbursed during the periods shown. Returns for periods of less thanone year are not annualized.
2. Commencement of class operations.3. The Fund changed its fiscal year end from March 31 to February 28.4. The Fund changed its fiscal year end from October 31 to February 28.5. Amount is less than $0.005.
The accompanying notes are an integral part of these financial statements.
California Municipal Money Market Fund––––––––––––––––––––––––––––––––––––––––––––––––––––––––––––––––––––––––––––––––––––––––––––––––––––––––––––––––––––––––––––––––––––Institutional ClassMarch 1, 2009 to February 28, 2010 . . . . . . . . . . . . . . . . . . . . . . . . . . . . . . . . . . . . . . . . . . . . . . . . . . . . . $1.00 0.005 0.00 0.005
March 31, 20082 to February 28, 2009 . . . . . . . . . . . . . . . . . . . . . . . . . . . . . . . . . . . . . . . . . . . . . . . . . . . $1.00 0.01 0.00 (0.01)
Service ClassMarch 1, 2009 to February 28, 2010 . . . . . . . . . . . . . . . . . . . . . . . . . . . . . . . . . . . . . . . . . . . . . . . . . . . . . $1.00 0.005 0.00 0.005
March 1, 2008 to February 28, 2009 . . . . . . . . . . . . . . . . . . . . . . . . . . . . . . . . . . . . . . . . . . . . . . . . . . . . . $1.00 0.01 0.00 (0.01)March 1, 2007 to February 29, 2008 . . . . . . . . . . . . . . . . . . . . . . . . . . . . . . . . . . . . . . . . . . . . . . . . . . . . . $1.00 0.03 0.00 (0.03)March 1, 2006 to February 28, 2007 . . . . . . . . . . . . . . . . . . . . . . . . . . . . . . . . . . . . . . . . . . . . . . . . . . . . . $1.00 0.03 0.00 (0.03)April 1, 2005 to February 28, 20063 . . . . . . . . . . . . . . . . . . . . . . . . . . . . . . . . . . . . . . . . . . . . . . . . . . . . . . $1.00 0.02 0.00 (0.02)April 1, 2004 to March 31, 2005 . . . . . . . . . . . . . . . . . . . . . . . . . . . . . . . . . . . . . . . . . . . . . . . . . . . . . . . . . $1.00 0.01 0.00 (0.01)
Cash Investment Money Market Fund––––––––––––––––––––––––––––––––––––––––––––––––––––––––––––––––––––––––––––––––––––––––––––––––––––––––––––––––––––––––––––––––––––Administrator ClassMarch 1, 2009 to February 28, 2010 . . . . . . . . . . . . . . . . . . . . . . . . . . . . . . . . . . . . . . . . . . . . . . . . . . . . . $1.00 0.005 0.00 0.005
March 1, 2008 to February 28, 2009 . . . . . . . . . . . . . . . . . . . . . . . . . . . . . . . . . . . . . . . . . . . . . . . . . . . . . $1.00 0.02 0.00 (0.02)March 1, 2007 to February 29, 2008 . . . . . . . . . . . . . . . . . . . . . . . . . . . . . . . . . . . . . . . . . . . . . . . . . . . . . $1.00 0.05 0.00 (0.05)March 1, 2006 to February 28, 2007 . . . . . . . . . . . . . . . . . . . . . . . . . . . . . . . . . . . . . . . . . . . . . . . . . . . . . $1.00 0.05 0.00 (0.05)April 1, 2005 to February 28, 20063 . . . . . . . . . . . . . . . . . . . . . . . . . . . . . . . . . . . . . . . . . . . . . . . . . . . . . . $1.00 0.03 0.00 (0.03)April 1, 2004 to March 31, 2005 . . . . . . . . . . . . . . . . . . . . . . . . . . . . . . . . . . . . . . . . . . . . . . . . . . . . . . . . . $1.00 0.01 0.00 (0.01)
Institutional ClassMarch 1, 2009 to February 28, 2010 . . . . . . . . . . . . . . . . . . . . . . . . . . . . . . . . . . . . . . . . . . . . . . . . . . . . . $1.00 0.005 0.00 0.005
March 1, 2008 to February 28, 2009 . . . . . . . . . . . . . . . . . . . . . . . . . . . . . . . . . . . . . . . . . . . . . . . . . . . . . $1.00 0.02 0.00 (0.02)March 1, 2007 to February 29, 2008 . . . . . . . . . . . . . . . . . . . . . . . . . . . . . . . . . . . . . . . . . . . . . . . . . . . . . $1.00 0.05 0.00 (0.05)March 1, 2006 to February 28, 2007 . . . . . . . . . . . . . . . . . . . . . . . . . . . . . . . . . . . . . . . . . . . . . . . . . . . . . $1.00 0.05 0.00 (0.05)April 1, 2005 to February 28, 20063 . . . . . . . . . . . . . . . . . . . . . . . . . . . . . . . . . . . . . . . . . . . . . . . . . . . . . . $1.00 0.03 0.00 (0.03)April 1, 2004 to March 31, 2005 . . . . . . . . . . . . . . . . . . . . . . . . . . . . . . . . . . . . . . . . . . . . . . . . . . . . . . . . . $1.00 0.02 0.00 (0.02)
Select ClassMarch 1, 2009 to February 28, 2010 . . . . . . . . . . . . . . . . . . . . . . . . . . . . . . . . . . . . . . . . . . . . . . . . . . . . . $1.00 0.005 0.00 0.005
March 1, 2008 to February 28, 2009 . . . . . . . . . . . . . . . . . . . . . . . . . . . . . . . . . . . . . . . . . . . . . . . . . . . . . $1.00 0.02 0.00 (0.02)June 29, 20072 to February 29, 2008 . . . . . . . . . . . . . . . . . . . . . . . . . . . . . . . . . . . . . . . . . . . . . . . . . . . . . $1.00 0.03 0.00 (0.03)
Service ClassMarch 1, 2009 to February 28, 2010 . . . . . . . . . . . . . . . . . . . . . . . . . . . . . . . . . . . . . . . . . . . . . . . . . . . . . $1.00 0.005 0.00 0.005
March 1, 2008 to February 28, 2009 . . . . . . . . . . . . . . . . . . . . . . . . . . . . . . . . . . . . . . . . . . . . . . . . . . . . . $1.00 0.02 0.00 (0.02)March 1, 2007 to February 29, 2008 . . . . . . . . . . . . . . . . . . . . . . . . . . . . . . . . . . . . . . . . . . . . . . . . . . . . . $1.00 0.05 0.00 (0.05)March 1, 2006 to February 28, 2007 . . . . . . . . . . . . . . . . . . . . . . . . . . . . . . . . . . . . . . . . . . . . . . . . . . . . . $1.00 0.05 0.00 (0.05)April 1, 2005 to February 28, 20063 . . . . . . . . . . . . . . . . . . . . . . . . . . . . . . . . . . . . . . . . . . . . . . . . . . . . . . $1.00 0.03 0.00 (0.03)April 1, 2004 to March 31, 2005 . . . . . . . . . . . . . . . . . . . . . . . . . . . . . . . . . . . . . . . . . . . . . . . . . . . . . . . . . $1.00 0.01 0.00 (0.01)
Beginning Net Realized DistributionsNet Asset Net and Unrealized from NetValue Per Investment Gain (Loss) Investment
Share Income on Investments Income––––––––––––––––––––––––––––––––––––––––––––––––––––––––––––––––––––––––––––––––––––––––––––––––––––––––––––––––––––––––––––––––––––

Financial Highlights Wells Fargo Advantage Money Market Funds 127
––––––––––––––––––––––––––––––––––––––––––––––––––––––––––––––––––––––––––––––––––––––––––––––––––––––––––––––––
0.005 $1.00 0.23% 0.48% 0.24% 0.20% $ 236,3530.005 $1.00 1.59% 0.46% 0.22% 1.47% $ 370,572
0.005 $1.00 0.07% 0.77% 0.38% 0.06% $ 397,508 0.005 $1.00 1.43% 0.75% 0.47% 1.42% $ 709,029 0.00 $1.00 2.94% 0.73% 0.45% 3.05% $ 970,9450.00 $1.00 3.01% 0.73% 0.45% 3.06% $ 500,2040.00 $1.00 2.18% 0.74% 0.45% 2.04% $ 416,0480.00 $1.00 1.00% 0.66% 0.45% 0.99% $ 356,093
––––––––––––––––––––––––––––––––––––––––––––––––––––––––––––––––––––––––––––––––––––––––––––––––––––––––––––––––
0.005 $1.00 0.25% 0.38% 0.34% 0.24% $ 1,013,058 0.00 $1.00 2.23% 0.38% 0.34% 2.19% $ 1,415,264 0.00 $1.00 4.77% 0.37% 0.33% 4.92% $ 2,249,4700.00 $1.00 4.87% 0.37% 0.35% 4.96% $ 1,364,2230.00 $1.00 3.37% 0.37% 0.35% 3.06% $ 1,150,6170.00 $1.00 1.57% 0.37% 0.35% 1.45% $ 619,286
0.005 $1.00 0.37% 0.26% 0.22% 0.36% $ 8,887,844 0.00 $1.00 2.28% 0.26% 0.21% 2.32% $10,132,0930.00 $1.00 4.94% 0.25% 0.20% 5.06% $ 9,194,5400.00 $1.00 5.01% 0.25% 0.20% 5.12% $ 7,830,8470.00 $1.00 3.50% 0.25% 0.20% 3.21% $ 6,497,2670.00 $1.00 1.61% 0.26% 0.20% 1.60% $ 5,998,383
0.005 $1.00 0.41% 0.22% 0.15% 0.43% $ 4,897,725 0.00 $1.00 2.29% 0.23% 0.15% 2.40% $ 3,733,3810.00 $1.00 4.81% 0.20% 0.13% 3.31% $ 3,025,485
0.005 $1.00 0.16% 0.56% 0.46% 0.14% $ 4,015,237 0.00 $1.00 1.99% 0.56% 0.52% 2.02% $ 6,358,5140.00 $1.00 4.64% 0.54% 0.50% 4.75% $ 7,374,7490.00 $1.00 4.71% 0.54% 0.50% 4.80% $ 6,328,8670.00 $1.00 3.12% 0.54% 0.50% 2.92% $ 5,793,7620.00 $1.00 1.26% 0.55% 0.50% 1.30% $ 6,879,632
EndingRatio to Average Net Assets (Annualized)Distributions Net Asset Net Assets at
from Net Value Per Net Investment Gross Net Total End of PeriodRealized Gains Share Income Expenses Expenses Return1 (000’s omitted)
––––––––––––––––––––––––––––––––––––––––––––––––––––––––––––––––––––––––––––––––––––––––––––––––––––––––––––––––

128 Wells Fargo Advantage Money Market Funds Financial Highlights
The accompanying notes are an integral part of these financial statements.
128 Wells Fargo Advantage Money Market Funds Financial Highlights
Government Money Market Fund––––––––––––––––––––––––––––––––––––––––––––––––––––––––––––––––––––––––––––––––––––––––––––––––––––––––––––––––––––––––––––––––––––Administrator ClassMarch 1, 2009 to February 28, 2010 . . . . . . . . . . . . . . . . . . . . . . . . . . . . . . . . . . . . . . . . . . . . . . . . . . . . . $1.00 0.005 0.00 0.005
March 1, 2008 to February 28, 2009 . . . . . . . . . . . . . . . . . . . . . . . . . . . . . . . . . . . . . . . . . . . . . . . . . . . . . $1.00 0.01 0.00 (0.01)March 1, 2007 to February 29, 2008 . . . . . . . . . . . . . . . . . . . . . . . . . . . . . . . . . . . . . . . . . . . . . . . . . . . . . $1.00 0.04 0.00 (0.04)March 1, 2006 to February 28, 2007 . . . . . . . . . . . . . . . . . . . . . . . . . . . . . . . . . . . . . . . . . . . . . . . . . . . . . $1.00 0.05 0.00 (0.05)April 1, 2005 to February 28, 20063 . . . . . . . . . . . . . . . . . . . . . . . . . . . . . . . . . . . . . . . . . . . . . . . . . . . . . . $1.00 0.03 0.00 (0.03)April 1, 2004 to March 31, 2005 . . . . . . . . . . . . . . . . . . . . . . . . . . . . . . . . . . . . . . . . . . . . . . . . . . . . . . . . . $1.00 0.01 0.00 (0.01)
Institutional ClassMarch 1, 2009 to February 28, 2010 . . . . . . . . . . . . . . . . . . . . . . . . . . . . . . . . . . . . . . . . . . . . . . . . . . . . . $1.00 0.005 0.00 0.005
March 1, 2008 to February 28, 2009 . . . . . . . . . . . . . . . . . . . . . . . . . . . . . . . . . . . . . . . . . . . . . . . . . . . . . $1.00 0.01 0.00 (0.01)March 1, 2007 to February 29, 2008 . . . . . . . . . . . . . . . . . . . . . . . . . . . . . . . . . . . . . . . . . . . . . . . . . . . . . $1.00 0.04 0.00 (0.04)March 1, 2006 to February 28, 2007 . . . . . . . . . . . . . . . . . . . . . . . . . . . . . . . . . . . . . . . . . . . . . . . . . . . . . $1.00 0.05 0.00 (0.05)April 1, 2005 to February 28, 20063 . . . . . . . . . . . . . . . . . . . . . . . . . . . . . . . . . . . . . . . . . . . . . . . . . . . . . . $1.00 0.03 0.00 (0.03)April 1, 2004 to March 31, 2005 . . . . . . . . . . . . . . . . . . . . . . . . . . . . . . . . . . . . . . . . . . . . . . . . . . . . . . . . . $1.00 0.02 0.00 (0.02)
Service ClassMarch 1, 2009 to February 28, 2010 . . . . . . . . . . . . . . . . . . . . . . . . . . . . . . . . . . . . . . . . . . . . . . . . . . . . . $1.00 0.005 0.00 0.005
March 1, 2008 to February 28, 2009 . . . . . . . . . . . . . . . . . . . . . . . . . . . . . . . . . . . . . . . . . . . . . . . . . . . . . $1.00 0.01 0.00 (0.01)March 1, 2007 to February 29, 2008 . . . . . . . . . . . . . . . . . . . . . . . . . . . . . . . . . . . . . . . . . . . . . . . . . . . . . $1.00 0.04 0.00 (0.04)March 1, 2006 to February 28, 2007 . . . . . . . . . . . . . . . . . . . . . . . . . . . . . . . . . . . . . . . . . . . . . . . . . . . . . $1.00 0.05 0.00 (0.05)April 1, 2005 to February 28, 20063 . . . . . . . . . . . . . . . . . . . . . . . . . . . . . . . . . . . . . . . . . . . . . . . . . . . . . . $1.00 0.03 0.00 (0.03)April 1, 2004 to March 31, 2005 . . . . . . . . . . . . . . . . . . . . . . . . . . . . . . . . . . . . . . . . . . . . . . . . . . . . . . . . . $1.00 0.01 0.00 (0.01)
Heritage Money Market Fund––––––––––––––––––––––––––––––––––––––––––––––––––––––––––––––––––––––––––––––––––––––––––––––––––––––––––––––––––––––––––––––––––––Administrator ClassMarch 1, 2009 to February 28, 2010 . . . . . . . . . . . . . . . . . . . . . . . . . . . . . . . . . . . . . . . . . . . . . . . . . . . . . $1.00 0.005 0.00 0.005
March 1, 2008 to February 28, 2009 . . . . . . . . . . . . . . . . . . . . . . . . . . . . . . . . . . . . . . . . . . . . . . . . . . . . . $1.00 0.02 0.00 (0.02)March 1, 2007 to February 29, 2008 . . . . . . . . . . . . . . . . . . . . . . . . . . . . . . . . . . . . . . . . . . . . . . . . . . . . . $1.00 0.05 0.00 (0.05)March 1, 2006 to February 28, 2007 . . . . . . . . . . . . . . . . . . . . . . . . . . . . . . . . . . . . . . . . . . . . . . . . . . . . . $1.00 0.05 0.00 (0.05)November 1, 2005 to February 28, 20064 . . . . . . . . . . . . . . . . . . . . . . . . . . . . . . . . . . . . . . . . . . . . . . . . $1.00 0.01 0.00 (0.01)November 1, 2004 to October 31, 2005 . . . . . . . . . . . . . . . . . . . . . . . . . . . . . . . . . . . . . . . . . . . . . . . . . . $1.00 0.03 0.00 (0.03)
Institutional ClassMarch 1, 2009 to February 28, 2010 . . . . . . . . . . . . . . . . . . . . . . . . . . . . . . . . . . . . . . . . . . . . . . . . . . . . . $1.00 0.005 0.00 0.005
March 1, 2008 to February 28, 2009 . . . . . . . . . . . . . . . . . . . . . . . . . . . . . . . . . . . . . . . . . . . . . . . . . . . . . $1.00 0.02 0.00 (0.02)March 1, 2007 to February 29, 2008 . . . . . . . . . . . . . . . . . . . . . . . . . . . . . . . . . . . . . . . . . . . . . . . . . . . . . $1.00 0.05 0.00 (0.05)March 1, 2006 to February 28, 2007 . . . . . . . . . . . . . . . . . . . . . . . . . . . . . . . . . . . . . . . . . . . . . . . . . . . . . $1.00 0.05 0.00 (0.05)November 1, 2005 to February 28, 20064 . . . . . . . . . . . . . . . . . . . . . . . . . . . . . . . . . . . . . . . . . . . . . . . . $1.00 0.01 0.00 (0.01)November 1, 2004 to October 31, 2005 . . . . . . . . . . . . . . . . . . . . . . . . . . . . . . . . . . . . . . . . . . . . . . . . . . $1.00 0.03 0.00 (0.03)
Select ClassMarch 1, 2009 to February 28, 2010 . . . . . . . . . . . . . . . . . . . . . . . . . . . . . . . . . . . . . . . . . . . . . . . . . . . . . $1.00 0.005 0.00 0.005
March 1, 2008 to February 28, 2009 . . . . . . . . . . . . . . . . . . . . . . . . . . . . . . . . . . . . . . . . . . . . . . . . . . . . . $1.00 0.02 0.00 (0.02)June 29, 20072 to February 29, 2008 . . . . . . . . . . . . . . . . . . . . . . . . . . . . . . . . . . . . . . . . . . . . . . . . . . . . . $1.00 (0.03) 0.06 (0.03)
Beginning Net Realized DistributionsNet Asset Net and Unrealized from NetValue Per Investment Gain (Loss) Investment
Share Income on Investments Income––––––––––––––––––––––––––––––––––––––––––––––––––––––––––––––––––––––––––––––––––––––––––––––––––––––––––––––––––––––––––––––––––––

Financial Highlights Wells Fargo Advantage Money Market Funds 129
––––––––––––––––––––––––––––––––––––––––––––––––––––––––––––––––––––––––––––––––––––––––––––––––––––––––––––––––
0.005 $1.00 0.03% 0.39% 0.28% 0.02% $ 788,478 0.00 $1.00 1.42% 0.37% 0.36% 1.50% $ 1,780,294 0.00 $1.00 4.55% 0.37% 0.35% 4.68% $ 1,944,4350.00 $1.00 4.82% 0.37% 0.35% 4.92% $ 1,179,7680.00 $1.00 3.33% 0.38% 0.35% 3.05% $ 876,2340.00 $1.00 1.59% 0.38% 0.35% 1.41% $ 596,740
0.005 $1.00 0.10% 0.27% 0.21% 0.08% $20,661,470 0.00 $1.00 1.42% 0.26% 0.22% 1.65% $42,393,9210.00 $1.00 4.54% 0.25% 0.20% 4.83% $23,265,3230.00 $1.00 5.00% 0.25% 0.20% 5.07% $ 7,766,6840.00 $1.00 3.45% 0.26% 0.20% 3.19% $ 4,508,7550.00 $1.00 1.66% 0.26% 0.20% 1.57% $ 3,964,854
0.005 $1.00 0.01% 0.56% 0.28% 0.01% $ 4,595,307 0.00 $1.00 1.31% 0.54% 0.51% 1.35% $ 6,342,777 0.00 $1.00 4.42% 0.54% 0.50% 4.52% $ 6,350,0250.00 $1.00 4.66% 0.54% 0.50% 4.76% $ 5,656,8670.00 $1.00 3.13% 0.55% 0.50% 2.91% $ 5,350,4800.00 $1.00 1.26% 0.55% 0.50% 1.26% $ 5,230,613
––––––––––––––––––––––––––––––––––––––––––––––––––––––––––––––––––––––––––––––––––––––––––––––––––––––––––––––––
0.005 $1.00 0.17% 0.37% 0.33% 0.21% $ 1,201,158 0.005 $1.00 2.09% 0.38% 0.34% 2.19% $ 918,5950.00 $1.00 4.68% 0.38% 0.34% 4.90% $ 608,8650.00 $1.00 4.80% 0.40% 0.38% 4.91% $ 287,2930.00 $1.00 3.91% 0.40% 0.38% 1.29% $ 288,9710.00 $1.00 2.41% 0.56% 0.39% 2.54% $ 301,694
0.005 $1.00 0.31% 0.25% 0.21% 0.33% $ 7,795,659 0.005 $1.00 2.09% 0.27% 0.22% 2.32% $ 5,862,0750.00 $1.00 4.77% 0.26% 0.20% 5.06% $ 1,579,2250.00 $1.00 4.98% 0.28% 0.18% 5.12% $ 353,7550.00 $1.00 4.13% 0.28% 0.18% 1.36% $ 419,0840.00 $1.00 2.97% 0.28% 0.18% 2.75% $ 338,723
0.005 $1.00 0.30% 0.20% 0.14% 0.40% $22,489,644 0.00 $1.00 2.14% 0.23% 0.15% 2.40% $ 6,066,7680.00 $1.00 4.58% 0.22% 0.13% 3.30% $ 1,368,330
EndingRatio to Average Net Assets (Annualized)Distributions Net Asset Net Assets at
from Net Value Per Net Investment Gross Net Total End of PeriodRealized Gains Share Income Expenses Expenses Return1 (000’s omitted)
––––––––––––––––––––––––––––––––––––––––––––––––––––––––––––––––––––––––––––––––––––––––––––––––––––––––––––––––

130 Wells Fargo Advantage Money Market Funds Financial Highlights
Municipal Money Market Fund––––––––––––––––––––––––––––––––––––––––––––––––––––––––––––––––––––––––––––––––––––––––––––––––––––––––––––––––––––––––––––––––––––Institutional ClassMarch 1, 2009 to February 28, 2010 . . . . . . . . . . . . . . . . . . . . . . . . . . . . . . . . . . . . . . . . . . . . . . . . . . . . . $1.00 0.005 0.00 0.005
March 31, 20082 to February 28, 2009 . . . . . . . . . . . . . . . . . . . . . . . . . . . . . . . . . . . . . . . . . . . . . . . . . . . $1.00 0.02 0.00 (0.02)
National Tax-Free Money Market Fund––––––––––––––––––––––––––––––––––––––––––––––––––––––––––––––––––––––––––––––––––––––––––––––––––––––––––––––––––––––––––––––––––––Administrator ClassMarch 1, 2009 to February 28, 2010 . . . . . . . . . . . . . . . . . . . . . . . . . . . . . . . . . . . . . . . . . . . . . . . . . . . . . $1.00 0.005 0.00 0.005
March 1, 2008 to February 28, 2009 . . . . . . . . . . . . . . . . . . . . . . . . . . . . . . . . . . . . . . . . . . . . . . . . . . . . . $1.00 0.02 0.00 (0.02)March 1, 2007 to February 29, 2008 . . . . . . . . . . . . . . . . . . . . . . . . . . . . . . . . . . . . . . . . . . . . . . . . . . . . . $1.00 0.03 0.00 (0.03)March 1, 2006 to February 28, 2007 . . . . . . . . . . . . . . . . . . . . . . . . . . . . . . . . . . . . . . . . . . . . . . . . . . . . . $1.00 0.03 0.00 (0.03)April 11, 20052 to February 28, 2006 . . . . . . . . . . . . . . . . . . . . . . . . . . . . . . . . . . . . . . . . . . . . . . . . . . . . . $1.00 0.02 0.00 (0.02)
Institutional ClassMarch 1, 2009 to February 28, 2010 . . . . . . . . . . . . . . . . . . . . . . . . . . . . . . . . . . . . . . . . . . . . . . . . . . . . . $1.00 0.005 0.00 0.005
March 1, 2008 to February 28, 2009 . . . . . . . . . . . . . . . . . . . . . . . . . . . . . . . . . . . . . . . . . . . . . . . . . . . . . $1.00 0.02 0.00 (0.02)March 1, 2007 to February 29, 2008 . . . . . . . . . . . . . . . . . . . . . . . . . . . . . . . . . . . . . . . . . . . . . . . . . . . . . $1.00 0.03 0.00 (0.03)March 1, 2006 to February 28, 2007 . . . . . . . . . . . . . . . . . . . . . . . . . . . . . . . . . . . . . . . . . . . . . . . . . . . . . $1.00 0.03 0.00 (0.03)April 1, 2005 to February 28, 20063 . . . . . . . . . . . . . . . . . . . . . . . . . . . . . . . . . . . . . . . . . . . . . . . . . . . . . . $1.00 0.02 0.00 (0.02)April 1, 2004 to March 31, 2005 . . . . . . . . . . . . . . . . . . . . . . . . . . . . . . . . . . . . . . . . . . . . . . . . . . . . . . . . . $1.00 0.01 0.00 (0.01)
Service ClassMarch 1, 2009 to February 28, 2010 . . . . . . . . . . . . . . . . . . . . . . . . . . . . . . . . . . . . . . . . . . . . . . . . . . . . . $1.00 0.005 0.00 0.005
March 1, 2008 to February 28, 2009 . . . . . . . . . . . . . . . . . . . . . . . . . . . . . . . . . . . . . . . . . . . . . . . . . . . . . $1.00 0.01 0.00 (0.01)March 1, 2007 to February 29, 2008 . . . . . . . . . . . . . . . . . . . . . . . . . . . . . . . . . . . . . . . . . . . . . . . . . . . . . $1.00 0.03 0.00 (0.03)March 1, 2006 to February 28, 2007 . . . . . . . . . . . . . . . . . . . . . . . . . . . . . . . . . . . . . . . . . . . . . . . . . . . . . $1.00 0.03 0.00 (0.03)April 1, 2005 to February 28, 20063 . . . . . . . . . . . . . . . . . . . . . . . . . . . . . . . . . . . . . . . . . . . . . . . . . . . . . . $1.00 0.02 0.00 (0.02)April 1, 2004 to March 31, 2005 . . . . . . . . . . . . . . . . . . . . . . . . . . . . . . . . . . . . . . . . . . . . . . . . . . . . . . . . . $1.00 0.01 0.00 (0.01)
Prime Investment Money Market Fund––––––––––––––––––––––––––––––––––––––––––––––––––––––––––––––––––––––––––––––––––––––––––––––––––––––––––––––––––––––––––––––––––––Institutional ClassMarch 1, 2009 to February 28, 2010 . . . . . . . . . . . . . . . . . . . . . . . . . . . . . . . . . . . . . . . . . . . . . . . . . . . . . $1.00 0.005 0.00 0.005
March 1, 2008 to February 28, 2009 . . . . . . . . . . . . . . . . . . . . . . . . . . . . . . . . . . . . . . . . . . . . . . . . . . . . . $1.00 0.02 0.00 (0.02)March 1, 2007 to February 29, 2008 . . . . . . . . . . . . . . . . . . . . . . . . . . . . . . . . . . . . . . . . . . . . . . . . . . . . . $1.00 0.05 0.00 (0.05)March 1, 2006 to February 28, 2007 . . . . . . . . . . . . . . . . . . . . . . . . . . . . . . . . . . . . . . . . . . . . . . . . . . . . . $1.00 0.05 0.00 (0.05)April 1, 2005 to February 28, 20063 . . . . . . . . . . . . . . . . . . . . . . . . . . . . . . . . . . . . . . . . . . . . . . . . . . . . . . $1.00 0.03 0.00 (0.03)April 1, 2004 to March 31, 2005 . . . . . . . . . . . . . . . . . . . . . . . . . . . . . . . . . . . . . . . . . . . . . . . . . . . . . . . . . $1.00 0.02 0.00 (0.02)
Service ClassMarch 1, 2009 to February 28, 2010 . . . . . . . . . . . . . . . . . . . . . . . . . . . . . . . . . . . . . . . . . . . . . . . . . . . . . $1.00 0.005 0.00 0.005
March 1, 2008 to February 28, 2009 . . . . . . . . . . . . . . . . . . . . . . . . . . . . . . . . . . . . . . . . . . . . . . . . . . . . . $1.00 0.02 0.00 (0.02)March 1, 2007 to February 29, 2008 . . . . . . . . . . . . . . . . . . . . . . . . . . . . . . . . . . . . . . . . . . . . . . . . . . . . . $1.00 0.05 0.00 (0.05)March 1, 2006 to February 28, 2007 . . . . . . . . . . . . . . . . . . . . . . . . . . . . . . . . . . . . . . . . . . . . . . . . . . . . . $1.00 0.05 0.00 (0.05)April 1, 2005 to February 28, 20063 . . . . . . . . . . . . . . . . . . . . . . . . . . . . . . . . . . . . . . . . . . . . . . . . . . . . . . $1.00 0.03 0.00 (0.03)April 1, 2004 to March 31, 2005 . . . . . . . . . . . . . . . . . . . . . . . . . . . . . . . . . . . . . . . . . . . . . . . . . . . . . . . . . $1.00 0.01 0.00 (0.01)
Beginning Net Realized DistributionsNet Asset Net and Unrealized from NetValue Per Investment Gain (Loss) Investment
Share Income on Investments Income––––––––––––––––––––––––––––––––––––––––––––––––––––––––––––––––––––––––––––––––––––––––––––––––––––––––––––––––––––––––––––––––––––
The accompanying notes are an integral part of these financial statements.

Financial Highlights Wells Fargo Advantage Money Market Funds 131
––––––––––––––––––––––––––––––––––––––––––––––––––––––––––––––––––––––––––––––––––––––––––––––––––––––––––––––––
0.00 $1.00 0.32% 0.49% 0.21% 0.41% $ 128,956 0.00 $1.00 2.18% 0.51% 0.24% 1.77% $ 49,671
––––––––––––––––––––––––––––––––––––––––––––––––––––––––––––––––––––––––––––––––––––––––––––––––––––––––––––––––
0.005 $1.00 0.18% 0.40% 0.31% 0.18% $ 419,954 0.005 $1.00 1.63% 0.40% 0.32% 1.68% $ 517,520 0.00 $1.00 3.24% 0.38% 0.30% 3.27% $ 517,6660.00 $1.00 3.23% 0.38% 0.30% 3.28% $ 541,8400.00 $1.00 2.39% 0.39% 0.30% 2.21% $ 561,788
0.005 $1.00 0.28% 0.29% 0.23% 0.27% $ 2,048,774 0.005 $1.00 1.77% 0.28% 0.22% 1.78% $ 2,381,083 0.00 $1.00 3.31% 0.26% 0.20% 3.37% $ 1,403,8380.00 $1.00 3.35% 0.26% 0.20% 3.39% $ 1,146,9020.00 $1.00 2.46% 0.27% 0.20% 2.31% $ 700,5340.00 $1.00 1.37% 0.26% 0.20% 1.27% $ 1,032,250
0.005 $1.00 0.12% 0.58% 0.40% 0.10% $ 1,055,420 0.005 $1.00 1.47% 0.57% 0.47% 1.52% $ 1,875,018 0.00 $1.00 3.07% 0.55% 0.45% 3.12% $ 1,674,0470.00 $1.00 3.09% 0.55% 0.45% 3.13% $ 1,303,7280.00 $1.00 2.23% 0.56% 0.45% 2.08% $ 1,160,5940.00 $1.00 1.01% 0.55% 0.45% 1.02% $ 1,195,511
––––––––––––––––––––––––––––––––––––––––––––––––––––––––––––––––––––––––––––––––––––––––––––––––––––––––––––––––
0.005 $1.00 0.29% 0.27% 0.22% 0.30% $10,124,807 0.005 $1.00 2.13% 0.28% 0.23% 2.22% $ 9,422,441 0.00 $1.00 4.87% 0.25% 0.20% 4.99% $ 7,525,2540.00 $1.00 5.06% 0.26% 0.20% 5.10% $ 7,088,3290.00 $1.00 3.46% 0.26% 0.20% 3.23% $ 2,889,5320.00 $1.00 1.87% 0.26% 0.20% 1.58% $ 3,271,052
0.005 $1.00 0.06% 0.56% 0.45% 0.07% $ 900,490 0.005 $1.00 1.83% 0.57% 0.57% 1.87% $ 1,226,787 0.00 $1.00 4.55% 0.55% 0.55% 4.63% $ 1,402,5570.00 $1.00 4.64% 0.55% 0.55% 4.74% $ 1,190,2930.00 $1.00 3.18% 0.55% 0.55% 2.90% $ 1,332,1290.00 $1.00 1.20% 0.55% 0.55% 1.22% $ 816,105
EndingRatio to Average Net Assets (Annualized)Distributions Net Asset Net Assets at
from Net Value Per Net Investment Gross Net Total End of PeriodRealized Gains Share Income Expenses Expenses Return1 (000’s omitted)
––––––––––––––––––––––––––––––––––––––––––––––––––––––––––––––––––––––––––––––––––––––––––––––––––––––––––––––––

132 Wells Fargo Advantage Money Market Funds Financial Highlights
Beginning Net Realized DistributionsNet Asset Net and Unrealized from NetValue Per Investment Gain (Loss) Investment
Share Income on Investments Income––––––––––––––––––––––––––––––––––––––––––––––––––––––––––––––––––––––––––––––––––––––––––––––––––––––––––––––––––––––––––––––––––––
Treasury Plus Money Market Fund––––––––––––––––––––––––––––––––––––––––––––––––––––––––––––––––––––––––––––––––––––––––––––––––––––––––––––––––––––––––––––––––––––Administrator ClassMarch 1, 2009 to February 28, 2010 . . . . . . . . . . . . . . . . . . . . . . . . . . . . . . . . . . . . . . . . . . . . . . . . . . . . . $1.00 0.005 0.00 0.005
March 31, 20083 to February 28, 2009 . . . . . . . . . . . . . . . . . . . . . . . . . . . . . . . . . . . . . . . . . . . . . . . . . . . $1.00 0.01 0.00 (0.01)
Institutional ClassMarch 1, 2009 to February 28, 2010 . . . . . . . . . . . . . . . . . . . . . . . . . . . . . . . . . . . . . . . . . . . . . . . . . . . . . $1.00 0.005 0.00 0.005
March 1, 2008 to February 28, 2009 . . . . . . . . . . . . . . . . . . . . . . . . . . . . . . . . . . . . . . . . . . . . . . . . . . . . . $1.00 0.01 0.00 (0.01)March 1, 2007 to February 29, 2008 . . . . . . . . . . . . . . . . . . . . . . . . . . . . . . . . . . . . . . . . . . . . . . . . . . . . . $1.00 0.04 0.00 (0.04)March 1, 2006 to February 28, 2007 . . . . . . . . . . . . . . . . . . . . . . . . . . . . . . . . . . . . . . . . . . . . . . . . . . . . . $1.00 0.05 0.00 (0.05)April 1, 2005 to February 28, 20063 . . . . . . . . . . . . . . . . . . . . . . . . . . . . . . . . . . . . . . . . . . . . . . . . . . . . . . $1.00 0.03 0.00 (0.03)April 1, 2004 to March 31, 2005 . . . . . . . . . . . . . . . . . . . . . . . . . . . . . . . . . . . . . . . . . . . . . . . . . . . . . . . . . $1.00 0.01 0.00 (0.01)
Service ClassMarch 1, 2009 to February 28, 2010 . . . . . . . . . . . . . . . . . . . . . . . . . . . . . . . . . . . . . . . . . . . . . . . . . . . . . $1.00 0.005 0.00 0.005
March 1, 2008 to February 28, 2009 . . . . . . . . . . . . . . . . . . . . . . . . . . . . . . . . . . . . . . . . . . . . . . . . . . . . . $1.00 0.01 0.00 (0.01)March 1, 2007 to February 29, 2008 . . . . . . . . . . . . . . . . . . . . . . . . . . . . . . . . . . . . . . . . . . . . . . . . . . . . . $1.00 0.04 0.00 (0.04)March 1, 2006 to February 28, 2007 . . . . . . . . . . . . . . . . . . . . . . . . . . . . . . . . . . . . . . . . . . . . . . . . . . . . . $1.00 0.05 0.00 (0.05)April 1, 2005 to February 28, 20063 . . . . . . . . . . . . . . . . . . . . . . . . . . . . . . . . . . . . . . . . . . . . . . . . . . . . . . $1.00 0.03 0.00 (0.03)April 1, 2004 to March 31, 2005 . . . . . . . . . . . . . . . . . . . . . . . . . . . . . . . . . . . . . . . . . . . . . . . . . . . . . . . . . $1.00 0.01 0.00 (0.01)
100% Treasury Money Market Fund––––––––––––––––––––––––––––––––––––––––––––––––––––––––––––––––––––––––––––––––––––––––––––––––––––––––––––––––––––––––––––––––––––Service ClassMarch 1, 2009 to February 28, 2010 . . . . . . . . . . . . . . . . . . . . . . . . . . . . . . . . . . . . . . . . . . . . . . . . . . . . . $1.00 0.005 0.00 0.005
March 1, 2008 to February 28, 2009 . . . . . . . . . . . . . . . . . . . . . . . . . . . . . . . . . . . . . . . . . . . . . . . . . . . . . $1.00 0.01 0.00 (0.01)March 1, 2007 to February 29, 2008 . . . . . . . . . . . . . . . . . . . . . . . . . . . . . . . . . . . . . . . . . . . . . . . . . . . . . $1.00 0.04 0.00 (0.04)March 1, 2006 to February 28, 2007 . . . . . . . . . . . . . . . . . . . . . . . . . . . . . . . . . . . . . . . . . . . . . . . . . . . . . $1.00 0.04 0.00 (0.04)April 1, 2005 to February 28, 20063 . . . . . . . . . . . . . . . . . . . . . . . . . . . . . . . . . . . . . . . . . . . . . . . . . . . . . . $1.00 0.03 0.00 (0.03)April 1, 2004 to March 31, 2005 . . . . . . . . . . . . . . . . . . . . . . . . . . . . . . . . . . . . . . . . . . . . . . . . . . . . . . . . . $1.00 0.01 0.00 (0.01)
The accompanying notes are an integral part of these financial statements.

Financial Highlights Wells Fargo Advantage Money Market Funds 133
EndingRatio to Average Net Assets (Annualized)Distributions Net Asset Net Assets at
from Net Value Per Net Investment Gross Net Total End of PeriodRealized Gains Share Income Expenses Expenses Return1 (000’s omitted)
––––––––––––––––––––––––––––––––––––––––––––––––––––––––––––––––––––––––––––––––––––––––––––––––––––––––––––––––
––––––––––––––––––––––––––––––––––––––––––––––––––––––––––––––––––––––––––––––––––––––––––––––––––––––––––––––––
0.00 $1.00 0.01% 0.38% 0.16% 0.01% $ 180,021 0.00 $1.00 0.73% 0.39% 0.30% 0.84% $ 132,423
0.00 $1.00 0.02% 0.26% 0.15% 0.02% $ 4,091,490 0.00 $1.00 0.81% 0.28% 0.20% 1.08% $ 5,092,437 0.00 $1.00 4.19% 0.26% 0.20% 4.45% $ 2,951,4080.00 $1.00 4.93% 0.26% 0.20% 5.01% $ 1,822,0460.00 $1.00 3.29% 0.26% 0.20% 3.07% $ 1,166,1020.00 $1.00 1.39% 0.27% 0.20% 1.48% $ 1,268,636
0.00 $1.00 0.01% 0.55% 0.17% 0.01% $ 702,363 0.00 $1.00 0.93% 0.56% 0.41% 0.88% $ 862,686 0.00 $1.00 4.11% 0.55% 0.50% 4.14% $ 1,187,4680.00 $1.00 4.61% 0.55% 0.50% 4.70% $ 1,283,8130.00 $1.00 2.99% 0.55% 0.50% 2.78% $ 940,1040.00 $1.00 1.12% 0.56% 0.50% 1.17% $ 1,205,795
––––––––––––––––––––––––––––––––––––––––––––––––––––––––––––––––––––––––––––––––––––––––––––––––––––––––––––––––
0.00 $1.00 0.01% 0.73% 0.17% 0.03% $ 8,161,612 0.00 $1.00 0.74% 0.73% 0.46% 0.86% $ 7,641,351 0.00 $1.00 3.85% 0.73% 0.50% 3.97% $ 6,039,2090.00 $1.00 4.36% 0.74% 0.50% 4.44% $ 4,049,9640.00 $1.00 2.89% 0.73% 0.50% 2.64% $ 3,581,7970.00 $1.00 1.12% 0.68% 0.50% 1.11% $ 3,031,989

134 Wells Fargo Advantage Money Market Funds Notes to Financial Statements
1. ORGANIZATION
Wells Fargo Funds Trust (the “Trust”) is an open-end investment management company registered under the InvestmentCompany Act of 1940, as amended (the “1940 Act”). These financial statements report on the following funds: Wells FargoAdvantage California Municipal Money Market Fund (“California Municipal Money Market Fund”), (formerly, Wells FargoAdvantage California Tax-Free Money Market Fund) Wells Fargo Advantage Cash Investment Money Market Fund (“CashInvestment Money Market Fund”), Wells Fargo Advantage Government Money Market Fund (“Government Money MarketFund”), Wells Fargo Advantage Heritage Market Fund (“Heritage Market Fund” ), Wells Fargo Advantage Municipal MoneyMarket Fund (“Municipal Money Market Fund”), Wells Fargo Advantage National Tax-Free Money Market Fund (“NationalTax-Free Money Market Fund”), Wells Fargo Advantage Prime Investment Money Market Fund (“Prime Investment MoneyMarket Fund”), Wells Fargo Advantage Treasury Plus Money Market Fund (“Treasury Plus Money Market Fund”), and WellsFargo Advantage 100% Treasury Money Market Fund (“100% Treasury Money Market Fund (each, a “Fund”, collectively, the“Funds”). Each Fund is a diversified series of the Trust, a Delaware statutory trust organized on November 8, 1999.
2. SIGNIFICANT ACCOUNTING POLICIES
The following significant accounting policies, which are consistently followed in the preparation of the financial statementsof each Fund, are in conformity with U.S. Generally Accepted Accounting Principles (“GAAP”) which requires managementto make estimates and assumptions that affect the reported amounts of assets and liabilities, disclosure of contingentassets and liabilities at the date of the financial statements, and the reported amounts of revenues and expenses during thereporting period. Actual results could differ from those estimates. Management has considered the circumstances underwhich the Funds should recognize or make disclosures regarding events or transactions occurring subsequent to thebalance sheet date through the date the financial statements are issued. Adjustments or additional disclosures, if any, havebeen included in these financial statements.
Securities valuationAs permitted under Rule 2a-7 of the 1940 Act, securities are valued at amortized cost, which approximates fair value.
The valuation techniques used by the Funds to measure fair value are consistent with the market approach, incomeapproach and/or cost approach, where applicable, for each security type.
Repurchase agreements The Funds may invest in repurchase agreements and may participate in pooled repurchase agreement transactions withother funds advised by Wells Fargo Funds Management, LLC. The repurchase agreements must be fully collateralizedbased on values that are marked to market daily. The collateral may be held by an agent bank under a tri-partyagreement. It is the custodian’s responsibility to value collateral daily and to take action to obtain additional collateral asnecessary to maintain market value equal to or greater than the resale price. The repurchase agreements are collateralizedby instruments such as U.S. Treasury, federal agency, or high-grade corporate obligations. There could be potential loss toa Fund in the event that such Fund is delayed or prevented from exercising its rights to dispose of the collateral, includingthe risk of a possible decline in the value of the underlying obligations during the period in which a Fund seeks to assertits rights.
Security transactions and income recognition Securities transactions are recorded on a trade date basis. Realized gains or losses are reported on the basis of identifiedcost of securities delivered. Interest income is accrued daily and bond discounts are accreted and premiums are amortizeddaily based on the effective interest method. To the extent debt obligations are placed on non-accrual status, any relatedinterest income may be reduced by writing off interest receivables when the collection of all or a portion of interest hasbecome doubtful based on consistently applied procedures. If the issuer subsequently resumes interest payments orwhen the collectability of interest is reasonably assured, the debt obligation is removed from non-accrual status.
Distributions to shareholders Net investment income, if any, is declared daily and distributed to shareholders monthly. Distributions to shareholdersfrom net realized capital gains, if any, are declared and distributed at least annually. Distributions are based on amountscalculated in accordance with the applicable federal income tax regulations, which may differ from GAAP. The timing andcharacter of distributions made during the period from net investment income or net realized gains may also differ from

Notes to Financial Statements Wells Fargo Advantage Money Market Funds 135
their ultimate characterization for federal income tax purposes. To the extent that these differences are permanent innature, such amounts are reclassified within the capital accounts based on their federal tax-basis treatment. Temporarydifferences do not require reclassifications.
At February 28, 2010, as a result of permanent book-to-tax differences, the following reclassification adjustments weremade on the Statements of Assets and Liabilities:
Undistributed Net Investment Income Paid-in Capital
100% Treasury Money Market Fund $(203,587) $203,587
Federal and other taxesEach Fund is treated as a separate entity for federal income tax purposes. It is the policy of each Fund of the Trust tocontinue to qualify as a regulated investment company by distributing substantially all of its investment companytaxable income and any net realized capital gains (after reduction for capital loss carryforwards) sufficient to relieve itfrom all, or substantially all, federal income taxes. Accordingly, no provision for federal income taxes was required.
Each Fund’s income and federal excise tax returns and all financial records supporting those returns for the prior threefiscal years are subject to examination by the federal and Delaware revenue authorities.
At February 28, 2010, estimated net capital loss carryforwards, which are available to offset future net realized capitalgains, were as follows:
Expiration————————————————————————––––––––––––————————————————————————————————————————————————————————————————————————————————————————2013 2015 2017 2018
California Municipal Money Market Fund $ 0 $ 0 $ 0 $4,878
Municipal Money Market Fund 0 131 0 0
Treasury Plus Money Market Fund 61,122 0 19,571 0
Class allocations The separate classes of shares offered by each Fund differ principally in applicable sales charges, distribution,shareholder servicing and administration fees. Shareholders of each class bear certain expenses that pertain to thatparticular class. All shareholders bear the common expenses of a Fund, earn income from the portfolio, and are allocatedunrealized gains and losses pro rata based on the average daily net assets of each class, without distinction betweenshare classes. Dividends are determined separately for each class based on income and expenses allocable to each class.Realized gains and losses are allocated to each class pro rata based upon the net assets of each class on the daterealized. Differences in per share dividend rates generally result from the relative weightings of pro rata income andrealized gain allocations and from differences in separate class expenses, including distribution, shareholder servicing,and administration fees.
3. FAIR VALUATION MEASUREMENTS
Fair value measurements of investments are determined within a framework that has established a fair value hierarchybased upon the various data inputs utilized in determining the value of the Fund’s investments. These inputs aresummarized into three broad levels as follows:
■ Level 1 – quoted prices in active markets for identical investments
■ Level 2 – other significant observable inputs (including quoted prices for similar investments, interest rates,prepayment speeds, credit risk, etc.)
■ Level 3 – significant unobservable inputs (including the Fund’s own assumptions in determining the fair valueof investments)
The inputs or methodologies used for valuing securities are not necessarily an indication of the risk associated withinvesting in these securities.

136 Wells Fargo Advantage Money Market Funds Notes to Financial Statements
At February 28, 2010, all of the Funds’ investments in securities carried at fair value were designated as Level 2 inputs.Further details on the major security types can be found in the Portfolios of Investments.
4. TRANSACTIONS WITH AFFILIATES AND OTHER EXPENSES
Advisory FeesThe Trust has entered into an advisory contract with Wells Fargo Funds Management, LLC (“Funds Management”). Theadviser is responsible for implementing investment policies and guidelines and for supervising the sub-adviser, who isresponsible for day-to-day portfolio management.
For each Fund, except California Municipal Money Market Fund, Municipal Money Market Fund and 100% Treasury MoneyMarket Fund, Funds Management is paid a fee at an annual rate of 0.10% of each Fund’s average daily net assets. FundsManagement is paid an annual advisory fee starting at 0.30% and declining to 0.25% as the average daily net assetsincreases for California Municipal Money Market Fund, Municipal Money Market Fund, and 100% Treasury Money MarketFund. For the year ended February 28, 2010, the advisory fee was equivalent to an annual rate of 0.28%, 0.30% and 0.27%of the average daily net assets of California Municipal Money Market Fund, Municipal Money Market Fund and 100%Treasury Money Market Fund, respectively.
Funds Management may retain the services of certain investment sub-advisers to provide daily portfolio management.The fees related to sub-advisory services are borne directly by the adviser and do not increase the overall fees paid by aFund to the adviser.
Wells Capital Management Incorporated, an affiliate of Funds Management and indirect wholly owned subsidiary ofWells Fargo & Company, is the sub-adviser to the Funds.
Administration and transfer agent fees The Trust has entered into an Administration Agreement with Funds Management. Under this Agreement, for providingadministrative services, which includes paying fees and expenses for services provided by the transfer agent, sub-transferagents, omnibus account servicers and record-keepers, Funds Management is entitled to receive from each Fund thefollowing annual fees:
AdministrationFees (% of
Average Daily Average DailyNet Assets Net Assets)
Fund level First $5 billion 0.05
Next $5 billion 0.04
Over $10 billion 0.03
Administrator Class All asset levels 0.10
Institutional Class All asset levels 0.08
Select Class All asset levels 0.04
Service Class All asset levels 0.12
Funds Management has contractually waived and/or reimbursed advisory and administration fees during the year endedFebruary 28, 2010 to the extent necessary to maintain certain net operating expense ratios for the Funds. Expenses werewaived by Funds Management proportionately from all classes, first from advisory fees, and then from any class specificexpenses, if applicable.
Custody and fund accounting fees State Street Bank and Trust Company (“State Street”) provides custody and fund accounting services to the Funds. Forproviding custody services, State Street is entitled to an annual asset-based fee for domestic and global custody servicesfor the Funds. For providing fund accounting services to the Funds, State Street is entitled to receive annual asset-basedfees and is reimbursed for out-of-pocket expenses incurred for providing these services.
Prior to January 11, 2010, Wells Fargo Bank, N.A. (“WFB”) provided custody services to the Funds and received a monthly feeat an annual rate of 0.02% of the average daily net assets of each Fund. PNC Global Investment Servicing (“PNC”) served as

Notes to Financial Statements Wells Fargo Advantage Money Market Funds 137
fund accountant for the Trust prior to January 11, 2010 and received an annual asset-based fee and an annual fixed fee fromeach Fund. PNC was also reimbursed for all out-of-pocket expenses reasonably incurred in providing these services.
Shareholder servicing fees The Trust has entered into contracts with one or more shareholder servicing agents, whereby Class A, AdministratorClass, Investor Class and Service Class of each applicable Fund is charged a fee at an annual rate of 0.25%, 0.10%, 0.25%and 0.25%, respectively, of its average daily net assets.
A portion of these total shareholder servicing fees were paid to affiliates of Wells Fargo & Company.
5. DISTRIBUTIONS TO SHAREHOLDERS
The tax character of distributions paid during the years ended February 28, 2010, and February 28, 2009, were as follows:
Long-TermTax-Exempt Income Ordinary Income Capital Gain
2010 2009 2010 2009 2010 2009
California Municipal Money
Market Fund $1,446,118 $62,794,994 $ 168,055 $ 921,475 $ 0 $157,877
Cash Investment Money
Market Fund 0 0 69,220,306 458,172,753 0 0
Government Money
Market Fund 0 0 27,955,983 535,855,182 0 0
Heritage Money Market Fund 0 0 70,707,547 163,063,862 0 0
Municipal Money Market Fund 684,001 6,267,957 0 0 0 0
National Tax-Free Money
Market Fund 9,560,333 94,475,845 211,556 1,172,362 173,423 465,344
Prime Investment Money
Market Fund 0 0 31,223,107 196,573,250 0 0
Treasury Plus Money
Market Fund 0 0 1,502,925 66,685,988 0 0
100% Treasury Money
Market Fund 0 0 2,314,688 56,732,500 0 0
As of February 28, 2010, the components of distributable earnings on a tax basis are shown on the table below. Thedifference between book basis and tax basis appreciation is attributable primarily to the tax deferral of losses on wash sales.
Undistributed Undistributable Unrealized Post-Undistributed Ordinary Long-Term Appreciation Capital Loss October
Tax-Exempt Income Income Gain (Depreciation) Carryforward Losses
California Municipal Money Market Fund $ 4,114 $ 0 $ 0 $ 0 $ (4,878) $ 0
Cash Investment Money Market Fund 0 415,218 29 0 0 0
Government Money Market Fund 0 184,641 0 0 0 0
Heritage Money Market Fund 0 1,170,382 0 (717) 0 0
Municipal Money Market Fund 206 0 0 0 (131) (28)*
National Tax-Free Money Market Fund 47,237 0 26,234 0 0 0
Prime Investment Money Market Fund 0 443,746 26 0 0 0
Treasury Plus Money Market Fund 0 53,357 0 0 (80,693) 0
100% Treasury Money Market Fund 0 112,653 0 0 0 0
* This amount will reverse on the first day of the following fiscal year.
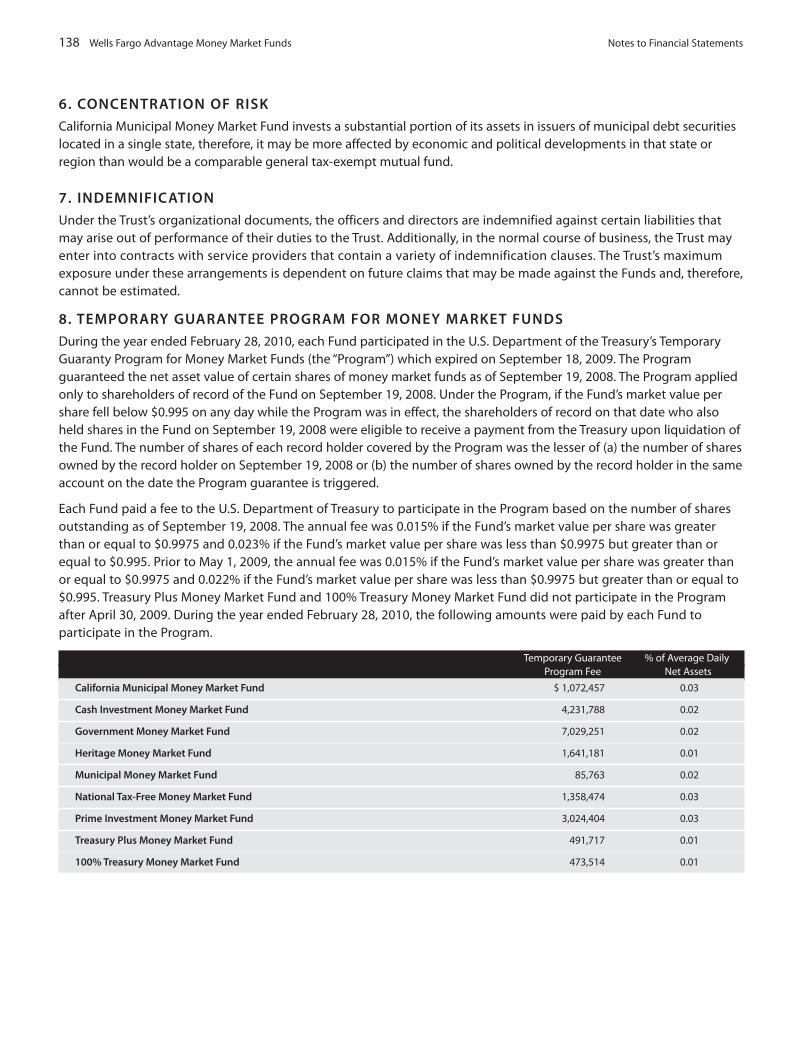
138 Wells Fargo Advantage Money Market Funds Notes to Financial Statements
6. CONCENTRATION OF RISK
California Municipal Money Market Fund invests a substantial portion of its assets in issuers of municipal debt securitieslocated in a single state, therefore, it may be more affected by economic and political developments in that state orregion than would be a comparable general tax-exempt mutual fund.
7. INDEMNIFICATION
Under the Trust’s organizational documents, the officers and directors are indemnified against certain liabilities thatmay arise out of performance of their duties to the Trust. Additionally, in the normal course of business, the Trust mayenter into contracts with service providers that contain a variety of indemnification clauses. The Trust’s maximumexposure under these arrangements is dependent on future claims that may be made against the Funds and, therefore,cannot be estimated.
8. TEMPORARY GUARANTEE PROGRAM FOR MONEY MARKET FUNDS
During the year ended February 28, 2010, each Fund participated in the U.S. Department of the Treasury’s TemporaryGuaranty Program for Money Market Funds (the “Program”) which expired on September 18, 2009. The Programguaranteed the net asset value of certain shares of money market funds as of September 19, 2008. The Program appliedonly to shareholders of record of the Fund on September 19, 2008. Under the Program, if the Fund’s market value pershare fell below $0.995 on any day while the Program was in effect, the shareholders of record on that date who alsoheld shares in the Fund on September 19, 2008 were eligible to receive a payment from the Treasury upon liquidation ofthe Fund. The number of shares of each record holder covered by the Program was the lesser of (a) the number of sharesowned by the record holder on September 19, 2008 or (b) the number of shares owned by the record holder in the sameaccount on the date the Program guarantee is triggered.
Each Fund paid a fee to the U.S. Department of Treasury to participate in the Program based on the number of sharesoutstanding as of September 19, 2008. The annual fee was 0.015% if the Fund’s market value per share was greaterthan or equal to $0.9975 and 0.023% if the Fund’s market value per share was less than $0.9975 but greater than orequal to $0.995. Prior to May 1, 2009, the annual fee was 0.015% if the Fund’s market value per share was greater thanor equal to $0.9975 and 0.022% if the Fund’s market value per share was less than $0.9975 but greater than or equal to$0.995. Treasury Plus Money Market Fund and 100% Treasury Money Market Fund did not participate in the Programafter April 30, 2009. During the year ended February 28, 2010, the following amounts were paid by each Fund toparticipate in the Program.
Temporary Guarantee % of Average DailyProgram Fee Net Assets
California Municipal Money Market Fund $ 1,072,457 0.03
Cash Investment Money Market Fund 4,231,788 0.02
Government Money Market Fund 7,029,251 0.02
Heritage Money Market Fund 1,641,181 0.01
Municipal Money Market Fund 85,763 0.02
National Tax-Free Money Market Fund 1,358,474 0.03
Prime Investment Money Market Fund 3,024,404 0.03
Treasury Plus Money Market Fund 491,717 0.01
100% Treasury Money Market Fund 473,514 0.01

9. NEW ACCOUNTING PRONOUNCEMENT
In January 2010, the Financial Accounting Standards Board (“FASB”) issued an Accounting Standards Update on“Improving Disclosures about Fair Value Measurements” which will require reporting entities to make new disclosuresabout the amount and reasons for significant transfers into and out of Level 1 and Level 2 fair value measurements, theinput and valuation techniques used to measure fair value for both recurring and nonrecurring fair value measurementsand information on purchases, sales, issuances, and settlements on a gross basis in the reconciliation of Level 3 fair valuemeasurements. Except for the detailed Level 3 roll forward disclosures, the disclosures are effective for annual andinterim reporting periods beginning after December 15, 2009. The new disclosures about purchases, sales, issuances,and settlements in the roll forward activity for Level 3 fair value measurements are effective for interim and annualreporting periods beginning after December 15, 2010. Management of the Fund is currently evaluating the implicationsof this Accounting Standards Update and any impacts on the financial statements.
Notes to Financial Statements Wells Fargo Advantage Money Market Funds 139

140 Wells Fargo Advantage Money Market Funds Report of Independent Registered Public Accounting Firm
BOARD OF TRUSTEES AND ADMINISTRATOR, INSTITUTIONAL, SELECT, AND SERVICE CLASS SHAREHOLDERS OF WELLS FARGO FUNDS TRUST:
We have audited the accompanying statements of assets and liabilities, including the portfolios of investments, of the WellsFargo Advantage California Municipal Money Market Fund, Wells Fargo Advantage Cash Investment Money Market Fund,Wells Fargo Advantage Government Money Market Fund, Wells Fargo Advantage Heritage Money Market Fund, Wells FargoAdvantage Municipal Money Market Fund, Wells Fargo Advantage National Tax-Free Money Market Fund, Wells FargoAdvantage Prime Investment Money Market Fund, Wells Fargo Advantage Treasury Plus Money Market Fund, and WellsFargo Advantage 100% Treasury Money Market Fund, nine of the Funds constituting the Wells Fargo Funds Trust(collectively, the “Funds”), as of February 28, 2010, and the related statements of operations for the year then ended,statements of changes in net assets for each of the years in the two year period then ended, and the financial highlights forthe periods presented. These financial statements and financial highlights are the responsibility of the Funds’ management.Our responsibility is to express an opinion on these financial statements and financial highlights based on our audits.
We conducted our audits in accordance with the standards of the Public Company Accounting Oversight Board (United States). Those standards require that we plan and perform the audit to obtain reasonable assurance aboutwhether the financial statements and financial highlights are free of material misstatement. An audit includes examining,on a test basis, evidence supporting the amounts and disclosures in the financial statements. Our procedures includedconfirmation of securities owned as of February 28, 2010, by correspondence with custodian and brokers, or by otherappropriate auditing procedures. An audit also includes assessing the accounting principles used and significantestimates made by management, as well as evaluating the overall financial statement presentation. We believe that ouraudits provide a reasonable basis for our opinion.
In our opinion, the financial statements and financial highlights referred to above present fairly, in all material respects,the financial position of the aforementioned funds of Wells Fargo Funds Trust as of February 28, 2010, the results of theiroperations for the year then ended, the changes in their net assets for each of the years in the two year period then ended,and the financial highlights for the periods presented, in conformity with U.S. generally accepted accounting principles.
Boston, MassachusettsApril 27, 2010

Other Information (Unaudited) Wells Fargo Advantage Money Market Funds 141
PROXY VOTING INFORMATION
A description of the policies and procedures that the Funds use to determine how to vote proxies relating toportfolio securities is available without charge, upon request, by calling 1-800-222-8222, visiting our Web site atwww.wellsfargo.com/advantagefunds, or visiting the SEC Web site at www.sec.gov. Information regarding how the Fundsvoted proxies relating to portfolio securities during the most recent 12-month period ended June 30 is available withoutcharge on the Funds’ Web site at www.wellsfargo.com/advantagefunds or by visiting the SEC Web site at www.sec.gov.
TAX INFORMATION
For federal and California income tax purposes, the following Fund designates a percentage of its distributions paid fromnet investment income during the year as exempt-interest dividends under Section 852(b)(5) of the Code and underSection 17145 of the California Revenue and Taxation Code:
% of the distributions paidfrom net investment income
California Municipal Money Market Fund 100
For federal income tax purposes, the following Funds designate a percentage of its distributions paid from netinvestment income during the year as exempt-interest dividends under Section 852(b)(5) of the Code:
% of the distributions paidfrom net investment income
Municipal Money Market Fund 100
National Tax-Free Money Market Fund 99.98
For California income tax purposes, the following Fund designates a percentage of its distributions paid from netinvestment income during the year as California exempt-interest dividends under Section 17145 of the CaliforniaRevenue and Taxation Code:
% of the distributions paidfrom net investment income
100% Treasury Money Market Fund 100
Pursuant to Section 852(b)(3) of the Code, the Funds listed below designate the following amounts as long-term capitalgain dividends:
Long-Term Capital Gain
National Tax-Free Money Market Fund $173,423
Pursuant to Section 871(k)(1)(c) of the Code, the Funds designate the following amounts as interest-related dividends:
Interest-Related Dividends
Cash Investment Money Market Fund $74,817,233
Government Money Market Fund 34,749,789
Heritage Money Market Fund 73,291,035
National Tax-Free Money Market Fund 1,500
Prime Investment Money Market Fund 34,976,387
Treasury Plus Money Market Fund 1,824,743
100% Treasury Money Market Fund 684,984

142 Wells Fargo Advantage Money Market Funds Other Information (Unaudited)
Pursuant to Section 871(k)(2)(C) of the Code, the Funds listed below designate the following amounts as short-termcapital gain dividends:
Short-Term Capital Gain
California Municipal Money Market Fund $ 168,055
Cash Investment Money Market Fund 272,781
Government Money Market Fund 34,564
Heritage Money Market Fund 505,065
National Tax-Free Money Market Fund 210,056
Prime Investment Money Market Fund 314,108
100% Treasury Money Market Fund 1,631,047

Other Information (Unaudited) Wells Fargo Advantage Money Market Funds 143
PORTFOLIO HOLDINGS INFORMATION
The complete portfolio holdings for each Fund, except money market funds, are publicly available on the Funds’ Web site(www.wellsfargo.com/advantagefunds) on a monthly, 30-day or more delayed basis, and for money market funds, on amonthly, seven-day delayed basis. In addition, top ten holdings information for each Fund is publicly available on theFunds’ Web site on a monthly, seven-day or more delayed basis. Each Fund files its complete schedule of portfolio holdingswith the SEC for the first and third quarters of each fiscal year on Form N-Q, which is available without charge by visiting theSEC Web site at www.sec.gov. In addition, each Fund’s Form N-Q may be reviewed and copied at the SEC’s Public ReferenceRoom in Washington, DC, and at regional offices in New York City, at 233 Broadway, and in Chicago, at 175 West JacksonBoulevard, Suite 900. Information about the Public Reference Room may be obtained by calling 1-800-SEC-0330.
BOARD OF TRUSTEES
The following table provides basic information about the Board of Trustees (the “Trustees”) of the Wells Fargo FundsTrust (the “Trust”) and Officers of the Trust. This table should be read in conjunction with the Prospectus and theStatement of Additional Information1 of each Fund. Each of the Trustees and Officers listed below acts in identicalcapacities for each of the 133 funds comprising the Trust, Wells Fargo Variable Trust and Wells Fargo Master Trust(collectively the “Fund Complex”), except that the person occupying the office of Treasurer varies for specified Funds.All of the Trustees are also Members of the Audit and Governance Committees of each Trust in the Fund Complex. Themailing address of each Trustee and Officer is 525 Market Street, 12th Floor, San Francisco, CA 94105. Each Trustee andOfficer serves an indefinite term, however, each Trustee serves such term until reaching the mandatory retirement ageestablished by the Trustees.
Independent TrusteesPosition Held and
Name and Age Length of Service2 Principal Occupations During Past Five Years Other Directorships
Peter G. Gordon Trustee, since 1998; Co-Founder, Chairman, President and CEO of Crystal Geyser. None
67 Chairman, since 2005 Water Company.
(Lead Trustee since 2001)
Isaiah Harris, Jr. Advisory Board Retired. Prior thereto, President and CEO of BellSouth Advertising CIGNA Corporation;
57 Trustee, since 2008 and Publishing Corp from 2005 to 2007, President and CEO of Deluxe Corporation
BellSouth Enterprises from 2004 to 2005 and President of BellSouth
Consumer Services from 2000 to 2003. Currently a member of the Iowa
State University Foundation Board of Governors and a member of the
Advisory Board of Iowa State University School of Business.
Judith M. Johnson Trustee, since 2008 Retired. Prior thereto, Chief Executive Officer and Chief Investment None
60 Officer of Minneapolis Employees Retirement Fund from 1996 to 2008.
Ms. Johnson is a certified public accountant and a certified
managerial accountant.
David F. Larcker Advisory Board James Irvin Miller Professor of Accounting at the Graduate None
59 Trustee, since 2008 School of Business, Stanford University, Director of Corporate
Governance Research Program and Co-Director of The Rock Center
for Corporate Governance since 2006. From 2005 to 2008, Professor of
Accounting at the Graduate School of Business, Stanford University.
Prior thereto, Ernst & Young Professor of Accounting at The Wharton
School, University of Pennsylvania from 1985 to 2005.
Olivia S. Mitchell Trustee, since 2006 Professor of Insurance and Risk Management, Wharton School, None
56 University of Pennsylvania. Director of the Boettner Center on
Pensions and Retirement Research. Research associate and board
member, Penn Aging Research Center. Research associate, National
Bureau of Economic Research.

144 Wells Fargo Advantage Money Market Funds Other Information (Unaudited)
Position Held andName and Age Length of Service2 Principal Occupations During Past Five Years Other Directorships
Timothy J. Penny Trustee, since 1996 President and CEO of Southern Minnesota Initiative Foundation, None
58 a non-profit organization, since 2007 and Senior Fellow at the Humphrey
Institute Policy Forum at the University of Minnesota since 1995.
Member of the Board of Trustees of NorthStar Education Finance, Inc.,
a non-profit organization, since 2007.
Donald C. Willeke Trustee, since 1996 Principal of the law firm of Willeke & Daniels. General Counsel of the None
69 Minneapolis Employees Retirement Fund from 1984 to present.
OfficersPosition Held and
Name and Age Length of Service2 Principal Occupations During Past Five Years Other Directorships
Karla M. Rabusch President, since 2003 Executive Vice President of Wells Fargo Bank, N.A. and President of None
50 Wells Fargo Funds Management, LLC since 2003. Senior Vice President
and Chief Administrative Officer of Wells Fargo Funds Management,
LLC from 2001 to 2003.
C. David Messman Secretary, since 2000; Senior Vice President and Secretary of Wells Fargo Funds Management, None
49 Chief Legal Counsel, LLC since 2001. Vice President and Managing Senior Counsel of
since 2003 Wells Fargo Bank, N.A. since 1996.
Kasey Phillips3 Treasurer, since 2009 Senior Vice President of Evergreen Investment Management Company, None
39 LLC since 2006 and currently the Treasurer of the Evergreen Funds
since 2005. Vice President and Assistant Vice President of Evergreen
Investment Services, Inc. from 1999 to 2006.
David Berardi4 Assistant Treasurer, Vice President of Evergreen Investment Management Company, LLC None
34 since 2009 since 2008. Assistant Vice President of Evergreen Investment Services,
Inc. from 2004 to 2008. Manager of Fund Reporting and Control for
Evergreen Investment Management Company, LLC since 2004.
Jeremy DePalma4 Assistant Treasurer, Senior Vice President of Evergreen Investment Management None
36 since 2009 Company, LLC since 2008. Vice President, Evergreen Investment
Services, Inc. from 2004 to 2007. Assistant Vice President, Evergreen
Investment Services, Inc. from 2000 to 2004 and the head of the Fund
Reporting and Control Team within Fund Administration since 2005.
Debra Ann Early Chief Compliance Officer, Chief Compliance Officer of Wells Fargo Funds Management, LLC None
45 since 2007 since 2007. Chief Compliance Officer of Parnassus Investments from
2005 to 2007. Chief Financial Officer of Parnassus Investments from
2004 to 2007 and Senior Audit Manager of PricewaterhouseCoopers LLP
from 1998 to 2004.
1. The Statement of Additional Information includes additional information about the Funds’ Trustees and is available, without charge, upon request, by calling 1-800-222-8222 or by visiting the Funds’ Web site at www.wellsfargo.com/advantagefunds.
2. Length of service dates reflects a Trustee’s commencement of service with the Trust’s predecessor entities.
3. Effective November 1, 2009.
4. Treasurer during the period from June 1, 2009 to October 31, 2009. Assistant Treasurer effective November 1, 2009.

List of Abbreviations Wells Fargo Advantage Money Market Funds 145
The following is a list of common abbreviations for terms and entities which may have appeared in this report.
ABAG — Association of Bay Area Governments ADR — American Depositary Receipt AMBAC — American Municipal Bond Assurance Corporation AMT — Alternative Minimum Tax ARM — Adjustable Rate Mortgages BART — Bay Area Rapid Transit CDA — Community Development Authority CDO — Collateralized Debt ObligationCDSC — Contingent Deferred Sales Charge CGIC — Capital Guaranty Insurance Company CGY — Capital Guaranty Corporation CIFG — CDC (Caisse des Dépôts et Consignations) IXIS Financial
GuaranteeCOP — Certificate of Participation CP — Commercial Paper CTF — Common Trust Fund DW&P — Department of Water & Power DWR — Department of Water Resources ECFA — Educational & Cultural Facilities AuthorityEDFA — Economic Development Finance AuthorityETET — Eagle Tax-Exempt TrustETF — Exchange-Traded FundFFCB — Federal Farm Credit Bank FGIC — Financial Guaranty Insurance Corporation FHA — Federal Housing Authority FHAG — Federal Housing AgencyFHLB — Federal Home Loan Bank FHLMC — Federal Home Loan Mortgage Corporation FNMA — Federal National Mortgage AssociationFSA — Farm Service AgencyGDR — Global Depositary Receipt GNMA — Government National Mortgage Association GO — General Obligation HCFR — Healthcare Facilities RevenueHEFA — Health & Educational Facilities AuthorityHEFAR — Higher Education Facilities Authority Revenue
HFA — Housing Finance Authority HFFA — Health Facilities Financing Authority HUD — Housing & Urban DevelopmentIDA — Industrial Development Authority IDAG — Industrial Development AgencyIDR — Industrial Development Revenue LIBOR — London Interbank Offered Rate LLC — Limited Liability Company LOC — Letter of Credit LP — Limited Partnership MBIA — Municipal Bond Insurance Association MFHR — Multi-Family Housing Revenue MFMR — Multi-Family Mortgage RevenueMMD — Municipal Market DataMTN — Medium Term Note MUD — Municipal Utility District NATL-RE — National Public Finance Guarantee CorporationPCFA — Pollution Control Finance Authority PCR — Pollution Control Revenue PFA — Public Finance Authority PFFA — Public Facilities Financing Authorityplc — Public Limited CompanyPSFG — Public School Fund Guaranty R&D — Research & Development RDA — Redevelopment Authority RDFA — Redevelopment Finance Authority REITS — Real Estate Investment Trusts SFHR — Single Family Housing Revenue SFMR — Single Family Mortgage Revenue SLMA — Student Loan Marketing Association SPDR — Standard & Poor’s Depositary ReceiptsSTIT — Short-Term Investment TrustTBA — To Be Announced TRAN — Tax Revenue Anticipation Notes USD — Unified School District XLCA — XL Capital Assurance

This page is intentionally left blank.


© 2010 Wells Fargo Funds Management, LLC. All rights reserved. www.wellsfargo.com/advantagefunds 121480 04-10AMMI/AR006 02-10
Printed on Recycled paper
This report and the financial statements contained herein are submitted for the generalinformation of the shareholders of Wells Fargo Advantage Funds. If this report is used forpromotional purposes, distribution of the report must be accompanied or preceded by acurrent prospectus. For a prospectus containing more complete information, includingcharges and expenses, call 1-800-222-8222 or visit the Funds’ Web site atwww.wellsfargo.com/advantagefunds. Please consider the investment objectives, risks,charges, and expenses of the investment carefully before investing. This and otherinformation about Wells Fargo Advantage Funds can be found in the current prospectus.Read the prospectus carefully before you invest or send money.
“Dow Jones” and “Dow Jones Target Date Indexes” are service marks of Dow Jones & Company, Inc., and havebeen licensed for use for certain purposes by Global Index Advisors, Inc., and Wells Fargo Funds Management,LLC. The Dow Jones Target Date Indexes are based in part on the Barclays Capital Bond Indexes, which arepublished by Barclays Capital Inc. The Wells Fargo Advantage Dow Jones Target Date Funds, based on theDow Jones Target Date Indexes, are not sponsored, endorsed, sold or promoted by Dow Jones or BarclaysCapital, and neither Dow Jones nor Barclays Capital makes any representation regarding the advisability ofinvesting in such product(s) and/or about the quality, accuracy and/or completeness of the Dow Jones TargetDate Indexes or the Barclays Capital Bond Indexes. IN NO EVENT SHALL DOW JONES, BARCLAYS CAPITAL ORANY OF THEIR LICENSORS HAVE ANY LIABILITY FOR ANY SPECIAL, PUNITIVE, INDIRECT OR CONSEQUENTIALDAMAGES (INCLUDING LOST PROFITS), EVEN IF NOTIFIED OF THE POSSIBILITY OF SUCH DAMAGES.
Wells Fargo Funds Management, LLC, a wholly owned subsidiary of Wells Fargo & Company, provides investmentadvisory and administrative services for Wells Fargo Advantage Funds. Other affiliates of Wells Fargo & Companyprovide subadvisory and other services for the Funds. The Funds are distributed by Wells Fargo FundsDistributor, LLC, Member FINRA/SIPC, an affiliate of Wells Fargo & Company.
More information about Wells Fargo Advantage Fundsis available free upon request. To obtain literature, please write, e-mail, visit the Funds’ Web site, or call:
Wells Fargo Advantage FundsP.O. Box 8266Boston, MA 02266-8266E-mail: [email protected]
Web site: www.wellsfargo.com/advantagefundsIndividual Investors: 1- 800-222-8222Retail Investment Professionals: 1- 888-877-9275Institutional Investment Professionals: 1- 866-765-0778