welspun corp limited ar 2013-14_ 2.pdfmr. rajesh r. mandawewala (director) mr. raj kumar jain...
TRANSCRIPT

To embrace change
&gear up for the future Annual Report
2013-14
th19
WELSPUN Corp Limited

Note : FY 14 and FY13 figures are after taking into consideration the demerger of the Company while FY10, FY11, FY12 figures are pre-demerger.
^^ FY 2013-14: Includes other income of Rs. 1,744 million , Total unrealised foreign exchange of Rs. 1,046 million
^ FY 2012-13: Includes other income of Rs. 1,879 million , Total unrealised foreign exchange gain of Rs. 232 million
@@ : For FY11, FY12, FY 13 & FY14 Other Income, a part of Reported EBITDA includes Interest Income for the respective years
### FY 2011-12: Includes Other Income of Rs. 2,676 million which includes interest income of Rs. 1,339 for FY12. Operational Performance was impacted byforeign exchange provisions on Rs. 1,248 million, and provisions made towards amicable settlement with a customer of Rs. 649 million. Totalforeign exchange provision was Rs. 1,517 million.
## FY 2010-11 : Includes export rebate of Rs. 734 mn on receipt of favourable judgement from Honorable Supreme Court and provision of Rs. 2,007 mn onaccount of settlement with one of the customers thereby ending long pending litigation
@ FY 10 : Forex Provisoning made in the previous year were recovered during the year
*** Net worth includes CCDs of Rs. 7,884 million.
** Includes tangible & intangible assets and CWIP
*Post Demerger Effect showing results of Pipes & Plates business as continuing operations.
Includes Deemed Exports#
0.0%
5.0%
10.0%
15.0%
20.0%
EBITDA Margin (%)
2009-10 2010-11 2011-12 2012-13* 2013-14
12.2%
18.1%
10.1%
16.9%
11.0%
Fixed Assets (Gross Block- Rs. Mn)
2009-10 2010-11 2011-12 2012-13* 2013-14
44,248
58,339**
86,957**
65,938**
0
25,000
50,000
75,00069,640**
100,000
2010-11 2011-12 2012-13* 2013-14
81,360
92,442
5,000
100,000
50,000
90,832
2009-10
73,82277,047
25,000
75,000
0
2,000
4,000
6,000
8,000
2009-10 2010-11 2011-12 2012-13* 2013-14
6,330
2,385
1,404734
6,104
Total Income (Rs. Mn) PAT (Rs. Mn)
25,000
45,000
65,000
Exports/Overseas Revenue (Rs. Mn)#
5,000
2009-10 2010-11 2011-12 2012-13*
52,86046,139
2013-14
68,115
85,000
52,603
62,864
5.0
15.0
25.0
35.0
2009-10 2010-11 2011-12 2012-13* 2013-14
31.7 30.9
10.96.1
2.8
45.0
Basic EPS (Rs. / Share)
500
2,500
4,500
6,500
8,500
10,500
12,500
14,500
2009-10 2010-11 2011-12 2012-13* 2013-14
13,372@ 13,784##
Reported EBITDA (Rs. Mn)@@
8,439^^9,191^
11,247###
1,000
11,000
21,000
31,000
2009-10 2010-11 2011-12 2012-13* 2013-14
29,01133,735
41,000
51,000
27,504 29,569
Networth (Rs. Mn)
48,816***
financial highlights (consolidated)
In this Annual Report we have disclosed forward-looking information to enable investors comprehend our prospects and take informed investment
decisions. We have tried, wherever possible, to identify such statements by using words as 'anticipate', 'estimate', 'expects', 'projects', 'intends', 'plans',
'believes', and words of similar substance in connection with any discussion of the future performance. We cannot guarantee that these forward-looking
statements will be realized, although we believe we have been prudent in our assumptions. Should known or unknown risks or uncertainties materialize, or
should underlying assumptions prove inaccurate, actual results could vary materially from those anticipated, estimated or projected. Readers should bear
this in mind. We undertake no obligation to publicly update any forward-looking statements, whether as a result of new information, future events or
otherwise.
Forward Looking Statement
contents
2
Corporate Information
6
Chairman's Statement
10
Directors' Report
16
Corporate Governance Report
28
Management Discussion and Analysis
50
Corporate Social Responsibility
58
Financial Section

2
WELSPUN Corp Limited
------- --------------- ---------------- ----------------- ---------------- ---------------- ---------------- ----------------- ---------------- ----------------- ---------------- ---------------- ----------------- ---------------- ---------------- -------------
Company Identification Number
Date of Incorporation
Date of Being Listed on Stock Exchange
Type of Business
Registered Capital
Paid Up Capital
: L27100GJ1995PLC025609
: 26th April 1995
: BSE: 27th March 1997
NSE: 4th December 2003
: Manufacturing of Steel Pipes, Coils and
generation of Power
: Rs. 2500 million
: Rs. 1314.74 million divided into 262,948,299 equity
shares of Rs.5/- each fully paid-up
Plates,
Par Value / Share
Securities Registrar & Transfer Agent
: Rs. 5/- each
: Link Intime India Private Ltd.
C- 13, Pannalal Silk Mills Compound,
LBS Marg, Bhandup (West),
Mumbai - 400078
--------------------------------------------------------------------------------------------------------------------------------------------------------------------------------------------------------------------------------------------------------------------------------------------------------------------------------------------------------------------------------------------------------------------------------------------------------------------------------------------------------------------------------------------------------------------------------
Manufacturing Units of the Company
i. Village Jolva & Vadadla, Near Dahej, Taluka : Vagra, Dist.
Bharuch, Gujarat - 392 130.
ii. Village Versamedi, Tal - Anjar, Dist.- Kutch, Gujarat -
370110
iii. KIADB Industrial Area, Gejjalagere, Taluka Maddur, Dist.
Mandya, Karnataka -571428
iv. 9301, Frazier Pike, Little Rock , Arkansas 72205, USA
v. 2nd Ind City Dammam, Kingdom of Saudi Arabia, P. O.
Box 12943, Postal Code 31483
Manufacturing Units of the Subsidiaries
----------------------------------------------------------------------------------------------------------------------------------------------------------------------------------------------------------------------------------------------------------------------------------------
Mr. Pradeep Joshi
Company Secretary
Mr S. Krishnan.
Chief Financial Officer
“Welspun City”,
Village Versamedi, Tal. Anjar, Dist Kutch,
Gujarat - 370110, India
Fax: +91-2836-279060
Tel: +91-2836-662079
Registered Office
MGB & Co., Chartered AccountantsAuditors
Corporate Office
Welspun House, 5th Floor,
Kamala Mills Compound,
Senapati Bapat Marg, Lower Parel,
Mumbai - 400 013, INDIA
Fax. +91-22-2490 8020/21
E-mail: [email protected]
Website: http://www.welspuncorp.com
Tel: +91-22-6613 6000/ 2490 8000
----------------------------------------------------------------------------------------------------------------------------------------------
----------------------------------------------------------------------------------------------------------------------------------------------
----------------------------------------------------------------------------------------------------------------------------------------------
----------------------------------------------------------------------------------------------------------------------------------------------
----------------------------------------------------------------------------------------------------------------------------------------------
-----------------------------------------------------------------------------------------------------------------------------
Bombay Stock Exchange Ltd.Phiroze Jeejeebhoy Towers, Dalal Street, Mumbai - 400 051
The National Stock Exchange of India Ltd.Exchange Plaza, Bandra Kurla Complex, Bandra (E),Mumbai - 400 001
Stock exchanges where the Company’s securities are listed
Singapore Exchange Securities Trading Limited (the“SGX-ST”)2 Shenton Way, #19-00 SGX Centre 1, Singapore - 068804
Mr. Balkrishan Goenka( Executive)Chairman, Non-
Mr. Rajesh R. Mandawewala(Director)
Mr. Raj Kumar Jain(Director)
Mr. Ram Gopal Sharma(Director)
Mr. Nirmal Gangwal(Director)
Mr. K.H. Viswanathan(Director)
Mr. Mukul Sarkar(Nominee Director of Exim Bank Ltd.)
Board of Directors
Mr. Mintoo Bhandari Mr. Utsav Baijal(Nominee Director of Insight Solutions Ltd.) (Nominee Director of Insight Solutions Ltd.)
Mr. Braja Mishra( )Managing Director
Bankers
Andhra Bank
Bank of Baroda
Bank of India
Canara Bank
Citibank N.A.
Corporation Bank
ICICI Bank Limited
IDBI Bank Ltd
Oriental Bank of Commerce
Punjab National Bank
Standard Chartered Bank
State Bank of Bikaner & Jaipur
State Bank of India
State Bank of Travancore
Union Bank of India
Export - Import Bank of India
DBS Bank Ltd
Central Bank of India
corporate information
Allahabad Bank

YEAR
2013 - Achieved 1 million MT mark in Production, Sales and Order Booking.
- New 175,000 MTPA, HFIW Mill at Little Rock commissioned and received the API certification.
- Demerger of other businesses (Infra, DRI, Oil & Gas and Energy) into Welspun Enterprises Limited, for effective business
focus.
2012 - Initiated new HFIW mill of 175,000 MTPA in Little Rock, Arkansas, US.
- 50,000 MTPA capacity expansion of the already existing 100,000 MTPA HSAW capacity in Mandya, Karnataka.
2011 - WCL raised $290 million in the form of GDRs (US $115 million) & CCDs (US $175 million).
- Saudi plant commenced production.
- L-SAW plant at Anjar commissioned.
- Welspun Middle East established its presence in Dubai to cater to the bouyant markets of Middle East and Africa.
- Acquired 35% stake in Leighton Contractors (India) Private Limited (renamed as Leighton Welspun Contractors Private
Limited)
- Awarded "EEPC Top Exporter for the Year 2011" - Gold Trophy
- Awarded "IACC Best Indian Manufacturing Company in the US 2011"
2010 - Initiated capacity expansion in India of LSAW by 350,000 MTPA in Anjar, Gujarat, HSAW by 100,000 MTPA in Mandya near
Bangalore.
- Fund raising of US$ 250 million of which US$ 150 million was raised through FCCB (Foreign Convertible Currency Bonds)
in Oct 2009 and $ 100 million through QIP (Qualified Institutional Placement) in Nov 2009.
- Foray in infrastructure by way of investment in Welspun Projects Limited (formerly known as MSK Projects India Ltd.)
- Completed investment in Middle East company with 300,000 MTPA HSAW facility in Saudi Arabia.
- Change in name of Welspun Gujarat Stahl Rohren Limited to “Welspun Corp Limited” w.e.f. 27/04/2010.
2009 - Commissioning of the US Pipe Mill in Little Rock Arkansas, with the capacity of 350,000 MTPA of HSAW pipes.
- Commissioning of the Coil Mill at Anjar, Gujarat.
2008 - Recognized as 2 Largest (Large Diameter) Pipe producer in the World by The Financial Times, UK.
- PlateMillgotoperational from28 March 2008.Achieved Level II automation,Rolled X-70API Gradeof 4.5meters wide.
- Double Jointing & Coating facility commissioned at the Little Rock facility in Arkansas U.S.
- Awarded “Emerging Company of the Year” for Corporate Excellence 2008 by Economic Times.
- Commissioning of additional HSAW Mill with the capacity of 150,000 MTPA at Anjar, Gujarat.
nd
th
2014 - Achieved the 1 Million MT mark for the Second Consecutive Year in Production, Sales and Order Booking.
- All time High Annual Pipe Production and Sales Volumes.
- Double Jointing plant commissioned in Saudi Arabia; Internal & External Coating Plant commissioned in Anjar, India.
- Single Largest Order from Saudi Arabia and First Order from Shell USA.
- New Customer breakthroughs : Statoil, TOTAL and South Stream (only Indian company allowed to participate)
important changes and developments
3
WELSPUN Corp Limited

4
Income Statement Data
Total Income
Reported EBITDA
Normalized EBITDA
Gross Profit
EBIT
PAT (After Minority Interest)
Balance Sheet Data
Net Current Assets
Fixed Assets **
Investments (Current and Non Current)
Deffered Tax Assets
Gross Debt
Cash and Liquid Investments
Net Debt
Networth
Minority Interest
Average Shareholders Fund
Deffered Tax Liability (Net)
Capital Employed
Capital Employed (Net of Cash and Liquid Investments)
Average Capital Employed (Net of Cash and Liquid Investments)
Cash Flow Data
Operating Expenses (COGS, Mfg and Other Expenses)
Depreciation / Amortization
Finance Costs (Gross)
Current Assets
Current Liabilities
Cash and Bank Balance
Liquid Investments
Net Cash Flows by Operating Activities
Net Cash Flows by Investing Activities
Net Cash Flows by Financing Activities
Year ended 31st March (Consolidated)Particulars
81,360
13,784
14,461
9,104
11,345
6,330
22,221
48,645
14,405
-
38,060
21,875
16,185
33,735
2,024
31,373
4,344
78,163
56,288
47,752
67,576
2,439
2,240
56,995
34,774
7,508
14,366
6,665
(22,574)
5,585
##
-
92,442
11,247
10,901
3,732
7,732
2,385
21,226
63,625
19,785
66
53,407
29,686
23,721
48,816
3,433
41,276
5,036
110,692
81,006
68,647
81,195
3,515
3,999
78,620
57,394
10,255
19,431
###
***
14,287
(22,054)
9,634
(Rs. in Million)
73,822
13,372
13,186
11,301
11,311
6,104
17,961
38,283
1,596
-
25,476
18,623
6,853
29,011
-
22,304
3,352
57,839
39,217
36,615
60,450
2,061
2,071
51,471
33,510
17,028
1,595
3,843
(3,885)
2,767
#
2014
92,711
9,191
7,079
2,076
5,659
1,404
18,269
51,025
10,082
83,520
3,531
3,583
60,072
41,803
^
38,907
15,771
23,137
27,504
1,015
38,160
5,417
72,843
57,073
69,039
5,923
9,848
271
(435)
(680)
31.69
28.40
18.11%
8.27%
0.24
0.51
27.37%
30.89%
Financial Ratios
EPS - Basic (Rs/share)
EPS - Diluted (Rs/share)
EBITDA Margin (%)
PAT Margin (%)
Net Debt to Shareholders Fund
Net Debt to EBITDA
Return on Avg. Shareholders Fund
ROCE [EBIT/ (Avg. Capital Employed)]
10.89
9.71
12.17%
2.58%
0.49
2.11
5.78%
11.26%
Note : FY 14 and FY13 figures are after taking into consideration the demerger of the Company while FY10, FY11, FY12 figures are pre-demerger.
@ Prior to revised Schedule VI
* Post Demerger Effect showing results of Pipes & Plates business as continuing operations.
^^ FY 2013-14: Includes other income of Rs. 1744 million , Total unrealised foreign exchange of Rs. 1,046 million
^ FY 2012-13: Includes other income of Rs. 1879 million , Total unrealised foreign exchange gain of Rs. 232 million
### FY 2011-12: Includes Other Income of Rs. 2,676 million which includes interest income for FY12. Operational Performance was impacted by foreign exchange provisions on
Rs.1,248million,and provisions madetowards amicablesettlementwith a customerof Rs.649million.Total foreign exchangeprovision was Rs.1,517 million.
## FY 2010-11 : includes export rebate of Rs. 734 mn on receipt of favourable judgment from Honorable Supreme Court and provision of Rs. 2,007 mn on account of
settlement with one of the customers thereby ending long pending litigation"
# FY 2009-10 : Forex Provisioning made in the previous year were recovered during the year
** includes Capital Work-In-Progress
*** Net worth includes CCDs of Rs. 7,884 million.
30.95
28.66
16.94%
7.78%
0.48
1.17
20.18%
23.76%
6.06
6.06
9.91%
1.51%
0.84
2.52
3.68%
8.20%
financials at a glance
2010@
201120122013*
78,791
8,439
7,742
1,412
4,376
734
13,926
50,372
11,398
70,352
4,063
2,964
36,719
22,793
^^
-
37,411
12,590
24,821
29,569
1,012
28,536
5,609
73,601
61,011
59,042
1,447
11,143
1,885
(1,222)
(5,139)
2.79
2.79
10.71%
0.93%
0.84
2.94
2.57%
7.41%

5
WELSPUN Corp Limited
Year ended 31 March (Consolidated)Particulars
(USD in Million)
Income Statement Data
2014 2011
Total Income
Reported EBITDA
Normalized EBITDA
Gross Profit
EBIT
PAT (After Minority Interest) ##
Balance Sheet Data
Net Current Assets
Fixed Assets **
Investments (Current and Non Current)
Deffered Tax Assets
Gross Debt
Cash and Liquid Investments
Net Debt
Networth
Minority Interest
Average Shareholders Fund
Deffered Tax Liability (Net)
Capital Employed
Capital Employed (Net of Cash and Liquid Investments)
Average Capital Employed (Net of Cash and Liquid Investments)
Cash Flow Data
Operating Expenses (COGS, Mfg and Other Expenses)
Depreciation / Amortization
Finance Costs (Gross)
Current Assets
Current Liabilities
Cash and Bank Balance
Liquid Investments
Net Cash Flows by Operating Activities
Net Cash Flows by Investing Activities
Net Cash Flows by Financing Activities
1,928
1,693
235
227
151
161
50
417
1,251
389
1
1,050
585
466
960
67
811
99
2,176
1,592
1,349
###
73
83
1,545
1,128
202
383
298
(460)
201
***
financials at a glance
2012
1,302
139
128
1,163
^^
Exchange rates used for Balance Sheet Items is Closing rate as on 31 March 59.915 54.285 50.875 44.60 44.90
Exchange rates used for Profit & Loss Items is Average rate for the year 60.496 54.451 47.946 45.53 47.47
Note : FY 14 and FY13 figures are after taking into consideration the demerger of the Company while FY10, FY11, FY12 figures are pre-demerger.
@ Prior to revised Schedule VI
Post Demerger Effect showing results of Pipes & Plates business as continuing operations.
^^ FY 2013-14: Includes other income of Rs. 1744 million , Total unrealised foreign exchange of Rs. 1,046 million
^ FY 2012-13: Includes other income of Rs. 1879 million , Total unrealised foreign exchange gain of Rs. 232 million
### FY 2011-12: Includes Other Income of Rs. 2,676 million which includes interest income for FY12. Operational Performance was impacted by foreign exchange
provisionsonRs.1,248million,andprovisionsmadetowardsamicablesettlementwithacustomerofRs.649million.TotalforeignexchangeprovisionwasRs.1,517million.
## FY 2010-11 : includes export rebate of Rs. 734 mn on receipt of favourable judgment from Honorable Supreme Court and provision of Rs. 2,007 mn on account of
settlement with one of the customers thereby ending long pending litigation"
# FY 2009-10 : Forex Provisioning made in the previous year were recovered during the year
** includes Capital Work-In-Progress
*** Net worth includes CCDs of Rs. 7,884 million.
*
Financial Ratios
EPS - Basic (US $/share)
EPS - Diluted (US $/share)
EBITDA Margin (%)
PAT Margin (%)
Net Debt to Shareholders Fund
Net Debt to EBITDA
Return on Avg. Shareholders Fund
ROCE [EBIT/ (Avg. Capital Employed)]
2013*
31
(20)
(85)
0.05
0.05
10.71%
0.93%
0.84
2.94
2.57%
7.41%
1,703
169
130
38
104
26
337
940
186
-
717
291
426
507
19
703
100
1,342
1,051
1,272
1,534
65
66
1,107
770
109
181
5
(8)
(12)
^
0.11
0.11
9.91%
1.51%
0.84
2.52
3.68%
8.20%
0.23
0.20
12.17%
2.58%
0.49
2.11
5.78%
11.26%
1,787
1,484
303
318
254
249
139
498
1,091
323
-
853
431
363
756
45
704
97
1,753
1,262
1,071
##
54
49
1,278
780
168
283
146
(496)
123
0.68
0.63
16.94%
7.78%
0.48
1.17
20.18%
23.76%
1,555
1,273
282
278
238
238
129
400
853
36
-
567
367
153
646
-
497
75
1,288
873
815
#
43
44
1,146
746
379
31
81
(82)
58
0.67
0.60
18.11%
8.27%
0.24
0.51
27.37%
30.89%
2010@
23
72
12
232
841
190
-
624
210
414
494
17
476
94
1,228
1,018
985
67
49
613
380
24
186

- B K Goenka,
Chairman, Welspun Group

My dear fellow stakeholders,
The year 2013-14 will be remembered as a transition year for Welspun Corp Limited where we position ourselves well for
the future. We strive to better our operational performance in order to deliver on our strategic commitments and to create
value for all our stakeholders and community at large.
This has been one of the most challenging periods for the Steel Industry, which has had an adverse impact on the Pipe
Industry. However, we have withstood this unprecedented period and also emerged stronger and more resilient to
capitalise on future opportunities. Our multi-location manufacturing facilities, our local ‘insider’ status in the key Oil & Gas
markets along with our multiple product strategy have been the driving factors during this period. Today, we are amongst
the leading companies in the Line Pipes business; however, we aim to replicate this leadership position even within
product segments, geographic regions and above all, to emerge as a thought leader.
Order Book
Business Re-Organization
Financial Performance
Corporate Social Responsibility
To adapt and address the needs of the local markets, we have implemented a Business Unit (BU) framework which has
enabled us to remain committed to our esteemed customers while successfully adding new customers like Statoil, TOTAL
and Shell (USA). I am glad to inform you that despite the challenging business environment, when most customers globally
have held back their capital expenditure programs, we at Welspun Corp have achieved 1 million tonnes of new order
bookings for a second consecutive year. For example, Saudi Aramco - one of the largest oil & gas player, has given our
Middle East facility probably their single largest pipe order - a record in itself. A continued healthy order book is a testimony
of our quality to delivery and first-class customer service. It is with pride that we can say that our products are globally well
recognized and amongst the best in the industry.
I take this opportunity to reiterate that during the last one year, Welspun Corp undertook the demerger exercise. Now, the
demerger is complete with Infrastructure, Steel, Energy and Oil & Gas businesses becoming a part of Welspun Enterprises
Limited. This will enable Welspun Corp to have laser sharp focus on the Line Pipes vertical. It will ring fence the pipes cash
flows, which will be used for de-leveraging the Welspun Corp Ltd. as well as enhancing the business without any capital
allocation uncertainty.
During the last financial year we delivered robust pipes sales and production volumes, much in line with the previous year
performance, crossing a million tonnes in order book, production and sales for a second consecutive year. Our operational
EBITDA and Cash PAT have also improved for the continuing businesses on a post-demerger comparable basis. In
continuation to our dividend distribution during the last 6 years, this year the company has declared a 10% dividend.
Welspun as a group is committed to building a sustainable and progressive community. Our social mission is enshrined
within the 3E’s i.e. Education, Empowerment and Environment & Health. We have been investing in providing quality
education by tying up with government schools in Kutch. Through this programme, we reach out to students and teachers
in order to help achieve a higher standard of education whilst also working towards their individual training and
development. Several vocational centers have been set up to train women in villages with the craft of cutting & stitching,
owing to which hundreds of women have enriched and empowered their lives by gaining financial stability. We have also
built a drinking water purification RO plant in Vapi, Gujarat which provides purified drinking water to villages in its
surrounding areas. Welspun believes in creating a thriving environment and nothing can sustain if we ignore our natural
surroundings. Thus, on the basis of this belief, we have hosted many Green World initiatives where we have planted
thousands of trees in and around our Anjar facility. All these efforts have been undertaken to give back to our society, and
more so to thank the community for their undeterred support throughout our growth journey.
Finally, I express my humble gratitude to all the stakeholders including our lenders, employees, customers and suppliers
who have provided their support and co-operation during all these years. I am committed to constantly improve the
factors that are in our control and make the best of those factors that are beyond our control to take Welspun Corp Ltd. to
the highest level of performance while delivering sustainable shareholder value.
Many Thanks,
B. K. Goenka
message from the chairman

10
directors’ report
Your directors have pleasure in presenting the 19th Annual Report of your Company along with the Audited Financial
Statement for the financial year ended March 31, 2014.
To,
The Members,
Welspun Corp Limited
financial results(Rs. in million)
Particulars
Standalone
For the Year Ended
Consolidated
For the Year Ended
31.03.2014 31.03.2013 31.03.2014 31.03.2013
Revenue from operations (Net)
Profit before finance cost, depreciation & tax
Less : Finance costs
Gross Profit / ( Loss)
Less: Depreciation/Amortization
Profit before tax for the year
Less : Provision for taxation
Current Taxation
MAT Credit Entitlement
Deferred Taxation
Profit after tax for the year (after Minority Interest)
Profit / (loss) before tax from discontinued operations
Less : Tax expense of discontinued operations
Profit / (loss) after tax before share of results of associatesand minority interest from discontinued operations
Profit / (loss) for the year from discontinued operations
Profit / (loss) for the year
Add : balance brought forward from previous year
Profit available for appropriation
Transfer to Statutory Reserve
Transfer to General Reserve
Transfer to / (From) Debenture Redemption Reserve
Proposed Dividend on equity shares & tax
Equity dividend & tax of earlier years
Balance carried forward to the next year
48,676.12
4,219.72
2,239.81
1,979.91
2,255.69
(275.78)
-
-
(100.36)
(175.42)
-
-
-
-
(175.42)
14,156.03
9,988.28
-
-
-
153.81
-
9,835.49
66,321.65
5,970.50
2,988.98
2,981.52
2,289.90
691.62
138.38
(138.38)
186.73
504.89
188.03
162.06
25.97
25.97
530.86
13,510.35
14,041.21
-
53.09
(321.92)
153.81
0.20
14,156.03
77,047.23
8,439.16
2,964.04
5475.12
4,063.01
1,412.11
414.57
-
17.01
733.90
-
-
-
-
733.90
17,705.39
17,536.63
93.01
-
-
153.81
-
17,290.82
90,832.10
9,190.62
3583.23
5,607.39
3,531.24
2,076.15
(44.07)
(138.38)
675.31
1404.28
(2,569.96)
(102.55)
(2467.41)
(2107.51)
(703.23)
18,296.99
17,593.76-
56.27
(321.92)
153.81
0.20
17,705.39
-

11
PERFORMANCE
DIVIDEND
SCHEME OF ARRANGEMENT IN THE NATURE OF DEMERGER
FUNDS UTILIZATION
DIRECTORS
DIRECTORS’ RESPONSIBILITY STATEMENT
Production and processing activities highlights for the year under report on standalone basis are as under:
- Pipes: 618,180 MT (631,133 MT).
- Plates: 9,773 MT (260,247 MT). This shows lesser captive consumption of plates for manufacturing.
- H.R. Coils: 12,743 MT (209,546 MT). This shows lesser of coils for manufacturing.
- Coating: 3,762 K sqm (4,142 K sqm). This shows less demand for coated pipes.
- Power: 18,456 MWH (122,585 MWH).
(For the above aspects on consolidated basis, refer the Management Discussion and Analysis included in the Annual Report)
Finance Costs reduced mainly due to conversion of Compulsorily Convertible Debentures (CCD) into equity shares during previous year,
repayment of ECB and part buyback of FCCB.
The Board recommends a dividend @ 10% for the year ended March 31, 2014 i.e. Re. 0.50/- per equity share of Rs.5/- each fully paid-up.
In respect of the dividend declared for the previous financial years, Rs. 5.35 million remained unclaimed as on March 31, 2014.
The Scheme of Arrangement for restructuring of business by transfer of all the assets and the liabilities of the Other Businesses Division
comprising of infrastructure business (including energy, water, road), the direct reduced iron (DRI) business, oil and gas, and EPC
contracting business (the “Other Businesses”) to Welspun Enterprises Limited (the “Resulting Company”), by the Company with the
Appointed Date being April 1, 2012 and the share exchange ratio of 1 (one) equity share of Rs. 10 each fully paid-up of Welspun
Enterprises Limited for every 20 (Twenty) equity shares of Rs. 5 each fully paid-up of the Company (the “Scheme”) as sanctioned by the
Hon’ble High Court of Gujarat at Ahmedabad vide its order dated January 10, 2014, has been made effective on January 24, 2014.
The long term funds of Rs. 13,428 million raised during the earlier financial years by issuing Secured Non-Convertible Debentures have
been utilized partly for capital expansion and long term working capital requirement, and pending utilization, the balance has been
invested in liquid securities.
Out of US$150 million Foreign Currency Convertible Bonds (“FCCB”) issued by the Company during the financial year 2009-10, the
Company has bought back and cancelled FCCB of US$ 75 million till the end of the year under review (out of which US$ 6.50 million was
bought back during FY 2013-14). The FCCBs outstanding as at the end of the year under review were US$75 million. The proceeds have
been utilized for the purpose for which the same was raised, and pending utilization, the balance is lying in bank accounts outside India.
Since the last report, no change took place in the Board of Directors.
In accordance with the provisions of the Companies Act, 1956 and the Articles of Association of the Company, Mr. Rajesh Mandawewala,
is retiring by rotation at the forthcoming Annual General Meeting and being eligible, has been recommended for re-appointment.
Pursuant to the provisions of Section 150(2) read with Section 149(10) of the Companies Act, 2013, shareholders’ approval is sought for
the appointment of Mr. Rajkumar Jain, Mr. K.H.Viswanathan, Mr. Ramgopal Sharma, Mr. Nirmal Gangwal and Ms. Revathy Ashok as
Independent Directors of the Company for a term of five consecutive years, at the forthcoming annual general meeting. Details about
them are given in the Notice of the forthcoming Annual General Meeting being sent to the members along with the Annual Report.
Pursuant to Section 217 (2AA) of the Companies Act, 1956, your directors hereby confirm that:
(i) in the preparation of the accounts for the financial year ended March 31, 2014, the applicable accounting standards have been
followed and there are no material departure from the same;
(ii) the Directors have selected such accounting policies and applied them consistently and made judgments and estimates that are
reasonable and prudent so as to give a true and fair view of the state of affairs of the Company as at the end of the financial year and
of the loss of the Company for the year under review;
(iii) the Directors have taken proper and sufficient care for the maintenance of adequate accounting records in accordance with the
provisions of the Companies Act, 1956 for safeguarding the assets of the Company and for preventing and detecting fraud and other
captive consumption
WELSPUN Corp Limited

12
WELSPUN Corp Limited
irregularities;
(iv) the Directors have prepared the accounts for the financial year ended March 31, 2014 on a going concern basis.
M/s. MGB & Co., Chartered Accountants, the Auditors retire at the conclusion of the forthcoming Annual General Meeting and have
expressed their unwillingness to be reappointed for a further term.
Hence, the Board of Directors, based on the recommendations of the Audit Committee, propose the appointment of M/s. Price
Waterhouse, Chartered Accountants (Firm Reg. No. (012754M), as the Statutory Auditors of the Company to hold office as such upto the
conclusion of the 25th Annual General Meeting in place of the retiring Auditors, M/s. MGB & Co., Chartered Accountants, to audit the
accounts of the Company for the financial year 2014-15 to 2019-20 subject to ratification by the Members of the Company at every
Annual General Meeting.
M/s. Price Waterhouse has confirmed that if appointed, then their said appointment would be in pursuance to the provisions of Section
139 of the Companies Act, 2013.
The Auditors’ observation read with Notes to Accounts are self-explanatory and therefore do not call for any comment.
The Company had appointed M/s. Kiran J. Mehta & Co., Cost Accountants (Firm Registration No. 000025) as the Cost Auditors of the
Company for the financial year 2013-14. The Cost Audit Report for the year 2012-13 was -e-filed on August 19, 2013. The Cost Audit
for the financial year 2013-14 is in progress and the report will be e-filed to Ministry of Corporate Affairs, Government of India, in due
course.
In terms of the above Rules, your directors are pleased to give the particulars as prescribed therein in the Annexure, which forms a part of
the Directors’ Report.
As per the provisions of Section 217(2A) of the Companies Act, 1956 read with the Companies (Particulars of Employees) Rule, 1975 as
amended, the names and other particulars of the employees are set out in the Annexure to the Directors’ Report. However, as per the
provisions of Section 219(1)(b)(iv) of the Companies Act, 1956, the Report and the Accounts are being sent to all the members of the
Company excluding the aforesaid information. Any member interested in obtaining such particulars may write to the Company Secretary
at the Registered Office of the Company.
Information in accordance with the provisions of Section 217(1)(e) of the Companies Act, 1956, regarding conservation of energy,
technology absorption and foreign exchange earnings and outgo is given in the Annexure forming part of Directors’ Report.
The Ministry of Corporate Affairs vide its General Circular No. 2 / 2011 dated February 8, 2011 (the “Circular”) granted general exemption
to the companies from attaching a copy of the Balance Sheet, the Profit and Loss Account and other documents of its subsidiary
companies as required to be attached under Section 212 of the Companies Act, 1956 to the Balance Sheet of the holding company subject
to fulfillment of conditions stipulated in the Circular.
Therefore, the said documents of the following subsidiary companies viz. (1) Welspun Pipes Limited, (2) Welspun Tradings Limited, (3)
Welspun Pipes Inc, (4) Welspun Tubular LLC, (5) Welspun Global Trade LLC, (6) Welspun Mauritius Holdings Limited, (7) Welspun Middle
East Pipe Coatings Company LLC, (8) Welspun Middle East Pipe Company LLC, (9) Welspun Middle East DMCC is not attached to the
Annual Report. However, the aforesaid documents relating to the subsidiary companies and the related detailed information will be
made available upon request by any member or investor of the Company. Further, the Annual Accounts of the subsidiary companies will
be kept open for inspection by a member or an investor at the Registered Office of the Company or the respective subsidiary company. As
required under the Circular, a statement containing the requisite information for each subsidiary is attached with this Report.
AUDITORS
AUDITORS’ REPORT
COST AUDIT REPORT
THE COMPANIES (DISCLOSURE OF PARTICULARS IN THE REPORT OF BOARD OF DIRECTORS) RULES, 1988
PARTICULARS OF EMPLOYEES
ENERGY, TECHNOLOGY AND FOREIGN EXCHANGE
SUBSIDIARY COMPANIES

FIXED DEPOSITS
LISTING WITH STOCK EXCHANGES
CORPORATE GOVERNANCE
CONSOLIDATED FINANCIAL STATEMENTS
ACKNOWLEDGEMENT
The Company has not accepted any public deposit within the meaning of the Companies (Acceptance of Deposit) Rules, 1975 and, as
such, no amount on account of principal or interest on public deposit was outstanding on the date of the Balance Sheet.
The Company’s equity shares are listed on the Bombay Stock Exchange Limited (BSE) and the National Stock Exchange of India Limited
(NSE). The Secured Non-Convertible Debentures are listed on the Bombay Stock Exchange Limited. The Foreign Currency Convertible
Bonds and the Global Depository Receipts are listed at Singapore Securities Trading Limited (SGX-ST). Annual listing fees for the year
2014-15 have been paid to BSE, NSE and SGX-ST
A separate report on the Corporate Governance is annexed hereto as a part of this Report. A certificate obtained from the Company
Secretary in Practice regarding compliance of the conditions of the Corporate Governance as prescribed under Clause 49 of the Listing
Agreement is attached to this Report. A separate report on Management Discussion and Analysis is enclosed as a part of the Annual
Report.
As stipulated by the Clause 32 of the Listing Agreement with the Stock Exchanges and Circular No. 2/2011 dated February 8, 2011 issued
by the Ministry of Corporate Affairs under Section 212(8) of the Companies Act, 1956 (as applicable for the Financial Year 2013-14 vide
the General Circular No. 8/2014 dated April 4, 2014), the Consolidated Financial Statements have been prepared by the Company in
accordance with the applicable Accounting Standards issued by the ICAI. The Audited Consolidated Financial Statements together with
Auditors’ Report thereon forms a part of the Report.
Your directors thank the Government Authorities, Financial Institutions, Banks, Customers, Suppliers, Shareholders, Employees and
other business associates of the Company, who through their continued support and co-operation, have helped as the partner in your
company’s progress and achievement of its objectives.
For and on behalf of the Board
13
WELSPUN Corp Limited
Place: Mumbai
Date : August 7, 2014
B. K. Goenka
Chairman

14
WELSPUN Corp Limited
15,768
9996.33
13,552
9.58
4,904
440
8.97
18,862
681
3.61
16,200
434
2.68
987
295
29.86
(See Rule 2)
FORM FOR DISCLOSURE OF PARTICULARS WITH RESPECT TO CONSERVATION OF ENERGY2013-2014 2012-2013
A. POWER AND FUEL CONSUMPTION
1. ELECTRICITY
(A)
(B)
- -
2 COAL (Generation of Steam)
Purchased
Unit (In '000s) MWHTotal Amount (Rs. In Lacs)Rate/Unit (Rs)Own Generation
(I) Through D.G. Set (CPP)
Generated Unit (In '000s) MWH
Units Generated Per Unit Of Fuel
Cost/Unit (Rs)
(II) Through Steam Turbine / Generator
Generated Unit (In ’000) MWH
Total Amount (Rs. in Lacs)
Rate / Unit (Rs.)
Unit (In ’000) kg
Total Amount (Rs. in Lacs)
Rate / Unit (Rs./kg.)
OTHER – LIGNITE & LIME STONE (For Generation of Steam)
Unit (In ’000) kg
Total Amount (Rs. in Lacs )
Rate / Unit (Rs./kg.)
3 FURNACE OILQuantity (K. Ltrs.)
-
Total Amount (Rs. in Lacs)
-
Rate /Unit (Rs./ Ltr.)
-
4 OTHERS / INTERNAL GENERATION
a. Natural Gas
Quantity (SCM) (in ‘000)
Total Amount (Rs. in Lacs)
Rate / Unit (Rs. /SCM)
b. Liquid Petroleum Gas
Quantity (MT) (in ‘000) -
Total Amount (Rs. in Lacs) -
Rate / Unit (Rs. SCM/MT) -
B. CONSUMPTION PER UNIT OF PRODUCTION
PRODUCTS STANDARD 2013-2014 2012-2013
Name of Product - Welded PipesElectricity - (KWH) -
Name of Product – M.S. Pipes (ERW)
Electricity - (KWH) -
Name of Product – Power
FORM – A
Electricity-(KWH) -
Name of Product – M. S. Plates
Electricity-(KWH) -
Furnace Oil (K. Ltrs.) -
Natural Gas – (SCM/MT) -
-
-
-
47,1153,138
6.66
16,341
7.52
83,587
6,532
7.81
293,117
10,310
3.52
7,790
194
2.49
30,111
9,279
30.82
-
-
-
117.46
92
8.62
217.53
56.36
-
230.92
114.68
8.34
186.95
-
64.28
Name of Product – H. R. Coils
Electricity-(KWH) -
Furnace Oil (K. Ltrs
LPG (MT)
.) -
-
Natural Gas – (SCM/MT) -
158.57
56.36
-
-
150.79
-
-
63.73

15
WELSPUN Corp Limited
FORM B(See Rule 2)
FORM FOR DISCLOSURE OF PARTICULARS WITH RESPECT TO TECHNOLOGY ABSORPTION, RESEARCH AND DEVELOPMENT (R&D)
01 Anjar Pipe Mill:During the year, the Company carried out R&D activities anddemonstrated the sinter PP coating.
02
03
04 Expenditure on R&D
(a) Capital(b) Recurring
(c) Total
(d) Total R&D expenditure as a percentageof total turnovers.
Technology Absorption, Adaptation and Innovation
01 Efforts, in brief, made towards technologyabsorption, adaptation and innovation.
-
02 -
03 In case of imported technology (importedduring the last 5 years reckoned from thebeginning of the financial year), followinginformation may be furnished:a) Technology importedb) Year of importc) Has technology been fully absorbed?d) If not fully absorbed, areas where this has
not taken place, reasons therefore andfuture plans of action.
-
Specific areas in which R&D is carried out by
the Company
Benefits derived as a result of the above R&D.
Future plan of action
Benefits derived as a result of the above efforts,etc. Product improvement, cost reduction,product development, import substitution, etc.
Anjar Mill:PipeThe R&D activity resulted in the improvement in the quality ofcoating of pipes.
Foreign Exchange Earnings and Outgo
Activities relating to exports;
Anjar Pipe Mill:The Company has an ongoing program of carrying out research anddevelopment which helps the Company to improve productionprocesses and to innovate higher grade products.
Initiatives taken to increase exports;
Development of new export markets forproducts and services and export plans;
Total foreign exchange used and earned* Used : Rs. 26,110.43 Mn
Earned : Rs. 31,042.73 Mn
• New markets exploration with region wise teams to enteruntapped territories of Africa, Australia, South America, Vietnamand Myanmar.
• Participated in exhibitions with top level client meetings.• Explored Australia, Mozambique, Vietnam and few other South
American countries and planned to explore more countries.
• In line with the global business ambitions, strengthening themarketing team with induction of personnel with relevantexpertise and experience in the marketing.
• Marketing office has been set up in Dubai, UAE to tap that region.More representative offices planned in other regions like Mexico.
• Agents have been appointed for Australia and South America andare under process for other regions.
• Planned to devise strategy to enter new markets based on themarket updates from various publications and news sites.
Every concentrated effort had been made during the year todevelop and enter new territories and the untapped markets.Results have shown in the form of the new clientele added in thelist of our loyal customers, various new accreditations andapprovals received, a substantial enquiry base and volume ordersfrom new countries.
* Including foreign exchange earned and used by the wholly owned subsidiary of the Company in India viz. Welspun Tradings Limited.
Rs. 1.67 millionsRs. 1.67 millions0.005%
Nil

corporate governance reportI. PHILOSOPHY ON CORPORATE GOVERNANCE
II. BOARD OF DIRECTORS
The Board of Directors of the Company acts as a trustee and assumes fiduciary responsibility of protecting the interests
of the Company, its members and other stakeholders. The Board supports the broad principles of Corporate
Governance. In order to attain the highest-level good Corporate Governance practice, Board lays strong emphasis on
transparency, accountability and integrity.
The Company’s Board comprises of mix of Executive and Non-Executive Directors with considerable experience and
expertise across a range of fields such as finance and accounts, general management and business strategy. Except the
Chairman, the nominee appointed by EXIM Bank and nominee appointed by Insight Solutions Ltd., all other directors
are liable to retire by rotation as per the provisions of the Companies Act, 1956.
The composition and category of directors and relevant details relating to them are given below:
@ Chairmanship/membership of the Audit Committee and the Shareholders’ Grievance Committee alone considered
* Out of 11 meetings, 4 meetings attended by the Observer.
Abbreviations:
P = Promoter, I = Independent, NI = Non Independent, E = Executive Director, NE = Non-Executive Director, L = Lenders, C=Chairman, M=Member.
11 meetings of the Board of Directors were held during the financial year 2013-14 on the following dates: May 21, 2013, May 30, 2013 (two meetings), July 9,
2013, August 6, 2013, August 13, 2013, October 5, 2013, October 29, 2013, November 29, 2013, December 24, 2013 and January 27, 2014.
It is confirmed that there is no relationship between the directors inter-se.
E No - 5 - -(02) Mr. Braja Mishra - Managing Director
(03) Mr. Rajesh R.Mandawewala P, NE No 12 4 13 5M
NE, I No - -(07) Mr. Nirmal Gangwal
NE, NI, L No - -(08) Mr. Mukul Sarkar - Nominee EXIM Bank
NE, NI No 1 - 3M(09) Mr. Mintoo Bhandari Nominee of the Investor-
NE, NI No 4 - 1M(10) Mr. Utsav Baijal Nominee of the Investor#-
NE, I Yes 4 - 2C, 2M(04) Mr. K. H. Viswanathan 2
NE, I Yes 2 - 4C(05) Mr. Rajkumar Jain 3
NE, I Yes - - 3C, 2M(06) Mr. Ram Gopal Sharma 5
Name of the DirectorCategory Attendance
at the last
AGM
No. of other
Directorship
(as last declared
to the Company)
Member /Chairman in No.
of Board/Committees
including otherCompanies
(as lastdeclared to
theCompany)@
Pub. Pvt
OtherBodyCorporate
Board
Meetings
Attended
duringthe
Year
2013-14
P, NE No 15 2 6 1C, 8M(01) Mr. B. K. Goenka Chairman- 8
7
6
11
11
11
7
5
11*
4
1
-
2
1
3
-
16

III. AUDIT COMMITTEE
IV. NOMINATION AND REMUNERATION COMMITTEE
The Company has the Audit Committee. The terms of reference, composition etc. of which are as under:
The terms of reference stipulated by the Board of Directors to the Audit Committee are as contained under
clause 49 of the Listing Agreement and Section 292-A of the Companies Act, 1956.
The Committee comprises 4 non-executive directors having accounting and finance back-ground majority of them are independent.
The Chairman of the Committee is an independent director.
The composition of the Committee and attendance of the members is given hereunder:
a. Terms of reference:
b. Composition
* Appointed Observer to attend the remaining 18 meetings of the Committee.
The Company Secretary of the Company, Mr. Pradeep Joshi acts as the Secretary of the Committee.
21 meetings of the Audit Committee of the Board of Directors were held during the financial year 2013-14 on following dates: April 5,
2013, April 20, 2013, May 13, 2013, May 27, 2013, May 29, 2013, May 30, 2013 (two meetings), June 7, 2013, June 13, 2013, July 30,
2013, August 5, 2013, August 6, 2013, August 16, 2013, August 31, 2013, September 24, 2013, October 28, 2013, October 29, 2013,
December 30, 2013, January 20, 2014, January 27, 2014 and February 14, 2014.
The Company had constituted Remuneration Committee consisting of non-executive directors, majority of which are
independent directors. To comply with the section 178 of the Companies Act, 2013 the name of the committee was changed to
Nomination and Remuneration Committee and scope widened. During the year under review, no meeting of the Committee was
held. Terms of Reference, composition, remuneration paid to Executive and Non - Executive Directors are as under:
To recommend appointment of, and remuneration to, Managerial Personnel and review thereof from time to time.
The Committee comprises of 4 non-executive directors as on date of this Report viz. Mr. Rajkumar Jain, Mr. K. H. Viswanathan,
Mr. Ram Gopal Sharma and Mr. Mintoo Bhandari.
Particulars of pecuniary relationship or transactions of the Non-Executive directors vis-à-vis the Company and remuneration to the
Executive Directors including the details of remuneration and sitting fees paid/payable to the directors for the financial year 2013-14
are as under:
No remuneration or perquisite was paid to, and no service contract was entered into with, but the sitting fees were paid to, the
following directors/ nominating institutions for attending meetings of Board / Committees of the Board.
a. Terms of Reference
b. Composition of the Committee
c. Nomination and Remuneration Policy
Name of the Member Member/ Chairman Number of Meetings Attended
Chairman 21
Member 21
Member 21
Member 3*
Mr. Rajkumar Jain
Mr. K. H. Viswanathan
Mr. Ram Gopal Sharma
Mr. Mintoo Bhandari
Name of the Director Salary &
Allowance
Perquisites Commission Service
Contract/
Tenure
Notice
Period
Severance
Fees
Stock Option Sitting
Fees
1 Mr. Braja Mishra -
Managing Director
Rs. 39.57
million
Rs. 0.72
million
Nil Yes 1 month Nil Nil Nil
17
WELSPUN Corp Limited

711,000
681,000
696,000
162,000
90,000
214,000
72,000
18
WELSPUN Corp Limited
The above mentioned sitting fees paid to the Non-Executive Directors was within the limits prescribed under the Companies Act,
1956 for payment of sitting fees. Hence prior approval of the members as stipulated under Clause 49(I)(B) was not required.
None of the directors had any transaction with the Company. However, transactions have taken place with some of the companies in
which a director holds directorship. Those transactions took place at the prevailing market value as commercial transactions in
ordinary course of business and the same were disclosed to the Board.
The Nomination and Remuneration Policy is being revised in accordance with the section 178 of the Companies Act, 2013.
The Share Transfer and Investors’ Grievance Committee was constituted in accordance with the Clause 49 of the Listing Agreement
to look into transfer of securities and redress investors’ complaints and to review the functioning of the investors grievance
redressal system.
To comply with the provisions of the Section 178 of the Companies Act, 2013, the Board of Directors reconstituted and renamed the
Committee as Share Transfer, Investors’ Grievance and Stakeholders’ Relationship Committee.
The Chairman of the Committee is a Non-Executive Director. The composition of the Committee is given hereunder:
Compliance Officer: Mr. Pradeep Joshi – Company Secretary
Meetings of the Committee are scheduled to be held once in every fortnight or as and when required.
During the year under review, total 50 shareholders complaints were received. Break-up and number of complaints received under
different category is given hereunder:
1. Non Receipt of Share Certificate : 1
2. Non Receipt of Dividend : 40
3. Non receipt of Annual Report : 8
4. Others : 1
All the complaints/requests received during the year under report were resolved within the stipulated time to the satisfaction of the
investors/shareholders and no complaints were pending as on March 31, 2014 for more than 30 days. All the shares/debentures
received for transfer/transmission were transferred / transmitted and no transfer was pending as at March 31, 2014.
a. Composition
b. Number of Shareholders complaints / requests received during the year
V. SHARE TRANSFER AND INVESTORS’ GRIEVANCE COMMITTEE
Name of the Director Sitting Fees (Rs.)
1 Mr. K. H. Viswanathan
2 Mr. Rajkumar Jain
3 Mr. Ram Gopal Sharma
4 Mr. Nirmal Gangwal
5 Mr. Mukul Sarkar (Nominee of Exim Bank)
6 Mr. Mintoo Bhandari
7 Mr. Utsav Baijal
Name of the Member Member/ Chairman
Mr. K. H. Viswanathan
Mr. B. K. Goenka
Mr. Rajesh R. Mandawewala
Mr. Mintoo Bhandari
Chairman
Member
Member
Member

19
WELSPUN Corp Limited
VI. GENERAL BODY MEETINGS
VII. MANAGEMENT
VIII. DISCLOSURE
The details of Annual General Meetings held and the special resolutions passed in the last three years are given hereunder:
During the year under report, the resolution dated October 22, 2013 u/s. 78, 100-104 of the Companies Act, 1956, for reduction of
the securities premium account as mentioned in the Scheme of Arrangement (the Scheme”) i.e. upon the Scheme becoming
effective, the difference between the amount of assets and liabilities of the Demerged Undertaking (as defined under the Scheme)
being transferred to Welspun Enterprises Limited (the “Resulting Company” under the Scheme), shall be adjusted by reducing firstly
the securities premium account, secondly the Capital Reserve, thirdly the General Reserve and finally Profit & Loss Account, was
passed as a special resolution.
None of the special resolutions were proposed to be conducted through postal ballot.
Management Discussion and Analysis of various businesses of the Company is separately given in the Annual Report.
All details relating to financial and commercial transactions where the Senior Management as defined under Clause 49 of the Listing
Agreement with the Stock Exchanges may have a pecuniary interest are provided to the Board, and in case of directors, the
interested directors neither participate in the discussion, nor do they vote on such matters.
For related party transactions, refer Note No. 39 of Notes to Accounts annexed to the Balance Sheet and Profit & Loss Account.
There were no non-compliances by the Company and hence no penalties and strictures were imposed on the Company by the Stock
Exchange or SEBI or any authority on any matter related to capital market during last 3 years.
The Company has a Whistle Blower Policy and Vigil Mechanism for its directors and employees and no personnel have been denied
access to the Audit Committee.
a. Management Discussion and Analysis
b. Disclosures by the Senior Management to the Board
a. Related Party Transactions
b. Non-Compliance
c. Whistle Blower Policy and Vigil Mechanism
Meeting Day & Date of
the Meeting
Time Place Special Resolutions Passed
16th Annual
General Meeting
Thursday,
08.09.2011
10:00 am Welspun City, Village
Versamedi, Taluka
Anjar, Dist. Kutch,
Gujarat – 370 110
Friday,
14.09. 2012
11:00 am Same as above
10:45 am Same as above
17 Annual
General Meeting
th
18 Annual
General Meeting
th
u/s. 31 of the Companies Act, 1956 for
alteration of Articles of Association of
the Company to provide for meetings
and service of documents by
electronic mode and increase in
maximum number of directors from
11 to 12.
Tuesday,
24.09.2013
u/s. 198, 269, 309, 310 and Schedule
XIII of the Companies Act, 1956 for
appointment of, fixing remuneration
to Mr. Rajesh R. Mandawewala as the
Managing Director
u/s 309 and other applicable
provisions of the Companies Act,
1956 for payment of commission
@1% of the net profits of the
Company as computed under Section
198 read with 349-350 of the
Companies Act, 1956 for a period of 5
years starting from the financial year
2012-13 to Mr. B.K.Goenka, Non-
executive Chairman

20
WELSPUN Corp Limited
The Company is in compliance with the mandatory requirements mentioned under Clause 49(I) to 49(VII) of the Listing Agreement
to the extent applicable and in addition the Company adopted non-mandatory requirement mentioned at (2) – “Remuneration
Committee”, (4)- “Audit Qualifications”, and (7) – “Whistle Blower Policy” of Annexure I D to Clause 49 of the Listing Agreement with
the Stock Exchanges.
The Company has Code of Conduct for Board members and senior management personnel. A copy of the Code has been put on the
Company’s website for information of all the members of the Board and management personnel.
None of the Board members or senior management personnel has informed any non-compliance with the same.
A declaration signed by the Managing Director of the Company is given below:
“I hereby confirm that there was no non-compliance with the Code of Conduct of the Company by any of the Board member or the
senior management personnel.”
Sd/-
Managing Director
A certificate obtained from Chief Financial Officer on the Financial Statements of the Company in terms of Clause 49 of the Listing
Agreement was placed before the Board and was noted and taken on record by the Board.
A qualified practicing Company Secretary carried out the Reconciliation of Share Capital Audit on quarterly basis to reconcile the
share capital with National Securities Depository Services Limited (“NSDL”) and Central Depository Services Limited (“CDSL”) and
the total issued and listed capital. The audit confirms that the total issued / paid-up capital of the Company is in agreement with the
total number of shares in the physical form and in the demat form held with the Depository.
A brief resume including nature of his/her expertise in specific functional areas, names of companies in which the director is a
director or member of Committees of the Board and his shareholdings in the Company, forms part of the Notice of the Annual
General Meeting, attached to the Annual Report.
The Accounting Standards laid down by the Institute of Chartered Accountants of India and applicable to the Company were
followed by the Company in preparation of accounts of the Company.
The quarterly, half-yearly and yearly financial results of the Company are sent out to the Stock Exchanges immediately after they are
approved by the Board. The Company published its un-audited/audited financial results in Western Times (Gujarati editions), Free
Press (English Edition) and Free Press Journal (English edition).
These results are simultaneously posted on the website of the Company at www.welspuncorp.com. The official press release is also
available on the website of the Company.
The Board of the Company approved the Policy on Prevention, Prohibition and Redressal of Sexual Harassment of women at
workplace at its meeting held on January 27, 2014 and formed the Internal Complaints Committee for each locations of the
Company.
No case of sexual harassments was reported to the Internal Complaints Committee during the year under review.
d. Detail of compliance with mandatory requirement and adoption of the non-mandatory requirements of the Clause 49 of the
Listing Agreement
e. Code of Conduct
Braja Mishra
f. Certification by Chief Finance Officer
g. Reconciliation of Share Capital Audit
h. Brief resume of Directors being Appointed / Re-appointed
i. Accounting Standards
IX. MEANS OF COMMUNICATION
X. DISCLOSURE UNDER THE SEXUAL HARASSMENT OF WOMEN AT WORKPLACE (PREVENTION,
PROHIBITION AND REDRESSAL) ACT, 2013.

21
WELSPUN Corp Limited
XI. GENERAL SHAREHOLDER INFORMATIONshall be held on Thursday, September 25, 2014 at 10:00 a.m. at the Registered Office of the Company
at “Welspun City”, Village Versamedi, Taluka Anjar, Dist. Kutch, Gujarat - 370110.
is 1st April to 31st March.
Monday, June 23, 2014 to Wednesday, June 25, 2014 (both days inclusive).
September 29, 2014 or any date thereafter.
The Equity Shares of the Company are listed on National Stock Exchange of India Limited (NSE) and
Bombay Stock Exchange Limited, Mumbai (BSE), the Secured Redeemable Non-convertible Debentures are listed on Bombay
Stock Exchange Limited and the Foreign Currency Convertible Bonds and Global Depository Receipts are listed on the Singapore
Securities Trading Limited (SGX-ST)
Annual listing fees for the year 2014-15 have been paid to BSE, NSE and SGX-ST.
Bombay Stock Exchange Limited : 532144
National Stock Exchange of India Limited : WELCORP; Series: EQ
ISIN No. (For dematerialized shares) : INE 191B01025
1. Annual General Meeting
2. Financial Year of the Company
3. Date of Book Closure:
4. Dividend Payment Date:
5. Listing on Stock Exchanges:
Stock Code /Symbol, For Equity Shares
6. Stock Market price data, high and low price of equity shares on Bombay Stock Exchange Limited, Mumbai and the National
Stock Exchange of India Limited are as under:
7. Performance in comparison to broad-based indices i.e. BSE- Sensex and NSE- S&P Nifty is as under:
BSE NSE
Month High (Rs.) Low (Rs.) High (Rs.) Low (Rs.)
April-2013
May-2013
June-2013
July-2013
August-2013
September-2013
October-2013
November-2013
December-2013
January-2014
February-2014
March-2014
64.20
53.55
49.75
46.75
39.60
39.70
44.40
44.30
66.30
69.20
65.90
74.00
47.00
44.75
40.00
35.05
26.65
28.25
29.20
32.50
34.80
52.70
57.45
62.55
63.90
53.70
53.50
47.10
39.75
39.75
44.40
43.80
66.70
69.30
66.40
74.85
47.10
44.00
39.85
35.00
26.80
28.20
29.10
32.05
38.70
52.60
57.20
62.05
Month
April-2013
May-2013
June-2013
July-2013
August-2013
September-2013
October-2013
November-2013
December-2013
January-2014
February-2014
March-2014
BSE Index
(Sensex)
Closing price
of Share (Rs.)
NSE
(S&P Nifty)
Closing price
of Share (Rs.)
19,504.18
19,760.30
19,395.81
19,345.70
18,619.72
19,379.77
21,164.52
20,791.93
21,170.68
20,513.85
21,120.12
22,386.27
53.05
45.65
43.75
36.00
33.95
29.85
42.55
38.60
63.55
57.90
63.55
67.30
5,930.20
5,985.95
5,842.20
5,742.00
5,471.80
5,735.30
6,299.15
6,176.10
6,304.00
6,089.50
6,276.95
6,704.20
53.10
45.45
43.60
35.95
34.20
29.90
42.50
38.70
63.50
57.90
63.90
67.60

22
WELSPUN Corp Limited
8. Registrar and Transfer Agent:
M/s. Link Intime India Private Limited
(Formerly known as : Intime Spectrum Registry Limited)
9. Debentures and Debenture Trustee
BSE Scrip Code ISIN Nos.
Debenture Trustee:
10. Share / Debenture Transfer System:
11. Distribution of Shareholding:
12. Shareholding of the Directors of the Company as on March 31, 2014
The Company has appointed Registrar and Transfer Agent to handle the share /debenture
transfer work and to resolve the complaints of shareholders/ debenture holders. Name, address and telephone number of Registrar
and Transfer Agent is given hereunder:
Unit : Welspun Corp Limited
C-13, Pannalal Silk Mills Compound,
LBS Marg, Bhandup (West),
Mumbai – 400 078
Email - [email protected]
Tele. No.: +91-022-25946970
Fax No. : +91-22–25946969
The Secured Non-Convertible Debentures issued by the Company are listed on BSE with the following identification numbers:
946799 INE191B07071
946864 INE191B07089
948244 INE191B07097
948245 INE191B07105
948249 INE191B07113
948250 INE191B07121
948505 INE191B07139
IDBI Trusteeship Services Limited,
Asian Building, Ground Floor,
17, R. Kamani Marg, Ballard Estate,
Near Custom House, Mumbai-400 001.
Our Registrar and Transfer Agent registers shares sent for transfer in physical form within
15 days from the receipt of the documents, if the same are found in order. Shares under objection are returned within two weeks.
Shareholding Pattern as on March 31, 2014
None of the other Directors hold any shares or convertible securities in the Company.
Number of SharesNo. of
shareholders
Percentage of
Shareholders
No. of
Shares
Percentage of
Shares held
100.00 262,948,299 100.00Total
501-1,000
1,001 -2,000
2,001 -3,000
3,001 -4,000
4,001 -5,000
5,001 -10,000
10,001 and above
Upto – 500
Name of the Director No. of shares %
Mr. B. K. Goenka
Mr. Rajesh R. Mandawewala
Mr. Ram Gopal Sharma
140
200
2100
0.00
0.00
0.00
61,309 90.34 6,885,815 2.62
3,410 5.02 2,682,586 1.02
1,577 2.32 2,378,686 0.90
517 0.76 1,310,804 0.50
241 0.36 866,242 0.33
172 0.25 809,759 0.31
283 0.42 2,098,189 0.80
362 0.53 245,916,218 93.52
67,871
Mr. Nirmal Gangwal 3,27,004 0.12

23
WELSPUN Corp Limited
13. De-materialization of Shares and Liquidity:
14. Outstanding Employee Stock Options, Convertible Bonds and Compulsorily Convertible Debentures, conversion date and likely
impact on equity share capital is as under:
15. Disclosure of Shares held in suspense account under Clause 5A of the Listing Agreement.
16. Plant locations of the Company and its subsidiaries
17. Address for correspondence
As on March 31, 2014, 96.96% equity shares have been dematerialized and have
reasonable liquidity on Bombay Stock Exchange Limited and National Stock Exchange of India Limited.
There are 54,180 unclaimed Equity Shares lying in the suspense account. The voting rights of the unclaimed equity shares have been
freezed.
I) Pipe and Plate & Coil Plant - Village Versamedi, Tal-Anjar, Dist.-Kutch, Gujarat – 370110
ii) Pipe and Coating Plant - Village Jolva and Vadadla, Near Dahej, Tal: Vagra, Dist: Bharuch, Gujarat – 392130
iii) Pipe Plant - KIADB Industrial Area, Gejjalagere, Taluka Maddur, Dist. Mandya, Karnataka -571428
iv) Pipe Coating, Double Jointing Plant - 9301 Frazier Pike, Little Rock, Arkansas 72205 (Subsidiary’s plant in the US)
v) Pipe and Coating Plant - Industrial City-2, Dammam-31483, Kingdom of Saudi Arabia (Subsidiary’s plant).
The Company Secretary,
Welspun Corp Limited
5th Floor, Welspun House,
Kamala Mills Compound,
Senapati Bapat Marg, Lower Parel,
Mumbai - 400 013.
Tel: +91-22-66136000; +91-22-24908000, Fax: +91-22-24908020 /21
E-mail: [email protected]
Outstanding as on 31.03.2014 Impact on equity share capital
750 Foreign Currency Convertible Bonds of
US $ 100,000 each convertible in to 12,005,000
equity shares during 27.11.2009 -17.10.2014
Increase in equity capital by 12,005,000 equity
shares of Rs. 5/- each at a premium of Rs. 295
per share
24
WELSPUN Corp Limited
CERTIFICATE OF PRACTICING COMPANY SECRETARY ON CORPORATE GOVERNANCE REPORT
To the Members of
We have examined the compliance of conditions of Corporate Governance by Welspun Corp Limited, for the year ended on March
31, 2014, as stipulated in Clause 49 of the Listing Agreement of the said Company with stock exchange.
The compliance of conditions of Corporate Governance is the responsibility of the management. Our examination was limited to
procedures and implementation thereof, adopted by the Company for ensuring the compliance of the conditions of the Corporate
Governance. It is neither an audit nor an expression of opinion on the financial statements of the Company.
In our opinion and to the best of our information and according to the explanation given to us, we certify that the Company has
complied with the conditions of Corporate Governance as stipulated in the above-mentioned Listing Agreement.
We state that in respect of investor grievances received during the year ended March 31, 2014, the Registrars of the Company have
certified that as at March 31, 2014, there were no investor grievances remaining unattended/pending for more than 15 days.
We further state that such compliance is neither an assurance as to the future viability of the Company nor the efficiency or
effectiveness with which the management has conducted the affairs of the Company.
For Mansi Damania
Company Secretaries
Mansi Damania
Proprietor
Certificate of Practice No. 8120
Place: Mumbai
Date: August 7, 2014
Welspun Corp Limited

25
WELSPUN Corp Limited
Mr. Prasanta Mukherjee
Chief Technical Officer
Mr. B.K. Goenka
Chairman(Non-Executive)
Mr. Braja Mishra
Managing Director
Mr. S. Krishnan
Chief Financial
Officer
Mr. Akbar Umatiya
Vice President
Welspun Middle East
Mr. R.R. Mandawewala
Director
Mr. David J. Delie
President
Welspun Pipes Inc.
Mr. Akhil Jindal
*Director
Group Finance
& Strategy
key management team
Mr. Vipul Mathur
Director
BU Head
Middle East, Europe and Africa
*Mr. Godfrey John
Director
Chief Supply Chain Officer
*
Mr. Gaurang Desai
President
BU Head
India and APAC
*Not a member of the Board of Directors

management discussion and analysisThe Management Discussion and Analysis (MD&A) should be read in conjunction with the Audited Consolidated Financial
Statement of Welspun Corp Limited (Welspun” or “WCL” or “the Company”), and the notes thereto for the year ended March 31,
2014. This MD&A covers Welspun’s financial position and operations for the year ended March 31, 2014. Amounts are stated in
Indian Rupees unless otherwise indicated. Abbreviations and acronyms used in this MD&A are identified in the Glossary of
Terms in Welspun’s Annual Report of FY 2013-14. The numbers used in the analysis are on a consolidated basis, the
corresponding number for the previous year have been regrouped and reclassified wherever necessary.
This report contains forward-looking statements, which may be identified by their use of words like ‘plans’, ‘expects’, ‘will’,
‘anticipates’, ‘believes’, ‘intends’, ‘projects’, ‘estimates’ or other words of similar meaning. All statements that address
expectations or projections about the future, including but not limited to statements about the Company’s strategy for growth,
product development, market position, expenditures, and financial results, are forward-looking statements. Forward-looking
statements are based on certain assumptions and expectations of future events. The Company assumes no responsibility to
publicly amend, modify or revise any forward looking statements, on the basis of any subsequent developments, information or
events
Forward-Looking Statements
- B K Mishra,
Managing Director, Welspun Corp Limited
FY 2013-14 is marked as the year when
Welspun Corp reincarnates to its earlier form
as a prominent Line Pipe supplier in the
world. The demerger came to effect in
January 2014 with WCL’s focus shifting solely
to its Line Pipe business. Sailing through swift
in the current challenging business
environment, WCL has achieved 1 million
metric tonnes of production and sales
volumes for a second consecutive year. The
HFIW mill in the US has been successfully
commissioned and has subsequently
received the API certification. Despite its
initial foreseen hurdles, WCL is gradually
moving towards establishing a capable asset
to serve its esteemed customers. WCL aims to
further strengthen its foothold in the global
markets with emphasis on local presence in
key markets and nurturing customer
relationships – all done to deliver world class
quality and services.
28
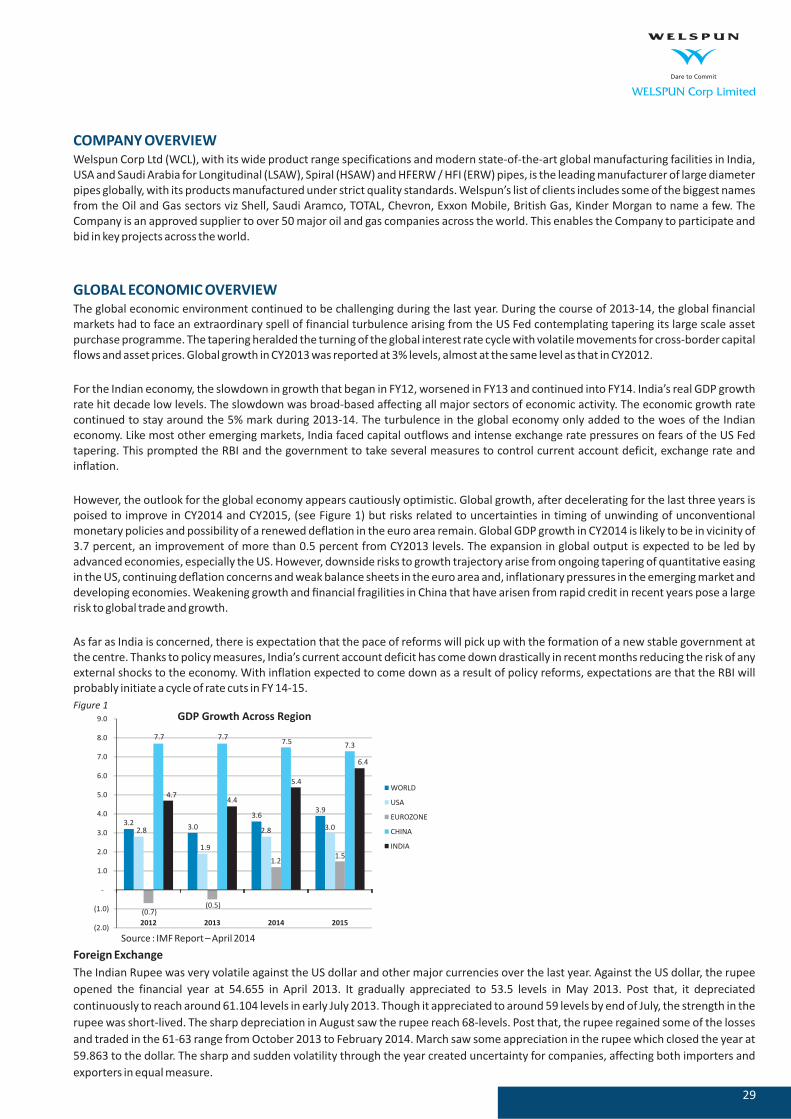
COMPANY OVERVIEW
GLOBAL ECONOMIC OVERVIEW
Welspun Corp Ltd (WCL), with its wide product range specifications and modern state-of-the-art global manufacturing facilities in India,
USA and Saudi Arabia for Longitudinal (LSAW), Spiral (HSAW) and HFERW / HFI (ERW) pipes, is the leading manufacturer of large diameter
pipes globally, with its products manufactured under strict quality standards. Welspun’s list of clients includes some of the biggest names
from the Oil and Gas sectors viz Shell, Saudi Aramco, TOTAL, Chevron, Exxon Mobile, British Gas, Kinder Morgan to name a few. The
Company is an approved supplier to over 50 major oil and gas companies across the world. This enables the Company to participate and
bid in key projects across the world.
The global economic environment continued to be challenging during the last year. During the course of 2013-14, the global financial
markets had to face an extraordinary spell of financial turbulence arising from the US Fed contemplating tapering its large scale asset
purchase programme. The tapering heralded the turning of the global interest rate cycle with volatile movements for cross-border capital
flows and asset prices. Global growth in CY2013 was reported at 3% levels, almost at the same level as that in CY2012.
For the Indian economy, the slowdown in growth that began in FY12, worsened in FY13 and continued into FY14. India’s real GDP growth
rate hit decade low levels. The slowdown was broad-based affecting all major sectors of economic activity. The economic growth rate
continued to stay around the 5% mark during 2013-14. The turbulence in the global economy only added to the woes of the Indian
economy. Like most other emerging markets, India faced capital outflows and intense exchange rate pressures on fears of the US Fed
tapering. This prompted the RBI and the government to take several measures to control current account deficit, exchange nd
inflation.
However, the outlook for the global economy appears cautiously optimistic. Global growth, after decelerating for the last three years is
poised to improve in CY2014 and CY2015, (see Figure 1) but risks related to uncertainties in timing of unwinding of unconventional
monetary policies and possibility of a renewed deflation in the euro area remain. Global GDP growth in CY2014 is likely to be in vicinity of
3.7 percent, an improvement of more than 0.5 percent from CY2013 levels. The expansion in global output is expected to be led by
advanced economies, especially the US. However, downside risks to growth trajectory arise from ongoing tapering of quantitative easing
in the US, continuing deflation concerns and weak balance sheets in the euro area and, inflationary pressures in the emerging market and
developing economies. Weakening growth and financial fragilities in China that have arisen from rapid credit in recent years pose a large
risk to global trade and growth.
As far as India is concerned, there is expectation that the pace of reforms will pick up with the formation of a new stable government at
the centre. Thanks to policy measures, India’s current account deficit has come down drastically in recent months reducing the risk of any
external shocks to the economy. With inflation expected to come down as a result of policy reforms, expectations are that the RBI will
probably initiate a cycle of rate cuts in FY 14-15.
rate a
The Indian Rupee was very volatile against the US dollar and other major currencies over the last year. Against the US dollar, the rupee
opened the financial year at 54.655 in April 2013. It gradually appreciated to 53.5 levels in May 2013. Post that, it depreciated
continuously to reach around 61.104 levels in early July 2013. Though it appreciated to around 59 levels by end of July, the strength in the
rupee was short-lived. The sharp depreciation in August saw the rupee reach 68-levels. Post that, the rupee regained some of the losses
and traded in the 61-63 range from October 2013 to February 2014. March saw some appreciation in the rupee which closed the year at
59.863 to the dollar. The sharp and sudden volatility through the year created uncertainty for companies, affecting both importers and
exporters in equal measure.
Source : IMF Report – April 2014
Foreign Exchange
29
WELSPUN Corp Limited
(0.7)(0.5)
1.21.5
7.7
4.7
7.77.5
7.3
(2.0)
(1.0)
-
1.0
2.0
3.0
4.0
5.0
6.0
7.0
8.0
9.0
2012 2013 2014 2015
GDP Growth Across Region
WORLD
USA
EUROZONE
CHINA
INDIA
Figure 1
4.4
5.4
3.22.8 3.0
3.63.9
6.4
1.9
2.8 3.0

30
WELSPUN Corp Limited
Figure 2 shows the price fluctuations during the year.
Figure 2
Source : http://www.oanda.com/currency/historical-rates/
Source : BP Energy Outlook 2035, January 2014 Presentation.
GLOBAL ENERGY DEMAND
The world is still recovering from the effects of the 2008-2009 global recessions. As these effects continue to be felt, many unresolved
economic issues add to the uncertainty associated with world energy demand estimates. Currently, there is wide variation in the
economic performance of different countries and regions around the world. Among the more mature OECD regions, the pace of growth
varies but generally is slow in comparison with the emerging economies of the non-OECD regions.
Global energy demand is expected to increase by over one‐third in the period to 2035. Emerging economies are expected to be at the
forefront to drive global energy markets with the share of non‐OECD energy demand rising from 55% in 2010 to 65% in 2035. China would
account for the largest share of the growth in global energy use, with its demand rising 60% by 2035, followed by India (where demand is
expected to more than double) and the Middle East. OECD energy demand in 2035 is predicted to be just 3% higher than in 2010.
The rising supply to meet demand growth will come primarily from non-OPEC unconventional sources. By 2035, non-OPEC supply is
expected to have increased by 10.8 Mb/d while OPEC production will have expanded by 7.4 Mb/d. The largest increments of non-OPEC
supply will come from the countries like US (3.6 Mb/d), Canada (3.4 Mb/d), and Brazil (2.4 Mb/d), which offset declines in mature
provinces such as the North Sea. OPEC supply growth will come primarily from Natural Gas Liquids (3.1 Mb/d) and crude oil in Iraq (2.6
Mb/d).
Fossil fuels are expected to continue supplying much of the energy used worldwide. Although liquid fuels—mostly petroleum-
based—remain the largest source of energy, the liquids share of world marketed energy consumption is expected to fall from 34 percent
in 2010 to 28 percent in 2040, as projected high world oil prices lead many energy users to switch away from liquid fuels when feasible.
The fastest growing sources of world energy are expected to be renewables and nuclear power. The renewables share of total energy use
rises from 11 percent in 2010 to 15 percent in 2040, and the nuclear share grows from 5 percent to 7 percent.
Demand by RegionFigure 3
54.879
53.2195
55.331
53.4114
61.104
59.135
67.9842
63.842563.0135
59.863
45
47
49
51
53
55
57
59
61
63
65
67
69
USD / INR
1-Apr-13 1-May-13 1-Jun-13 1-Jul-13 1-Aug-13 1-Sept-13 1-Oct-13 1-Nov-13 1-Dec-13 1-Jan-14 1-Feb-14 1-Mar-141-Mar-131-Feb-131-Jan-13

31
GLOBAL OIL SCENARIO
GLOBAL GAS SCENARIO
Global oil consumption is projected to reach 108.5 Mb/d by 2035 but growth continues to slow (from 1.3% p.a. in 2000-12 to 0.6% for
2025-35). OECD consumption is projected to fall to 40.4 Mb/d in 2035, the lowest since 1985. US demand falls 2.7 Mb/d to 15.8 Mb/d
from 2010 to 2035. Non-OECD consumption will reach 68.1 Mb/d by 2035 with demand in China growing by 8 Mb/d to 17.5 Mb/d in 2035,
surpassing the US in 2029. India and the Middle East are the next largest contributors. Although China provides the largest increment to
liquids demand over the outlook period, its growth volumes slow relative to those observed over the last 10 years. During 2030-35,
Chinese demand rises by only 1.5 Mb/d (versus 2.3 Mb/d for 2005-10) making India the largest contributor to demand growth (1.7 Mb/d
for 2030-35).
The outlook for long-term oil demand is presented in Table below.
The global outlook for gas appears to be bright over the coming decades, as demand increases by 50% to 169 trillion cubic feet in 2035.
New sources of gas, both conventional and unconventional, are expected to bring greater diversity to global supply. Changes in key
suppliers of LNG will result in creation of new linkages between regional gas markets, notably between those of North America and the
Asia-Pacific, narrowing, to a degree, the wide regional gas price differentials that exist today.
Natural gas is the world’s fastest-growing fossil fuel, with consumption expected to increase from 113 trillion cubic feet in 2010 to 169
trillion cubic feet in 2035 and 185 trillion cubic feet in 2040. Growth in consumption occurs in every region and is most concentrated in
non-OECD countries, where demand increases more than twice as fast as in OECD countries. Non-OECD producers account for more than
70 percent of the total growth in world natural gas production from 2010 to 2040.
Growth in natural gas consumption is particularly strong in non-OECD countries, where economic growth leads to increased demand
over the projection period. Consumption in non-OECD countries grows by an average of 2.2 percent per year through 2040, more than
twice as fast as the 1.0-percent annual growth rate for natural gas demand in the OECD countries. As a result, non-OECD countries
account for 72 percent of the total world increment in natural gas consumption, as the non-OECD share of world natural gas use increases
from 51 percent in 2010 to 59 percent in 2040.
Liquefied natural gas (LNG) accounts for a growing share of world natural gas trade. World LNG trade more than doubles, from about 10
trillion cubic feet in 2010 to around 20 trillion cubic feet in 2040. Most of the increase in liquefaction capacity occurs in Australia and
North America, where a multitude of new liquefaction projects are planned or under construction, many of which will become
operational within the next decade. At the same time, existing facilities in North Africa and Southeast Asia have been underutilized or are
shutting down because of production declines at many of the older fields associated with the liquefaction facilities, and because
domestic natural gas consumption is more highly valued than exports.
Natural Gas
World Oil Demand Outlook, 2012 – 2035 (mb/d)
Source : OPEC - World Oil Outlook 2013 Report, Page 81
WELSPUN Corp Limited
OECD America
OECD Europe
OECD Asia Oceania
OECD
Latin America
Middle East & Africa
India
China
Other Asia
OPEC
Developing Countries
Russia
Other Eurasia
Eurasia
World
2012
23.7
13.8
8.5
46.0
5.2
3.4
3.7
9.7
7.2
8.7
37.8
3.4
1.6
5.0
88.9
2015
23.9
13.1
8.3
45.2
5.7
3.5
4.0
10.8
7.6
9.5
41.1
3.5
1.7
5.3
91.6
2020
23.7
12.5
8.0
44.2
6.2
3.9
5.0
12.7
8.6
10.2
46.6
3.7
1.9
5.5
96.3
2025
23.2
12.1
7.8
43.1
6.5
4.4
6.2
14.4
9.5
10.8
51.8
3.7
2.0
5.7
100.7
2030
22.6
11.7
7.4
41.8
6.9
4.8
7.6
16.0
10.3
11.4
57.0
3.7
2.1
5.8
104.6
2035
21.9
11.4
7.1
40.4
7.2
5.3
9.3
17.5
11.0
11.9
62.1
3.8
2.2
6.0
108.5
Figure 4

WELSPUN Corp Limited
32
Source : International Energy Outlook 2013
Source : EIA, Annual Energy Outlook 2014 Early Release
Source : U.S. Energy Information Administration | International Energy Outlook 2013
Shale Gas
Unconventional sources such as Shale Gas are an important source of oil and natural gas not only in the United States but also in other
parts of the world like Canada, Europe, Asia and Australia.
In the United States, one of the key reasons for increasing natural gas production has been advances in the application of horizontal
drilling and hydraulic fracturing technologies, which have made it possible to develop the country’s vast shale gas resources and have
contributed to a near doubling of estimates for total U.S. technically recoverable natural gas resources over the past decade.
EIA’s own assessment of resources indicates technically recoverable resources of 335 billion barrels of world shale oil resources and 7,795
trillion cubic feet of world shale gas resources. As per the study US Energy Information Administration (IEO 2013), shale gas accounts for
50 percent of U.S. natural gas production in 2040. Tight gas, shale gas, and coalbed methane resources in Canada and China account for
more than 80 percent of total production in these countries by 2040.
World Natural Gas Consumption, 2010-2040 (Trillion Cubic Feet)
2010 2015 2020 2025 2030 2035 2040
100
75
50
25
0
40
30
20
10
02010 2040 2010 2040 2010 2040
Natural Gas Production in China, Canada, and the United States,2010 and 2040 (trillion cubic feet)
Shale Gas Leads US Production Growth
US Dry Natural Gas Production
1995 2000 2005 2010 2015 2020 2025 2030 2035 20401990
40
35
30
25
20
15
10
5
0
100
90
80
70
60
50
40
30
20
10
0
Non-associated OnshoreTight Gas
Shale Gas
Non-associated Offshore
Associated with OilAlaska
Coalbed Methane
2012 ProjectionsHistory
Trillion Cubic Feet Billion Cubic Feet Per Day
Figure 5
Figure 6
Figure 7

33
WELSPUN Corp Limited
In India, although the potential of shale oil and
gas has been recognized to some extent, no
credible estimates of the actual reserves are
available. EIA, USA in April 2011 estimated a
Gas-In-Place concentration of 1170 TCF in 4
basins namely Cambay, Krishna-Godavari,
Cauvery and Damodar. As such the prospective
area for shale gas and oil in these basins are
thick, considerable uncertainty exists on the
extents of these basins. Taking into account
various projections by different agencies, the
resource potential in India varies upto 2,100
TCF of shale gas with potential also for shale oil.
There have been field experiments for
evaluating the shale gas potential in the
Gondwana basin and the initial results have
been encouraging. It is estimated that India
possesses shale deposits across Gujarat,
Jharkhand, West Bengal, Andhra Pradesh, Tamil
Nadu, Assam, Rajasthan and a few other areas.
Studies are in progress in DGH to fine tune the
resource assessment of shale gas and shale oil
in the country.
Source : U.S. Energy Information Administration | Technically Recoverable Shale Oil and Shale Gas Resources
Source : Petronet LNG
Gas Scenario – India
India is the 4th largest consumer of energy in the world after USA, China and Russia accounting for around 4.6% of world energy
consumption. The total energy requirement is projected to grow at 6.5% per year between 2012-13 and 2016-17.
Share of Natural Gas in Indian Energy basket is set to increase from 10% to 20% by 2025. Despite the increase in domestic gas production,
dependency on imported gas is expected to increase substantially. LNG, which currently constitutes 30% of the natural gas consumption
in the country, is expected to have a share of more than 50% by 2025.
Technically Recoverable
Shale Gas Resources (TCF)
Technically Recoverable
Shale Oil Resources
(Billion Barrels)
1. US
2. China
3. Argentina
4. Algeria
5. Canada
6. Mexico
7. Australia
8. South Africa
9. Russia
10. Brazil
11. Others
TOTAL
1,161
1,115
802
707
573
545
437
390
285
245
1,535
7,795
1. Russia
2. US
3. China
4. Argentina
5. Libya
6. Australia
7. Venezuela
8. Mexico
9. Pakistan
10. Canada
11. Others
TOTAL
75
48
32
27
26
18
13
13
9
9
65
335
Assessed World Shale Gas and Shale Oil Resources (42 Countries, including US)
INDIA'S GAS INFRASTRUCTUREExisting P/L Network : 11,900 KMS (283 mmscmd)Proposed additional P/L Network: 14,000 KMS(540 mmscmd) by 2016-17
Figure 8
Figure 9

WELSPUN Corp Limited
34
GLOBAL STEEL PIPE INDUSTRY
DOMESTIC PIPE DEMAND
World’s transmission pipeline network for crude oil, natural gas and others have grown significantly in the last 20 years. The length of all
transmission pipelines has increased by 67% over this period (a CAGR of 2.5%). Natural gas pipelines have increased 80% (a CAGR of 3%);
crude oil pipelines 63% (a CAGR of 2.5%) and other pipelines by 35% (a CAGR of 1.5%). (Source : MBR report 2013)
In total, almost 2.2 million kilometers of transmission linepipe is present worldwide, half of which is in two countries - USA and Russia. A
further 8 countries (Canada, China, Ukraine, Argentina, UK, Iran, Mexico, and India) take the cumulative total to 70% of the world network
by length. (Source MBR study 2013 report).
Large Diameter Steel pipes market, though encountering overcapacity conditions at present, is expected to witness steady growth in the
upcoming years driven by the implementation of new pipeline projects. The global pipeline demand as per Simdex for the projects
starting from 2014 to 2019 is about 716 projects resulting in an opportunity for supplies of more than US$ 403 billion across geographies
as presented in the table below:
Several large projects are in an advanced stage, which should convert to orders over the next couple of years.
As per MBR study 2013, over 38% of the World’s transmission pipeline network is less than 20 years old, a further 25% is between 20 and
40 years old and 37% is over 40 years old. In the USA, federal data indicates that over half the transmission pipe network for Oil and gas is
over 50 years old, with an estimated 80,000 kms of transmission pipelines built before 1970 suffering from faulty welds and posing a
major safety risk.
Although there have been discussions on replacing these pipelines, there has been no concrete action from the governments or the
pipeline operators. This demand, if it materialises, would provide significant growth opportunity for pipeline manufacturers around the
world, for many years.
India, at present has a network of about ~13,000 km of natural gas transmission pipelines with a capacity of around 337 MMSCMD. This
pipeline network is expected to expand to around 28,000 Kms with a total capacity of around 721 MMSCMD in next 5-6 years. This
includes most of the National Gas Grid that would connect all major demand and supply centre in India. The planned additions to the
natural gas infrastructure in India during the projected period has been provided in Figure 11 :
The Replacement Demand – the potential upside
Source : Simdex data as on January 2014.
231 55 65
53 35 55
119 33 60
87 30 39
105 31 52
67 48 93
54 21 39
716 253 403
Geographical
Zone
Number Total Length in
KmsBusiness value
of projects
(km in '000) (billon USD)
North America
Latin America
Europe
Africa
Middle East
Asia
Australasia
TOTAL
306
416
60
33
815
PipelinesDesign Capacity
(mmscmd)Length (Kms)
Existing till 2012
Expected addition in the 12th plan
Expected addition in the 13th plan
Capacity addition MBBVPL/MBPL/Surat
Paradip/pipelines beyond 13th plan & till 2030
12,144
15,928
3,360
1,295
32,727
Summary of Planned Addition to Pipeline Infrastructure
TOTAL
Figure 10
Figure 11
Source : MoPNG

35
WELSPUN Corp Limited
The capacity of pipeline network in India is planned to reach 815 MMSCMD in 2029-30. However, considering the addition of capacity
directly linked to the existing/planned sources of natural gas in the country, the gas grid capacity in India (pipeline emanating from
source) is expected to reach 582 MMSCMD in 2029-30 from the present 274 MMSCMD. This capacity is expected to take care of the
natural gas supply scenario in the projected period. In addition to the trunk lines, regional gas pipelines similar to the intra-state network
of Gujarat, are recommended for highly industrialized states. It is expected that going forward the Southern and Northern part of India
would catch-up with the Western part in terms of pipeline infrastructure while Eastern and North Eastern part of the country would lag
behind and would require policy boost for industrial development to attract more investments. The total demand from City Gas
Distribution (CGD) sector is expected to grow from 15.3 MMSCMD in 2012-13 to 85.6 MMSCMD in 2029-30 at a CAGR of 10.7%.(Source :
Report – Vision 2030 Natural Gas infrastructure in India, May 2013 for PNGRB)
The water sector provides an additional opportunity for the pipes sector, especially HSAW pipes. The water resource potential in India is
186.9 million ha mtrs, mostly from rainfall. Though the annual availability of water is more than utilization, there is a rising demand to
fully utilize this potential. Recognizing the criticality, the Centre in its 12th Five Year Plan, has indicated gross budgetary support for
development of water resources to Rs. 1,096 bn as against Rs. 414 bn allocated in the 11th Plan.
Under the Jawaharlal Nehru National Urban Renewal Mission (JNNURM), 65 cities in Indian covered under the Urban Infrastructure and
Governance (UIG) component of the Mission have prepared comprehensive City Development Plans which include investment plans
with a focus on providing citywide urban services, such as water supply, sanitation, drainage, urban transport etc. A total of 650 projects,
at an approved cost of Rs. 748 bn for the 65 mission cities spread over 31 states / UTs have been sanctioned. Of the 650 projects, 391 were
water supply and sanitation projects (including sewerage and solid waste management).
The Company has achieved all time high sales and production volume of over 1 mn ton in FY14 attributable to the high quality standards
and excellent track record, despite the continued challenging market conditions. The Company achieved the 1 million tonne production
and sales mark for the second time in a row, a remarkable feat in the pipe industry.
The order book stands at Rs.58 billion (~US$ 950 million), 900 K MT in pipes as on 1st April 2014. This is the highest year-end closing order
book in the history of the Company.
80% of pipe orders are from export markets like North America, Middle East, Europe, North Africa and South East Asia. In spite of the
difficult market situation, the Company has booked new orders of more than 1.2 million MT during the financial year, with strong order
intake from Middle East and India. This demonstrates the Company’s leadership position and customer preference for its products.
The US HFIW mill of 175K MT has been commissioned in April 2013. The mill will cater mainly towards the demand in the US, arising out of
the shale gas finds in the region.
The Company has completed the capacity expansion of 50K MTPA in Mandya last year that took the total capacity of the plant to 150K
MTPA. The facility has received the API certification during FY14 and has been supplying pipes in India to cater to the water pipeline
demand.
During the year the Company has received one of its largest order from its prestigious client Saudi Aramco of more than 400 KMT. Saudi
Aramco is one of the oil and gas giants in the Middle East and had approved the Company’s Dammam Pipe Facility last year. The order,
which will be executed over FY15, provides strong visibility to the Company’s Saudi plant.
The Company’s total global pipe capacity has reached 2.425 million MTPA. The Company’s LSAW line pipe capacity stands 0.70 million
MTPA, catering to the growing market of the deep offshore projects across the globe. Its HSAW line pipe capacity today stands at 1.35
million MTPA.
Water Pipeline Demand in India
Highest Sales, Production Volume
Strong order book position at Rs. 58 billion (900 K MT); Over 1 mn tonnes of Orders Booked during the year
US HFIW Commissioned
Mandya Plant received the API certification
Saudi Plant receives major order from one of its large O&G customers
Amongst the leader in line pipe capacity
WELSPUN’S FY14 HIGHLIGHTS

WELSPUN Corp Limited
36
STRENGTHS
- Strong brand in global large diameter pipe market
Proximity to Customers
Global accreditations
State of the art technology across all the locations
Excellent execution track record, including for the
most difficult projects.
-
-
-
-
WEAKNESS
- Capacity utilisation of plate mill low
- Capacity utilisation of domestic HSAW
mills low
OPPORTUNITIES
- Strong project pipeline in Canada and Middle East
- New markets of North Africa, South America and
South East Asia
Replacement market potential
Discovery of abundant shale gas reserves leading to
demand rise for the ERW pipes.
-
-
THREATS
-
-
-
-
-
Tough macro environment
Challenging world O&G market scenario
Raw Material volatility
High competition resulting in erosion of margins
Volatile foreign exchange rates
Products Anjar, India Dahej, India Mandya, India Dammam, SA Little Rock, US Total Capacity
LSAW 350 350 700
HSAW 500 50 150 300 350 1,350
ERW 200 175 375
Current Pipe Capacity 1,050 400 150 300 525 2,425
Plate & Coil 1,500 1,500
Figure 12
The current global capacity distribution of the Company i
The Company today serves clients in more than 30 countries globally with its presence in India, US and Saudi Arabia through its
manufacturing facilities and marketing offices in Dubai and Houston. This gives an advantage to the Company of being close to the
customers and provide them end-to-end pipe solutions.
During FY13 and FY14, the Company has successfully bought back its FCCB worth USD 75 mn out of USD 150 mn. The buyback was done at
an average discount of 6.5% on the accreted value of the bonds. The FCCB outstanding is USD 75 million, which is due in October 2014.
During the year, the Company has successfully demerged its non-Pipes and Plates Business into a separate Company “Welspun
Enterprises Limited”. Through the de-merger, the DRI/Steel, Infrastructure, Oil & Gas exploration and Energy businesses which were
earlier under the Company’s umbrella, were transferred to Welspun Enterprises Ltd. The “Scheme of Arrangement” for the demerger
was sanctioned by the Hon’ble High Court of Gujarat vide its order dated 10th January 2014 and came into effect on 24th January 2014
with appointed date of 01st April 2012.
Expanded Global Reach
Buyback of FCCB’s of USD 75 million out of total of USD 150 mn
Demerger to create renewed business focus and enhance shareholder value creation
s shown in Fig. 12 below:
SWOT ANALYSIS
(In '000 tonnes)

37
WELSPUN Corp Limited
Competitive Strengths
Risks and Concerns
• Economic Risks:
• Interest Rate Risks:
• Legal Risks Related To Tax Structure :
• Volatile Crude Oil And Gas Prices:
• Competition:
• Currency Risks:
The main competitive strengths of the Company include:
• Ability to develop, design and manufacture technologically advanced products;
• Diversified customer base and strong relationships with major international oil and gas companies around the world,
• Proximity to customers;
• Human resources around the world with their diverse knowledge and skills;
• State-of-the-art, strategically located production facilities with favorable access to raw materials, energy and labor
• Strong order book
The Company will strive to leverage its strengths to consolidate its position as a leader in global pipes.
The outlook for the pipe business continues to be challenging in the near term but there are signs of a revival in the medium term.
Outlook for the North American market appears challenging in FY15, but the market is already showing signs of bouncing back. North
America is planning several LNG terminals to export LNG to South East Asia and Europe and also develop internal infrastructure to
leverage the vast production of Natural Gas liquids and Shale liquids, which should translate into pipeline demand in a couple of years.
Europe promises to be a large potential market going forward as it looks to diversify its gas sources with projects like TANAP to source gas
from CIS and Africa. Middle East will continue to remain strong with demand from Saudi Arabia, UAE and even Iraq, a country which is
steadily coming up on the path of recovery and stability.
In the Asia-Pacific region, potential demand from Thailand, Malaysia, Vietnam, Myanmar and Indonesia could boost the regional
demand. As far as India is concerned, FY15 should present opportunities in the water pipeline segment. The domestic oil and gas pipeline
market would be under close watch with large cross country gas pipelines planned for FY16.
The key risks for the Company are:
The macroeconomic outlook continues to be challenging in India as well as in the other key markets where the
Company operates. Economic slowdown may effect the order book position of the Company in the interim period affecting
the capacity utilization, sales and profitability of the Company. The Company has commenced the year with a strong order book
position and is capable of withstanding this risk based on its past records.
Interest expenses are part of the finance costs, therefore any major upward fluctuations in the Interest
rates leads to increase in the cost of debt of the Company. The interest rate risks are mitigated to an extent through fixed interest
rates on the non convertible debentures.
The Company is liable to pay tax on profits, sales tax, excise duty, service tax etc. Any
changes in tax legislation could lead to an increase in tax payments and, as a result, to a lowering of financial results.
Volatility in the price of crude oil/gas creates uncertainty for oil & gas producers regarding the
viability of new exploration. This in turn could create uncertain future demand for line pipes in the oil & gas segment.
Increased competition in all the segments from other players may have an impact on the business and
profitability. While the potential demand for new oil and gas pipelines remains high in most of the Company’s markets, there
has been considerable delays in decisions in many projects on account of factors such as policy uncertainty, environmental
concerns etc. This has led to fewer than expected projects coming to the market, resulting in high level of competition. The
Company has a strong order book and hence the Company’s focus will be on profitability rather than winning orders at any cost.
The Company’s exposures are largely denominated in US Dollars. The rupee exchange rate against the major
currencies such as the US dollar has been very volatile. Though the Company has implemented a well-defined hedging policy,
foreign exchange fluctuations could affect reported results.
OUTLOOK
WELSPUN Corp Limited
HUMAN RESOURCES POLICY – FY 14
KEY HIGHLIGHTS
Welspun Corp Ltd (WCL) over the past year and half had been working closely with Hay Group globally, to realign their internal
organization in order to sustain and support their planned growth. Towards this direction, it has built an organization, which with a more
structured and systematic way of working will also empower each employee to execute their responsibilities more effectively.
The newly developed organization, that will take WCL closer to its customers, and enable more efficient and effective service, is where
WCL is divided into three business units would be responsible for servicing the customers and would be supported by five global support
organizations.
All functions have a critical role to play in sustaining the newly developed organization that drives for achieving excellence in all endeavors
in making Welspun Corp Limited a world class organization. In past one year, the HR team at Welspun has also re-organized itself into
primarily a decentralized structure, with clearly defined Corporate and Unit level roles and responsibilities. The Business HR team, major
focus of the function in this year was to bring synergy within the HR team (across geographies and Units) and uniformity/alignment in
process / policies of the business to those of the group.
The key initiatives taken in HR during the past few months are as listed below:-
To bring uniformity in the HR processes, Group HR Manual comprising of standardized group level policies and
procedures with a flavor of location level policies has been stabilized. The HR policy manual for the newly set up office in Dubai was also
rolled out in early 2014. A big initiative in this direction, of standardization of HR has been the introduction of SAP HR module as an HRMS
tool. This enables /empowers employees and their managers to take decision based on real time data. The application is web-enabled
which allows employees to access the system even during business trip or outside office in the near future.
To make the Talent Identification process well calibrated and evaluate the existing talent of the organization in a
defined scientific manner, WCL undertook the exercise of designing a Skill Directory (defining of functional and behavioral skills along
with required competencies) for all the unique roles in the Business. Through this exercise around 562 roles (across Indian locations) got
covered and a skill map for each was defined. The next phase was skill Assessment of existing role incumbents of the unique roles.
Various tools like 360 degree feedback are being used for completing this. And finally in the last phase Development Plan will be drawn up
for each incumbent basis the gaps identified in their current proficiencies v/s the desired ones.
Goal setting exercise, Mid Term review and Year End Review for all eligible members, were the key
activities undertaken last year. Sessions on PMS process were organized at respective locations to make employees and their Managers
understand the nitty-gritties of the PMS process & also align the individual goals with the Business objectives. Integration of the PMS
process to the SAP tool is currently undergoing.
Specific leadership development initiatives have been designed and deployed for the middle and senior
management teams of WCL to build specific leadership capabilities. Long term programs (for 4 to 6 months) like Achieving Personal
Excellence and Leading with English and Posture, were conducted to enable identified leaders and client facing managers sharpen their
business etiquettes and English communication.
The employee engagement committee TABLET was active during the year. Sub-committees like Fun Tab, Whiz
tab, Sport Tab and E – Tab ensured that periodic events happened. Celebrations of key festivals and events practice sessions for Sports
Tournament, nominations in Mumbai Marathon and monthly newsletters were the key activities of Tablet. In the Units family days and
other engagement activities have also been very well received.
Different Individual & Group communication forums were active during the year. At the individual level, stay
interviews were being conducted as a ‘health check’ of the Organization and ascertain the level of motivation and engagement in the
employee. At the Group level, communication forums like Monthly Departmental Meeting (MDM) and Town hall were started to share
business updates with employees and to address any of their concerns.
HR Policies and Practices:
Talent Management:
Performance Management System:
Leadership Development:
Employee Engagement:
Employee Communication:
38

39
WELSPUN Corp Limited
INTERNAL CONTROL AND ADEQUACYManagement of the Company maintains adequate internal control system which is designed to provide reasonable assurance that assets
are safeguarded and transactions are rightly executed and recorded in accordance with management authorization and accounting
policies.
All the records are adequately maintained for preparation of financial statements and other financial information. Apart from internal
controls, the Company also audits the efficiency and security of its operations, its information technologies and data, in accordance with
the global standards. The Audit Committee of the Company met twenty one times in FY 14 to review internal audit reports as well as the
internal control systems and financial disclosures.

WELSPUN Corp Limited
40
DISCUSSION OF FINANCIAL ANALYSIS
1. REVENUE
This discussion on Financial Analysis is for consolidated financials of the Company. The Company, together with its subsidiaries, is
engaged in the business of production and coating of High Grade Submerged Arc Welded Pipes, Hot Rolled steel plates and coils. During
2013-14 pursuant to scheme of arrangement, the infrastructure business (including energy, water and road), the Direct Reduced Iron
(DRI) business, Oil and Gas and EPC contracting business of the Company transferred to the Resulting Company, viz Welspun Enterprises
Limited with the appointed date of 1 April 2012. FY13 numbers are shown on comparable basis for all statement of Profit and Loss and
Balance Sheet items discussed below, taking into account the demerger impact from 1 April , 2012.
The highlights of the financial year were:
• The scheme of demerger became effective from 24 January, 2014 (Approved by Hon’ble High Court of Gujarat on 10
January, 2014 with appointed date as 1 April, 2012)
• The Company has achieved 1 million MT mark for the second consecutive year in production and Sales in FY14, despite the
challenging global macro economic conditions.
• FY14 revenue was at Rs. 77,047 million.
• The new ERW mill of Capacity of 175 KMT in US has been commissioned and has also received API certification.
• Pipe production volume for FY14 was is 1,022K MT, highest ever annual production volume achieved by the Company.
• Sales volume for pipes in FY14 was 1,019K MT - highest ever annual sales by the Company as compared to 1018 K MT in FY13.
• In FY14, on an annualized basis, the Company has achieved over 42% capacity utilization against 45% in the previous year. The
installed capacity of pipes is 2.425 million MTPA, making the Company one of the largest line pipe companies in the World.
Total sales stood at Rs. 77,047 million in FY14 as compared to Rs. 90,832 million in FY13 primarily on account of a significant
drop in plate sales in FY14. On account of the fall in plate demand, the margins were severely affected, leading to a temporary
shutdown of the plate mill during major part of the year.
st
st
th th
st
Consolidated Revenues
Production and Sales in K MT – Pipes
60,000
80,000
100,000
120,000
73,63780,221
89,766
77,047
90,832
Revenue in Rs. Million
0
20,000
40,000
FY 10 FY 11 FY 12 FY 13 FY 14
Total Pipe SalesTotal Pipe Production
0
200
400
600
800
1000
1200
FY 10 FY 11 FY 12 FY 13 FY 14
1,022
814 816
958909
819 834
1,0191,010 1,018

41
WELSPUN Corp Limited
2. BREAKUP OF VARIOUS COST ITEMS AS A %AGE OF SALES (CONSOLIDATED)
* Post Demerger Effect showing results of Pipes & Plates business as continuing operations.
Cost of goods sold decreased by 17.4% to Rs. 49,698 million in FY14 from Rs. 60,173 million in FY13 mainly due to the lower plate
production and sales. Cost of goods sold as a percentage to Net Sales has also decreased from 66.2% in FY13 to 64.5% in FY14.
Manufacturing, transportation and other expenses are Rs. 15,341 million in FY14 lower from Rs. 18,723 million in FY13. The decrease is
mainly due to lower coating and other job charges as well Freight and material handling charges.
increased by 14.9% to Rs. 5,313 million in FY14 from Rs. 4,625 million in FY13 primarily on account of
forex translation impact of salaries paid at overseas locations and also increase in headcount at the US HFIW and Saudi operations.
Finance costs decreased by 17.3% to Rs. 2,964 million in FY14 from Rs. 3,583 million in FY13 due to conversion of Compulsorily
Convertible Debentures in year end-FY13, partly offset by higher forex translation impact related to foreign currency interest payments.
Depreciation/amortization charges increased 15% to Rs. 4,063 million in FY14 from Rs. 3,531 million in FY13 mainly due to the
commissioning of the HFIW mill in US and forex translational impact.
a. Cost of Goods Sold
b. Manufacturing and Other Expenses
c. Employee Benefit Expenses
d. Finance Costs
e. Depreciation/Amortization Charge
Sales
Cost of Goods Sold
Employee Benefit Expenses
Manufacturing & Other Expenses
- Store & Spares Consumed
- Coating & Other Job Charges
- Power, Fuel & Water Charges
- Freight Material handling charges
- Product Compensation & Claims
- Exchange Difference (Net)
- Other Expenses
Total Manufacturing & Other Expenses
Total Expenses
Other Income
Reported EBITDA
Finance Costs
Depreciation
PBT (Profit before Tax)
Tax Expenses
PAT Before Minority Interest
Minority Interest
Profit After Tax
Particulars FY 2013-14 FY 2012-13*
Amount Amount
(Rs. Million)
(%) (%)
77,047
49,698
5,313
1,357
1,698
1,101
4,733
125
3,610
2,717
15,341
70,352
1,744
8,439
2,964
4,063
1,412
431
981
(247)
734
100%
64.5%
6.9%
1.8%
2.2%
1.4%
6.1%
0.2%
4.7%
3.5%
19.9%
91.3%
2.3%
11.0%
3.8%
5.3%
1.8%
0.6%
1.3%
(0.3%)
1.0%
90,832
60,173
4,625
2,368
4,314
2,003
5,460
3
1,099
3,476
18,723
83,520
1,879
9,191
3,583
3,531
2,076
493
1,583
(179)
1,404
100%
66.2%
5.1%
2.6%
4.7%
2.2%
6.0%
0.0%
1.2%
3.8%
20.6%
91.9%
2.1%
10.1%
3.9%
3.9%
2.3%
0.5%
1.7%
(0.2%)
1.5%

WELSPUN Corp Limited
42
3. MARGINSa. EBITDA Margins
b. PAT Margin
Reported EBITDA for FY14 is Rs. 8,439 million, as compared to that of Rs. 9,191 million for FY13. Although EBITDA was lower y-o-y on
account of the lower revenues, EBITDA margin was better compared to last year due to change in product mix.
Adjusted for unrealised foreign exchange provision and non-operational income, Operational EBITDA improved to Rs. 7,742 million
in FY14 as compared to Rs. 7,079 million in FY13.
Profit after tax in FY14 was at Rs. 734 million as compared to Rs. 1,404 million in FY13. This was on account of lower EBITDA combined
with higher depreciation which was partly offset by lower finance costs.
I. EQUITIES AND LIABILITIES
Share Holder's Funds
Share Capital
Share Capital (Other than Equity)
Non-Current Liabilities
Long-Term Borrowings
Deferred Tax Liabilities (Net)
Other Long Term Liabilities
Long-Term Provisions
Current Liabilities
Short-Term Borrowings
Trade Payables
Other Current Liabilities
Current Portion of Long Term Debt
Short-Term Provisions
ASSETS
Non-Current Assets
Fixed Assets
Tangible Assets
Intangible Assets
Capital Work-In-Progress
Goodwill On Consolidation
Non-Current Investments
Long-Term Loans and Advances
Other Non-Current Assets
Current Assets
Current Investments
Inventories
Trade Receivables
Cash and Bank Balances
Short-Term Loans and Advances
Other Current Assets
Particulars FY 2013-14 FY 2012-13*
(Rs. Million)
1,315
-
34,293
5,417
2,107
171
1,178
24,591
11,353
3,436
1,246
48,420
216
2,389
-
234
924
55
9,848
23,031
15,461
5,923
4,245
1,565
1,076
(6,258)
192
(920)
(79)
2,990
(18,503)
(4,937)
1,773
(332)
634
(43)
(1,243)
5
22
(39)
5
1,295
(10,215)
(9,054)
(4,476)
(1,307)
405
1,315
1,076
28,035
5,609
1,187
92
4,168
6,088
6,416
5,209
913
49,054
173
1,146
5
256
885
60
11,143
12,815
6,407
1,447
2,938
1,970
Change
-
* Post Demerger Effect showing results of Pipes & Plates business as continuing operations (whereas financial section showing Balance Sheet
position as per previous Annual Report of 2012-13).
Reserve and Surplus
NETWORTH
Minority Interest
26,189
27,504
1,015
989
2,065
(3)
27,178
29,569
1,012
Total 112,310 (24,013)88,297
TOTAL FIXED ASSETS 51,025 (648)50,377
Total 112,310 (24,013)88,297

WELSPUN Corp Limited
43
4. Surplus Funds
5. Capital Deployment
6. Networth
a. Share Capital
b. Reserves and Surplus
7. Loan Funds
Major movements during the year are:
8. Fixed Assets
Temporary surplus funds are invested in short term securities such as mutual funds and government securities. Nevertheless, in order to
achieve higher growth and value creation for the stakeholders, the Company aims to retire high cost debt to improve overall profitability
and make the balance sheet healthy.
During FY14, capital deployment decreased from Rs. 112,310 million to Rs. 88,297 million mainly due to reduction in inventories,
receivables and payables, mainly due to lower plate mill operations.
Networth at the end of FY14 increased by Rs. 2,065 to Rs. 29,569 million. The Share Capital and Share Capital (other than equity) has
increased by Rs. 1,076 million on account of issue of Convertible Preferred Stock (''Convertible Shares'' with voting rights) by USA
subsidiary viz. Welspun Pipes Inc. (USA) to Insight Solutions (DE), L.P., during the year. The Reserves and Surplus of the Company has
increased by Rs. 989 million in FY14 at Rs. 27,178 million.
The details of Net worth are as under:
The no of shares is 262,948,299 (face value of Rs. 5 each) as at 31st March 2014, which is same as at the end of the previous year.
i) Capital Reserve: The balance as of 31st March, 2014 is NIL as the reserve was transferred to Welspun Enterprises Ltd pursuant to
Scheme of Arrangement.
ii) Capital Reserve on Consolidation: The balance as of 31st March, 2014 amounted to Rs. 153 million which is same as in the previous
financial year.
iii) Securities Premium account stands at Rs. 7,649 million, marginally lower than Rs.7,677 million at end-FY13 due to adjustment of
premium on redemption of part FCCB.
iv) Debenture Redemption Reserve: Debenture Redemption Reserve stands at Rs. 1,142 million at the end of FY 14 which is same as in
the previous financial year.
v) Statutory Reserve stands at Rs. 93 million (as against nil in FY13); this was created as per the law of Kingdom of Saudi Arabia.
vi) Hedging Reserve Account stands at a positive of Rs. 52 million as at 31st March 2014. The Group has adopted AS-30 on Hedge
Accounting and accordingly gain of Rs. 52 million (Loss of Rs. 45 million in FY13) related to foreign exchange difference on Cash Flow
Hedges for certain firm commitments and forecasted transactions is recognized in Shareholders’ Funds and shown as Hedging
Reserve Account.
vii) The Balance in General Reserve as on 31st March 2014 stands at Rs. 53 million which is almost same as in the previous financial year.
viii) Profit and Loss account: The balance retained in the Profit and Loss Account as on 31st March 2014 has increased by Rs. 488 million
to Rs. 17,291 million, mainly on account of the profit for the year amounting to Rs. 734 million and appropriation of dividend and
dividend distribution tax of Rs. 154 million.
The Gross debt at the end of FY14 stands at Rs. 37,412 million down by Rs. 1,495 million over the previous year. The components included
in gross debt are long term borrowings of Rs. 28,035 million, current portion of long term borrowings of Rs. 5,209 million, and short term
borrowings of Rs. 4,168 million at the end of FY 14.
i. The overall long term borrowings and current portion of long term debt has gone down by Rs. 4,485 million, primarily due to
repayment of ECB (US$50 million each in April 2013 and March 2014) and buyback of FCCB partially offset by revaluation of foreign
currency debt due to the rupee depreciation.
ii. The short term borrowings have gone up by Rs. 2,990 million mainly due to increase in working capital loans.
Cash&BankBalancesandliquid/current investmentsforFY14havedecreasedbyRs.3,181milliontoRs.12,590millionfromRs.15,771millionin
FY13.
Net debt stands at Rs. 24,822 million as of 31st March 2014 after accounting for cash & bank balances and liquid / current investments.
Net Debt to Networth ratio is at 0.84x indicating a strong Balance Sheet.
Net block of fixed assets (including CWIP) decreased by Rs. 648 million to Rs. 50,377 million in FY14. While the Company did not
undertake any major Capex, the fixed assets in rupee terms increased as a result of forex translation of Fixed assets in overseas
subsidiaries.

WELSPUN Corp Limited
44
9. Inventory
10. Trade Receivables
11. Cash, Bank Balances and Current Investments
12. Long Term Loans and Advances
13. Short Term Loans and Advances
14. Other Current Assets
15. Trade Payables
16. Cash Conversion Cycle
17. Liquidity
The overall inventory decreased by Rs. 10,216 million to Rs. 12,815 million mostly due to decrease in raw materials of Rs. 7,299 million,
decrease in finished goods of Rs. 1,230 million, decrease in WIP stock of Rs. 1,918 million and increase in Stores and spares of Rs. 232
million. Main reason for decrease is due to Plate Mill operations being curtailed on account of bleak business opportunities.
The inventory turnover days have decreased from 93 days of Net Sales in FY13 to 61 days of Net Sales in FY14.
Trade Receivables decreased from Rs. 15,461 million in FY13 to Rs. 6,407 in FY14. Sundry Debtors are at 30 days (62 days in FY13) of net
sales during the year.
Cash, Bank Balances and Current Investments at the end of FY14 stand at Rs. 12,590 million as compared to Rs. 15,826 million at the end
of FY13.
Long term loans and advances decreased by Rs. 39 million to Rs. 885 million in FY14. Below is the breakup of the change in long term loans
and advances from FY13 to FY14.
- Decrease in capital advances by Rs. 129 million to Rs. 41 million.
- Decrease in loans and advances to related parties (incl. share application money) by Rs. 21 million to Rs. 36 million.
- Increase in deposits by Rs. 81 million to Rs. 456 million.
- Increase in other loans and advances recoverable in cash and kind, balances with government authorities (advance taxes) by Rs.
30 million to Rs. 352 million.
Short term loans and advances decreased by Rs. 1,307 million to Rs. 2,938 million from FY13 to FY14 mainly due to the following:
- Decrease in advances recoverable in cash or kind by Rs. 170 million.
- Decrease in balances with government authorities on account of direct and Indirect taxes by Rs. 1,189 million.
- Decrease in deposits by Rs. 70 million.
- Increase in pre paid expenses and employee advances by Rs. 35 million.
- Increase in loans and advances to employees by Rs. 87 million.
Other current assets increased by Rs. 405 million to Rs. 1,970 million mainly due to the following changes from FY13 to FY14.
- Decrease in receivables toward claims by Rs. 201 million.
- Decrease in interest accrued on current investments, fixed deposits and others by Rs. 12 million
- Decrease of export benefit receivables of Rs. 177 million from FY13 to FY14.
- Increase in other receivable from related parties and other parties is Rs. 800 million in FY14 (Nil in FY13).
- Decrease in Unamortised Ancillary borrowing cost by Rs. 5 million.
Trade payables have gone down by Rs. 18,503 million to Rs. 6,088 million in FY14 from Rs. 24,591 million in FY13, primarily on account of
decrease in acceptances of Rs. 14,297 million and other creditors by Rs. 4,207 million in FY14. The Company has consciously tried to
reduce the level of acceptances, commensurate with the operations. The temporary shutdown of the plate mill also contributed to the
decrease in trade payables.
Trade payables are at 29 days (99 days in FY13) of Net Sales.
Cash conversion cycle for the current year is 51 days compared to 12 days for FY13.
We broadly define liquidity as our ability to generate sufficient funds from both internal and external sources to meet our obligations and
commitments. Our primary liquidity requirements have been to finance our working capital requirements for our operations and for
capital expenditures and investments. We have financed our capital requirements primarily through funds generated from our
operations, equity/equity related issuance and borrowings.
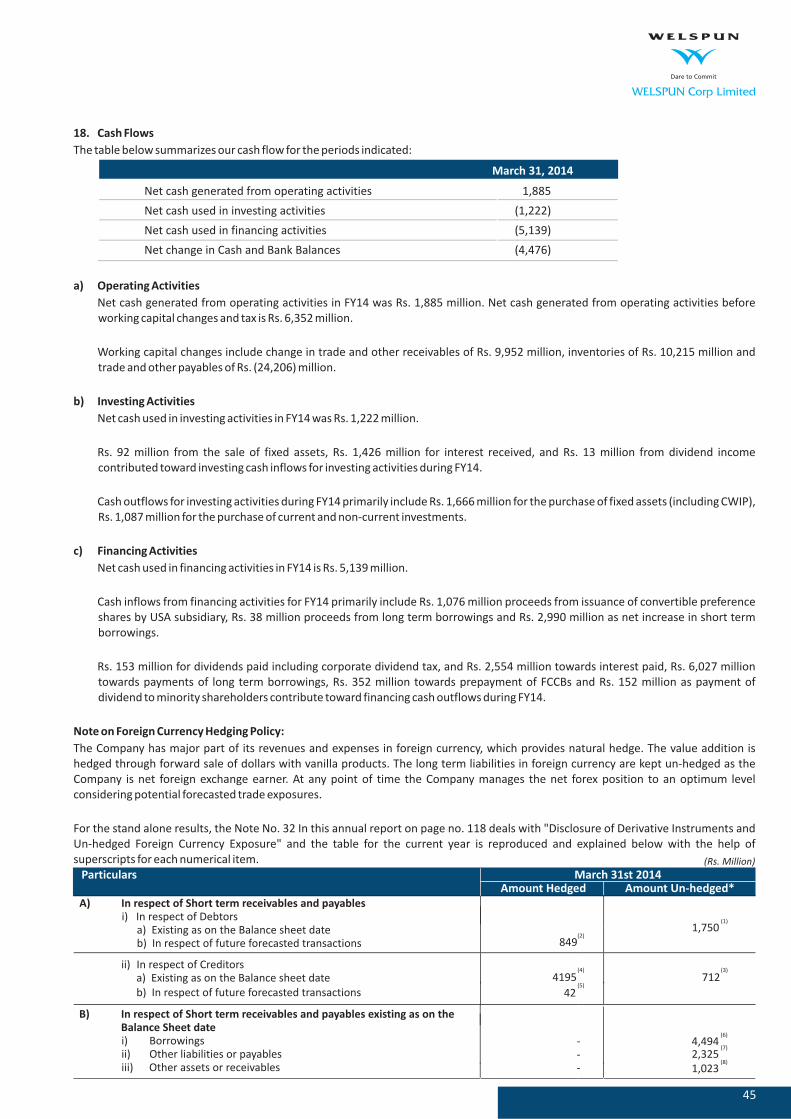
WELSPUN Corp Limited
45
18. Cash Flows
a) Operating Activities
b) Investing Activities
c) Financing Activities
Note on Foreign Currency Hedging Policy:
The table below summarizes our cash flow for the periods indicated:
Net cash generated from operating activities in FY14 was Rs. 1,885 million. Net cash generated from operating activities before
working capital changes and tax is Rs. 6,352 million.
Working capital changes include change in trade and other receivables of Rs. 9,952 million, inventories of Rs. 10,215 million and
trade and other payables of Rs. (24,206) million.
Net cash used in investing activities in FY14 was Rs. 1,222 million.
Rs. 92 million from the sale of fixed assets, Rs. 1,426 million for interest received, and Rs. 13 million from dividend income
contributed toward investing cash inflows for investing activities during FY14.
Cash outflows for investing activities during FY14 primarily include Rs. 1,666 million for the purchase of fixed assets (including CWIP),
Rs. 1,087 million for the purchase of current and non-current investments.
Net cash used in financing activities in FY14 is Rs. 5,139 million.
Cash inflows from financing activities for FY14 primarily include Rs. 1,076 million proceeds from issuance of convertible preference
shares by USA subsidiary, Rs. 38 million proceeds from long term borrowings and Rs. 2,990 million as net increase in short term
borrowings.
Rs. 153 million for dividends paid including corporate dividend tax, and Rs. 2,554 million towards interest paid, Rs. 6,027 million
towards payments of long term borrowings, Rs. 352 million towards prepayment of FCCBs and Rs. 152 million as payment of
dividend to minority shareholders contribute toward financing cash outflows during FY14.
The Company has major part of its revenues and expenses in foreign currency, which provides natural hedge. The value addition is
hedged through forward sale of dollars with vanilla products. The long term liabilities in foreign currency are kept un-hedged as the
Company is net foreign exchange earner. At any point of time the Company manages the net forex position to an optimum level
considering potential forecasted trade exposures.
For the stand alone results, the Note No. 32 In this annual report on page no. 118 deals with "Disclosure of Derivative Instruments and
Un-hedged Foreign Currency Exposure" and the table for the current year is reproduced and explained below with the help of
superscripts for each numerical item.
Net cash generated from operating activities
Net cash used in investing activities
Net cash used in financing activities
Net change in Cash and Bank Balances
1,885
(1,222)
(5,139)
(4,476)
March 31, 2014
1,750(1)
A) In respect of Short term receivables and payablesi) In respect of Debtors
a) Existing as on the Balance sheet dateb) In respect of future forecasted transactions
(Rs. Million)
Particulars March 31st 2014Amount Hedged Amount Un-hedged*
42(5)
ii) In respect of Creditorsa) Existing as on the Balance sheet date
b) In respect of future forecasted transactions
849(2)
4195(4)
712(3)
B) In respect of Short term receivables and payables existing as on theBalance Sheet datei) Borrowingsii) Other liabilities or payablesiii) Other assets or receivables
---
4,494(6)
2,325(7)
1,023(8)

WELSPUN Corp Limited
46
Explanation for A) in respect of Short term receivables and payables :
Conclusion
Explanation for B) in respect of Short term receivables and payables existing as on Balance sheet date
Explanation for C) in respect of Long term receivables and payables existing as on Balance sheet date
Explanation for D) in respect of Other derivative Hedge instruments
Cautionary Statement
The above table is reproduced in the form of overall receivables and payables position and provides the net position as on 31st
March,2014, with regard to foreign currency exposure and the net un-hedged position.
: The difference between receivables and payables is after including orders in hand and hedges in place. The net un-hedged
position is at optimum level, as the Company enjoys the natural hedge.
6. Short term borrowings (FCCB) Rs. 4,494 million is partly hedged by un-hedged export receivables.
7. Includes Rs. 832 million for Advance received from customers for future shipments and Rs. 1,055 million for claims payable,
Rs. 120 million Agency Fees Payable and Rs. 318 million ECB / FCCB Interest & Premium.
8. Includes Rs. 26 million Short term fixed deposits and balance in foreign currency account and Rs. 300 million advance payment
to Subsidiary and Rs. 629 million receivable against Preference Capital Redemption and Others and Rs. 23 million advance
payment to vendors and Rs. 45 million receivable against claims.
9. Rs. 4,194 million represents ECB loans and Rs. 1,783 million represents foreign currency loan.
10. Rs. 998 million represents claims payable
11. i) Interest Rate Swap: Rs. 5,977 million (equivalent to US $ 99.75 million) floating to fixed for ECB and Foreign currency loan for
mitigating interest rate volatility.
ii) Coupon Only Swap: Rs. 5,000 million (equivalent to US $ 107.28 million) conversion of long term rupee loan into foreign
currency loan on notional principal basis. This results into conversion of high cost rupee loan into cost effective LIBOR based
foreign currency loan.
Some of the statements in this Management Discussions and Analysis, describing the projections, estimates and expectations may be forward
looking statements within the meaning of the applicable laws and regulations. Actual results may differ substantially from those expressed or
implied. Important developments that could affect Welspun's operations include a shift in the industry structure, significant changes in political
and economic environment in India and globally, tax laws, import duties, litigations and labour relations.
C) In respect of Long term receivables and payables existing as on theBalance Sheet datei) Borrowingsii) Other liabilities or payablesiii) Other assets or receivables
---
5977(9)
998(10)
-
D) Other derivative Hedge instruments 10,977(11)
Note : The Net un-hedged short term payables/borrowings as on 31st March 2014 is Rs.4,758 million (as on 31st March 2013 Net un-hedged short term payables/borrowings was Rs. 14,596 million.)
4,907(3+4)
i) In respect of Trade receivables and payables
Total Trade
ii) Hedges
Total Hedge
Net Un-hedged Trade
Existing as on the Balance sheet date
In respect of future forecasted transactions basedon orders in hand
Existing as on the Balance sheet date
In respect of future forecasted transactions
(Rs. Million)
Particulars March 31st 2014
Receivables Payables
16,008
849(2)
Difference
17,758
849
16,909
552
(3,389)
3,942
12,299
17,206
42
4,238
12,968
1,750(1)
4196(4)
(5)

47
WELSPUN Corp Limited
growth at infinity
*Consolidated Pipes & Plates Sales
on account of demerger
*Rs. 77,047 mn.
Initiative of Setting up new HFIW Plant of 175,000 tons in US
tons
Saudi Plant - capacity of 300,000 tons operational
2014
2013*Rs. 90,831 mn.
- Breaks ‘Million Ton’ markfor the second consecutive year
in production, sales and orderbooking
- New 175,000 tons HFIW mill at Little Rock commissionedand received API certification
- Achieved 1mn MT mark in production, sales and order booking
- Demerger of non-pipe businesses for effectivebusiness focus

- William Clay Ford
Jr. Executive Chairman, Ford Motor Company
Creating a strong business and
building a better world are not
conflicting goals – they are both
essential ingredients for long-term
success.
At Welspun, we believe that a business can never be successful if the
society around them fails. Therefore, it becomes our moral mission to
identify and address the needs of our society.
Welspun as a group is committed to building a sustainable and
progressive community. Our social mission is enshrined within the 3E’s
i.e. Education, Empowerment and Environment & Health. A number of
projects encompassing the 3E’s have been taken up under the banner of
the Welspun Foundation for Health and Knowledge (WFHK) that either
runs independently powered by Welspun or through nurtured
partnership with the local government or non-governmental
organizations (NGOs).
corporate social responsibilityA Welspun Commitment
50

51
Quality Education Programme in Kutch
The recently enacted ‘Right to Education (RTE)’ Act, 2009 gives the right to get access to quality
education to every child in underprivileged communities. According to the National Education
University for Planning and Administration, Anjar has 156 schools in total and almost 80% of these
schools are providing primary education. It also states that even though primary school is able to
give education to all students and retain them till 8th standard, the dropout rate was 10% at
primary level in year 2005 which alarmingly throw challenges in enrolment in secondary level
education.
Welspun’s CSR approach has initiated a Quality Education Project in Anjar with the Government of
Gujarat in 2012 where we worked with 3 government schools i.e. Varsamedi, New Dudhai and
Bhadreshwar to make a subtle difference to 28 teachers and 584 students from Std V – VIII. The
achievements were measured using pre and post tests.
In 2013 -14, our objective was to reach out to 18 Government Schools from 14 villages (Ajapar,
Bhadreshwar, Kumbharia, Shinai, Sinugra, Veera, VidiBaug, Varsamedi, Nagalpar, Vidi, Valadiya,
Indraprasth, Kharapasvariya, Khamra), reaching out to 83 Teachers and 3,844 Students.
EDUCATION – Your Door To The Future
A Baseline Study was conducted and its observations were as follows:
• In Standard 1 to Standard 8, more than 60% of students did not meet their learning levels in
Reading, Writing and Math
• 3% dropout rate noted across Standard 1 to Standard 8 while 8% noted in the migrating
community
• 80% of teachers’ irregularity observed - teachers report late and leave early
• It was observed that SMCs’ (School Monitoring Committee) were not aware of their role in
certain schools or not even formed for certain schools
• Non-functional toilets forces students to alternate options such as use open space in the
outside areas while girl students prefer going home for the same.

52
Based on the Baseline Study, deliverables were set and are summarized as below:
1
2
Deliverables Set As PerBaseline Study
List activities planned toachieve the set deliverables Status as of March '14
50% of children to attain 40%
learning levels – Reading,
Writing, Math
• Workbooks for std.1-5 childrenprepared and disseminated. 20 filmscreening done in 14 schools
• 5 one day camps conducted in 5school in Nov, Feb and March reachingout to 750 students
• Art, origami ,quiz etc. conducted in allthe schools twice
• Pre and post tests conducted in allschools and 27.31% increase inlearning levels seen across the 18schools
• 576 children enrolled
• 86 irregular students identified in 10villagers.
• All are attending school regularly
• 16 drop out children identified in 5villages
• 5 out of 16 children readmitted toschool in villages.
• Could not be conducted due to DPEOtransfer
• Monitored by Edu-leaders and all 18schools functional
• Except for few specific incidences inBhadreshwar and Ajapar, teachersare quite regular. They teach forstipulated hours in the class
• 18 SMC formed
• 180 SMC members trained out of 216
• Water connection have been installedin 5 schools
• RO plant installed in 3 schools out of12 schools
• New toilet blocks have beenconstructed in 2 schools.
• Mid day meal has been regularizedin 1 school as per the new menu
• In Veera,4 new rooms has beenconstructed
• Workbooks were designed fromStandard 1 to 5 based on thecurriculum for easy and enhancedlearning
• Personality Development ofstudents by children’s camps.Target-800 students
• Pretest post tests in all schools
• No of children enrolled
• Number of irregular students to beidentified
• 1 on 1 counseling to be conductedto ensure attendance across the 18schools
• Teacher Training
• School timings: 11am-5pm
• Teacher Attendance
450 children to be enrolled. 30
from each village at the
starting at standard 1.
Teacher Enhancement3
Formation of SMC’s in all 18
schools
Edu Leaders empowered with
their roles and responsibilities
Bal Panchayat to be formed in
all 18 schools
• No of SMC formed
• No. of Training Provided to SMCs’
on their Roles & Responsibilities
• No of Edu Leaders Selected
• No of training conducted
• No of Bal Panchayat formed
4
5
6
• 18 Edu-leaders selected
• All 18 trained in 24 sessions
• 18 Bal Panchayats formed
• 4 Bal Panchayats trained

53
Sustainability Approach
Welspun Vidya Mandir
Balwadis –
Career Counseling
Educational and motivational sessions for cancer patients and families
A formal presentation was given to the District Primary Education Officer, backed by research and
implementation plan. After receiving a written approval, Welspun began to execute its plan in
over 18 schools.
At the onset, an orientation programme was conducted wherein we invited all the concerned
government officials and local community members and briefed them on the program outline
and target objectives for the year.
A local member has been appointed from all the 14 villages as an EDU leader who works in co-
ordination with the local Panchayat Bodies to monitor activities. He/ She is a volunteer who is
passionate about education and wants to see a change in the schools. More so, a monthly review
is conducted to understand gaps and shortfalls in the current plans while we also review the
momentum of growth regularly.
This project is planned for a period of 3 years for each village. Each school will be guided for 3 years
to bring it to a level of quality study resourcefulness, post which the respective community groups
will ensure the functioning.
At Welspun Vidya Mandir, 2 CBSE schools with classes up till 12th standard have been set up at
Anjar, Gujarat and Salav, Maharashtra where they provide quality education to over 2060
students and also focus on an all round development
As a part of the community welfare programme, the school organizes regular community service
activities where children get the opportunity to visit old age homes, orphanages and even take
part in art & craft exhibitions, where the funds collected from sold items is donated to charity.
The pre-primary education center and adult literacy programme
Welspun runs 4 Balwadis in the worker colonies at Anjar and Vapi, Gujarat and Palghar,
Maharashtra where a total of 170 children are benefitting from the basic education given at there.
We also run Adult Literacy program for interested women in Anjar.
This initiative is carried out for children belonging to Welspun employees at the Head office
(Mumbai) and for students of Std X to XII at Welspun Vidya Mandir (CBSE Board School) at Anjar
and Salav. Psychometric tests are administered and one on one counseling is conducted based on
the test results.
As a part of our Employee Volunteering Initiative, 17 Welspun Employees spend quality time (on
working Saturdays) at St. Jude’s childcare center, Mumbai in quest of making a qualitative
difference to the lives of 38 underprivileged children suffering from cancer and their parents. The
group teaches skills like Spoken English, Computer literacy, Art and Craft and also hold
motivational sessions/videos; share inspirational stories that help the children and their families
cope with distress.
WELSPUN Corp Limited

54
As we empower our future generations with education, we also see the need to empower families
so they can sustain themselves in times to come and move towards growth and prosperity. With
this drive to provide a sustainable support to the society, we have focused our attention to the
development of women - who is a key influencer in the life cycle and thus becomes our 2nd E to
empower women!
We conduct surveys in communities surrounding our plants; identify women in
need of financial aid who wish to be empowered with an aptitude to learn.
We set up a vocational training center for cutting and stitching in their
community, which is run like a professional enterprise by our CSR Team. Efficiency is monitored
and daily guidance is provided to the women.
After training them completely for a month, we provide them
consistent work orders which ensure these women have enough jobs to get sustainable earnings.
We also offer employment to these women at our Textile plant.
We aim to annually increase the number of beneficiaries as well as
the individual earnings of the existing beneficiaries. We are in the process of starting one more
Vocational Training Center in Sinugra Village, Anjar.
The chart below quantifies our initiative.
A 360 Degree Approach To Women Empowerment
Need Analysis:
Set Up Stitching Center:
Ensure Sustainable Growth:
Our Mission & Way Forward:
Results Achieved:
EMPOWERMENT – Enabling Wings To FlyEMPOWERMENT – Enabling Wings To Fly

55
This project has encouraged women who have never stepped out of their homes to venture out to
learn a new skill and be an equal partner in the family’s financial transactions.
We have also started a women empowerment initiative of Papad making at Palghar, Gujarat
based on the local area needs and skill set.
Papad Making Workshops
8
5,045
38,28,544
610
1,37,061
4,44,387
Vocational Centers to Train
Women in Cutting & Stitching
Total Earnings of Women beneficiaries
at the Vocational Centers
Total number of products developed
across all Vocational Centers
Total Bed sheets Produced till date
Average Earning per woman per
month across all Vocational Centers
207 Women were employed at WIL
after completion of training
at the Vocational Centers
226 Women engaged across our
Vocational Centers
Women Trained in Stitching at
the Vocational Centers
WELSPUN Corp Limited

We realize the importance of conservation of natural resources and environment for a sustainable growth ofmankind. As the saying goes, Health is Wealth! and with this in mind, we have started the following Initiatives:
In a survey done in villages near Vapi, Gujarat, it was observed that safe and clean drinking water was a direneed. Most of the water sources were highly polluted with very high PH value, which as per World HealthOrganization (WHO) standards was beyond permissible.
Therefore, our long-term vision is to provide purified drinking water to the community around our facilities. Wehave made a beginning by installing a 500LPH RO Plant in Kunta, Vapi which has made potable drinking wateravailable to 6,200 people in the neighboring regions. We intend to further install RO plants post conducting thefeasibilitystudies.Atpresent thestudy is underprogress for15 locations.
In Mumbai, for the underprivileged section of the society, Welspun aims to provide free access to PrimaryHealth Care Services. To cater to this growing need, we have launched our Mobile Health Van in Associationwith Wockhardt Foundation. The mobile van is equipped with medicines, a doctor and a paramedic. Thisproject has developed in phases.
• This initiative has covered 15532 people in the year 2011-2012 from six communities
• In 2012-2013, this initiative listed 25797 beneficiaries from six communities, wherewe gave more emphasis on Preventive Health Care and various health aspects like mother andchild health care, immunization, cardiovascular diseases and other seasonal diseases
• In 2013- 2014, our Approach is to outreach to 12 new communities to increase thenumber of beneficiaries to approximately 50,000
We also plan to start the Mobile Health Van services in Anjar, providing free Primary Health Care services torural & slum areas in the 10 km radius of Welspun City, Anjar Gujarat. The target for 3 years is to cover all thecommunities in the 10 km radius.
To create awareness on the ill effects of Tobacco and to make children instrumental in bringing about thischange in their neighborhood and families, Welspun has initiated an Anti tobacco Life Skill Project with 33secondary schools from Alibaug partnering with Salaam Bombay Foundation (NGO). This project coveredapproximately 10000 students, 100 teachers and 50 Anganwadi Workers.
Drinking Water Purification
Mobile Health Vans Mumbai
Phase 1:
Phase 2:
Phase 3:
Anti- Tobacco Program
ENVIRONMENT & HEALTH – For A Better TomorrowENVIRONMENT & HEALTH – For A Better Tomorrow
56

We have held teachers training workshop, student’s capacity building program and culmination event andother workshops were carried out in the year 2011-2012. All these schools continue to implement the life skillanti tobacco activities even today.
As an example of our effort to grow through a sustainability focus, we have set up a state-of-art, Waste WaterRecovery Plant with a capacity of 10 MLD (Million Liters Daily) at Anjar Campus, which takes care of both ourTextile and Pipe plant.
It is one of the largest Waste Water Recovery plant in textile industry at a single location having series oftreatment stages leading to its designed capacity of 90% recovery. This set-up recycles 100% of our water andwe re-use 85% of water during our processing thereby conserving water in our already water-starved locationof Anjar.
To enhance renewable source of energy at both business and environmental level is vital and with thisthought playing an instrumental for our societies wellbeing, Welspun has installed a centralized ‘NisargrunaBiogas plant’ at WIL, Anjar to handle and process the biodegradable waste materials generated from kitchen,canteen, garden and other biological sludge of Welspun City and Gram, Anjar.
Presently, 2-2.5 MT of biodegradable waste is feed into the Nisargruna Plant, which generates fuel gasequivalent to 40kg of LPG, which in turn is used for cooking in plant canteen.
Our current tree plantation campaign deliverables are as follows:
Three years’ targets, along with Activities
• 2012 - 2013 landscaping development—10,000 Sq. Meters
• 2013 - 2014 landscaping development—12000 Sq. Meters
• 2014 - 2015 landscaping development—10,000 Sq. Meters
Total number of Saplings planted so far 2,19,994 and actual survived is 1,94,832.
Tree Plantation Target for next 3 years:
• 2012-13: 8000 Trees • 2013-14: 8000 Trees • 2014-15: 8000 Trees
Under our initiative to convert the desert area of Anjar into a lush and more sereneenvironment, we have undertaken and aforestation drive at Welspun City by planting thousands of saplings ofthe Jatropha tree. The Jatropha seed oil can be combusted as fuel for simple diesel engines.
As we envision community development in all 3E’s (Education, Environment & health, Empowerment), wehave a long-term target of having 100% sanitation in all the communities we work in.
We have initiated the process this year by conducting a baseline need assessment in the 15 communities inGujarat, where we are working on the Quality Education Program.
In addition to all these efforts, we also carry out various activities at HO in Mumbai like NGO Exhibition Stalls,Blood Donation Camps, Celebrations of World Environment Day, World No Tobacco Day, Donation Drives,Relief operations for victims of natural calamities.
These little steps in our journey towards sustainable growth are aimed at providing a socio-economic growthto the society which has given us so much in terms of business.
Waste Water Recovery Plant
Nisargruna Biogas Plant
Tree Plantation
Plantation of Jatropha:
Sanitation
Miscellaneous
“We make a living by what we get, but we make a life by what we give.”- Sir Winston Churchill
57
WELSPUN Corp Limited

financial section
58
Consolidated Financials
Standalone Financials
1 Independent Auditor's Report on Consolidated Accounts
2 Consolidated Balance Sheet
3 Consolidated Statement of Profit & Loss
4 Consolidated Notes to Accounts
5 Consolidated Cashflow Statement
6 Section 212 (8) disclosure
1 Independent Auditor's Report on Standalone Accounts
2 Standalone Balance Sheet
3 Standalone Statement of Profit & Loss
4 Standalone Notes to Accounts
5 Standalone Cashflow Statement
6 Section 212 disclosure
59
60
61
62
89
90
91
96
97
98
131
132

59
WELSPUN Corp Limited
Independent Auditors' Report
Report on the consolidated financial statements
Management's Responsibility for the Consolidated Financial Statements
Auditor's Responsibility
Opinion
Emphasis of Matter
Other Matter
To,The Board of Directors of
1. We have audited the accompanying consolidated financial statements of (“the Company”) and itssubsidiaries (collectively referred to as “the Group”) which comprise the Consolidated Balance Sheet as at 31 March 2014, theConsolidated Statement of Profit and Loss and the Consolidated Cash Flow Statement for the year then ended and a summary ofsignificant accounting policies and other explanatory information.
2. Management is responsible for the preparation of these consolidated financial statements that give a true and fair view of theconsolidated financial position, consolidated financial performance and consolidated cash flows of the Group in accordance withthe accounting principles generally accepted in India. This responsibility includes the design, implementation and maintenance ofinternal control relevant to the preparation and presentation of the consolidated financial statements that give a true and fair viewand are free from material misstatement, whether due to fraud or error.
3. Our responsibility is to express an opinion on these consolidated financial statements based on our audit. We conducted our audit inaccordance with the Standards on Auditing issued by the Institute of Chartered Accountants of India. Those Standards require thatwe comply with ethical requirements and plan and perform the audit to obtain reasonable assurance about whether theconsolidated financial statements are free from material misstatement.
4. An audit involves performing procedures to obtain audit evidence about the amounts and disclosures in the consolidated financialstatements. The procedures selected depend on the auditor's judgment, including the assessment of the risks of materialmisstatement of the consolidated financial statements, whether due to fraud or error. In making those risk assessments, the auditorconsiders internal control relevant to the Company's preparation of the consolidated financial statements in order to design auditprocedures that are appropriate in the circumstances, but not for the purpose of expressing an opinion on the effectiveness of theCompany's internal control. An audit also includes evaluating the appropriateness of accounting policies used and thereasonableness of the accounting estimates made by management, as well as evaluating the overall presentation of theconsolidated financial statements.
5. We believe that the audit evidence we have obtained is sufficient and appropriate to provide a basis for our audit opinion.
6. In our opinion and to the best of our information and according to the explanations given to us, and based on the consideration ofthe reports of the other auditors on the financial statements of the subsidiaries referred to below in the Other Matter paragraph, theconsolidated financial statements give a true and fair view in conformity with the accounting principles generally accepted in India:
(a) in the case of the Consolidated Balance Sheet, of the state of affairs of the Group as at 31 March 2014;
(b) in the case of the Consolidated Statement of Profit and Loss, of the Profit of the Group for the year ended on that date; and
(c) in the case of the Consolidated Cash Flow Statement, of the cash flows of the Group for the year ended on that date.
7. We draw attention to Note 38 of the consolidated financial statements, relating to remuneration paid to the Managing Director ofthe Company for the financial year 2012-13, which turned out to be in excess by Rs. 83.01 million considering the limits approved bythe Central Government. The Managing Director holds the said amount in trust and is refundable to the Company. Our opinion is notqualified in respect of this matter.
8. We did not audit the financial statements of certain subsidiaries of the Group whose financial statements reflect revenue of52,145 million, total assets of 34,765 million and net cash outflows amounting to 700 million for the year then ended, as
considered in the consolidated financial statements. These financial statements have been audited by other auditors whose reportshave been furnished to us by the Management, and our opinion in so far as it relates to the amounts and disclosures included inrespect of these subsidiaries is based solely on the reports of the other auditors.
Our opinion is not qualified in respect of this matter.
Welspun Corp Limited
Welspun Corp Limited
` ` `
ForChartered AccountantsFirm Registration Number 101169W
PartnerMembership Number 12912
Mumbai, 29 April 2014
MGB & Co
Mohan Bhandari

60
WELSPUN Corp Limited
Consolidated Balance Sheet as at 31 March
( in million)`
Notes 2014 2013
EQUITY AND LIABILITIES
Shareholders' funds
29,568.78 56,577.65
Non-current liabilities
34,923.00 57,652.40
Current liabilities
Total 88,296.80 168,913.59
ASSETS
Non-current assets
51,577.31 91,778.95
Current assets
36,719.49 77,134.64
Total 88,296.80 168,913.59
Share capital 2 1,314.74 1,314.74
Share capital (Other than equity) 2.1 1,076.44 –
Reserves and surplus 3 27,177.60 55,262.91
Minority interest 1,011.78 3,546.02
Long-term borrowings 4 28,034.54 49,530.77
Deferred tax liabilities (Net) 5 (a) 5,608.87 5,599.91
Other long-term liabilities 6 1,187.41 2,271.00
Long-term provisions 7 92.18 250.72
Short-term borrowings 8 4,167.55 2,043.41
Trade payables 9 6,087.70 30,379.65
Other current liabilities 10 11,624.97 17,370.53
Short-term provisions 11 913.02 1,343.93
22,793.24 51,137.52
Fixed assets 12
- Tangible assets 49,053.74 64,197.10
- Intangible assets 172.70 233.32
- Build, Operate and Transfer (BOT) – 5,127.33
- Intangible assets under development – 188.62
- Goodwill on consolidation 4.68 10,655.83
- Capital work-in-progress 1,145.73 5,275.84
Non-current investments 13 255.59 1,177.63
Deferred tax assets (Net) 5 (b) – 88.30
Long-term loans and advances 14 885.37 4,452.08
Other non-current assets 15 59.50 382.90
Current investments 16 11,142.54 17,493.59
Inventories 17 12,815.32 25,668.82
Trade receivables 18 6,407.30 17,614.02
Cash and bank balances 19 1,447.16 6,988.74
Short-term loans and advances 20 2,937.57 5,500.23
Other current assets 21 1,969.60 3,869.24
Notes forming part of the consolidated financial statements 1 - 41
As per our attached report of even date For and on behalf of the Board
MGB & Co. B.K.Goenka Braja Mishra
Mohan Bhandari S. Krishnan Pradeep Joshi
For
Chartered Accountants Chairman Managing Director
Firm Registration Number 101169W
Partner Chief Financial Officer Company Secretary
Membership Number 12912
Mumbai, 29 April 2014

61
WELSPUN Corp Limited
Consolidated Statement of Profit and Loss for the year ended 31 March
( in million)
Revenue from operations (Gross) 22 78,153.35 95,111.47
Less: Excise duty 1,106.12 4,279.37
Revenue from operations (Net)
Other income 23 1,743.60 1,878.61
Cost of materials consumed 24 46,549.36 59,430.41
Changes in inventories of finished goods and goods-in-process 25 3,148.24 742.41
Employee benefits expense (Net) 26 5,313.15 4,624.57
Other expenses 27 15,340.92 18,722.69
Less: Depreciation and amortization expense 12 4,063.01 3,531.24
Finance costs 28 2,964.04 3,583.23
- Current tax - Current year 414.57 (45.68)
- Earlier years – 1.61
- MAT credit entitlement – (138.38)
- Deferred tax 17.01 675.31
Less: Minority interest (246.63) (179.01)
40
Less: Tax expense of discontinued operations – (102.55)
Add/(less): Share of profit/(loss) from associates – (37.96)
Minority interest – 397.86
Earnings per share of 5 each fully paid-up (in ) 36
- Basic 2.79 (3.03)
- Diluted 2.79 (3.03)
`
` `
Notes 2014 2013
Revenue
77,047.23 90,832.10
Total 78,790.83 92,710.71
Expenditure
Total 70,351.67 83,520.09
Profit before depreciation/amortization, finance costs and tax 8,439.16 9,190.62
Profit before tax 1,412.11 2,076.15
Tax expense
Profit after tax before minority interest 980.53 1,583.29
Profit for the year from continuing operations (A) 733.90 1,404.28
Profit/(loss) before tax from discontinued operations – (2,569.96)
Profit / (loss) after tax before share of results of associates and – (2,467.41)
minority interest from discontinued operations
Profit/(loss) for the year from discontinued operations (B) – (2,107.51)
Profit/(loss) for the year (A+B) 733.90 (703.23)
Notes forming part of the consolidated financial statements 1 - 41
As per our attached report of even date For and on behalf of the Board
MGB & Co. B.K.Goenka Braja Mishra
Mohan Bhandari S. Krishnan Pradeep Joshi
For
Chartered Accountants Chairman Managing Director
Firm Registration Number 101169W
Partner Chief Financial Officer Company Secretary
Membership Number 12912
Mumbai, 29 April 2014

62
WELSPUN Corp Limited
Notes forming part of the consolidated financial statements
Note 1: Corporate Information
Significant Accounting Policies
I Basis of Consolidation
Welspun Corp Limited (hereinafter referred to as “the Parent Company” or “the Company”) together with its subsidiaries (collectively
referred to as “the Group”) are engaged in the business of Production and Coating of High Grade Submerged Arc Welded Pipes, Hot Rolled
Steel Plates and Coils and Power Generation. Pursuant to the Scheme of Arrangement as referred in note 39, the infrastructure business
(including energy, water and road), the Direct Reduced Iron (DRI) business, Oil and Gas and EPC contracting business of the Group are
transferred to the Resulting Company, viz Welspun Enterprises Limited.
a) The consolidated financial statements (CFS) of the Group are prepared under the historical cost convention on accrual basis in
accordance with the Generally Accepted Accounting Principles in India and Accounting Standard-21 on “Consolidated Financial
Statements” issued by the Institute of Chartered Accountants of India (ICAI), to the extent possible in the same manner as that
adopted by the Parent Company for its separate financial statements by regrouping, recasting or rearranging figures, wherever
considered necessary.
b) The consolidation of the financial statements of the parent company and its subsidiaries is done on a line-by-line basis by adding
together like items of assets, liabilities, income and expenses. Figures pertaining to the subsidiary companies have been
reclassified wherever necessary to bring them in line with the Group Financial Statements. All significant inter-group
transactions, unrealized inter-company profits and balances have been eliminated in the process of consolidation. Minority
interest in subsidiaries represents the minority shareholders proportionate share of the net assets and net income.
c) CFS are prepared to the extent possible using uniform accounting policies for transactions and other events in similar
circumstances except for policy differences for which no adjustments are made in the accounts disclosed as under :-
i) In case of three subsidiaries, the liability on account of retirement benefits is provided on estimated basis as per local law
instead of actuarial basis. The liability represents 69.87 % of the total employee benefits liability of the Group as at the year
end.
ii) In case of a subsidiary, tangible assets are depreciated on written down value method representing 0.01% of total tangible
assets of the Group as at the year end.
iii) In case of a subsidiary, ancillary costs for arrangement of borrowings are amortized over the period of borrowings instead
of expensed when incurred. Unamortized balance as at 31 March 2014 is 54.55 million.
d) The CFS includes the Financial Statements of the Parent Company and the subsidiaries (as listed in the table below). Subsidiaries
are consolidated from the date on which effective control is acquired and are excluded from the date of transfer / disposal.
Welspun Pipes Limited Manufacturer of Steel Pipes India 100% (100%)
Welspun Pipes Inc SPV for Steel Pipes Business USA 100% (100%)
Welspun Tradings Limited Trading in Steel Products India 100% (100%)
Welspun Mauritius Holdings Limited SPV for Steel Pipes Business Mauritius 89.98% (89.98%)
Welspun Infratech Limited Infrastructure Development India --- (100%)
Welspun Natural Resources Private Limited Oil and Gas Exploration India --- (100%)
Welspun Maxsteel Limited Manufacturer of Sponge Iron India --- (87.35%)
Welspun Enterprises Limited SPV for Non-pipe Businesses India --- (100%)
Welspun Middle East Pipes Company LLC Manufacturer of Steel Pipes Kingdom of 50.01% (50.01%)
Saudi Arabia
Welspun Middle East Pipes Coating Company LLC Coating of Pipes Kingdom of 50.01% (50.01%)
Saudi Arabia
Welspun Middle East DMCC (upto 5 December 2013) Marketing Company Dubai, UAE --- (100%)
`
Name of the Subsidiaries Nature of Business Country of Extent of
Incorporation Holding
Direct Subsidiaries
Indirect Subsidiaries
Held through Welspun Mauritius Holdings Limited
#
#
#
#

63
WELSPUN Corp Limited
Notes forming part of the consolidated financial statements
Name of the Subsidiaries Nature of Business Country of Extent of
Incorporation Holding
Held through Welspun Pipes Inc.
Name of the Companies Nature of Business Country of Extent of
Incorporation Holding
Welspun Tubular LLC Manufacturer of Steel Pipes USA 100% (100%)
Welspun Global Trade LLC Marketing Company USA 100% (100%)
Held through Welspun Tradings Limited
Held through Welspun Natural Resources
Private Limited
Held through Welspun Infratech Limited
Held through Welspun Projects Limited
Held through Welspun Infra Projects Limited
e) Associates
f) Joint Ventures
Welspun Middle East DMCC (w.e.f 5 December 2013) Marketing Company Dubai, UAE 100% (---)
Welspun Plastics Private Limited Oil and Gas Exploration India --- (100%)
Welspun Projects Limited Infrastructure Development India --- (61.12%)
Welspun Road Projects Private Limited Infrastructure Development India --- (100%)
Welspun Infra Projects Private Limited Infrastructure Development India --- (60%)
ARSS Bus Terminal Private Limited Infrastructure Development India --- (49%)
Welspun BOT Projects Private Limited Infrastructure Development India --- (100%)
Anjar Road Private Limited Infrastructure Development India --- (100%)
MSK Projects (Himmatnagar Bypass) Private Limited Infrastructure Development India --- (100%)
MSK Projects (Kim Mandavi Corridor) Private Limited Infrastructure Development India --- (100%)
Welspun Energy Transportation Private Limited Infrastructure Development India --- (100%)
Welspun Water Infrastructure Private Limited Infrastructure Development India --- (100%)
The Group has adopted and accounted for Investment in the following Associates in this CFS using the “Equity Method” as per
AS-23 issued by ICAI.
Red Lebondal Limited SPV for Steel Pipe Marketing Cyprus 25% (25%)
Welspun Energy Limited* Power Generation India --- (26%)
Welspun Captive Power Generation Limited Power Generation India --- (24%)
The Group has adopted and accounted for interest in the following Joint Ventures in this CFS, using the “Proportionate
Consolidation Method” as per AS-27 issued by ICAI.
#
#
#
#
# Transferred pursuant to the Scheme of Arrangement (Refer note 39)
*Direct and Indirect subsidiaries of Welspun Energy Limited - (an associate company): Welspun Energy Madhya Pradesh Limited, Welspun Energy Anuppur
Private Limited , Welspun Energy UP Private Limited , Welspun Urja India Limited, Welspun Energy Chhattisgarh Limited, Welspun Renewable Energy Limited,
Welspun Urja Gujarat Private Limited, Welspun Energy Meghalaya Private Limited, Welspun Energy Jharkhand Private Limited, Welspun Energy Orissa Private
Limited, Welspun Energy Resources Private Limited, Welspun Solar Park Private Limited, Welspun Energy Park Private Limited, Welspun Solar Tech Private
Limited, Welspun Energy Maharashtra Private Limited, Welspun Energy Rajasthan Private Limited , Solarsys Renewable Energy Private Limited, Welspun Solar
Madhya Pradesh Private Limited, Welspun Solar Rajasthan Private Limited, Welspun Solar Punjab Private Limited, Welspun Solar UP Private Limited, Welspun
Solar AP Private Limited, Unity Power Private Limited, Northwest Energy Private Limited, Dreisatz Mysolar24 Private Limited, SUIL Hydro Power Private Limited,
MI Mysolar24 Private Limited, Solarsys Energy Private Limited, Welspun Solar Kannada Private Limited.
@Application filed with registrar of companies (Cyprus) for name strike off.
#Transferred pursuant to the Scheme of Arrangement (Refer note 39)
^ Ceased to be an associate (w.e.f 1 April 2013)
@
#
^

64
WELSPUN Corp Limited
Notes forming part of the consolidated financial statements
Name of the Enterprises Nature of Business Country of Extent of
Incorporation Holding
Indirect Joint Ventures
Held through Welspun Natural Resources
Private Limited
Held through Welspun Infra Projects Private Limited
Held through Welspun Projects Limited
g) Use of estimates
#
#
#
Adani Welspun Exploration Limited Oil and Gas Exploration India --- (35%)
Leighton Welspun Contractors Private Limited Infrastructure Development India --- (32.38%)
Dewas Bhopal Corridor Limited Infrastructure Development India --- (50%)
Bul MSK Infrastructure Private Limited Infrastructure Development India --- (50%)
Leighton Welspun Contractors Private Limited Infrastructure Development India --- (7.5%)
The preparation of the financial statements requires the management to make estimates and assumptions that affect the
reported amounts of assets and liabilities, disclosure of contingent liabilities as at the date of the financial statements and the
reported amount of revenue and expenses of the year. The estimates and assumptions used in the accompanying financial
statements are based upon management's evaluation of the relevant facts and circumstances as of the date of the financial
statements. The examples of such estimates include the useful life of the tangible and intangible assets, allowance for doubtful
debts/advances, future obligations in respect of retirement benefit plan etc. Actual results could differ from those estimates
and in such case the difference is recognised when known or materialised.
a) Tangible assets are stated at original cost (net of tax/duty credit availed) less accumulated depreciation, amortisation and
impairment losses except freehold land which is carried at cost. Cost includes cost of acquisition, construction and installation,
taxes, duties, freight, other incidental expenses related to the acquisition, trial run expenses (net of revenue) and pre-operative
expenses including borrowing costs incurred during pre-operational period.
b) Tangible assets which are not ready for their intended use on reporting date are carried as capital work-in-progress at cost,
comprising direct cost and related incidental expenses. In case of a Joint venture related to oil and gas business, expenditure
related to and incurred during the exploration period are included under “Capital work-in-progress” and in case of discovery,
the same will be allocated/ transferred to the respective producing properties. However, in case there is no discovery,
expenditure incurred for the exploration work will be charged to revenue.
c) Build, Operate and Transfer Project Expenditure - Project Roads pertains to the costs incurred by the Group for construction of
roads under the concession agreement entered into between the Group and the respective Authority. These agreements
encompass the construction, operation and maintenance of the highway on a Build, Operate and Transfer basis.
d) Intangible assets are carried at cost, net off accumulated amortization and impairment loss, if any.
Borrowing costs attributable to the acquisition or construction of qualifying assets are capitalized as part of cost of such assets. All
other borrowing costs are charged to revenue.
At each balance sheet date, the Group reviews the carrying amount of tangible and intangible assets to determine whether there is
any indication of impairment loss. If any such indication exists, the recoverable amount of the assets is estimated in order to
determine the extent of impairment loss. The recoverable amount is higher of the net selling price and the value in use, determined
by discounting the estimated future cash flows expected from the continuing use of the asset to their present value.
a) Depreciation on tangible assets is provided on straight line method at the rates prescribed in Schedule XIV to the Companies
# Transferred pursuant to the Scheme of Arrangement (Refer note 39)
II Tangible and intangible assets
III Borrowing costs
IV Impairment of tangible and intangible assets
V Depreciation/Amortization on tangible and intangible assets

65
WELSPUN Corp Limited
Notes forming part of the consolidated financial statements
Act, 1956 except for certain Plant and Machinery which are depreciated on the basis of estimated useful lives of 13 – 15 years.
The company is depreciating computers and mobile phones based on their useful life i.e. 4 years and 3 years respectively. The
rates of depreciation derived from these estimated useful lives are higher than those prescribed in Schedule XIV to the
Companies Act, 1956.
b) Continuous process plant has been identified on the basis of technical opinion taken by the Company / Expert and appropriate
rate of depreciation on such plant and machinery has been charged as prescribed under Schedule XIV to the Companies Act,
1956.
c) Intangible assets are amortized on a straight-line basis over its expected useful life as estimated by the management. BOT Cost
(Toll Collection right) is amortized over the period of concession, using revenue based amortization. Under this methodology,
the carrying value is amortized in the proportion of actual toll revenue for the year to projected revenue for the balance toll
period, to reflect the pattern in which the assets’ economic benefits will be consumed. At each Balance sheet date, the
projected revenue for the balance toll period is reviewed by the management. If there is any change in the projected revenue
from previous estimates, the amortization of toll collection rights is changed prospectively to reflect any change in the
estimates.
d) Leasehold improvements are amortized over the period of lease.
e) In case of revalued assets, depreciation will be provided over the residual life of the assets and the difference between the
depreciation on revalued amount and the depreciation with respect to historical cost will be recouped out of revaluation
reserve.
f) Goodwill arising out of acquisition is amortized over a period of three years from the year of acquisition. Goodwill on
consolidation is not amortized. However, the same is tested for impairment as at reporting date.
a) Investments, which are readily realisable and are intended to be held for not more than one year from the date on which such
investments are made, are classified as current investments. All other investments are classified as long-term investments.
b) Long-term investments are valued at cost less provision for diminution other than temporary, in the value of such investments.
Current investments are valued at lower of cost and fair value.
a) Sale of goods is recognized on transfer of significant risks and rewards of ownership to the customers. Export sales are
recognised on the basis of date of bill of lading. Gross sales include excise duty and adjustments for price variations, exclude
sales tax/value added tax.
b) Export benefits: Duty Entitlement Pass Book (DEPB), Focus Market and Focus Product Scheme are recognised on accrual basis.
Target plus /Duty Free Entitlement Certificate scheme of EXIM policy are recognized when utilized.
c) Revenue from services is recognized on completion of services.
d) Dividend income is recognized when the right to receive the dividend is established.
e) Interest income is recognized at the agreed rate on time proportion basis.
f)
i) When the outcome of the construction contract can be estimated reliably contract revenue and contract cost associated
with the construction contract are recognised as revenue and expense respectively by reference to the stage of completion
of the contract activity at the reporting date. The stage of completion of the contract is the proportion that the contract
cost incurred for the work performed up to the reporting date bears to the estimated total contract cost. An expected loss
on a construction contract is recognised as an expense immediately.
ii) Determination of revenue under the percentage of completion method necessarily involves making estimates by the
Group, some of which are of a technical nature, concerning, where relevant, the percentages of completion, costs to
completion, the expected revenues from the project/activity and the foreseeable losses to completion.
iii) A variation is included in contract revenue when it is probable that the customer will approve the variation and amount can
be measured reliably.
Revenue recognition-Infrastructure business
A) Revenue from Engineering, Procurement and Construction (EPC) Contracts
VI Investments
VII Revenue recognition

66
WELSPUN Corp Limited
Notes forming part of the consolidated financial statements
iv) A claim is included in contract revenue when negotiations with customer have reached an advance stage such that it is
probable that the customer will accept the claim and amount can be measured reliably.
v) Unbilled costs are carried as construction work in progress which includes installation at sites and enabling works and is
valued at cost.
Toll revenue from operations of project toll roads is recognised on the basis of actual toll collection.
i) Advances received from customers in respect of contracts are treated as liabilities and adjusted against progress billing as
per terms of the contract.
ii) Progress payments received are adjusted against receivables from customers in respect of the contract work performed.
iii) Amounts retained by the customers until the satisfactory completion of the contracts are recognized as receivables. Where
such retention has been released by the customers against submission of bank guarantee the amount so released is
adjusted against receivables from the customers and the value of bank guarantees is disclosed as contingent liability.
Inventories are valued at lower of cost and net realizable value. The basis of determining cost for various categories of inventories is
as follows:
i) Raw materials, stores and spares – Moving weighted average basis.
ii) Goods-in-process – Cost of materials plus labour and other production overheads.
iiI) Finished goods – Cost of materials plus labour, production overheads and excise duty on such goods.
i) Raw materials are valued on First-in-First-out (FIFO) basis.
ii) Stores and spares are written off in the year of purchase.
i) Transactions in foreign currency are accounted at the exchange rate prevailing on the date of such transactions. Current
monetary assets and liabilities are translated at the exchange rate prevailing at the reporting date. Non-monetary items
are carried at cost.
ii) Gains or losses arising on remittance / translations at the year- end are credited / debited to the statement of profit and
loss except treatment as per amendment to AS-11 effective till 31 March 2020 [Refer Note 29(b)].
iii) Premium / discount on derivative contracts not relating to firm commitments or highly probable forecasted transactions
and not intended for trading or speculation purpose is amortized as income or expense over the life of the contract.
Financial statements of overseas non-integral operations are translated as under:
i) Assets and liabilities are translated at the exchange rate prevailing at the end of the year. Depreciation at the same rate at
which assets are converted.
ii) Revenues and expenses at yearly average rates (except inventories at opening / closing rates as the case may be). Off
balance sheet items at year-end rates.
iii) Exchange differences arising on translation of non-integral foreign operations are accumulated in the Foreign Currency
Translation Reserve until the disposal of such operations.
The Group uses foreign currency forward contracts to hedge its risk associated with foreign currency fluctuations relating to
certain firm commitments and forecasted transactions. The Group designates these hedging instruments as cash flow hedges
and applying the recognition and measurement principles set out in Accounting Standard 30 “Financial Instruments:
Recognition and Measurement” (AS 30). The gain or loss on the effective hedges is recorded in “Hedging Reserve Account” until
B) Revenue from toll collection
C) Advances and progress payments and retention
a) Steel products business
b) Infrastructure business
A) Accounting of transactions
B) Translation and exchange rates
C) Derivative instruments and hedge accounting
VIII Inventories
IX Foreign currency transactions

67
WELSPUN Corp Limited
Notes forming part of the consolidated financial statements
the transaction is complete. The gain or loss is accounted in statement of profit and loss upon completion of the transaction or
when the hedge instrument expires or terminates or ceases to qualify for hedge accounting.
a) Short-term employee benefits are recognized as an expense at the undiscounted amount in the statement of profit and loss of
the year in which the related services are rendered.
b) Post employment and other long-term benefits are recognized as an expense in the statement of profit and loss of the year in
which the employee has rendered services. The expense is recognized at the present value of the amounts payable determined
using actuarial valuation techniques except in case of few overseas subsidiaries, liability for leave encashment and gratuity is
provided on estimated basis. Actuarial gains and losses in respect of post employment and other long-term benefits are
recognized in the statement of profit and loss. In case of three subsidiaries, the liability on account of retirement benefits is
provided on estimated basis [Refer Note 1, I (c)(i)].
c) Payments to defined contribution retirement benefit schemes are charged as an expense as and when they fall due.
In respect of employee stock options granted pursuant to the Stock Option Scheme, the intrinsic value of the options (excess of
market price of the share over the exercise price of the option) is treated as discount and accounted as employee compensation cost
over the vesting period.
a) Current income tax is calculated on the results of individual companies in accordance with local tax regulations.
b) Deferred tax is recognized subject to consideration of prudence, on timing difference, being the difference between taxable
income and accounting income that originate in one period and are capable of reversal in one or more subsequent periods and
measured using prevailing enacted or substantively enacted tax rates.
Assets acquired under finance lease are capitalised and the corresponding lease liability is recognized at lower of the fair value
of the leased assets and the present value of minimum lease payments at the inception of the lease. Initial costs directly
attributable to lease are recognized with the asset under lease.
Lease of assets under which all the risks and rewards of ownership are effectively retained by the lessor are classified as
operating leases. Lease payments/revenue under operating leases are recognized as an expense/income on accrual basis in
accordance with the respective lease agreements.
Grants and subsidies from the government are recognized when there is reasonable assurance that (a) the Group will comply with
the conditions attached to them, and (b) the grant/subsidy will be received.When the grant or subsidy relates to revenue, it is
recognized as income on a systematic basis in the statement of profit and loss over the periods necessary to match them with the
related costs, which they are intended to compensate. Where the grant relates to an asset, it is reduced from the cost of the asset.
Grants which are given as equity support are disclosed as promoter contribution under the head Capital Reserve.
Contingent liabilities are disclosed in respect of possible obligations that arise from past events but their existence will be confirmed
by the occurrence or non-occurrence of one or more uncertain future events. A provision is made when it is probable that an outflow
of resources embodying economic benefits will be required to settle an obligation and in respect of which a reliable estimate can be
made. Provision is not discounted and is determined based on best estimate required to settle the obligation at the year end date.
Contingent assets are not recognized or disclosed in the financial statements.
Basic earnings per share is computed and disclosed using the weighted average number of equity shares outstanding during the
year. Dilutive earnings per share is computed and disclosed using the weighted average number of equity and dilutive equity
equivalent shares outstanding during the year, except when the results would be anti-dilutive.
a) Finance lease
b) Operating lease
X Employee benefits
XI Employee stock options scheme
XII Accounting for taxes on income
XIV Government grants and subsidies
XV Provisions, contingent liabilities and contingent assets
XVI Earnings per share
XIII Leases

68
WELSPUN Corp Limited
Notes forming part of the consolidated financial statements
( in million)
304,000,000 (Previous year 304,000,000) Equity Shares of 5/- each 1,520.00 1,520.00
98,000,000 (Previous year 98,000,000) Preference Shares of 10/- each 980.00 980.00
262,948,299 (Previous year 262,948,299) Equity Shares of 5/- each fully paid up 1,314.74 1,314.74
At the beginning of the year 262,948,299 1,314.74 227,781,035 1,138.91
Issued during the year
– Conversion of Compusory Convertible Debentures (CCD) – – 35,038,889 175.19
– Equity shares allotted on exercise of Employees Stock Options – – 128,375 0.64
The Company has only one class of equity shares having a par value of 5 per share. Each holder of equity shares is entitled to one
vote per share, however the holders of global depository receipts (GDR's) do not have voting rights in respect of shares represented
by the GDR's till the shares are held by the custodian. The dividend when proposed by the Board of Directors is subject to the
approval of the shareholders in the ensuing Annual General Meeting.
In the event of liquidation of the company, the holders of the equity shares will be entitled to receive remaining assets of the
company, after distribution of preferential amounts. The distribution will be in proportion to the number of equity shares held by the
shareholders.
J P Morgan Chase Bank, NA ADR Account (Custodian and against
which GDR have been issued to Insight Solutions Limited) 23,026,000 8.76 23,026,000 8.76
Granele Limited 35,038,889 13.33 35,038,889 13.33
Life Insurance Corporation of India Limited & its Schemes 19,277,980 7.33 19,283,580 7.33
Welspun Wintex Limited 13,336,576 5.07 13,336,576 5.07
Welspun Mercantile Limited 14,477,701 5.51 13,877,701 5.28
Welspun Fintrade Limited – – 18,955,791 7.21
Krishiraj Trading Limited 52,862,858 20.10 26,907,692 10.23
In respect of options granted under the Welspun Employee Stock Options Scheme, in accordance with the guidelines issued by
Securities and Exchange Board of India, the value of options (based on intrinsic value of the share on the date of the grant of the
`
`
`
`
` `
`
2014 2013
Authorised
Total 2,500.00 2,500.00
Issued, subscribed and paid up
Total 1,314.74 1,314.74
a) Reconciliation of the number of shares outstanding
2014 2013
Number of in million Number of in million
Equity Shares Equity Shares
Outstanding at the end of the year 262,948,299 1,314.74 262,948,299 1,314.74
b) Terms and rights attached to equity shares
c) Shareholders holding more than 5% shares of the company
2014 2013
Name of Shareholders Number of Percentage Number of Percentage
Equity Shares (%) Equity Shares (%)
d) Employee stock options scheme
2. Share capital

69
WELSPUN Corp Limited
Notes forming part of the consolidated financial statements
option) is accounted as deferred employee compensation, which is amortized on a straight line basis over the vesting period.
Employee benefits expense include credit of 0.73 million (Previous year 6.60 million) on account of reversal of options lapsed
during the year.
Stock options outstanding as at the year end are as follows:
Exercise price 80.00 66.75
Date of grant 8 January 2007 20 April 2009
Vesting period commences on 8 January 2008 20 April 2010
Options outstanding at the beginning of the year – 32,875
Options exercised during the year – –
Options lapsed during the year – 32,875
Options outstanding as at 31 March 2014 – –
( in million)
95 shares of Series 'A' Convertible Preferred Stock (''Convertible Shares'' with
voting rights) of Welspun Pipes Inc. (USA) issued to Insight Solutions (DE). LP. 1,076.44 –
( in million)
As per last balance sheet 1,057.26 1,057.26
Add/(Less): Transferred pursuant to the Scheme of Arrangement (Refer note 39-B) (1,057.26) –
152.92 152.90
As per last balance sheet 25,264.84 17,252.74
Add/(Less): Transferred pursuant to the Scheme of Arrangement (Refer note 39-B) (17,587.92) –
Received during the year – 8,053.37
Discount on issue of shares under employees stock option scheme – 3.43
Premium on redemption of foreign currency convertible bonds (28.35) 11.70
Utilized towards share/debenture issue expenses – (56.40)
As per last balance sheet 1,142.36 1,464.29
Add/(Less): Transferred to surplus in statement of profit and loss** – (321.92)
As per last balance sheet 1,265.38 1,265.38
Add/(Less): Transferred pursuant to the Scheme of Arrangement (Refer note 39-B) (1,265.38) –
As per last balance sheet 6,564.12 6,564.12
Add/(Less): Transferred pursuant to the Scheme of Arrangement (Refer note 39-B) (6,564.12) –
` `
` `
`
`
Granted during Granted during
2006-07 2009-10
2014 2013
Total 1,076.44 –
2014 2013
Capital reserve
– 1,057.26
Capital reserve on consolidation
Securities premium
7,648.56 25,264.84
Debenture redemption reserve
1,142.36 1,142.36
Cash subsidy
– 1,265.38
Revaluation reserve
– 6,564.12
2.1 Share capital (Other than equity)
3. Reserves and surplus

70
WELSPUN Corp Limited
Notes forming part of the consolidated financial statements
( in million)
93.01 –
– 0.73
51.50 (44.84)
(509.32) (275.37)
1,254.66 680.94
As per last balance sheet 1,749.20 1,696.11
Add/(Less): Transferred pursuant to the Scheme of Arrangement (Refer note 39-B) (1,696.11) –
Loss on dilution – (3.19)
Appropriated during the year – 56.27
As per last balance sheet 17,705.39 18,296.99
Add/(Less): Transferred pursuant to the Scheme of Arrangement (Refer note 39-B) (902.66) –
Profit/(loss) for the year 733.90 (703.23)
( in million)
Redeemable non-convertible debentures 13,428.00 13,428.00 – –
Non-convertible bonds - City of Little Rocks, Arkansas, 505.88 482.05 26.16 22.35
Series 2007-A
External commercial borrowings 4,194.05 7,188.08 – 2,721.68
Term loans from banks 5,954.05 19,745.91 547.32 1,366.33
Term loan from financial institution 471.39 513.96 95.88 65.15
Other loans 18.66 27.73 7.43 6.04
Foreign currency convertible bonds – 4,424.23 4,493.63 –
Finance lease obligation 29.62 – 21.95 –
Inter-corporate deposit 3,432.89 3,110.31 – –
Deferred sales tax loan - 610.49 16.69 16.69
`
`
2014 2013
Statutory reserve
Employees stock options outstanding
Hedging reserve account [Refer note 29(c)]
Foreign currency monetary item translation difference account [Refer Note 29(b)]
Foreign currency translation reserve
General reserve
53.09 1,749.20
Surplus in the statement of profit and loss
Non-current Current
2014 2013 2014 2013
Secured
Unsecured
Total 28,034.54 49,530.77 5,209.06 4,198.24
3. Reserves and surplus (Contd.)
4. Long-term borrowings
17,536.63 17,593.76
Add/(Less): Appropriations
Total appropriations (245.82) 111.63
Net surplus in the Statement of Profit and Loss 17,290.82 17,705.39
Total 27,177.60 55,262.91
Statutory reserve (93.01) –
General reserve – (56.27)
Transfer from debenture redemption reserve** – 321.92
Proposed dividend on equity shares (131.47) (131.47)
Tax on proposed dividend (22.34) (22.34)
Dividend on equity shares of earlier year – (0.20)
Excess provision of tax on dividend of earlier year written back 1.02 –
**No debenture redemption reserve is created in view of loss incurred during the year

71
WELSPUN Corp Limited
Notes forming part of the consolidated financial statements
a) The debentures together with interest are secured by first charge ranking pari passu by way of mortgage/hypothecation of entire
immovable and movable tangible assets of the Company, both present and future and second/floating charge on current assets,
subject to prior charge in favour of banks for working capital facilities.
No. of Debentures Face value Redemption Rate of Amount
( ) date interest (p.a.) ( in million)
Total 13,428
The ECB is repayable as follows:
Repayment schedule USD Amount
(million) ( in million)
Total 70.00 4,194.05
Term loan from banks
In case of subsidiary in USA:
Term loan from financial institution:
In case of subsidiary in Kingdom of Saudi Arabia:
Foreign currency convertible bonds (FCCB)
` `
`
`
5000 1,000,000 September 2025 9.55% 5,000
5000 1,000,000 August 2025 9.55% 5,000
900 1,000,000 November 2022 11.00% 900
328 1,000,000 September 2019 11.15% 328
250 1,000,000 August 2019 11.25% 250
1950 1,000,000 August 2019 11.15% 1,950
b ) External commercial borrowings (ECB) is secured by first charge ranking pari passu by way of mortgage/hypothecation of entire
immovable and movable tangible assets of the Company both present and future. The ECB comprises of USD 70 million (Previous
year USD 163.45 million) and JPY Nil (Previous year JPY 677.65 million) and carries interest of LIBOR plus 3.50% to 4.50%.
April 2015 2.70 161.77
October 2015 2.70 161.77
April 2016 4.00 239.66
October 2016 14.00 838.81
April 2017 4.00 239.66
October 2017 14.00 838.81
April 2018 4.00 239.66
October 2018 14.00 838.81
April 2019 5.30 317.55
October 2019 5.30 317.55
c)
ii) Term loan of 4,718.90 million (Previous year 4,737.45 million) from bank carries interest ranging
LIBOR plus 2.71 % to 4.46%. The loan is repayable from June 2014 till November 2018.
d)
Term loan of 567.27 million (Previous year 579.11 million) from Financial
Institution. The loan is repayable from June 2013 till October 2018 [Repayment due within 12 months is 95.88 million
( 65.15 million)].
e)
i) During the financial year 2009 - 2010, the Company had raised US$ 150 million (Equivalent INR 6,942 million) by way of issue of
1500, 4.5% FCCB of US$ 100,000 each. The Bond holders have an option to convert outstanding bonds (Previous year USD 75.00
million) into 12,005,000 equity shares of 5 each fully paid up at an initial conversion price of 300 per share with a fixed rate of
exchange on conversion of 48.02 = US$ 1 at any time on or after 26 November 2009 until 10 days prior to Maturity date
(i.e. 17 October 2014). Unless previously converted, redeemed or repurchased and cancelled, the Bonds will be redeemed on
i) Term loan of US$ 29.75 million equivalent to 1,782.47 million (Previous year 1,614.98 million)
from bank is secured by first charge ranking pari passu by way of mortgage/hypothecation of entire movable and immovable
tangible assets of the Company and second charge over the entire current assets of the company both, present and future. The
loan carries interest of LIBOR plus 5.00%. The loan is repayable in 18 equal quarterly instalments after a moratorium of
30 months from the date of first disbursement i.e. 15 November 2012.
In case of Parent Company: ` `
`
` `
`
`
` `
`

72
WELSPUN Corp Limited
Notes forming part of the consolidated financial statements
17 October 2014 at 102.8028% of the principal amount so as to give a gross yield of 5% per annum (calculated on semi annual
basis) to the Bond holders.
The Company has an option to redeem the Bonds at their Early Redemption amount upon occurrence of events specified in the
Offering Circular for issue of the Bonds (“Offering Circular”). Further, the Company has an option to mandatorily convert the
Bonds after three years as specified in the Offering Circular.
ii) Premium payable on redemption of FCCB aggregating to 28.35 million (Previous year credit of 11.70 million) has been
adjusted against securities premium as per Section 78 of the Companies Act, 1956. In the event, Bond holders exercise the
conversion option, the amount of premium utilized from securities premium will be suitably adjusted in respective years.
iii) During the year, the company has repurchased 65, 4.5% FCCB of US$ 100,000 each aggregating to US$ 6.50 million at a discount
and gain of 12.46 million arising on repurchase of FCCB is shown under "Other income".
iv) Part of the net proceeds received from the issue of FCCB has been utilized as per objects of the issue viz for funding of Plate and
Coil Mill, Pipe Mill Capex Projects (Anjar and Mandya) and Investment in overseas subsidiary. Pending utilization, the balance
issue proceeds of USD 0.40 million equivalent INR 23.97 million (Previous year USD 0.55 million equivalent INR 30.09 million)
have been invested in short term deposits.
( in million)
Fiscal allowance on fixed assets 6,603.52 7,132.83
Others 174.43 93.63
Employee benefits 13.13 18.51
Other disallowances 65.98 737.27
Unabsorbed fiscal allowances 1,089.98 568.90
Fiscal allowance on fixed assets – 301.87
Fiscal allowance on fixed assets – 66.09
Other disallowances – 22.21
( in million)
Liability towards claims 997.58 1,764.26
Trade advances and deposits 189.83 479.64
Other liabilities – 27.10
( in million)
Employee benefits 92.18 167.24
Premium payable on redemption of FCCB – 83.48
` `
`
`
`
`
2014 2013
Deferred tax liabilities
6,777.95 7,226.47
Deferred tax assets
1,169.08 1,626.56
Total 5 (a) 5,608.87 5,599.91
Deferred tax assets
Total 5 (b) – 88.30
2014 2013
Total 1,187.41 2,271.00
2014 2013
Total 92.18 250.72
5. (a) Deferred tax liabilities (net)
(b) Deferred tax assets (net)
6. Other long-term liabilities
7. Long-term provisions

73
WELSPUN Corp Limited
Notes forming part of the consolidated financial statements
( in million)
Working capital loans from banks 1,770.95 2,043.41
(Secured by first charge on hypothecation of raw materials, finished goods and
goods-in-process, stores & spares and book debts of the group and second charge on
entire immovable and movable tangible assets of the group both present and future.)
Short-term loan from banks 2,396.60 –
( in million)
Acceptances 4,736.58 21,286.94
Others 1,351.12 9,092.71
( in million)
Current maturities of long-term borrowings (Refer note 4) 5,209.06 4,198.24
Interest accrued but not due on borrowings 657.26 880.64
Interest accrued and due on borrowings – 4.69
Unclaimed dividend 5.35 5.30
Share application money pending allotment – 52.45
Acceptances for capital goods 185.58 –
Creditors for
- Capital goods 105.28 179.76
- Expenses 1,278.07 1,974.32
Trade advances and deposits 2,790.63 8,143.64
Statutory dues 338.04 799.82
Liability towards claims 1,054.75 815.22
Others 0.96 316.45
( in million)
Employee benefits 39.68 155.39
Proposed equity dividend 131.47 131.47
Tax on proposed equity dividend 22.34 22.34
Litigation 79.79 79.79
Liquidated damages 33.50 460.52
Mark to market losses on derivative contracts 311.52 336.51
Premium payable on redemption of FCCB 111.83 –
Taxation (Net of advances) 182.12 156.49
Other provisions 0.75 1.41
`
`
`
`
2014 2013
Secured
Unsecured
Total 4,167.55 2,043.41
2014 2013
Total 6,087.70 30,379.65
2014 2013
Other payables
Total 11,624.97 17,370.53
2014 2013
Others for
Total 913.02 1,343.93
8. Short-term borrowings
9. Trade payables
10. Other current liabilities
11. Short-term provisions

74
WELSPUN Corp Limited
No
tes
form
ing
pa
rt o
f th
e c
on
soli
da
ted
fin
an
cia
l st
ate
me
nts
No
te 1
2 -
Fix
ed
ass
ets
(in
mil
lio
n)
`
Gro
ss B
lock
De
pre
cia
tio
n/A
mo
rtiz
ati
on
Ne
t B
lock
As
at
De
me
rge
rA
s a
tA
cqu
ire
dA
dd
itio
ns
Ad
dit
ion
Fore
ign
De
du
ctio
ns
Ast
at
Up
toD
em
erg
er
As
at
Acq
uir
ed
For
the
Fore
ign
De
du
ctio
ns
Imp
air
me
nt
Up
toA
s a
tA
s a
t
1 A
pri
lA
dju
st-
1 A
pri
lo
nD
ue
to
Cu
rre
ncy
31
Ma
rch
31
Ma
rch
Ad
just
-1
Ap
ril
on
Yea
rC
urr
en
cy3
1 M
arc
h3
1 M
arc
h3
1 M
arc
h
20
13
me
nts
20
13
(P
ost
Acq
uis
itio
nR
ev
alu
ati
on
Flu
ctu
ati
on
s2
01
42
01
3m
en
ts2
01
3 (
Po
stA
cqu
isit
ion
Flu
ctu
ati
on
s2
01
42
01
42
01
3
De
me
rge
r)D
em
erg
er)
a)
Tan
gib
lea
sse
ts
Tota
l (a
)8
1,0
24
.87
(18
,13
7.8
1)
62
,88
7.0
6–
3,4
77
.08
–2
,29
5.0
38
98
.15
67
,76
1.0
31
6,8
26
.97
(2,3
60
.20
)1
4,4
66
.77
–3
,97
0.1
93
99
.12
14
1.1
41
2.4
51
8,7
07
.38
49
,05
3.7
46
4,1
97
.10
b)
Inta
ng
ible
ass
ets
Tota
l (b
)1
7,4
19
.19
(16
,75
6.4
8)
66
2.7
1–
55
.26
–1
5.3
0–
73
3.2
71
,40
2.7
2(9
56
.36
)4
46
.36
–9
4.2
31
5.3
0–
–5
55
.90
17
7.3
81
6,0
16
.47
Tota
l (a
+ b
)9
8,4
44
.06
(34
,89
4.2
9)
63
,54
9.7
7–
3,5
32
.35
–2
,31
0.3
38
98
.15
68
,49
4.3
01
8,2
29
.69
(3,3
16
.55
)1
4,9
13
.14
–4
,06
4.4
24
14
.42
14
1.1
41
2.4
51
9,2
63
.28
49
,23
1.1
28
0,2
13
.57
Ca
pit
al
wo
rk–
in–
pro
gre
ss1
,14
5.7
35
,27
5.8
4
Inta
ng
ible
ass
ets
un
de
r
de
ve
lop
me
nt
Lan
d–
Fre
eh
old
1,0
97
.75
(63
7.7
9)
45
9.9
6–
23
.88
–2
6.9
2–
51
0.7
6–
––
––
––
––
51
0.7
61
,09
7.7
5
Lan
d–
Lea
seh
old
4,9
44
.69
(2,9
66
.70
)1
,97
8.0
0–
88
.99
–1
38
.14
70
6.9
91
,49
8.1
42
98
.37
(18
.60
)2
79
.77
–1
00
.89
23
.33
55
.88
–3
48
.10
1,1
50
.04
4,6
46
.33
Bu
ild
ing
s1
0,6
63
.48
(90
9.8
7)
9,7
53
.62
–8
10
.00
–4
67
.45
0.6
11
1,0
30
.46
1,2
61
.49
(47
.46
)1
,21
4.0
2–
36
1.4
64
8.2
40
.04
–1
,62
3.6
99
,40
6.7
79
,40
2.0
0
Pla
nt
an
d M
ach
ine
ry6
2,4
51
.07
(12
,91
1.0
0)
49
,54
0.0
7–
2,4
18
.90
–1
,59
9.6
01
58
.13
53
,40
0.4
41
4,2
89
.82
(1,8
57
.56
)1
2,4
32
.26
–3
,39
0.4
12
98
.83
70
.89
12
.26
16
,06
2.8
73
7,3
37
.57
48
,16
0.4
5
Co
nst
ruct
ion
Ass
ets
23
8.9
0(2
38
.90
)–
––
––
–1
30
.30
(13
0.3
0)
––
––
––
––
10
8.6
0
Off
ice
an
d o
the
r E
qu
ipm
en
ts9
54
.02
(14
5.9
5)
80
8.0
7–
12
0.8
3–
47
.57
13
.05
96
3.4
24
55
.57
(79
.18
)3
76
.39
–9
4.2
22
0.1
71
.36
0.0
34
89
.44
47
3.9
84
98
.45
Ve
hic
les
39
2.1
1(2
62
.22
)1
29
.89
–(1
3.5
5)
6.6
51
8.4
91
04
.51
27
1.5
8(2
05
.16
)6
6.4
2–
(6.1
0)
3.8
61
2.7
90
.01
51
.40
53
.11
12
0.5
3
Fu
rnit
ure
an
d F
ixtu
res
25
0.9
3(3
3.4
6)
21
7.4
7–
28
.03
–8
.69
0.8
82
53
.31
10
9.3
1(1
1.4
0)
97
.91
–2
9.3
24
.69
0.1
80
.15
13
1.8
91
21
.42
14
1.6
1
Lea
seh
old
Im
pro
vem
en
ts3
1.9
2(3
1.9
2)
––
––
––
–1
0.5
4(1
0.5
4)
––
––
––
––
21
.38
Go
od
wil
l1
63
.26
(15
.74
)1
47
.52
––
–1
5.3
0–
16
2.8
21
59
.44
(11
.92
)1
47
.52
––
15
.30
––
16
2.8
20
.00
3.8
2
Go
od
wil
l o
n C
on
soli
da
tio
n1
0,6
55
.83
(10
,65
5.7
4)
0.0
9–
4.5
9–
––
4.6
8–
––
––
––
–4
.68
10
,65
5.8
3
So
ftw
are
54
6.0
9(3
1.0
0)
51
5.1
0–
50
.68
––
–5
65
.77
31
6.6
0(1
7.7
6)
29
8.8
4–
94
.23
––
–3
93
.07
17
2.7
02
29
.49
Bu
ild
, O
pe
rate
an
d T
ran
sfe
r6
,05
4.0
0(6
,05
4.0
0)
––
––
––
–9
26
.67
(92
6.6
7)
––
––
––
––
5,1
27
.33
(BO
T)
Pre
vio
us
yea
r8
0,6
85
.42
22
7.9
98
,63
3.7
58
,45
3.6
41
,13
4.3
86
91
.13
98
,44
4.0
61
3,4
42
.99
10
6.1
44
,76
6.9
21
79
.44
37
1.9
01
06
.09
18
,22
9.6
98
0,2
13
.57
18
8.6
2(1
88
.62
)–
––
––
––
––
––
––
––
–1
88
.62
No
tes
1)
Gro
ss b
lock
of
Pla
nt
an
d M
ach
ine
r y i
ncl
ud
es
63
.49
mil
lio
n (
Pr e
vio
us
yea
r6
3.4
9 m
illi
on
) in
re
spe
ct o
f e
xpe
nd
itu
r e o
n c
ap
ita
l a
sse
t, o
wn
ers
hip
of
wh
ich
do
es
no
t v e
st w
ith
th
e G
r ou
p.
2)
De
pre
cia
tio
n a
nd
am
ort
isa
tio
n e
xpe
nse
fo
r th
e y
ea
r in
clu
de
s1
.42
mil
lio
n (
Pre
vio
us
yea
r5
.71
mil
lio
n)
tra
nsf
err
ed
to
pre
-op
era
tive
exp
en
ses.
3)
Re
fer
No
te 2
9 (
b)
f or
exc
ha
ng
e d
iffe
ren
ce c
ap
ita
lise
d/d
ec a
pit
ali
sed
as
pe
r a
me
nd
ed
AS
11
.
4)
Pre
-op
era
tive
exp
en
ses
of
18
.81
mil
lio
n (
Pr e
vio
us
yea
r5
2.6
0 m
illi
on
) h
ave
be
en
ca
pit
ali
zed
wit
h r
ela
ted
pro
ject
s d
uri
ng
th
e y
ea
r.
5)
Bo
rro
win
g c
ost
s a
llo
cate
d t
o f
ixe
d a
sse
ts /
ca
pit
al
wo
rk-i
n-p
r og
ress
du
rin
g t
he
ye
ar
is1
2.0
9 m
illi
on
(P
r ev
iou
s ye
ar
35
5.9
1 m
illi
on
).
``
``
``
``
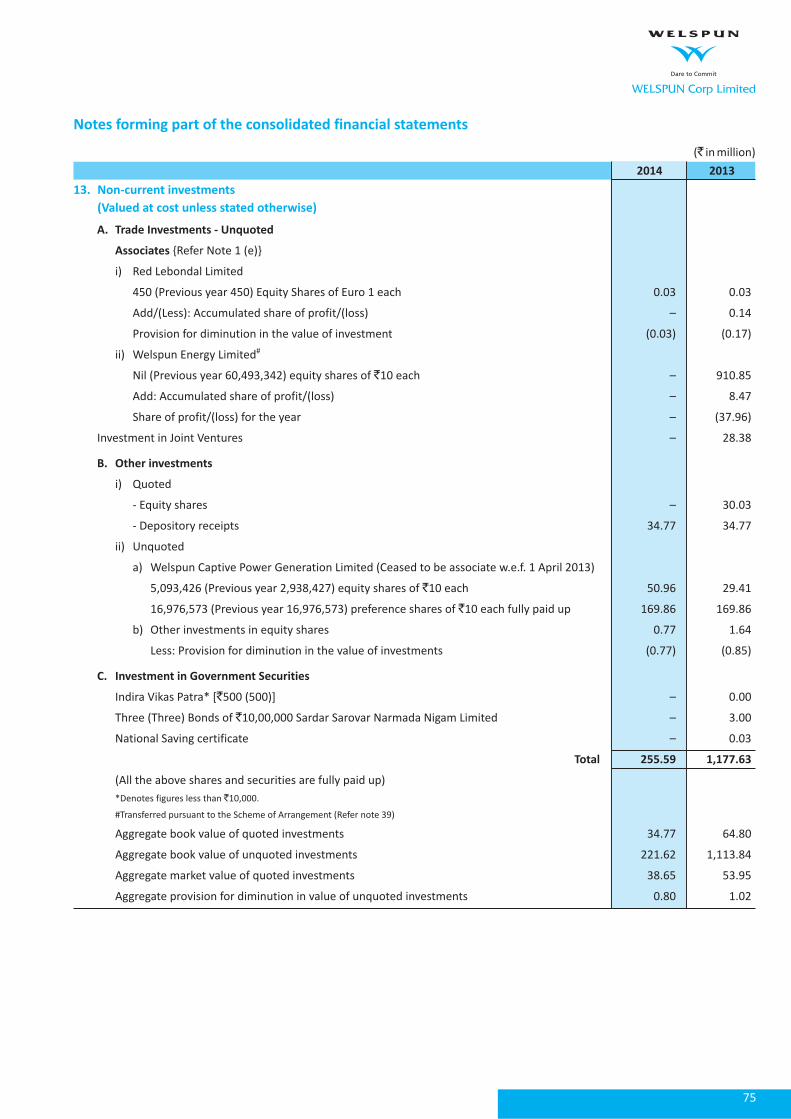
75
WELSPUN Corp Limited
Notes forming part of the consolidated financial statements
( in million)
{Refer Note 1 (e)}
i) Red Lebondal Limited
450 (Previous year 450) Equity Shares of Euro 1 each 0.03 0.03
Add/(Less): Accumulated share of profit/(loss) – 0.14
Provision for diminution in the value of investment (0.03) (0.17)
ii) Welspun Energy Limited
Nil (Previous year 60,493,342) equity shares of 10 each – 910.85
Add: Accumulated share of profit/(loss) – 8.47
Share of profit/(loss) for the year – (37.96)
Investment in Joint Ventures – 28.38
i) Quoted
- Equity shares – 30.03
- Depository receipts 34.77 34.77
ii) Unquoted
a) Welspun Captive Power Generation Limited (Ceased to be associate w.e.f. 1 April 2013)
5,093,426 (Previous year 2,938,427) equity shares of 10 each 50.96 29.41
16,976,573 (Previous year 16,976,573) preference shares of 10 each fully paid up 169.86 169.86
b) Other investments in equity shares 0.77 1.64
Less: Provision for diminution in the value of investments (0.77) (0.85)
Indira Vikas Patra* [ 500 (500)] – 0.00
Three (Three) Bonds of 10,00,000 Sardar Sarovar Narmada Nigam Limited – 3.00
National Saving certificate – 0.03
(All the above shares and securities are fully paid up)
Aggregate book value of quoted investments 34.77 64.80
Aggregate book value of unquoted investments 221.62 1,113.84
Aggregate market value of quoted investments 38.65 53.95
Aggregate provision for diminution in value of unquoted investments 0.80 1.02
`
`
`
`
`
`
2014 2013
A. Trade Investments - Unquoted
Associates
B. Other investments
C. Investment in Government Securities
Total 255.59 1,177.63
#
*Denotes figures less than 10,000.
#Transferred pursuant to the Scheme of Arrangement (Refer note 39)
`
13. Non-current investments
(Valued at cost unless stated otherwise)

76
WELSPUN Corp Limited
Notes forming part of the consolidated financial statements
( in million)
( in million)
( in million)
`
`
`
2014 2013
2014 2013
2014 2013
14. Long-term loans and advances
(Unsecured considered good unless otherwise stated)
15. Other non-current assets
(Unsecured considered good unless otherwise stated)
16. Current investments
(Valued at lower of cost and fair value, unless stated otherwise)
Capital advances 45.63 1,715.11
Less: Provision for doubtful advances 4.32 2.96
- Related parties 348.08 309.60
- Others 110.77 279.48
Less: Provision for doubtful deposits 2.70 9.46
Share application money – 21.55
Other loans and advances 36.08 32.69
Advances recoverable in cash or kind 120.80 1,221.03
Prepaid expense 5.51 62.65
Loan to employees – 0.08
Balances with government authorities
- Direct tax (net) 40.00 502.63
- Indirect taxes 0.08 114.05
Minimum alternative tax credit entitlement 185.44 205.63
Long-term trade receivables (including trade receivables on deferred credit terms) – 291.70
Interest receivable – 3.55
Margin money deposits 59.50 87.23
Others – 0.42
i) Bonds 9,876.84 15,391.02
ii) Certificate of deposits 981.97 1,236.27
iii) Mutual funds 283.73 280.97
Bonds – 585.33
Aggregate book value of quoted investments 11,142.54 16,908.26
Aggregate book value of unquoted investments – 585.33
Aggregate market value of quoted investments 11,393.91 17,107.31
41.31 1,712.15
Deposits
456.15 579.62
Loans and advances to related parties
36.08 54.24
Other loans and advances
351.83 2,106.07
Total 885.37 4,452.08
Total 59.50 382.90
A. Quoted
B. Unquoted
Total 11,142.54 17,493.59

77
WELSPUN Corp Limited
Notes forming part of the consolidated financial statements
( in million)
( in million)
( in million)
`
`
`
2014 2013
2014 2013
2014 2013
17. Inventories
18. Trade receivables
(Unsecured)
19. Cash and bank balances
Cash and cash equivalents
Raw materials [includes goods-in-transit 27.66 million (Previous year 3,408.23 million)] 4,723.02 13,872.33
Goods-in-process 1,371.64 3,299.48
Finished goods 4,555.98 6,340.35
Stores and spares 2,164.68 2,156.66
Considered good 227.42 1,903.32
Considered doubtful 53.76 131.50
Considered good 6,179.88 15,710.70
Considered doubtful – 8.01
Less: Provision for doubtful debts 53.76 139.51
- Current accounts 831.02 5,739.99
- Deposits having original maturity period of less than three months 23.97 376.54
Cheques on hand – 1.18
Cash on hand 2.00 22.61
Balances with banks - Escrow accounts 1.59 112.78
Unclaimed dividend accounts 5.35 5.30
Deposits having original maturity period of more than three months 51.88 143.01
but less than twelve months
Margin money deposits 531.36 587.33
` `
Total 12,815.32 25,668.82
Over six months
Others
6,461.05 17,753.53
Total 6,407.30 17,614.02
Balances with banks
Other bank balances
Total 1,447.16 6,988.74

78
WELSPUN Corp Limited
Notes forming part of the consolidated financial statements
( in million)
( in million)
( in million)
`
`
`
2014 2013
2014 2013
2014 2013
20. Short-term loans and advances
(Unsecured considered good unless otherwise stated)
21. Other current assets
22. Revenue from operations
Deposits
Other loans and advances
3,162.85 5,754.10
Total 2,937.57 5,500.23
Interest accrued on
Other receivables from
Total 1,969.60 3,869.24
Revenue from
Revenue from operations (Gross) 78,153.35 95,111.47
Revenue from operations (Net) 77,047.23 90,832.10
- Related parties – 37.28
- Others 0.89 89.88
Inter-corporate deposits – 356.37
Advances recoverable in cash or kind 727.54 1,430.01
Balance with government authorities
- Direct tax (net) – 251.09
- Indirect taxes 2,105.42 3,358.39
Prepaid expenses 225.52 213.45
Loans and advances to employees 103.48 17.62
Less: Provision for doubtful advances 225.28 253.86
- Current investments 305.61 303.50
- Fixed deposits 22.00 33.61
- Others 26.75 34.65
Receivable towards claim 45.72 400.58
Export benefits receivable 711.17 887.69
Unbilled work-in-progress – 2,129.32
Unamortized ancillary borrowing costs 54.55 60.38
Assets held for disposal 4.19 19.49
- Related parties 675.39 –
- Other parties 124.22 –
Sale of products 73,967.54 89,464.01
Other operating revenues (Refer note 37) 4,185.81 5,647.47
Less: Excise duty 1,106.12 4,279.37

79
WELSPUN Corp Limited
Notes forming part of the consolidated financial statements
( in million)
( in million)
( in million)
( in million)
`
`
`
`
2014 2013
2014 2013
2014 2013
2014 2013
23. Other income
24. Cost of materials consumed
25. Changes in inventories of finished goods and goods-in-process
26. Employee benefits expenses (Net) {Refer note 38 (b)}
Interest from
Total 1,743.60 1,878.61
51,244.72 68,044.03
Total 46,549.36 59,430.41
Inventories at the end of the year
5,927.62 9,075.86
Inventories at the beginning of the year
9,075.86 9,818.28
Total 3,148.24 742.41
Total 5,313.15 4,624.57
- Current investments 923.55 571.97
- Fixed deposits 81.57 120.30
- Others 403.48 279.09
Dividend income 12.87 249.46
Profit on sale of current investments 207.81 332.25
Miscellaneous income 114.30 325.53
Inventory at the beginning of the year 8,613.62 8,525.14
Add: Purchases 42,631.10 59,518.89
Less: Inventory at the end of the year 4,695.37 8,613.62
Goods-in-process 1,371.64 3,290.32
Finished goods 4,555.98 5,785.55
Goods-in-process 3,290.32 1,630.45
Finished goods 5,785.55 8,187.83
Salaries, wages and bonus 4,775.53 4,265.46
Contribution to provident and other funds 200.32 113.31
Employee compensation expenses (0.73) (6.60)
Staff welfare expenses 338.03 252.40
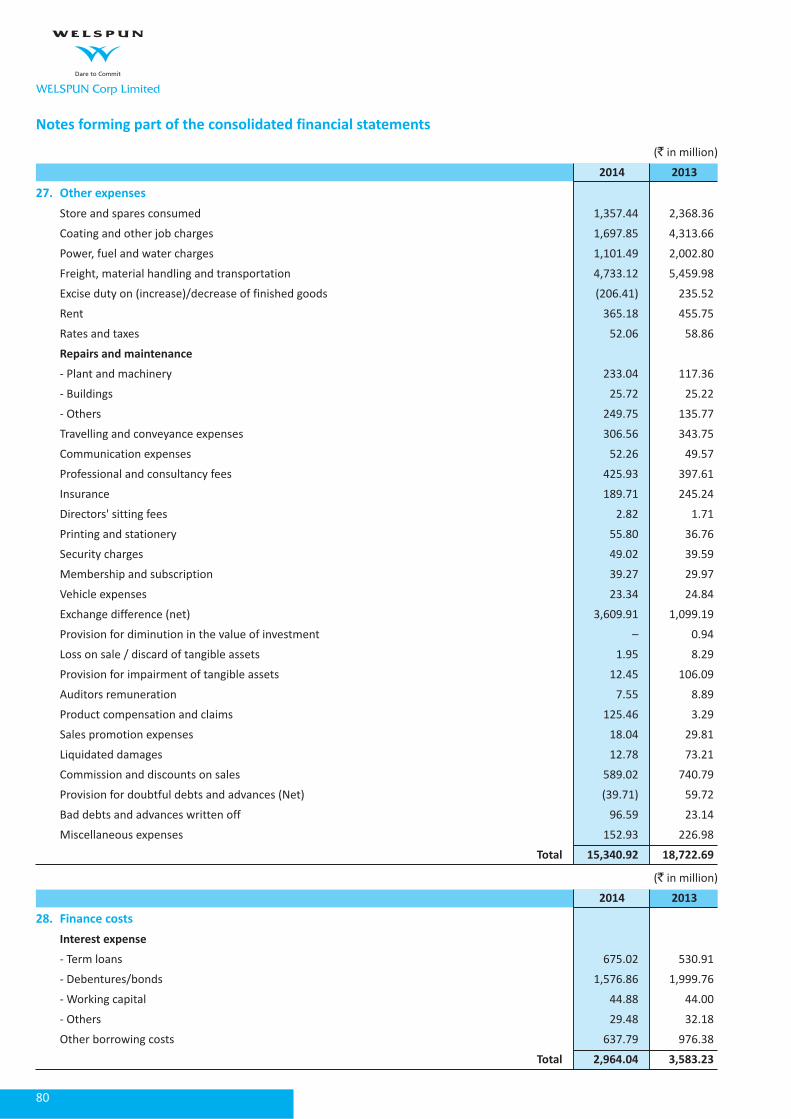
80
WELSPUN Corp Limited
Notes forming part of the consolidated financial statements
( in million)
( in million)
`
`
2014 2013
2014 2013
27. Other expenses
28. Finance costs
Store and spares consumed 1,357.44 2,368.36
Coating and other job charges 1,697.85 4,313.66
Power, fuel and water charges 1,101.49 2,002.80
Freight, material handling and transportation 4,733.12 5,459.98
Excise duty on (increase)/decrease of finished goods (206.41) 235.52
Rent 365.18 455.75
Rates and taxes 52.06 58.86
- Plant and machinery 233.04 117.36
- Buildings 25.72 25.22
- Others 249.75 135.77
Travelling and conveyance expenses 306.56 343.75
Communication expenses 52.26 49.57
Professional and consultancy fees 425.93 397.61
Insurance 189.71 245.24
Directors' sitting fees 2.82 1.71
Printing and stationery 55.80 36.76
Security charges 49.02 39.59
Membership and subscription 39.27 29.97
Vehicle expenses 23.34 24.84
Exchange difference (net) 3,609.91 1,099.19
Provision for diminution in the value of investment – 0.94
Loss on sale / discard of tangible assets 1.95 8.29
Provision for impairment of tangible assets 12.45 106.09
Auditors remuneration 7.55 8.89
Product compensation and claims 125.46 3.29
Sales promotion expenses 18.04 29.81
Liquidated damages 12.78 73.21
Commission and discounts on sales 589.02 740.79
Provision for doubtful debts and advances (Net) (39.71) 59.72
Bad debts and advances written off 96.59 23.14
Miscellaneous expenses 152.93 226.98
- Term loans 675.02 530.91
- Debentures/bonds 1,576.86 1,999.76
- Working capital 44.88 44.00
- Others 29.48 32.18
Other borrowing costs 637.79 976.38
Repairs and maintenance
Total 15,340.92 18,722.69
Interest expense
Total 2,964.04 3,583.23

81
WELSPUN Corp Limited
Notes forming part of the consolidated financial statements
29. Foreign exchange differences
30. Finance Lease
31. Operating lease
a) Loss on account of difference in foreign exchange on realignment/realization and on cancellation of derivative instruments
amounting to 3,609.91 million (Previous year 1,099.19 million) is shown in other expenses other than (b) below.
b) The Companies (Accounting Standards) Amendment Rules 2011 has amended the provision of AS-11 related to "The effects of
changes in Foreign Exchange Rates" vide notification dated 11 May 2011 (as amended on 29 December 2011 and further
clarification dated 9 August 2012) issued by the Ministry of Corporate Affairs. Accordingly, the Group has adjusted exchange
difference loss amounting to 344.23 million (Previous year 361.90 million) to the cost of fixed assets and capital work-in-
progress and exchange difference loss of 946.89 million (Previous year 648.88 million) is transferred to "Foreign Currency
Monetary Item Translation Difference Account" to be amortized over the balance period of such long term liabilities. Out of the
above, loss of 437.57 million (Previous year 373.50 million) has been adjusted in the current year and loss of 509.32 million
(Previous year 275.37 million) has been carried over and disclosed in shareholders funds.
c) The Group has adopted AS-30 as referred to in Note 1 (i) of the Significant Accounting Policies and accordingly gain of 51.50
million (Previous year loss of 44.84 million) related to foreign exchange difference on Cash Flow Hedges for certain firm
commitments and forecasted transactions is recognized in Shareholders’ Funds and shown as Hedging Reserve Account.
Long-term leases, which in economic terms constitute investments financed on a long term basis (finance lease) are recognized as
assets and recorded under tangible fixed assets at their cash purchase value. The minimum lease payments required under this
finance lease that have initially or remaining non-cancellable lease terms in excess of one year as at 31 March 2014 and its present
value are as follows:
( in million)
Not later than one year 23.97 –
Later than one year but not later than five years 31.90 –
Less: Amount representing interest 4.30 –
Present value of minimum lease payment 51.57 –
Amount due not later than one year 21.95 –
The Group leases office, residential facilities, equipment etc. under operating lease agreements that are renewable on a periodic
basis at the option of both the lessor and the lessee. The initial tenure of lease is generally for eleven months to one twenty months.
( in million)
Lease rental charges for the year 365.18 455.75
Future lease rental obligations payable (under non-cancellable leases)
Not later than one year 73.28 91.18
Later than one year but not later than five years 15.67 159.18
Later than five years 0.15 20.49
` `
` `
` `
` ` `
`
`
`
`
`
2014 2013
Minimum lease payments as at
Total 55.87 –
2014 2013

82
WELSPUN Corp Limited
Notes forming part of the consolidated financial statements
32 a) Contingent liabilities not provided for
33. Taxation
34. Segment reporting
( in million)
Performance guarantees/Bid bond given by banks to Group’s customers / 9,306.49 15,630.87
government authorities etc.
Corporate guarantees given by the group 1,871.47 3,580.76
Bills discounted – 146.11
Letters of credit outstanding (net of liability provided) for Group’s sourcing 9,257.32 4,087.02
Claims against the Group not acknowledged as debts 570.62 450.54
Custom duty on pending export obligation against import of Raw Materials and Machineries 380.81 1,387.25
Disputed direct taxes* 2,000.26 2,009.47
Disputed indirect taxes 84.78 100.73
`
2014 2013
*Income tax demands mainly include appeals filed by the Group before appellate authorities against disallowances i.e. depreciation/claims/deductions. The
management is of the opinion that its tax disputes will be decided in its favour and no material tax liability is likely to be sustained, hence no provision is considered
necessary.
The Group has challenged before CESTAT, the order of Commissioner of Customs (Kandla) for duty evasion of 8,609.82 million
(Previous year 8,609.82 million) on account of alleged wrong classification of imported raw materials along with penalty of
8,609.82 million (Previous year 8,609.82 million) and penalty of 205 million (Previous year 205 million) on directors and
officers of the Company. On the same matter and under a different proceeding, the additional DGFT, during the year imposed a
penalty of 8,609.82 million (Previous year Nil) which has been unconditionally stayed by the Bombay High Court on petition
filed by the Company. Based on DGFT’s clarification that, irrespective of whether it is alloy or non-alloy steel, if the grade of
import and export is same, the licence can be redeemed. The Joint DGFT, Vadodara has confirmed that the grade of import and
export is same, hence the whole amount of duty and penalty referred above may not be sustained and is not considered as
contingent liability. However in any case, out of the above, 6,706.60 million (Previous year 6,706.60 million) is cenvatable
duty which is revenue neutral and may not result into recoverable demand and accordingly relevant amount of penalty may not
sustain.
i) Estimated amount of contracts remaining to be executed on capital account (net of advances) is 120.42 million
(Previous year 280.26 million).
ii) Other long-term commitments is 2,288.64 million (Previous year 3,244.28 million).
iii) The parent company has committed to provide continued need based financial support to its subsidiaries .
i) Current income tax is calculated on the results of individual companies in accordance with local tax regulations.
ii) The Company's management is of the opinion that its international and domestic transactions are at arm's length as per the
independent accountants report for the year ended 31 March 2013. Management continues to believe that its international
transactions post March 2014 and the specified domestic transactions covered by the new regulations are at arm's length and
that the transfer pricing legislation will not have any impact on these financial statements, particularly on amount of tax
expense and that of provision of taxation.
The Group follows AS 17- Segment reporting relating to the reporting of financial and descriptive information about their operating
segments in financial statements.
b)
c) Capital and other commitments
`
`
` ` ` `
` `
` `
`
`
` `

83
WELSPUN Corp Limited
Notes forming part of the consolidated financial statements
a) Secondary segments - Geographical segments
Notes:
a) List of parties where control exists:
b) Joint ventures
c) Associates
e) Directors /Key Management Personnel
Revenue from operations 14,183.67 62,863.56 77,047.23 22,717.16 68,114.94 90,832.10
Carrying amount of segment assets 57,769.40 30,527.40 88,296.81 127,049.48 41,864.10 168,913.59
Capital expenditure 1,412.56 743.78 2,156.34 2,692.21 4,873.13 7,565.33
a) Segment revenue in the geographical segments considered for disclosure is as follows:
- Revenue within India includes sales to customers located within India.
- Revenue outside India includes sales to customers located outside India.
b) Segment assets include the respective amounts identified to each of the segments and amounts allocated on a reasonable
basis.
c) Capital expenditure also includes expenditure incurred on capital work-in-progress and capital advances.
The list of subsidiaries is disclosed in Note 1, I (d) above.
The list of joint ventures is disclosed in note 1 I (f) above
The list of associates is disclosed in note 1 I (e) above
d) Other related parties with whom transactions have taken place during the year and balances outstanding as on the last day of
the year.
Welspun India Limited, Welspun Steel Limited, RMG Alloy Steel Limited (Formerly Remi Metal Gujarat Limited), Welspun Retail
Limited, Welspun Anjar SEZ Limited, Welspun Foundation for Health and Knowledge, Welspun Syntex Limited, Vipuna Trading
Limited, Welspun Logistics Limited, Welspun Realty Private Limited, Welspun Global Brands Limited, Welspun Projects Limited,
Welspun Captive Power Generation Limited, Welspun Energy Limited, Welspun Enterprises (Cyprus) Limited, Welspun
Enterprises Limited, Leighton Welspun Contractors Private Limited (Upto 07 February 2014), Welspun Marine Logistics Limited,
Welspun Developers and Infrastructure Private Limited, Welspun Infra Development and Management Private Limited,
Welspun Wintex Private limited, Welspun Fin Trade Private Limited, Welspun Mercantile Limited.
( in million)
B. K. Goenka Chairman
R. R. Mandawewala Director
Braja Mishra Managing Director
`
2014 2013
India Outside Total India Outside Total
India India
Name Nature of Relationship
35. Related party disclosures

84
WELSPUN Corp Limited
Notes forming part of the consolidated financial statements
f) Transactions with related parties for the year ended 31 March 2014
– – 837.67 – 837.67
– – 9.03 – 9.03
– – – – –
– – 356.74 – 356.74
– – 180.77 – 180.77
– – 646.05 – 646.05
– – 61.20 – 61.20
– – 0.60 – 0.60
– – 6.60 – 6.60
– – – – –
– – – – –
– – 21.55 – 21.55
– – – – –
– – 21.55 – 21.55
– – – 40.29 40.29
g) Balances with related parties for the year ended 31 March 2014
– – 348.08 83.01 431.09
– – 1,871.47 – 1,871.47
– 0.03 221.59 – 221.62
– – – – –
– – 72.11 – 72.11
– – 32.20 – 32.20
– – 675.39 – 675.39
Sale of goods and services
– (407.47) (1,808.52) – (2,216.00)
Other income
– – (11.98) – (11.98)
Sale of shares
– – (0.16) – (0.16)
Purchase of goods and services
– (241.23) (236.28) – (477.51)
Purchase of fixed assets
– – – – –
Sale of fixed assets
– – (4.84) – (4.84)
Rent and license fees paid
– – (85.48) – (85.48)
Donation paid
– – (80.75) – (80.75)
Reimbursement of expenses paid (Net)
– (13.34) – (13.34)
Loans, advances and deposits received
– – (13.50) – (13.50)
Loans, advances and deposits received repaid
– – (9.87) – (9.87)
Investment in shares
– (799.56) (0.10) – (799.66)
Share application money given
– (8.00) – – (8.00)
Share application money given repaid / adjusted
– (881.21) – – (881.21)
Directors remuneration
– – – (156.22) (156.22)
Loans and advances, deposits given
– – (346.88) – (346.88)
Corporate guarantees given
(2,624.98) (3,579.30) (1.46) – (6,205.75)
Investment in shares
– (1,110.15) (0.77) – (1,110.92)
Share application money given
– (21.55) – – (21.55)
Trade receivables
– (67.00) (67.03) – (134.03)
Trade payables
– (26.93) (118.85) – (145.78)
Other receivables
– – – – –
( in million)
( in million)
`
`
Joint Associates Other Key Total
Venture Related Management
Parties Personnel
Joint Associates Other Key Total
Venture Related Management
Parties Personnel

85
WELSPUN Corp Limited
Notes forming part of the consolidated financial statements
Disclosure in respect of transactions which are more than 10% of the total transactions of the same type with related parties
during the year
Closing balances as at 31 March 2014
Note: Figures in brackets pertain to previous year.
i) Sale of goods and services - Welspun India Limited 174.08 million ( 1,269.28 million), Welspun Steel Limited 208.42
million ( 515.90 million), Welspun Captive Power Generation Limited 48.13 million ( 407.47 million)
ii) Other income includes guarantee commission received from Welspun Energy Limited 4.39 million ( Nil), Welspun
Captive Power Generation Limited 4.63 million ( Nil), RMG Alloy Steel Limited Nil ( 11.29 million)
iii) Purchase of goods and services - Welspun Logistics Limited 38.76 million ( 61.78 million), Welspun Captive Power
Generation Limited 302.37 million ( 241.23 Million), Welspun Steel Limited 6.52 million ( 165.80 million)
iv) Purchase of fixed assets - Welspun Projects Limited 180.77 million ( Nil)
v) Sale of fixed assets - Welspun India Limited Nil ( 4.37 million), Welspun Anjar SEZ Limited 646.05 million ( Nil)
vi) Rent and license fee paid - Welspun Realty Private Limited 58.17 million ( 76.66 million)
vii) Donation paid - Welspun Foundation for Health and Knowledge 0.60 Million ( 80.75 million) (meant for corporate social
responsibility activities).
viii) Reimbursement of expenses (paid) / recovered (net) includes recovered from Welspun Captive Power Generation Limited
15.28 million ( 10.71 million), Welspun Steel Limited 1.31 million ( 34.66 million), Welspun Syntex Limited 0.80 million
( 13.10 million) and paid to Welspun India Limited 25.70 million ( 51.37 million)
ix) Loans and advances received from Welspun India Limited Nil ( 13.50 million)
x) Loans and advances received and repaid to Welspun India Limited Nil ( 9.87 million)
xi) Investment in shares - Welspun Captive Power Generation Limited 21.55 million ( 151.45 million),Welspun Energy
Limited Nil ( 648.11 million)
xii) Sale of shares Nil (Equity shares of Dahej Infrastructure Private Limited and Welspun Infra Development and
Management Private Limited to other related parties 0.16 million)
xiii) Share application money given to Welspun Captive Power Generation Limited Nil ( 8.00 million)
xiv) Share application money given includes repaid / adjusted by Welspun Energy Limited Nil ( 699.76 million), Welspun
Captive Power Generation Limited 21.55 million ( 181.45 million)
xv) Details of remuneration paid to key management personnels are disclosed at note 38 below.
i) Loans, advances and deposits given- Welspun Realty Private Limited 284.48 million ( 284.48 million), Welspun Logistics
Limited 52.40 million ( 52.40 million), recoverable from Managing Director 83.01 million ( Nil).
ii) Corporate guarantees given - Welspun Captive Power Generation Limited 600 million ( 600 million), Welspun Energy
Limited 1,270 million ( 1,270 million), Welspun Urja Gujarat Private Limited Nil ( 1,709.30 million), Adani Welspun
Exploration Limited Nil ( 2,624.98 million).
iii) Investments held -Welspun Captive Power Generation Limited 220.82 million ( 199.27 million), Welspun Energy Limited
Nil ( 910.85 million).
iv) Share application money given - Welspun Captive Power Generation Limited Nil ( 21.55 million).
v) Trade receivables - Welspun Steel Limited 56.12 million ( 40.15 million), Welspun Captive Power Generation Limited
Nil ( 67 million), Welspun India Limited 5.11 million ( 15.24 million).
vi) Trade payables - Welspun Captive Power Generation Limited 22.27 million ( 26.93 million), Welspun Projects Limited
8.06 Million ( Nil),Welspun Steel Limited Nil ( 21.19 million),Welspun India Limited Nil ( 41.62 million), Welspun
Anjar SEZ Limited Nil ( 50.18 million).
vii) Other receivables - Welspun Enterprises Limited 69.37 million ( Nil) , Welspun Anjar SEZ Limited 595.87 million ( Nil).
` ` `
` ` `
` `
` ` ` `
` `
` ` ` `
` `
` ` ` `
` `
` `
` ` ` ` `
` ` `
` `
` `
` `
` `
`
`
` `
` `
` `
` `
` ` ` `
` `
` ` ` `
` `
` `
` `
` `
` `
` ` ` `
` `
` ` ` ` ` `
` `
` ` ` `

86
WELSPUN Corp Limited
Notes forming part of the consolidated financial statements
36. Earnings per share (EPS)
37. Other operating revenues
38. Managerial remuneration
39. Scheme of Arrangement
( in million)
( in million)
2014 2013
2014 2013
Name Relation 2014 2013
`
`
733.90 (703.23)
a) For Basic EPS (Nos.) 262,948,299 231,836,824
b) For Diluted EPS (Nos.) 262,948,299 231,836,824
Basic and Diluted ( )* 2.79 (3.03)
Scrap sales 1,218.50 1,437.23
Value added tax incentive 727.90 1,359.68
Export benefits 992.76 977.02
Insurance claim – 1,273.04
Excess provisions written back 100.54 –
Others 1,146.11 600.50
a) Remuneration paid/provided to the directors is as under:
B. K. Goenka Chairman – 17.38
R. R. Mandawewala Director – 0.83
Braja Mishra Managing Director 40.29 138.01
b) Application made to the Central Government in the year 2012-13 for appointment and remuneration payable to the Managing
Director, was approved in March 2014, albeit with a lower remuneration than applied. Consequently, payments made to
the Managing Director, based on the agreement and shareholders’ approval, has turned out to be in excess of the limits,
specified u/s. 198 read with Schedule XIII of the Companies Act, 1956 and the aforesaid Central Government approval for the
financial year 2012-13 by 83.01 million and the same is netted in employee benefits expense. The Managing Director holds
the said amount in trust and it is refundable to the Company.
a) A Scheme of Arrangement between Welspun Corp Limited ("WCL" or the "Demerged Company") and Welspun Enterprises
Limited ("WEL" or a wholly owned subsidiary of WCL or the Resulting Company) and their respective shareholders and
creditors (the “Scheme”), providing for inter alia transfer of Other Business undertakings {viz. the infrastructure business
(including energy, water, road), the direct reduced iron ore (DRI), EPC contracting, oil and gas business} of WCL to WEL, was
approved by the Hon'ble High Court of Gujarat at Ahmedabad on 10 January 2014. The Scheme became effective on
24 January 2014 on filing with the Registrar of Companies and consequently all the assets and liabilities of the Other
Business undertakings of WCL have been transferred by WCL with respective book values w.e.f. appointed date 1 April
2012. The Scheme has been given effect to in these financial statements. However certain assets are under transfer in
transferee's name, hence held in the Company's name till then.
I) Profit after tax for diluted EPS ( in million)
II) Weighted average number of equity shares for EPS computation
III) EPS on Face Value of 5/- each
Total 4,185.81 5,647.47
Total 40.29 156.22
A. In case of parent company
`
`
`
`
*Foreign currency convertible bonds, Compulsory convertible debentures and Employee stock options plan are anti-dilutive and ignored in the calculation of
diluted earnings per share.

87
WELSPUN Corp Limited
Notes forming part of the consolidated financial statements
b) Pursuant to the Scheme:
i) The whole of the assets and liabilities of Other Business undertakings of WCL are transferred to/and are vested with
WEL with effect from 1 April 2012 at book values and adjusted to the reserves as under:
( in Million)
i) Non-current investments 13,242.36
ii) Loans and advances (including interest receivable and share application money) 2,779.60
iii) Current investments 6,640.00
iv) Cash and bank balances 1,310.00
i) Capital reserve 1,057.26
ii) Securities premium 17,252.74
iii) General reserve 1,696.11
iv) Surplus in the statement of profit and loss 3,965.85
ii) WEL to issue and allot equity shares to each member of WCL in the ratio of one equity share(s) of 10 each in WEL credited
as fully paid up for every 20 equity shares of 5 each fully paid up held by such member in WCL. Accordingly, WEL to issue
and allot 13,147,415 equity shares of 10 each to the members of WCL.
iii) The investment in equity shares of WEL of 0.5 million held by WCL has been cancelled and adjusted against surplus in the
statement of profit and loss.
iv) The net profit after tax of 25.97 million for the period from appointed date i.e. 1 April 2012 to 31 March 2013 is adjusted in
balance in the statement of profit and loss.
The whole of the assets and liabilities of Other Business undertakings of Group are transferred to WEL with effect from 1 April
2012 and the excess of assets over liabilities of 29,073.45 million has been adjusted to the reserves as under:
( in million)
i) Capital reserve 1,057.26
ii) Securities premium 17,587.92
iii) Cash subsidy 1,265.38
iv) Revaluation reserve 6,564.12
v) General reserve 1,696.11
vi) Surplus in the statement of profit and loss (Net of loss for the year 2012-13 of 2,107.52 million) 902.66
A Scheme of Arrangement between Welspun Corp Limited ("WCL" or the "Demerged Company") and Welspun Enterprises Limited
("WEL" or a wholly owned subsidiary of WCL and the Resulting Company) and their respective shareholders and creditors (the
“Scheme”) as referred in Note 39 was approved by the Hon'ble High Court of Gujarat at Ahmedabad on 10 January 2014. The Scheme
became effective on 24 January 2014 on filing with the Registrar of Companies and consequently all the assets and liabilities of the
Other Business undertakings of WCL have been transferred by WCL with respective book values w.e.f. appointed date 1 April 2012.
`
`
`
`
`
`
`
`
`
23,971.97
Adjustment to reserves
23,971.97
B. In consolidated financial statements
29,073.45
40. Discontinued Operations

88
WELSPUN Corp Limited
Notes forming part of the consolidated financial statements
( in million)
( in million)
`
`
Continuing Total Continuing Total
As at As at
31 March 2014 31 March 2013
For the Year ended 31 March 2014 For the Year ended 31 March 2013
Discontinued Discontinued
operations operations operations operations
Total Revenue 78,790.83 – 78,790.83 92,710.71 19,100.20 111,810.90
Total Expenses 77,378.71 – 77,378.71 90,634.56 20,579.29 111,213.85
Profit / (Loss) before tax 1,412.11 – 1,412.11 2,076.15 (2,569.96) (493.82)
Profit / (loss) after tax 980.53 – 980.53 1,583.29 (2,467.41) (884.12)
Profit / (Loss) for the year 733.90 – 733.90 1,404.28 (2,107.51) (703.23)
Revenue from operations 77,047.23 – 77,047.23 90,832.10 17,868.40 108,700.50
Other Income 1,743.60 – 1,743.60 1,878.61 1,231.80 3,110.40
Total expenses other than finance costs 74,414.68 – 74,414.68 87,051.33 19,231.75 106,283.08
Finance costs 2,964.04 – 2,964.04 3,583.23 1,347.54 4,930.77
Profit / (Loss) before exceptional items 1,412.11 – 1,412.11 2,076.15 (1,479.09) 597.05
and tax
Less: Exceptional items – – – – 1,090.87 1,090.87
Tax expenses 431.58 – 431.58 492.86 (102.55) 390.31
Add / (Less) : Share of profit/(loss) – – – – (37.96) (37.96)
from associates
Add / (Less) : Minority interest (246.63) – (246.63) (179.01) 397.86 218.85
The carrying amount of assets and liabilities pertaining to the discontinued operations are as follows:
Total assets – 56,872.92
Total liabilities – 27,799.42
Previous years figures have been regrouped, reclassified wherever necessary to correspond with current year's classification /
disclosures. The CFS is not comparable, in view of subsidiaries incorporated/acquired/divested during the current and previous year.
41. Comparatives
As per our attached report of even date For and on behalf of the Board
MGB & Co. B.K.Goenka Braja Mishra
Mohan Bhandari S. Krishnan Pradeep Joshi
For
Chartered Accountants Chairman Managing Director
Firm Registration Number 101169W
Partner Chief Financial Officer Company Secretary
Membership Number 12912
Mumbai, 29 April 2014

89
WELSPUN Corp Limited
As per our attached report of even date For and on behalf of the Board
MGB & Co. B.K.Goenka Braja Mishra
Mohan Bhandari S. Krishnan Pradeep Joshi
For
Chartered Accountants Chairman Managing Director
Firm Registration Number 101169W
Partner Chief Financial Officer Company Secretary
Membership Number 12912
Mumbai, 29 April 2014
( in million)`
2014 2013
A) Cash flow from operating activities
Profit / (loss) before tax (including profit before tax from discountinued operations) 1,412.11 (493.81)
Adjustments for:
Operating profit before working capital changes 6,351.83 4,321.60
Adjustments for:
Cash generated from operations 2,313.47 1,198.10
Net cash from operating activities (A) 1,884.53 1,025.30
B) Cash flow from investing activities
Net cash used in investing activities (B) (1,221.59) (1,671.88)
C) Cash flow from financing activities
Net cash used in financing activities (C) (5,138.51) (2,647.81)
Net changes in cash and bank balances (A+B+C) (4,475.57) (3,294.39)
Cash and bank balances at the end of the year 1,447.16 6,988.74
Notes:
2014 2013
Depreciation and amortization expense 4,063.01 4,761.21
Interest expense 2,326.24 3,824.34
Interest income (1,408.61) (1,919.69)
Loss on sale/discard of tangible assets (Net) 1.95 18.61
Provision for impairment of tangible assets 12.45 106.09
Profit on sale of current investments (207.81) (368.00)
Dividend income (12.87) (277.23)
Income from transfer of business – (650.15)
Dilution of stake in joint venture – 55.18
Provision for doubtful debts and advances (Net) (39.68) 96.22
Provision for diminution in value of non-current investments – 0.94
Employee compensation expenses (Net) (0.73) (6.60)
Exchange adjustments (Net) 205.76 (825.51)
Trade and other receivables 9,952.39 (3,950.57)
Inventories 10,215.45 (36.40)
Trade and other payables (24,206.20) 863.48
Direct taxes paid (net of refunds) (428.94) (172.80)
Purchase of fixed assets (including capital work-in-progress) (1,666.11) (6,878.34)
Sale of fixed assets 92.39 300.62
Investment in joint venture and associates – 36.32
Divestment of stake in joint venture – 0.06
Sale/(purchase) of current investments (Net) (1,086.76) 2,304.98
(Increase)/decrease in share application money given – (21.55)
Dividend received 12.87 277.23
Interest received 1,426.01 2,308.80
Proceeds from issue of equity shares (including securities premium) – 10.27
Proceeds from issue of preference shares by subsidiary 1,076.44 –
Proceeds from issue of debentures – 3,371.60
Redemption of debentures – (1,700.00)
Repurchase of foreign currency convertible bonds (352.85) (3,484.94)
Proceeds from long-term borrowings (Net) 38.09 11,926.46
Repayment of long-term borrowings (Net) (6,027.43) (5,048.43)
Increase/(decrease) in short-term borrowings (Net) 2,989.62 (3,744.73)
Payment to minority shareholders on acquisition of stake in Subsidiary (3.44) –
Dividend paid to minority shareholders of Subsidiary (151.88) –
Dividend paid (including corporate dividend tax) (152.74) (132.47)
Interest paid (2,554.32) (3,845.57)
Cash and bank balances at the beginning of the year 6,988.74 10,255.37
Cash and bank balances transferred pursuant to the Scheme of Arrangement (1,066.01) –
Cash and bank balances taken over on acquisition of subsidiaries and joint venture – 27.77
1. Cash and bank balances at the end of the year include unrealised gain of 2.48 million (Unrealized loss of 8.76 million) which is on account of realignment ofcurrent account/fixed deposits held in foreign currency.
2. Transactions pursuant to the Scheme of Arrangement as referred in note 39 is not considered in the above cash flow statement, being non-cash transactions.
3. Cash and bank balances include 538.30 million ( 716.89 million) which is not available for use by the company.
4. Cash flow in respect of ordinary activities attributable to discontinued operations
Cash and bank balances transferred pursuant to the Scheme of Arrangement (Refer Note 39) – 3,488.26
Cash flow from operating activities – 809.55
Cash flow used in investing activities – (1,264.36)
Cash flow used in financing activities – (1,967.43)
5. Previous year's figures have been regrouped/recast wherever necessary.
` `
` `
Consolidated Cash Flow Statement for the year ended 31 March

90
WELSPUN Corp Limited
Sta
tem
en
t p
urs
ua
nt
to g
en
era
l e
xem
pti
on
un
de
r S
ect
ion
21
2 (
8)
of
the
Co
mp
an
ies
Act
,19
56
, re
lati
ng
to
Su
bsi
dia
ry C
om
pa
nie
s(
in m
illi
on
)`
Sr.
Na
me
of
the
Su
bsi
dia
ry C
om
pa
ny
Re
po
rtin
gC
ap
ita
lR
ese
rve
sTo
tal
Gro
ssTo
tal
Gro
ssIn
ve
stm
en
tTu
rno
ve
rP
rofi
t/P
rov
isio
nP
rofi
t/P
rop
ose
dC
ou
ntr
y
No
.C
urr
en
cya
nd
Sh
are
Ass
ets
oth
er
tha
nLi
ab
ilit
ies
(Lo
ss)
for
(Lo
ss)
Div
ide
nd
Ap
pli
cati
on
Inv
est
me
nt
be
fore
Taxa
tio
na
fte
r
Mo
ne
yin
Taxa
tio
nTa
xati
on
Pe
nd
ing
Su
bsi
dia
ry
All
otm
en
t
1W
els
pu
n P
ipe
s In
cU
SD
1,0
38
.50
20
0.9
62
,93
4.2
96
,71
3.3
15
,01
8.4
8–
15
.18
–1
5.1
8–
De
law
are
(U.S
)
2W
els
pu
n T
ub
ula
r LL
CU
SD
–7
,06
9.7
22
1,2
73
.18
14
,20
3.4
6–
21
,85
1.9
59
74
.27
39
4.8
75
79
.41
–D
ela
wa
re
(U.S
)
3W
els
pu
n G
lob
al
Tra
de
LLC
US
D–
(46
.19
)3
06
.64
35
2.8
3–
15
2.0
00
.86
–0
.86
–D
ela
wa
re
(U.S
)
4W
els
pu
n P
ipe
s Li
mit
ed
INR
0.5
0(0
.07
)5
96
.59
59
6.1
5–
–(0
.07
)–
(0.0
7)
–In
dia
5W
els
pu
n T
rad
ing
s Li
mit
ed
INR
50
.13
38
5.8
54
,18
1.9
73
,74
5.9
9–
21
,38
6.1
11
07
.53
35
.66
71
.87
–In
dia
6W
els
pu
n M
au
riti
us
Ho
ldin
gs
US
D3
,97
0.4
13
15
.01
4,8
02
.44
51
7.0
2–
–2
77
.73
30
.17
24
7.5
6–
Ma
urt
ius
Lim
ite
d
7W
els
pu
n M
idd
le E
ast
DM
CC
US
D3
.36
(75
.28
)1
4.8
28
6.7
3–
–(4
9.3
2)
–(4
9.3
2)
–D
ub
ai
8W
els
pu
n M
idd
le E
ast
Pip
es
SA
R1
,21
5.1
83
96
.83
7,9
33
.52
6,3
21
.51
–8
,79
6.1
42
56
.23
59
.74
19
6.4
9–
Sa
ud
i
Co
mp
an
y L
LCA
rab
ia
9W
els
pu
n M
idd
le E
ast
Pip
es
SA
R5
39
.55
(15
9.2
8)
2,6
00
.95
2,2
20
.68
–7
44
.43
(13
2.8
6)
11
.53
(14
4.3
9)
–S
au
di
Co
ati
ng
Co
mp
an
y L
LCA
rab
ia
#
#
#
#
#
#
#
#th
e f
ina
nci
al
sta
tem
en
ts o
f th
e f
ore
ign
su
bsi
dia
rie
s h
ave
be
en
co
nve
rte
d i
nto
In
dia
n R
up
ee
s a
t th
e 3
1st
Ma
rch
20
14
exc
ha
ng
e r
ate
(1
US
$ =
59
.91
5)
`
For
an
d o
n b
eh
alf
of
the
Bo
ar d
B.K
.Go
en
ka
Bra
ja M
ish
ra
S.
Kri
shn
an
Pra
de
ep
Jo
shi
Ch
air
ma
nM
an
ag
ing
Dir
ect
or
Ch
ief
Fin
an
cia
l O
ffic
er
Co
mp
an
y S
ecr
eta
ry
Mu
mb
ai,
29
Ap
ril
20
14

91
WELSPUN Corp Limited
Independent Auditor's Report
Report on the Financial Statements
Management's Responsibility for the Financial Statements
Auditor's Responsibility
Opinion
Emphasis of Matter
Report on Other Legal and Regulatory Requirements
To the Members of
We have audited the accompanying financial statements of (“the company”) which comprise of balance sheet as
at 31 March 2014, the statement of profit and loss, the cash flow statement for the year ended on that date and a summary of significant
accounting policies and other explanatory information.
Management is responsible for the preparation of these financial statements that give a true and fair view of the financial position,
financial performance and cash flows of the Company in accordance with the Accounting Standards referred to in sub-section (3C) of
section 211 of the Companies Act, 1956 (“the Act”) read with the General Circular 15/2013 dated 13 September 2013 of the Ministry of
Corporate Affairs in respect of section 133 of the Companies Act, 2013 and other accounting principles generally accepted in India. This
responsibility includes the design, implementation and maintenance of internal control relevant to the preparation and presentation of
the financial statements that give a true and fair view and are free from material misstatement, whether due to fraud or error.
Our responsibility is to express an opinion on these financial statements based on our audit. We conducted our audit in accordance with
the Standards on Auditing issued by the Institute of Chartered Accountants of India (“ICAI”). Those Standards require that we comply with
ethical requirements and plan and perform the audit to obtain reasonable assurance about whether the financial statements are free
from material misstatement.
An audit involves performing procedures to obtain audit evidence about the amounts and disclosures in the financial statements. The
procedures selected depend on the auditor's judgement, including the assessment of the risks of material misstatement of the financial
statements, whether due to fraud or error. In making those risk assessments, the auditor considers internal control relevant to the
Company's preparation and fair presentation of the financial statements in order to design audit procedures that are appropriate in the
circumstances, but not for the purpose of expressing an opinion on the effectiveness of the entity's internal control. An audit also
includes evaluating the appropriateness of accounting policies used and the reasonableness of the accounting estimates made by
management, as well as evaluating the overall presentation of the financial statements.
We believe that the audit evidence we have obtained is sufficient and appropriate to provide a basis for our audit opinion.
In our opinion and to the best of our information and according to the explanations given to us, the financial statements give the
information required by the Act in the manner so required and give a true and fair view in conformity with the accounting principles
generally accepted in India:
a. in the case of the balance sheet, of the state of affairs of the company as at 31 March 2014;
b. in the case of the statement of profit and loss, of the loss of the company for the year ended on that date; and
c. in the case of the Cash Flow statement, of the cash flows of the company for the year ended on that date.
We draw attention to Note 45(b) of the financial statements, relating to remuneration paid to the Managing Director of the Company for
the financial year 2012-13, which turned out to be in excess by 83.01 million considering the limits approved by the Central
Government. The Managing Director holds the said amount in trust and is refundable to the Company. Our Opinion is not qualified in
respect of this matter.
1. As required by the Companies (Auditor's Report) Order, 2003 (“the Order") issued by the Central Government of India in terms of
sub-section (4A) of section 227 of the Act, we give in the Annexure a statement on the matters specified in paragraphs 4 and 5 of the
Order.
Welspun Corp Limited
Welspun Corp Limited
`

92
WELSPUN Corp Limited
2. As required by section 227(3) of the Act, we report that:
(i) We have obtained all the information and explanations which to the best of our knowledge and belief were necessary for the
purpose of our audit;
(ii) in our opinion proper books of account as required by law have been kept by the Company so far as appears from our
examination of those books;
(iii) the balance sheet, statement of profit and loss, and cash flow statement dealt with by this report are in agreement with the
books of account;
(iv) In our opinion, the balance sheet, the statement of profit and loss and the cash flow statement dealt with by this report comply
with the applicable Accounting Standards referred to in sub-section (3C) of section 211 of the Act read with the General Circular
15/2013 dated 13 September 2013 of the Ministry of Corporate Affairs in respect of section 133 of the Companies Act, 2013;
(v) On the basis of written representation received from the directors and taken on record by the Board of Directors, none of the
directors is disqualified as on 31 March 2014, from being appointed as a director in terms of Section 274(1)(g) of the Act;
For
Chartered Accountants
Firm Registration Number 101169W
Partner
Membership Number 12912
Mumbai, 29 April 2014
MGB & Co
Mohan Bhandari

93
WELSPUN Corp Limited
Annexure referred to in Paragraph 1 under the heading of “Report on Other Legal and Regulatory
Requirements” of our report of even date
(i) In respect of its fixed assets:
(a) The Company has maintained proper records showing full particulars including quantitative details and situation of fixed assets.
(b) As explained to us, all the fixed assets have been physically verified by the management in a phased manner, which in our
opinion is reasonable, having regard to the size of the Company and the nature of its assets. No material discrepancies were
noticed on such physical verification during the year.
(c) In our opinion, the Company has not disposed off a substantial part of its fixed asset during the year and the going concern
status of the Company is not affected
(ii) In respect of its inventories:
(a) The inventories have been physically verified by the management during the year except stock lying with the third parties in
respect of whom confirmations have been obtained. In our opinion, the frequency of verification is reasonable.
(b) In our opinion and according to the information and explanations given to us, the procedures of physical verification of
inventories followed by the management are reasonable and adequate in relation to the size of the Company and the nature of
its business.
(c) The Company has maintained proper records of inventories. As explained to us, no material discrepancies were noticed on
physical verification of inventories as compared to the book records.
(iii) (a) The Company has not granted any loans, secured or unsecured, to companies, firms or other parties covered in the register
maintained under section 301 of the Act.
(b) The Company has not taken any loans, secured or unsecured, from companies, firms or other parties covered in the register
maintained under section 301 of the Act.
(iv) In our opinion and according to the information and explanations given to us, there is an adequate internal control system
commensurate with the size of the Company and the nature of its business for the purchases of inventory, fixed assets and for the
sale of goods and services. During the course of our audit, we have not observed any continuing failure to correct major weaknesses
in the internal controls systems in respect of the aforesaid areas.
(v) According to the information and explanations given to us, there are no contracts or arrangements the particulars of which are
required to be entered in the register maintained under section 301 of the Act.
(vi) In our opinion and according to the information and explanations given to us, the Company has not accepted any deposits from the
public during the year.
(vii) In our opinion, the Company has an internal audit system commensurate with the size and nature of its business.
(viii) We have broadly reviewed the cost records maintained by the Company pursuant to the Companies (Cost Accounting Records)
Rules, 2011 prescribed by the Central Government under Section 209(1)(d) of the Act and are of the opinion that prima facie the
prescribed cost records have been maintained. We have, however, not made a detailed examination of the cost records with a view
to determine whether they are accurate or complete.
(ix) According to the records of the Company examined by us and information and explanations given to us:
(a) Undisputed statutory dues, including provident fund, investor education and protection fund, employee state insurance,
income tax, sales tax / value added tax, wealth tax, service tax, custom duty, excise duty, cess and any other material statutory
dues to the extent applicable have generally been regularly deposited with the appropriate authorities. There are no
undisputed amounts payable in respect of the aforesaid dues outstanding as at 31 March 2014 for a period of more than six
months from the date they became payable.

94
WELSPUN Corp Limited
(b) The disputed dues of income tax, sales tax / value added tax, service tax, custom duty and excise duty which have not been
deposited are as under:
Gujarat Sales Tax Act, 1969 and 13.86 FY 2000-01 Gujarat Value Added Tax
Gujarat Value Added Tax Act, 2003 to FY 2002-03 Tribunal
and FY 2005-06
to FY 2006-07
Sales Tax / Value Added Tax 89.75 FY 2006-07 Joint Commissioner of
to FY 2009-2010 Commercial tax (Appeals)
Central Sales Tax Act, 1956 0.92 FY 2001-02 Gujarat Value Added Tax
Tribunal
Central Sales Tax 4.39 FY 2008-09 Joint Commissioner of
and FY 2009-2010 Commercial tax (Appeals)
Central Excise Act, 1944 0.09 FY 2003-04 High Court
-Excise Duty 6.33 FY 2006-07 Custom Excise and Service
to FY 2007-08 Tax Appellate Tribunal
and FY 2010-11
15.35 FY 2008-09 Commissioner of Central
to FY 2012-13 Excise and Customs
3.55 FY 2007-08 Commissioner of Central
FY 2009-10 Excise and Customs
and FY 2011-12 (Appeals)
23.90 FY 2008-09 Deputy Commissioner of
and 2009-10 Central Excise and
Customs
- Service Tax 10.27 FY 2004-05 Supreme Court of India
to FY 2006-07
16.99 FY 2006-07 Custom Excise and Service
to FY 2011-12 Tax Appellate Tribunal
95.73 FY 2005-06 Commissioner/Additional
to FY 2013-14 Commissioner of Central
Excise and Customs
40.63 FY 2007-08 Commissioner of Central
to FY 2012-13 Excise and Customs
(Appeals)
23.05 FY 2008-09 Deputy / Assistant
to FY 2012 -13 Commissioner of Central
Excise and Customs
21.34 FY 2006-07, Superintendent of Central
FY 2009-10 Excise and Customs
to FY 2012-13
Customs Act, 1962 8,609.82 FY 2007-08 Custom Excise and Service
- Custom duty to FY 2009-10 Tax Appellate Tribunal
Income Tax Act, 1961 2,190.21 FY 2004-05 Commissioner of Income
- Income tax to FY 2010-11 tax, (Appeals)
411.88 FY 2009-10 Commissioner of Income
to FY 2012-13 tax, (Appeals)
Name of the Statute Amount Period to which Forum where dispute
(Nature of dues) ( in million) the amount relates is pending`
#
#Does not include penalty of (i) 8,609.82 million on Company and 205 million on directors and officers of the Company levied by Commissioner of Central
Excise and Custom, Mumbai and (ii) 8,609.82 million levied by Additional Director General of Foreign Trade (DGFT), Mumbai {Refer note 33(b)}.
` `
`

95
WELSPUN Corp Limited
(x) The Company does not have accumulated losses at the end of the financial year. The Company has not incurred any cash losses
during the financial year covered by the audit and in the immediately preceding financial year.
(xi) Based on our audit procedures and according to the information and explanations given to us, we are of the opinion that the
Company has not defaulted in repayment of dues to financial institutions, banks and debenture holders.
(xii) In our opinion and according to the explanations given to us and based on the information available, no loans and advances have
been granted by the Company on the basis of security by way of pledge of shares, debentures and other securities.
(xiii) The Company is not a chit fund / nidhi / mutual benefit fund / society.
(xiv) The Company is not dealing or trading in securities, debentures and other investments.
(xv) In our opinion and according to the information and explanations given to us, the terms and conditions on which the Company has
given guarantees for loans taken by subsidiaries and others from banks and financial institutions are prima facie not prejudicial to
the interest of the Company.
(xvi) According to the information and explanations given to us, the Company has not raised any term loans during the year.
(xvii) According to the information and explanations given to us and examination of the Balance Sheet of the Company and related
information as made available to us, we report that funds raised on short-term basis have not been used for long term
investments.
(xviii) During the year, the Company has not made any preferential allotment of shares to companies or parties covered in the register
maintained under section 301 of the Act.
(xix) The Company has created adequate security in respect of debentures issued.
(xx) The Company had raised funds by issue of foreign currency convertible bonds in the earlier years which have been utilized for the
purposes for which they are raised except funds pending utilization have been temporarily invested as referred in Note 4(d)(iv).
(xxi) Based on our audit procedures performed and according to the information and explanations given by the management, no fraud
on or by the Company has been noticed or reported during the course of our audit
For
Chartered Accountants
Firm Registration Number 101169W
Partner
Membership Number 12912
Mumbai, 29 April 2014
MGB & Co
Mohan Bhandari

96
WELSPUN Corp Limited
Balance Sheet as at 31 March
( in million)`
Notes 2014 2013
EQUITY AND LIABILITIES
Shareholders' funds
Share capital 2 1,314.74 1,314.74
Reserves and surplus 3 18,221.68 42,715.03
Long-term borrowings 4 19,423.18 26,053.72
Deferred tax liabilities (Net) 5 3,631.49 3,893.91
Other long-term liabilities 6 997.58 1,764.26
Long-term provisions 7 36.05 130.46
Short-term borrowings 8 1,615.10 1,177.93
Trade payables 9 5,100.31 19,083.28
Other current liabilities 10 8,942.19 6,751.66
Short-term provisions 11 703.89 1,122.55
Non-current assets
Fixed assets 12
- Tangible assets 29,663.88 29,621.82
- Intangible assets 172.68 216.23
- Capital work-in-progress 939.20 1,784.84
Non-current investments 13 3,670.39 19,593.84
Long-term loans and advances 14 1,386.24 3,051.27
Other non-current assets 15 59.50 55.00
Current investments 16 11,142.54 16,908.26
Inventories 17 5,291.47 14,741.86
Trade receivables 18 3,922.01 9,770.79
Cash and bank balances 19 497.57 4,273.63
Short-term loans and advances 20 1,463.81 2,179.28
Other current assets 21 1,776.92 1,810.72
19,536.42 44,029.77
Non-current liabilities
24,088.30 31,842.35
Current liabilities
16,361.49 28,135.42
Total 59,986.21 104,007.54
ASSETS
35,891.89 54,323.00
Current assets
24,094.32 49,684.54
Total 59,986.21 104,007.54
Notes forming part of the financial statements 1 - 54
As per our attached report of even date For and on behalf of the Board
MGB & Co. B.K.Goenka Braja Mishra
Mohan Bhandari S. Krishnan Pradeep Joshi
For
Chartered Accountants Chairman Managing Director
Firm Registration Number 101169W
Partner Chief Financial Officer Company Secretary
Membership Number 12912
Mumbai, 29 April 2014

97
WELSPUN Corp Limited
Notes forming part of the financial statements 1 - 54
As per our attached report of even date For and on behalf of the Board
MGB & Co. B.K.Goenka Braja Mishra
Mohan Bhandari S. Krishnan Pradeep Joshi
For
Chartered Accountants Chairman Managing Director
Firm Registration Number 101169W
Partner Chief Financial Officer Company Secretary
Membership Number 12912
Mumbai, 29 April 2014
Statement of Profit and Loss for the year ended 31 March
( in million)`
Notes 2014 2013
Total 50,424.25 68,566.34
Expenditure
Total 46,204.53 62,595.84
Profit before depreciation/amortization, finance costs and tax 4,219.72 5,970.50
Profit / (loss) before tax (275.78) 691.62
Tax expense
Profit / (loss) for the year from continuing operations (A) (175.42) 504.89
Profit / (loss) before tax from discontinued operations
Profit / (loss) for the year from discontinued operations (B) – 25.97
Profit / (loss) for the year (A+B) (175.42) 530.86
Revenue
Revenue from operations (Gross) 22 49,782.24 70,601.02
Less: Excise duty 1,106.12 4,279.37
Revenue from operations (Net) 48,676.12 66,321.65
Other income 23 1,748.13 2,244.69
Cost of materials consumed 24 25,919.61 41,559.92
Purchases of traded goods 25 4,953.17 9,207.69
Changes in inventories of finished goods and goods-in-process 26 4,991.42 (1,475.94)
Employee benefits expense (Net) 27 1,467.51 2,191.53
Other expenses 28 8,872.82 11,112.64
Less: Depreciation and amortization expense 12 2,255.69 2,289.90
Finance costs 29 2,239.81 2,988.98
- Current tax – 138.38
- MAT credit entitlement – (138.38)
- Deferred tax (100.36) 186.73
– 188.03
Tax expense of discontinued operations 53 – 162.06
Earnings per share of 5 each fully paid up (in ) 43
- Basic (0.67) 2.29
- Diluted (0.67) 2.29
` `

98
WELSPUN Corp Limited
Notes forming part of the financial statements
Note 1 Significant Accounting Policies
I. Basis of preparation of financial statements
II. Use of estimates
III. Tangible and intangible assets
IV. Borrowing costs
V. Impairment of tangible and intangible assets
VI. Depreciation / amortization on tangible and intangible assets
The financial statements of the company have been prepared on going concern in accordance with generally accepted accounting
principles in India (Indian GAAP). The company has prepared these financial statements to comply in all material respect with the
accounting standards notified under the companies (Accounting standards) Rules, 2006, (as amended) and the relevant provision
of the Companies act, 1956 read with general circular 8/2014 dated 4 April 2014, issued by the Ministry of Corporate Affairs. The
financial statements have been prepared on an accrual basis and under the historical cost convention. The accounting policies
adopted in the preparation of financial statements are consistent with those of previous year.
Pursuant to the announcement of the Institute of Chartered Accountants of India (ICAI) on “Accounting for Derivatives” on the early
adoption of Accounting Standard (AS-30) “Financial Instruments: Recognition and Measurement”, the Company has early adopted
the standard w.e.f 1 April 2007 to the extent that the adoption does not conflict with the existing mandatory accounting and other
authoritative pronouncements, Company Law and other regulatory requirements.
The preparation of the financial statements requires the management to make estimates and assumptions that affect the reported
amounts of assets and liabilities, disclosure of contingent liabilities as at the date of the financial statements and the reported
amount of revenue and expenses of the year. The estimates and assumptions used in the accompanying financial statements are
based upon management's evaluation of the relevant facts and circumstances as of the date of the financial statements. The
examples of such estimates include the useful life of the tangible and intangible assets, allowance for doubtful debts/advances,
future obligations in respect of retirement benefit plan etc. Actual results could differ from those estimates and in such case the
difference is recognised when known or materialised.
(a) Tangible assets are stated at original cost (net of tax/duty credit availed) less accumulated depreciation, amortisation and
impairment losses except freehold land which is carried at cost. Cost includes cost of acquisition, construction and installation,
taxes, duties, freight, other incidental expenses related to the acquisition, trial run expenses (net of revenue) and
pre-operative expenses including borrowing costs incurred during pre-operational period.
(b) Tangible assets which are not ready for their intended use on reporting date are carried as capital work-in-progress at cost,
comprising direct cost and related incidental expenses.
(c) Intangible assets are carried at cost, net off accumulated amortization and impairment loss, if any.
Borrowing costs that are attributable to the acquisition or construction of qualifying assets are capitalized as part of cost of such
assets till such time the asset is ready for its intended use. All other borrowing costs are recognised as expense.
At each balance sheet date, the Company reviews the carrying amount of tangible and intangible assets to determine whether
there is any indication of impairment loss. If any such indication exists, the recoverable amount of the assets is estimated in order to
determine the extent of impairment loss. The recoverable amount is higher of the net selling price and the value in use, determined
by discounting the estimated future cash flows expected from the continuing use of the asset to their present value.
(a) Depreciation on tangible assets is provided on straight line method at the rates prescribed in Schedule XIV to the Companies
Act, 1956 except for certain Plant and Machinery which are depreciated on the basis of estimated useful lives of 13 – 15 years.
The company is depreciating computers and mobile phones based on their useful life i.e. 4 years and 3 years respectively. The
rates of depreciation derived from these estimated useful lives are higher than those prescribed in Schedule XIV to the
Companies Act, 1956.
(b) Continuous process plant has been identified on the basis of technical opinion taken by the Company / Expert and appropriate
rate of depreciation on such plant and machinery has been charged as prescribed under Schedule XIV.
(c) Intangible assets are amortized on a straight-line basis over its expected useful life as estimated by the management.

99
WELSPUN Corp Limited
Notes forming part of the financial statements
VII. Investments
VIII. Revenue recognition
IX. Inventories
X. Foreign currency transactions
instruments and hedge accounting
a) Investments, which are readily realisable and are intended to be held for not more than one year from the date on which such
investments are made, are classified as current investments. All other investments are classified as long-term investments.
b) Long-term investments are valued at cost less provision for diminution other than temporary, in the value of such investments.
Current investments are valued at lower of cost and fair value.
(a) Sale of goods is recognized on transfer of significant risks and rewards of ownership to the customers. Export sales are
recognised on the basis of date of bill of lading. Gross sales include excise duty and adjustments for price variations, exclude
sales tax/value added tax.
(b) Export benefits: Duty Entitlement Pass Book (DEPB), Focus Market and Focus Product are recognised on accrual basis. Target
Plus / Duty Free Entitlement Certificate scheme of EXIM policy are recognized when utilized.
(c) Revenue from services is recognized on completion of services.
(d) Dividend income is recognized when the right to receive the dividend is established.
(e) Interest income is recognized at the agreed rate on time proportion basis.
Inventories are valued at lower of cost and net realizable value. The basis of determining cost for various categories of inventories is
as follows:-
(a) Raw materials, Stores and Spares – Moving weighted average basis.
(b) Goods-in-process – Cost of materials plus labour and other production overheads.
(c) Finished goods – Cost of materials plus labour, production overheads and excise duty on such goods.
(a) Transaction in foreign currency are accounted at the exchange rate prevailing on the date of such transactions. Current
monetary assets and liabilities are translated at the exchange rate prevailing at the reporting date. Non-monetary items are
carried at cost.
(b) Gains or losses arising on remittance / translations at the year- end are credited / debited to the statement of profit and loss
except treatment as per amendment to AS-11 effective till 31 March 2020 (Refer note 31 (b)).
(c) Premium / discount on derivative contracts, not relating to firm commitments or highly probable forecasted transactions and
not intended for trading or speculation purposes, is amortized as income or expense over the life of the contract.
The Company uses foreign currency derivative contracts to hedge its risk associated with foreign currency fluctuations relating to
certain firm commitments and forecasted transactions. The Company designates these hedging instruments as cash flow hedges
and applying the recognition and measurement principles set out in Accounting Standard 30 “Financial Instruments: Recognition
and Measurement” (AS 30). The gain or loss on the effective hedges is recorded in “Hedging Reserve Account” until the transaction
is complete. The gain or loss is accounted in the statement of Profit and Loss upon completion of the transaction or when the hedge
instrument expires or terminates or ceases to qualify for hedge accounting.
(a) Short-term employee benefits are recognized as an expense at the undiscounted amount in the statement of profit and loss of
the year in which the related services are rendered.
(b) Post employment and other long-term benefits are recognized as an expense in the statement of Profit and Loss of the year in
which the employee has rendered services. The expense is recognized at the present value of the amounts payable
determined using actuarial valuation techniques. Actuarial gains and losses in respect of post employment and other long-
term benefits are recognized in the statement of Profit and Loss.
(c) Payments to defined contribution retirement benefit schemes are charged as expenses as and when they fall due.
XI. Derivative
XII. Employee benefits

100
WELSPUN Corp Limited
Notes forming part of the financial statements
XIII. Employee stock options scheme
XV. Leases
XVI. Provisions, contingent liabilities and contingent assets
XVII. Earnings per share
XIV. Accounting for taxes on income
In respect of employee stock options granted pursuant to the Company’s Stock Option Scheme, the intrinsic value of the options
(excess of market price of the share over the exercise price of the option) is treated as discount and accounted as employee
compensation cost over the vesting period.
(a) Current tax is determined as the amount of tax payable in respect of taxable income for the year computed as per the
provisions of the Income Tax Act, 1961.
(b) Deferred tax is recognized subject to consideration of prudence, on timing difference, being the difference between taxable
income and accounting income that originate in one period and are capable of reversal in one or more subsequent periods and
measured using relevant enacted tax rates.
Assets acquired under finance lease are capitalised and the corresponding lease liability is recognized at lower of the fair value
of the leased assets and the present value of minimum lease payments at the inception of the lease. Intial costs directly
attributable to lease are recognized with the asset under lease.
Lease of assets under which all the risks and rewards of ownership are effectively retained by the lessor are classified as
operating lease. Lease payments under operating leases are recognized as an expense on accrual basis in accordance with the
respective lease agreements.
Contingent liabilities are disclosed in respect of possible obligations that arise from past events but their existence will be
confirmed by the occurrence or non-occurrence of one or more uncertain future events. A provision is made when it is probable
that an outflow of resources embodying economic benefits will be required to settle an obligation and in respect of which a reliable
estimate can be made. Provision is not discounted and is determined based on best estimate required to settle the obligation at the
year end date. Contingent assets are not recognized or disclosed in the financial statements
Basic earnings per share is computed and disclosed using the weighted average number of equity shares outstanding during the
year. Dilutive earnings per share is computed and disclosed using the weighted average number of equity and dilutive equity
equivalent shares outstanding during the year, except when the results would be anti-dilutive.
a) Finance lease
b) Operating lease
( in million)
304,000,000 (Previous year 304,000,000) Equity Shares of 5/- each 1,520.00 1,520.00
98,000,000 (Previous year 98,000,000) Preference Shares of 10/- each 980.00 980.00
262,948,299 (Previous year 262,948,299) Equity Shares of 5/- each fully paid up 1,314.74 1,314.74
`
`
`
`
2014 2013
Authorised
Total 2,500.00 2,500.00
Issued, subscribed and paid up
Total 1,314.74 1,314.74
2. Share capital

a) Reconciliation of the number of equity shares outstanding
2014 2013
Number of in million Number of in million
Equity Shares Equity Shares
Outstanding at the end of the year 262,948,299 1,314.74 262,948,299 1,314.74
b) Terms and rights attached to equity shares
c) Shareholders holding more than 5% shares of the company
2014 2013
Name of Shareholders Number of Percentage Number of Percentage
Equity Shares (%) Equity Shares (%)
d) Employee Stock Options Scheme
Granted during Granted during
2006-07 2009-10
At the beginning of the year 262,948,299 1,314.74 227,781,035 1,138.91
Issued during the year
– Conversion of Compulsory Convertible Debentures (CCD) – – 35,038,889 175.19
– Equity shares allotted on exercise of Employees Stock Options – – 128,375 0.64
The Company has only one class of equity shares having a par value of 5 per share. Each holder of equity shares is entitled to one
vote per share, however the holders of global depository receipts (GDR's) do not have voting rights in respect of shares represented
by the GDR's till the shares are held by the custodian. The dividend when proposed by the Board of Directors is subject to the
approval of the shareholders in the ensuing Annual General Meeting.
In the event of liquidation of the company, the holders of the equity shares will be entitled to receive remaining assets of the
company, after distribution of preferential amounts. The distribution will be in proportion to the number of equity shares held by the
shareholders.
J P Morgan Chase Bank, NA ADR Account (Custodian and against
which GDR have been issued to Insight Solutions Limited) 23,026,000 8.76 23,026,000 8.76
Granele Limited 35,038,889 13.33 35,038,889 13.33
Life Insurance Corporation of India Limited & its Schemes 19,277,980 7.33 19,283,580 7.33
Welspun Wintex Limited 13,336,576 5.07 13,336,576 5.07
Welspun Mercantile Limited 14,477,701 5.51 13,877,701 5.28
Welspun Fintrade Limited – – 18,955,791 7.21
Krishiraj Trading Limited 52,862,858 20.10 26,907,692 10.23
In respect of options granted under the Welspun Employee Stock Options Scheme, in accordance with the guidelines issued by
Securities and Exchange Board of India, the value of options (based on intrinsic value of the share on the date of the grant of the
option) is accounted as deferred employee compensation, which is amortized on a straight line basis over the vesting period.
Employee benefits expense include credit of 0.73 million (Previous year 6.60 million) on account of reversal of options lapsed
during the year.
Stock options outstanding as at the year end are as follows:
Exercise price 80.00 66.75
Date of grant 8 January 2007 20 April 2009
Vesting period commences on 8 January 2008 20 April 2010
Options outstanding at the beginning of the year – 32,875
Options exercised during the year – –
Options lapsed during the year – 32,875
Options outstanding as at 31 March 2014 – –
` `
`
` `
` `
101
WELSPUN Corp Limited
Notes forming part of the financial statements

102
WELSPUN Corp Limited
Notes forming part of the financial statements
( in million)
As per last balance sheet 1,057.26 1,057.26
Add/(Less): Transferred pursuant to the Scheme of Arrangement (Refer note 52) (1,057.26) –
– 1,057.26
As per last balance sheet 24,929.65 17,252.74
Add/(Less): Transferred pursuant to the Scheme of Arrangement (Refer note 52) (17,252.74) –
Received during the year – 7,718.18
Discount on issue of shares under employees stock option scheme – 3.43
Premium on redemption of foreign currency convertible bonds (28.35) 11.70
Utilized towards share / debenture issue expenses – (56.40)
7,648.56 24,929.65
As per last balance sheet 1,142.37 1,464.29
Add/(Less): Transferred to surplus in statement of profit and loss** – (321.92)
1,142.37 1,142.37
– 0.73
51.50 (44.84)
(509.32) (275.37)
As per last balance sheet 1,749.20 1,696.11
Add/(Less): Transferred pursuant to the Scheme of Arrangement (Refer note 52) (1,696.11) –
Appropriated during the year – 53.09
53.09 1,749.20
As per last balance sheet 14,156.03 13,510.35
Add/(Less): Transferred pursuant to the Scheme of Arrangement (Refer note 52) (3,965.85) –
Cancellation of share capital pursuant to the Scheme of Arrangement (0.50) –
{Refer note 52(b)(iii)}
Adjustment pursuant to the Scheme of Arrangement {Refer note 52(b)(iv)} (25.97) –
Profit/(loss) for the year (175.42) 530.86
9,988.28 14,041.21
General reserve – (53.09)
Transfer from debenture redemption reserve** – 321.92
Proposed dividend on equity shares (131.47) (131.47)
Tax on proposed dividend (22.34) (22.34)
Dividend on equity shares of earlier year – (0.20)
Excess provision of tax on dividend of earlier year written back 1.02 –
(152.79) 114.82
9,835.48 14,156.03
`
2014 2013
Capital reserve
Securities premium
Debenture redemption reserve
Employee stock options outstanding
Hedging reserve account [Refer note 31(c)]
Foreign currency monetary item translation difference account [Refer note 31(b)]
General reserve
Surplus in the statement of profit and loss
Add/(Less): Appropriations
Total appropriations
Net surplus in the statement of profit and loss
Total 18,221.68 42,715.03
**No debenture redemption reserve is created in view of loss incurred during the year
3. Reserves and surplus

103
WELSPUN Corp Limited
Notes forming part of the financial statements
( in million)
Redeemable non-convertible debentures 13,428.00 13,428.00 – –
External commercial borrowings 4,194.05 6,542.09 – 2,721.68
Term loan from a bank 1,782.47 1,614.98 – –
Other loans 18.66 27.73 7.43 6.04
Foreign currency convertible bonds – 4,424.23 4,493.63 –
Deferred sales tax loan – 16.69 16.69 16.69
The debentures together with interest are secured by first charge ranking pari passu by way of mortgage/hypothecation of entire
immovable and movable tangible assets of the Company, both present and future and second/floating charge on current assets,
subject to prior charge in favour of banks for working capital facilities.
5000 1,000,000 September 2025 9.55% 5,000
5000 1,000,000 August 2025 9.55% 5,000
900 1,000,000 November 2022 11.00% 900
328 1,000,000 September 2019 11.15% 328
250 1,000,000 August 2019 11.25% 250
1950 1,000,000 August 2019 11.15% 1,950
External commercial borrowings (ECB) is secured by first charge ranking pari passu by way of mortgage/hypothecation of entire
immovable and movable tangible assets of the Company both present and future. The ECB comprises of USD 70 million (Previous
year USD 163.45 million) and JPY Nil (Previous year JPY 677.65 million) and carries interest of LIBOR plus 3.50% to 4.50%.
April 2015 2.70 161.77
October 2015 2.70 161.77
April 2016 4.00 239.66
October 2016 14.00 838.81
April 2017 4.00 239.66
October 2017 14.00 838.81
April 2018 4.00 239.66
October 2018 14.00 838.81
April 2019 5.30 317.55
October 2019 5.30 317.55
`
` `
`
Non-current Current
2014 2013 2014 2013
Secured
Unsecured
Total 19,423.18 26,053.72 4,517.75 2,744.41
a)
No. of Debentures Face value Redemption Rate of Amount
( ) date interest (p.a.) ( in million)
Total 13,428
b)
The ECB is repayable as follows
Repayment schedule USD Amount
(million) ( in million)
Total 70.00 4,194.05
c) Term loan from banks
Term loan of US$ 29.75 million equivalent to 1,782.47 million (Previous year 1,614.98 million) from bank is secured by first charge
ranking pari passu by way of mortgage/hypothecation of entire movable and immovable tangible assets of the Company and second
charge over the entire current assets of the company both, present and future. The loan carries interest of LIBOR plus 5.00%. The
loan is repayable in 18 equal quarterly instalments after a moratorium of 30 months from the date of first disbursement i.e.
15 November 2012.
` `
4. Long-term borrowings

104
WELSPUN Corp Limited
Notes forming part of the financial statements
d) Foreign currency convertible bonds (FCCB)
i) During the financial year 2009 - 2010, the Company had raised US$ 150 million (Equivalent INR 6,942 million) by way of issue of
1500 4.5% FCCB of US$ 100,000 each. The Bond holders have an option to convert outstanding bonds (USD 75 million) into
12,005,000 equity shares of 5 each fully paid up at an initial conversion price of 300 per share with a fixed rate of exchange
on conversion of 48.02 = US$ 1 at any time on or after 26 November 2009 until 10 days prior to Maturity date (i.e. 17 October
2014). Unless previously converted, redeemed or repurchased and cancelled, the Bonds will be redeemed on
17 October 2014 at 102.8028% of the principal amount so as to give a gross yield of 5% per annum (calculated on semi annual
basis) to the Bond holders.
The Company has an option to redeem the Bonds at their Early Redemption amount upon occurrence of events specified in the
Offering Circular for issue of the Bonds (“Offering Circular”). Further, the Company has an option to mandatorily convert the
Bonds after three years as specified in the Offering Circular.
ii) Premium payable on redemption of FCCB aggregating to 28.35 million (Previous year credit of 11.70 million) has been
adjusted against securities premium as per Section 78 of the Companies Act, 1956. In the event, Bond holders exercise the
conversion option, the amount of premium utilized from securities premium will be suitably adjusted in respective years.
iii) During the year, the company has repurchased 65, 4.5% FCCB of US$ 100,000 each aggregating to US$ 6.50 million at a discount
and gain of 12.46 million arising on repurchase of FCCB is shown under "Other income".
iv) Part of the net proceeds received from the issue of FCCB has been utilized as per objects of the issue viz for funding of Plate and
Coil Mill, Pipe Mill Capex Projects (Anjar and Mandya) and Investment in overseas subsidiary. Pending utilization, the balance
issue proceeds of USD 0.40 million equivalent INR 23.97 million (Previous year USD 0.55 million equivalent INR 30.09 million)
have been invested in short-term deposits.
` `
`
` `
`
( in million)
Fiscal allowance on fixed assets 4,627.45 4,466.42
Others 173.12 93.60
4,800.57 4,560.02
Employee benefits 13.13 17.47
Provision for doubtful debts and advances 65.98 79.74
Unabsorbed fiscal allowances 1,089.98 568.90
1,169.08 666.11
( in million)
Liability towards claims 997.58 1,764.26
( in million)
Employee benefits 36.05 46.98
Premium payable on redemption of FCCB – 83.48
`
`
`
2014 2013
Deferred tax liabilities
Deferred tax assets
Total 3,631.49 3,893.91
2014 2013
Total 997.58 1,764.26
2014 2013
Total 36.05 130.46
5. Deffered tax liabilities (Net)
6. Other long-term liabilities
7. Long-term provisions

105
WELSPUN Corp Limited
Notes forming part of the financial statements
( in million)
Working capital loan from banks 1,615.10 1,177.93
(Secured by first charge on hypothecation of raw materials, finished goods and
goods-in-process, stores & spares and book debts of the Company and second charge on
entire immovable and movable tangible assets of the Company both present and future.)
( in million)
Acceptances 4,576.94 17,127.63
Others (Refer note 30) 523.37 1,955.65
( in million)
Current maturities of long-term borrowings (Refer note 4) 4,517.75 2,744.41
Interest accrued but not due on borrowings 473.38 517.75
Unclaimed dividend 5.35 5.30
Acceptances for capital goods 185.58 –
Creditors for
- Capital goods 105.28 179.76
- Expenses 625.78 908.53
Trade advances and deposits 1,644.59 1,026.90
Statutory dues 329.74 553.80
Liability towards claims 1,054.75 815.22
( in million)
Employee benefits 2.57 3.85
Proposed equity dividend 131.47 131.47
Tax on proposed equity dividend 22.34 22.34
Litigations 79.79 79.79
Liquidated damages 33.50 461.09
Mark to market losses on derivative contracts 311.53 308.29
Premium payable on redemption of FCCB 111.83 –
Taxation (net of advances) 10.86 115.72
`
`
`
`
2014 2013
Secured
Total 1,615.10 1,177.93
2014 2013
Total 5,100.31 19,083.28
2014 2013
Other payables
Total 8,942.19 6,751.66
2014 2013
Others for
Total 703.89 1,122.55
8. Short-term borrowings
9. Trade Payables
10. Other current liabilities
11. Short-term provisions

106
WELSPUN Corp Limited
No
te 1
2 -
Fix
ed
ass
ets
(in
mil
lio
n)
`
No
tes
form
ing
pa
rt o
f th
e f
ina
nci
al
sta
tem
en
ts
No
tes:
1.
Gro
ssb
lock
of
Pla
nt
an
dM
ach
ine
ryin
clu
de
s6
3.4
9m
illi
on
(Pre
vio
us
yea
r6
3.4
9m
illi
on
)in
resp
ect
of
exp
en
dit
ure
incu
rre
do
nca
pit
al a
sse
t,o
wn
ers
hip
of
wh
ich
do
es
no
tve
stin
the
Co
mp
an
y.
2.
De
pre
cia
tio
na
nd
am
ort
isa
tio
ne
xpe
nse
for
the
yea
rin
clu
de
s1
.42
mil
lio
n(P
rev
iou
sye
ar
0.4
3m
illi
on
)tra
nsf
err
ed
top
re-o
pe
rati
vee
xpe
nse
s.
3.
Re
fer
no
te3
1(b
)fo
re
xch
an
ge
dif
fere
nce
cap
ita
lise
da
sp
er
am
en
de
dA
S-1
1.
4.
Pre
-op
era
tive
exp
en
ses
of
18
.81
mil
lio
n(P
rev
iou
sye
ar
52
.60
mil
lio
n)h
ave
be
en
cap
ita
lize
dw
ith
rela
ted
pro
ject
sd
uri
ng
the
yea
r.
5.
Bo
rro
win
gco
sts
all
oca
ted
tofi
xed
ass
ets
/ca
pit
alw
ork
-in
-pro
gre
ssd
uri
ng
the
yea
ris
12
.09
mil
lio
n(P
rev
iou
sye
ar
27
.73
mil
lio
n).
``
``
``
``
Gro
ss B
lock
De
pre
cia
tio
n/A
mo
rtiz
ati
on
/Im
pa
irm
en
tN
et
Blo
ck
As
at
Ad
dit
ion
sD
ed
uct
ion
sA
s a
tU
pto
For
the
ye
ar
De
du
ctio
ns
Imp
air
me
nt
Up
toA
s a
tA
s a
t
01
Ap
ril
31
Ma
rch
31
Ma
rch
31
Ma
rch
31
Ma
rch
31
Ma
rch
20
13
20
13
20
14
20
13
20
14
20
14
a)
Tan
gib
le a
sse
ts
Tota
l (a
)4
0,2
29
.94
2,3
13
.08
16
9.5
54
2,3
73
.47
10
,60
8.1
72
,16
2.8
87
3.9
01
2.4
51
2,7
09
.59
29
,66
3.8
82
9,6
21
.82
b)
Inta
ng
ible
ass
ets
Tota
l (b
)5
15
.07
50
.68
-5
65
.74
29
8.8
39
4.2
2-
-3
93
.06
17
2.6
82
16
.23
Tota
l (a
+b
)4
0,7
45
.00
2,3
63
.76
16
9.5
54
2,9
39
.21
10
,90
7.0
12
,25
7.1
07
3.9
01
2.4
51
3,1
02
.65
29
,83
6.5
62
9,8
38
.05
Pre
vio
us
ye
ar
Ca
pit
al
wo
rk-i
n-p
rog
ress
93
9.2
01
,78
4.8
4
Fre
eh
old
la
nd
20
0.3
72
3.8
82
24
.24
--
--
-2
24
.24
20
0.3
7
Bu
ild
ing
s5
,24
6.2
96
78
.87
0.6
15
,92
4.5
57
48
.87
15
0.7
10
.04
89
9.5
45
,02
5.0
04
,49
7.4
2
Pla
nt
an
d m
ach
ine
ry3
4,2
37
.97
1,5
73
.26
14
5.6
33
5,6
65
.60
9,5
95
.69
1,9
64
.28
65
.57
12
.26
11
,50
6.6
62
4,1
58
.94
24
,64
2.2
8
Off
ice
an
d o
the
r e
qu
ipm
en
ts3
49
.25
18
.50
13
.05
35
4.7
01
81
.90
32
.59
1.3
60
.03
21
3.1
51
41
.55
16
7.3
5
Ve
hic
les
62
.64
4.1
59
.95
56
.84
29
.16
5.7
96
.75
0.0
12
8.2
02
8.6
43
3.4
8
Fu
rnit
ure
s a
nd
fix
ture
s1
33
.43
14
.43
0.3
21
47
.53
52
.56
9.5
00
.18
0.1
56
2.0
38
5.5
08
0.8
7
So
ftw
are
51
5.0
75
0.6
8-
56
5.7
42
98
.83
94
.22
--
39
3.0
61
72
.68
21
6.2
3
39
,06
3.8
11
,71
6.1
83
4.9
94
0,7
45
.00
8,5
29
.82
2,2
90
.34
19
.24
10
6.0
91
0,9
07
.01
29
,83
8.0
5

107
WELSPUN Corp Limited
Notes forming part of the financial statements
( in million)
Welspun Pipes Inc. 0.44 0.44
10,001 (Previous year 10,001) equity shares of USD 1 each
Welspun Pipes Limited 0.50 0.50
50,000 (Previous year 50,000) equity shares of 10 each
Welspun Infratech Limited
Nil (Previous year 48,639,899) equity shares of 10 each – 1,920.85
Nil (Previous year 42,289) 7% unsecured optionally convertible debentures of 100,000 each – 4,228.90
Welspun Tradings Limited 50.22 50.22
5,013,402 (Previous year 5,013,402) equity shares of 10 each
Welspun Natural Resources Private Limited – 186.60
Nil (Previous year 1,875,000) equity shares of 10 each
Welspun Maxsteel Limited
Nil (Previous year 113,622,058) equity shares of 10 each – 8,042.17
Nil (Previous year 3,740,000) 0% redeemable preference shares of 10 each – 37.40
Welspun Mauritius Holdings Limited
102,089 (Previous year 102,089) equity shares of USD 1 each 4.70 4.70
66,154,000 (Previous year 80,009,968) preference shares of USD 1 each 3,358.93 3,976.65
Welspun Enterprises Limited {Refer note 52 (b) (iii)} – 0.50
Nil (Previous year 50,000) equity shares of 10 each
Red Lebondal Limited (Extent of holding 25%) 0.03 0.03
450 (Previous year 450) equity shares of Euro 1 each
Less: Provision for diminution in the value of investment (0.03) (0.03)
Welspun Energy Limited
Nil (Previous year 60,493,342) equity shares of 10 each – 910.85
Standard Chartered Bank PLC Indian Depository Receipt 34.77 34.77
334,331 (Previous year 334,331) Indian Depository Receipt of 100 each
Welspun Captive Power Generation Limited (Ceased to be associate w.e.f. 1 April 2013)
5,093,426 (Previous year 2,938,427) equity shares of 10 each fully paid up 50.96 29.41
16,976,573 (Previous year 16,976,573) preference shares of 10 each fully paid up 169.86 169.86
Welspun Enterprises (Cyprus) Limited 0.77 0.77
11,800 (Previous year 11,800) equity shares of Euro 1 each
Less: Provision for diminution in the value of investment (0.77) (0.77)
(All the above shares and securities are fully paid up)
Aggregate book value of quoted investments 34.77 34.77
Aggregate book value of unquoted investments 3,636.42 19,559.87
Aggregate market value of quoted investments 38.65 39.58
Aggregate provision for diminution in value of investments 0.80 0.80
`
`
`
`
`
`
`
`
`
`
`
`
`
2014 2013
A. Trade investments - Unquoted
i) Wholly owned subsidiaries
ii) Other subsidiaries
iii) Associates
B. Other investments - Quoted
C. Other investments - Unquoted
Total 3,670.39 19,593.84
#
#
#
#
#Transferred pursuant to the Scheme of Arrangement (Refer note 52)
13. Non-current investments
(Valued at cost unless stated otherwise)

108
WELSPUN Corp Limited
Notes forming part of the financial statements
( in million)
Capital advances 45.63 119.43
Less: Provision for doubtful advances 4.32 4.68
- Related parties (Refer note 39) 348.08 309.60
- Other parties 51.66 68.07
Less: Provision for doubtful deposits 2.70 2.86
Loan to subsidiary – 1,618.95
Share application money
- Subsidiary 596.15 610.59
- Other related parties – 21.55
Advances recoverable in cash or kind 120.80 104.31
Prepaid expenses 5.51 8.51
Loan to employees – 0.08
Balances with government authorities - Direct tax 40.00 –
Minimum alternative tax credit entitlement 185.44 197.73
( in million)
Margin money deposits 59.50 55.00
( in million)
(Valued at lower of cost and fair value, unless stated otherwise)
8.97% Andhra Pradesh State Development Loan 2022 20.03 20.03
200,000 (Previous year 200,000) Bonds of 100 each
8.69% Damodar Valley Corporation 2028 265.90 –
253 (Previous year Nil) Bonds of 1,000,000 each
8.80% Food Corporation of India 2028 560.94 –
519 (Previous year Nil) Bonds of 1,000,000 each
9.95% Food Corporation of India 2022 60.94 –
60 (Previous year Nil) Bonds of 1,000,000 each
7.16% Government of India Loan 2023 315.23 –
3,500,000 (Previous year Nil) Bonds of 100 each
`
`
`
`
`
`
`
`
2014 2013
41.31 114.75
Deposits
397.04 374.80
Loans and advances to related parties (Refer note 39)
596.15 2,251.09
Other loans and advances
351.75 310.63
Total 1,386.24 3,051.27
2014 2013
Total 59.50 55.00
2014 2013
Quoted
i) Bonds
14. Long-term loans and advances
s
16. Current Investments
(Unsecured considered good, unless otherwise stated)
15. Other non-current asset

109
WELSPUN Corp Limited
Notes forming part of the financial statements
( in million)
7.40% Government of India Loan 2035 99.16 –
1,035,000 (Previous year Nil) Bonds of 100 each
8.15% Government of India Loan 2022 51.48 1,119.97
500,000 (Previous year 11,000,000) Bonds of 100 each
8.28% Government of India Loan 2027 95.73 –
1,000,000 (Previous year Nil) Bonds of 100 each
8.28% Government of India Loan 2032 259.83 259.83
2,535,000 (Previous year 2,535,000) Bonds of 100 each
8.33% Government of India Loan 2026 428.32 723.92
4,000,000 (Previous year 7,000,000) Bonds of 100 each
8.33% Government of India Loan 2036 260.20 520.40
2,500,000 (Previous year 5,000,000) Bonds of 100 each
8.20% Government of India Loan 2025 52.01 714.10
500,000 (Previous year 7,000,000) Bonds of 100 each
8.30% Government of India Loan 2040 207.56 413.55
2,000,000 (Previous year 4,000,000) Bonds of 100 each
8.83% Government of India Loan 2041 289.43 599.94
2,500,000 (Previous year 5,500,000) Bonds of 100 each
8.97% Government of India Loan 2030 1,152.43 1,811.10
10,058,500 (Previous year 16,614,500 ) Bonds of 100 each
9.15% Government of India Loan 2024 26.00 26.00
240,000 (Previous year 240,000 ) Bonds of 100 each
9.45% Gujarat State Petroleum Corp Limited 2022 108.92 465.08
106 (Previous year 450) Bonds of 1,000,000 each
9.80% Gujarat State Petroleum Corp Limited 2073 16.16 600.00
16 (Previous year 600) Bonds of 1,000,000 each
10.45% Gujarat State Petroleum Corp Limited 2072 206.28 551.80
191 (Previous year 531) Bonds of 1,000,000 each
9.03% Gujarat State Petroleum Corp Limited 2028 13.47 1,500.36
13 (Previous year 1,500) Bonds of 1,000,000 each
8.14% Housing And Urban Development Corp Ltd 2018 20.13 –
20 (Previous year Nil) Bonds of 1,000,000 each
9.90% Industrial Finance Corporation of India Limited 2022 440.12 210.56
17,398 (Previous year 8,510) Bonds of 25,000 each
`
`
`
`
`
`
`
`
`
`
`
`
`
`
`
`
`
`
`
`
`
`
`
2014 2013
9.90% Industrial Finance Corporation of India Limited 2027 398.58 721.00
15,756 (Previous year 29,140) Bonds of 25,000 each
9.90% Industrial Finance Corporation of India Limited 2032 217.45 406.03
8,596 (Previous year 16,410) Bonds of 25,000 each
9.90% Industrial Finance Corporation of India Limited 2037 107.51 653.21
4,250 (Previous year 26,400) Bonds of 25,000 each
9.90% Industrial Finance Corporation of India Limited 2021 28.80 196.34
28 (Previous year 193) Bonds of 1,000,000 each
10.15% Industrial Finance Corporation of India Limited 2023 – 43.00
Nil (Previous year 430) Bonds of 100,000 each

110
WELSPUN Corp Limited
Notes forming part of the financial statements
( in million)`
2014 2013
9.70% Industrial Finance Corporation of India Limited 2030 15.00 4.12
15 (Previous year 4) Bonds of 1,000,000 each
9.75% Industrial Finance Corporation of India Limited 2028 817.29 –
787 (Previous year Nil) Bonds of 1,000,000 each
Industrial Finance Corporation of India Limited Deep Discount Bond 2031 184.63 184.63
28,404 (Previous year 28,404) Bonds of 25,000 each
Industrial Finance Corporation of India Limited Deep Discount Bond 2032 65.98 269.56
10,150 (Previous year 41,470 ) Bonds of 25,000 each
Industrial Finance Corporation of India Limited Deep Discount Bond 2035 31.17 31.17
4,795 (Previous year 4,795) Bonds of 25,000 each
Industrial Finance Corporation of India Limited Deep Discount Bond 2036 14.24 14.24
2,190 (Previous year 2,190 ) Bonds of 25,000 each
Industrial Finance Corporation of India Limited Deep Discount Bond 2033 166.68 22.04
25,270 (Previous year 3,390 ) Bonds of 25,000 each
Industrial Finance Corporation of India Limited Deep Discount Bond 2039 223.99 269.56
34,460 (Previous year 41,470 ) Bonds of 25,000 each
Industrial Finance Corporation of India Limited Deep Discount Bond 2040 269.56 269.56
41,470 (Previous year 41,470) Bonds of 25,000 each
8.49% Indian Renewable Energy Development Agency 2028 96.76 –
95 (Previous year Nil) Bonds of 1,000,000 each
8.60% LIC Housing Finance Limited 2018 127.71 –
129 (Previous year Nil) Bonds of 1,000,000 each
8.99% Madhya Pradesh State Development Loan 2022 5.06 5.06
50,500 (Previous year 50,500) Bonds of 100 each
11.90% Neelachal Ispat Nigam Limited 2024 100.00 –
100 (Previous year Nil) Bonds of 1,000,000 each
9.18% Nuclear Power Corporation of India Ltd 2025 150.50 –
136 (Previous year Nil) Bonds of 1,000,000 each
9.18% Nuclear Power Corporation of India Ltd 2026 309.85 –
280 (Previous year Nil) Bonds of 1,000,000 each
9.18% Nuclear Power Corporation of India Ltd 2027 243.45 –
220 (Previous year Nil) Bonds of 1,000,000 each
9.18% Nuclear Power Corporation of India Ltd 2029 36.52 –
33 (Previous year Nil) Bonds of 1,000,000 each
7.93% Power Grid Corporation of India Limited 2017 49.50 –
50 (Previous year Nil) Bonds of 1,000,000 each
8.70% Power Grid Corporation of India Limited 2023 50.00 –
50 (Previous year Nil) Bonds of 1,000,000 each
8.70% Power Grid Corporation of India Limited 2028 50.00 –
50 (Previous year Nil) Bonds of 1,000,000 each
8.80% Power Grid Corporation of India Limited 2023 40.90 –
40 (Previous year Nil) Bonds of 1,000,000 each
8.20% Power Finance Corporation Limited 2022 2.11 2.09
2,000 (Previous year 2,000) Bonds of 1,000 each
`
`
`
`
`
`
`
`
`
`
`
`
`
`
`
`
`
`
`
`
`
`

111
WELSPUN Corp Limited
Notes forming part of the financial statements
( in million)`
2014 2013
8.06% Rural Electrification Corporation Limited 2023 650.00 –
650 (Previous year Nil) Bonds of 1,000,000 each
8.82% Rural Electrification Corporation Limited 2023 63.31 –
61 (Previous year Nil) Bonds of 1,000,000 each
9.90% Reliance Capital Limited 2023 9.36 –
9 (Previous year Nil) Bonds of 1,000,000 each
9.95% Reliance Capital Limited 2022 30.45 30.00
30 (Previous year 30) Bonds of 1,000,000 each
10.40% Reliance Capital Limited 2022 53.89 47.13
51 (Previous year 47) Bonds of 1,000,000 each
10.00% Reliance Capital Limited 2017 15.43 57.24
15 (Previous year 57) Bonds of 1,000,000 each
10.10% Reliance Capital Limited 2022 50.50 21.16
50 (Previous year 21) Bonds of 1,000,000 each
10.20% Reliance Capital Limited 2022 2.04 –
2 (Previous year Nil) Bonds of 1,000,000 each
10.75% Reliance Capital Limited 2021 5.36 –
5 (Previous year Nil) Bonds of 1,000,000 each
10.25% Reliance Gas Transportation Infrastructure Limited 2021 46.10 –
42 (Previous year Nil) Bonds of 1,000,000 each
9.40% The Great Eastern Shipping Company 2019 33.28 –
32 (Previous year Nil) Bonds of 1,000,000 each
9.73% Vijaya Bank 2023 55.00 –
55 (Previous year Nil) Bonds of 1,000,000 each
7.50% WSPF 2020 108.67 –
1085 (Previous year Nil) Bonds of 100,000 each
7.80% Government of India Loan 2021 – 49.50
Nil (Previous year 500,000) Bonds of 100 each
8.30% Government of India Loan 2042 – 358.37
Nil (Previous year 3,500,000) Bonds of 100 each
9.60% HDB Financial Services Limited 2023 – 250.00
Nil (Previous year 250) Bonds of 1,000,000 each
7.70% Indian Overseas Bank 2016 – 16.65
Nil (Previous year 17) Bonds of 1,000,000 each
8.85% IDFC Limited 2016 – 217.00
Nil (Previous year 217) Bonds of 1,000,000 each
Industrial Finance Corporation of India Limited Deep Discount Bond 2034 – 269.56
Nil (Previous year 41,470) Bonds of 25,000 each
Industrial Finance Corporation of India Limited Deep Discount Bond 2037 – 112.91
Nil (Previous year 17,370) Bonds of 25,000 each
Industrial Finance Corporation of India Limited Deep Discount Bond 2038 – 269.56
Nil (Previous year 41,470) Bonds of 25,000 each
7.77% Indian Railway Finance Corporation Limited 2026 – 1.01
Nil (Previous year 10) Bonds of 100,000 each
`
`
`
`
`
`
`
`
`
`
`
`
`
`
`
`
`
`
`
`
`
`

112
WELSPUN Corp Limited
Notes forming part of the financial statements
( in million)`
2014 2013
8.90% Jarkhand State Development Loan 2022 – 5.04
Nil (Previous year 50,000) Bonds of 100 each
9.18% NABARD 2017 – 101.82
Nil (Previous year 100) Bonds of 1,000,000 each
8.85% Power Grid Corporation of India Limited 2027 – 13.78
Nil (Previous year 11) Bonds of 1,250,000 each
9.28% Rural Electrification Corporation Limited 2017 – 102.07
Nil (Previous year 100) Bonds of 1,000,000 each
8.70% Rural Electrification Corporation Limited 2018 – 149.96
Nil (Previous year 150) Bonds of 1,000,000 each
9.85% Reliance Capital Limited 2023 – 450.00
Nil (Previous year 450) Bonds of 1,000,000 each
10.20% SREI Infrastructure Finance Limited 2020 – 155.00
Nil (Previous year 155) Bonds of 1,000,000 each
10.75% SREI Infrastructure Finance Limited 2014 – 75.00
Nil (Previous year 75) Bonds of 1,000,000 each
8.81% West Bengal State Development Loan 2021 – 10.08
Nil (Previous year 100,000) Bonds of 100 each
Andhra Bank Limited 2014 490.31 –
5,000 (Previous year Nil) CD of 100,000 each
Syndicate Bank 2014 491.66 –
5,000 (Previous year Nil) CD of 100,000 each
Andhra Bank Limited 2013 – 244.51
Nil (Previous year 2,500) CD of 100,000 each
Indusind Bank Limited 2013 – 491.75
Nil (Previous year 5,000) CD of 100,000 each
Sicom Limited – 500.00
Nil (Previous year 1) CD of 500,000,000 each
DWS Short Maturity Fund Regular Plan - Annual Bonus 32.39 –
SBI Magnum Income Fund - Regular Plan - Growth 50.00 –
Sundaram Money Fund Bonus (Bonus Units) 201.34 –
Reliance Liquid Fund - Treasury Plan - Daily Dividend Option – 280.97
Aggregate book value of quoted investments 11,142.54 16,908.26
Aggregate market value of quoted investments 11,393.91 17,107.31
`
`
`
`
`
`
`
`
`
`
`
`
`
`
ii) Certificate of deposits (CD)
iii) Mutual fund
Total 11,142.54 16,908.26

113
WELSPUN Corp Limited
Notes forming part of the financial statements
( in million)
Raw materials (including goods-in-transit of 27.66 million (Previous year 3,408.23 million)) 1,392.45 5,779.37
Goods-in-process 427.93 2,939.08
Finished goods 2,218.28 4,698.54
Stores and spares 1,252.81 1,324.87
H.R. Coils 339.85 946.99
H.R. Plates 503.61 676.00
M.S. Slabs 225.07 474.23
Others 296.26 273.92
Goods-in-transit 27.66 3,408.23
Welded pipes 8.77 2,099.33
Coating 323.18 364.77
Plates and Coils 68.20 223.79
Others 27.78 251.19
Welded pipes 2,191.88 3,151.20
M.S. Plates 4.15 635.86
H.R Coils – 743.64
Coating 22.25 167.85
( in million)
(Unsecured)
Over six months
Considered good 212.21 805.79
Considered doubtful 53.76 90.65
Less: Provision for doubtful debts (53.76) (90.65)
212.21 805.79
Others considered good 3,709.80 8,965.00
`
` `
`
2014 2013
Total 5,291.47 14,741.86
Details of inventories under broad heads
Raw materials
Total 1,392.45 5,779.37
Goods-in-process
Total 427.93 2,939.08
Finished goods
Total 2,218.28 4,698.54
2014 2013
Total 3,922.01 9,770.79
*includes receivable from a subsidiary 1,497.82 million (Previous year 5,667.50 million)` `
17. Inventories
18. Trade receivables*

114
WELSPUN Corp Limited
Notes forming part of the financial statements
( in million)
Balances with banks:
- Current accounts 28.81 3,579.04
- Deposits having original maturity period of less than three months 23.97 126.14
Cheques on hand – 0.98
Cash on hand 0.79 1.75
Balances with banks - Escrow accounts 1.59 11.48
Unclaimed dividend accounts 5.35 5.30
Margin money deposits 437.06 548.94
( in million)
(Unsecured considered good unless otherwise stated)
- Related parties (Refer note 39) – 37.28
- Others 0.28 1.77
- Subsidiaries 299.58 271.43
- Other parties – 3.90
Advances recoverable in cash or in kind 106.26 693.17
Balances with government authorities - Indirect taxes 1,143.87 1,341.60
Prepaid expense 43.75 45.29
Loans and advances to employees* 95.34 12.38
Less: Provision for doubtful advances 225.28 227.54
( in million)
- Loan to subsidiary 20.30 102.39
- Current investments 301.50 295.73
- Fixed deposits 22.00 32.96
- Others 26.04 20.55
Receivable towards claim 45.72 244.51
Export benefits receivable 623.42 749.22
Other receivables from related parties (Refer note 39)
- Subsidiaries 654.24 361.22
- Other parties 79.52 -
Assets held for disposal 4.19 4.13
`
`
`
2014 2013
Cash and cash equivalents
Other bank balances
Total 497.57 4,273.63
2014 2013
Deposits
0.28 39.05
Loans and advances to related parties (Refer note 39)
299.58 275.33
Other loans and advances
1,389.23 2,092.44
Total 1,463.81 2,179.28
2014 2013
Interest accrued on
Total 1,776.92 1,810.72
*Includes 83.01 million recoverable from Managing Director {Refer note 45(b)}`
19. Cash and bank balances
dvances20. Short-term loans and a
21. Other current assets

WELSPUN Corp Limited
Notes forming part of the financial statements
( in million)
- Finished goods 41,740.43 56,851.45
- Traded goods 5,264.07 9,790.16
Other operating revenues (Refer note 44) 2,777.73 3,959.41
49,782.24 70,601.02
Less: Excise duty 1,106.12 4,279.37
Welded pipes 40,078.85 38,144.78
M.S. Plates 1,157.93 8,040.46
H.R. Coils 188.06 6,359.21
Coating 73.80 3,032.76
Steam 127.75 1,096.48
Others 114.04 177.76
H.R. Coils 5,264.07 9,790.16
( in million)
- Loan to subsidiary 18.54 1.76
- Current investments 923.55 571.97
- Fixed deposits 69.92 79.37
- Others 143.92 279.08
- Non-current investment in subsidiary – 220.38
- Current investments 7.93 249.46
- Non-current investments 242.55 234.42
- Current investments 207.72 331.08
Miscellaneous income 134.00 277.17
`
`
2014 2013
Sale of products
Revenue from operations (Gross)
Revenue from operations (Net) 48,676.12 66,321.65
Details of sale of products under broad heads
Finished goods
41,740.43 56,851.45
Traded goods
5,264.07 9,790.16
2014 2013
Interest income on
Dividend income on
Profit on sale/redemption of
Total 1,748.13 2,244.69
22. Revenue from operations
23. Other income
115

116
WELSPUN Corp Limited
Notes forming part of the financial statements
( in million)
Inventory at the beginning of the year 2,371.15 6,154.42
Add: Purchases 24,913.25 37,776.65
Less: Inventory at the end of the year 1,364.79 2,371.15
H.R. Coils 10,059.62 10,247.97
H.R. Plates 14,050.16 17,628.10
M.S. Slabs 386.65 11,799.08
Welding and coating materials 1,273.01 1,710.30
Others 150.17 174.47
( in million)
Purchases of H.R. Coils 4,953.17 9,207.69
( in million)
Goods-in-process 427.93 2,939.08
Finished goods 2,218.28 4,698.54
2,646.20 7,637.62
Goods-in-process 2,939.08 1,300.61
Finished goods 4,698.54 4,861.07
7,637.62 6,161.68
( in million)
Salaries, wages and bonus 1,325.31 2,009.99
Contribution to provident and other funds 69.54 87.25
Employee compensation expenses (0.73) (6.60)
Staff welfare expenses 73.40 100.89
`
`
`
`
2014 2013
27,284.40 43,931.07
Total 25,919.61 41,559.92
Details of raw materials consumed
25,919.61 41,559.92
2014 2013
Total 4,953.17 9,207.69
2014 2013
Inventories at the end of the year
Inventories at the beginning of the year
Total 4,991.42 (1,475.94)
2014 2013
Total 1,467.51 2,191.53
24. Cost of materials consumed
25. Purchases of traded goods
finished goods and goods-in-process26. Changes in inventories of
27. Employee benefits expense (Net) {Refer note 45(b)}

117
WELSPUN Corp Limited
Notes forming part of the financial statements
( in million)
( in million)
`
`
2014 2013
2014 2013
28. Other expenses
29. Finance costs
Stores and spares consumed 596.03 1,937.48
Coating and other Job charges 1,749.16 3,038.73
Power, fuel and water charges 822.36 1,817.00
Freight, material handling and transportation 763.08 1,099.22
Excise duty on (increase)/decrease of finished goods (206.41) 235.52
Rent 71.01 85.86
Rates and taxes 5.28 4.60
Repairs and maintenance
- Plant and machinery 58.72 77.52
- Buildings 14.25 18.41
- Others 143.11 84.91
Travelling and conveyance expenses 186.44 215.68
Communication expenses 17.95 23.44
Professional and consultancy fees 212.65 256.41
Insurance 77.68 96.59
Directors' sitting fees 2.48 1.56
Printing and stationery 15.19 10.56
Security charges 30.70 23.82
Membership and subscription 23.72 25.83
Vehicle expenses 18.90 20.38
Exchange difference (Net) 3,596.73 1,088.64
Auditors remuneration 7.55 8.89
Product compensation and claims 125.46 3.29
Sales promotion expenses 11.23 17.69
Liquidated damages 12.78 73.21
Commission and discount on sales 399.58 564.22
Provision for doubtful debts and advances (Net) (39.71) 59.72
Bad debts and advances written off 96.59 2.18
Provision for diminution in the value of non-current investments – 0.80
Provision for impairment of tangible assets 12.45 106.09
Loss on sale / discard of tangible assets 1.95 8.29
Miscellaneous expenses 45.91 106.09
- Term loans 342.29 204.13
- Debentures/Bonds 1,576.86 1,999.76
- Working capital 44.88 44.00
- Others 29.48 32.18
Other borrowing costs 246.30 708.91
Total 8,872.82 11,112.64
Interest expense
Total 2,239.81 2,988.98
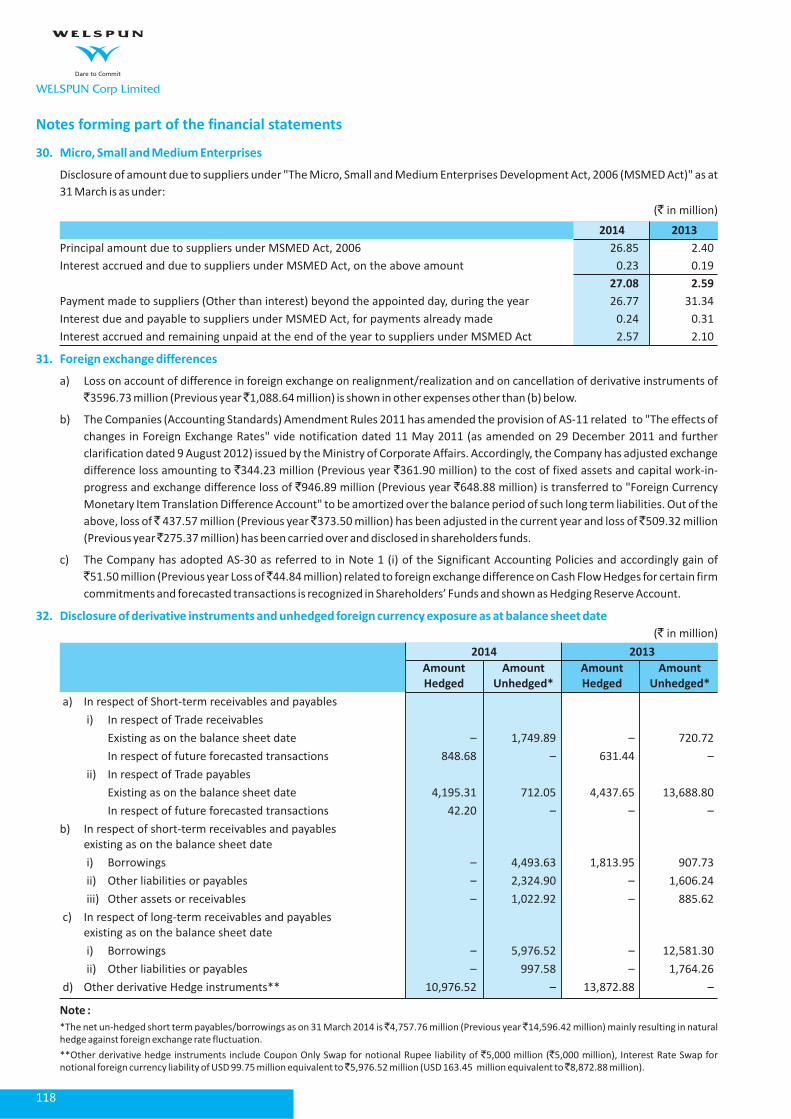
118
WELSPUN Corp Limited
Notes forming part of the financial statements
30. Micro, Small and Medium Enterprises
31. Foreign exchange differences
32. Disclosure of derivative instruments and unhedged foreign currency exposure as at balance sheet date
Disclosure of amount due to suppliers under "The Micro, Small and Medium Enterprises Development Act, 2006 (MSMED Act)" as at
31 March is as under:
( in million)
Principal amount due to suppliers under MSMED Act, 2006 26.85 2.40
Interest accrued and due to suppliers under MSMED Act, on the above amount 0.23 0.19
Payment made to suppliers (Other than interest) beyond the appointed day, during the year 26.77 31.34
Interest due and payable to suppliers under MSMED Act, for payments already made 0.24 0.31
Interest accrued and remaining unpaid at the end of the year to suppliers under MSMED Act 2.57 2.10
a) Loss on account of difference in foreign exchange on realignment/realization and on cancellation of derivative instruments of
3596.73 million (Previous year 1,088.64 million) is shown in other expenses other than (b) below.
b) The Companies (Accounting Standards) Amendment Rules 2011 has amended the provision of AS-11 related to "The effects of
changes in Foreign Exchange Rates" vide notification dated 11 May 2011 (as amended on 29 December 2011 and further
clarification dated 9 August 2012) issued by the Ministry of Corporate Affairs. Accordingly, the Company has adjusted exchange
difference loss amounting to 344.23 million (Previous year 361.90 million) to the cost of fixed assets and capital work-in-
progress and exchange difference loss of 946.89 million (Previous year 648.88 million) is transferred to "Foreign Currency
Monetary Item Translation Difference Account" to be amortized over the balance period of such long term liabilities. Out of the
above, loss of 437.57 million (Previous year 373.50 million) has been adjusted in the current year and loss of 509.32 million
(Previous year 275.37 million) has been carried over and disclosed in shareholders funds.
c) The Company has adopted AS-30 as referred to in Note 1 (i) of the Significant Accounting Policies and accordingly gain of
51.50 million (Previous year Loss of 44.84 million) related to foreign exchange difference on Cash Flow Hedges for certain firm
commitments and forecasted transactions is recognized in Shareholders’ Funds and shown as Hedging Reserve Account.
( in million)
a) In respect of Short-term receivables and payables
i) In respect of Trade receivables
Existing as on the balance sheet date – 1,749.89 – 720.72
In respect of future forecasted transactions 848.68 – 631.44 –
ii) In respect of Trade payables
Existing as on the balance sheet date 4,195.31 712.05 4,437.65 13,688.80
In respect of future forecasted transactions 42.20 – – –
b) In respect of short-term receivables and payables
existing as on the balance sheet date
i) Borrowings – 4,493.63 1,813.95 907.73
ii) Other liabilities or payables – 2,324.90 – 1,606.24
iii) Other assets or receivables – 1,022.92 – 885.62
c) In respect of long-term receivables and payables
existing as on the balance sheet date
i) Borrowings – 5,976.52 – 12,581.30
ii) Other liabilities or payables – 997.58 – 1,764.26
d) Other derivative Hedge instruments** 10,976.52 – 13,872.88 –
`
` `
` `
` `
` ` `
`
` `
`
2014 2013
27.08 2.59
2014 2013
Amount Amount Amount Amount
Hedged Unhedged* Hedged Unhedged*
Note :
*The net un-hedged short term payables/borrowings as on 31 March 2014 is 4,757.76 million (Previous year 14,596.42 million) mainly resulting in natural
hedge against foreign exchange rate fluctuation.
**Other derivative hedge instruments include Coupon Only Swap for notional Rupee liability of 5,000 million ( 5,000 million), Interest Rate Swap for
notional foreign currency liability of USD 99.75 million equivalent to 5,976.52 million (USD 163.45 million equivalent to 8,872.88 million).
` `
` `
` `

119
WELSPUN Corp Limited
Notes forming part of the financial statements
(in million)
In respect of short term payables
EUR / US$ 82.83 23.12
( in million)
Performance guarantees/Bid bond given by banks to company’s customers /
government authorities etc. 9,306.49 15,630.87
Corporate guarantees given by the company (includes 15,277.48 million 17,148.95 18,203.96
(Previous year 11,998.22 million)) for Loans/Liabilities taken by the subsidiaries.
Loans /Liabilities outstanding against these guarantees are 2,913.06 million
(Previous year 1,772.89 million)
Letters of credit outstanding (net of liability provided) for company’s sourcing 9,257.32 4,087.02
Claims against the Company not acknowledged as debts 570.62 450.54
Custom duty on pending export obligation against import of Raw Materials 380.81 1,387.25
Disputed direct taxes* 2,000.26 2,009.47
Disputed indirect taxes 84.78 100.73
The Company has challenged before CESTAT, the order of Commissioner of Customs (Kandla) for duty evasion of 8,609.82
million (Previous year 8,609.82 million) on account of alleged wrong classification of imported raw materials along with
penalty of 8,609.82 million (Previous year 8,609.82 million) and penalty of 205 million (Previous year 205 million) on
directors and officers of the Company. On the same matter and under a different proceeding, the additional DGFT, during the
year imposed a penalty of 8,609.82 million (Previous year Nil) which has been unconditionally stayed by the Bombay High
Court on petition filed by the Company. Based on DGFT’s clarification that, irrespective of whether it is alloy or non-alloy steel, if
the grade of import and export is same, the licence can be redeemed. The Joint DGFT, Vadodara has confirmed that the grade of
import and export is same, hence the whole amount of duty and penalty referred above may not be sustained and is not
considered as contingent liability. However in any case, out of the above, 6,706.60 million (Previous year 6,706.60 million) is
cenvatable duty which is revenue neutral and may not result into recoverable demand and accordingly relevant amount of
penalty may not sustain.
a) Estimated amount of contracts remaining to be executed on capital account (net of advances) is 120.42 million
(Previous year 280.26 million)
b) Other long-term commitments - 2,000 million (Previous year 5,250 million)
c) The company has committed to provide continued need based financial support to subsidiaries.
The Employees gratuity fund scheme managed jointly by Kotak Life Insurance Limited and India First Life Insurance Company Limited
is a defined benefit plan. The present value of obligation is based on actuarial valuation using the projected unit credit method. The
obligation for leave encashment is recognized in the same manner as gratuity.
2014 2013
Amount in Amount in
Cross Currency Hedges Foreign Foreign
Currency Currency
2014 2013
b)
`
`
`
`
`
`
`
` ` ` `
` `
` `
`
`
` `
*Income tax demands mainly include appeals filed by the Company before appellate authorities against disallowances i.e.
depreciation/claims/deductions. The management is of the opinion that its tax disputes will be decided in its favour and no material tax liability is likely
to be sustained, hence no provision is considered necessary.
33.
34. Capital and Other Commitments
35. Disclosures pursuant to adoption of Accounting Standard 15 (Revised 2005) Employee Benefits
a) Contingent liabilities not provided for

120
WELSPUN Corp Limited
Notes forming part of the financial statements
Defined benefit plan
I. Actuarial assumptions
Economic assumptions
Major assumptions 2014 (%p.a.) 2013 (%p.a.)
Demographic assumptions
Major assumptions
II. Expenses recognized in the statement of profit and loss
Gratuity Gratuity Leave Leave
(Funded) (Funded) Encashment Encashment
(Unfunded) (Unfunded)
2014 2013 2014 2013
Expenses recognized in the statement of profit and loss (4.44) 16.02 (0.69) 17.90
III. Present value of defined benefit obligation and the fair value of assets
Gratuity Gratuity Leave Leave
(Funded) (Funded) Encashment Encashment
(Unfunded) (Unfunded)
2014 2013 2014 2013
Liability recognized in the balance sheet (4.61) – 38.62 50.83
IV. Change in the present value of obligation
Gratuity Gratuity Leave Leave
(Funded) (Funded) Encashment Encashment
(Unfunded) (Unfunded)
2014 2013 2014 2013
Present value of obligation as at 31 March 103.98 119.18 38.62 50.83
Details of defined benefit plan of Gratuity (Funded) and Leave Encashment (Non-Funded) are as follows
Discount rate (p.a.) 9.00 8.25
Expected return on assets 5.00 10.00
Salary escalation rate 6.00 5.75
Mortality Latest Compiled Table of LIC (1994-96)
Retirement age 60 years for all staff and workers (except Presidents and above retirement age is 62 Years)
Attrition rate 2% up to age 44 and 1% thereafter
( in million)
Current service cost 30.94 77.00 16.73 45.51
Interest cost 9.28 9.15 3.83 3.94
Expected return on plan assets (8.70) (8.25) – –
Net actuarial (gain)/loss recognized (35.96) (61.89) (21.25) (31.56)
( in million)
Present value of obligation as at 31 March 103.98 119.18 38.62 50.83
Fair value of plan assets as at 31 March 108.59 119.18 – –
( in million)
Present value of obligation as at 1 April 119.18 99.54 50.83 46.75
Current service cost 30.94 77.00 16.73 45.51
Interest cost 9.28 9.15 3.83 3.94
Benefits paid (14.46) (6.36) (11.52) (13.81)
Actuarial (gain)/loss on obligations (40.96) (60.16) (21.25) (31.56)
`
`
`

121
WELSPUN Corp Limited
Notes forming part of the financial statements
V. Change in fair value of plan assets
Gratuity Gratuity
(Funded) (Funded)
2014 2013
Notes:
2014 2013
Within Outside Total Within Outside Total
India India India India
External sales / revenue from operations*
Carrying amount of segment assets
Capital expenditure
Notes:
2014 2013
( in million)
Fair value of plan assets as at 1 April 119.18 99.54
Expected return on plan assets 8.70 8.25
Actuarial gain/(loss) on plan assets (5.00) 16.02
Contributions 0.16 (6.36)
Benefits paid (14.46) 1.73
Fair value of plan assets as at 31 March 108.58 119.18
i) Amount recognized as an expense and included in Note 27 - Employee benefits expense is: Gratuity-credit of 0.06 million
(Previous year expense of 16.02 million) and Leave Encashment-credit of 1.40 million (Previous year expense of
17.90 million).
ii) "Contribution to provident and other funds” is recognised as an expense in note 27 of the statement of profit and loss.
i) The Company is engaged in the business of steel products which in the opinion of the management is considered as the only
reportable business segment in the context of Accounting Standard – 17 on “Segment Reporting”.
ii) Information about Secondary-Geographical Segment
( in million)
32,279.17 16,396.95 48,676.12 40,555.67 25,765.98 66,321.65
53,611.55 6,374.66 59,986.21 96,210.75 7,796.79 104,007.54
1,444.68 – 1,444.68 1,523.75 – 1,523.75
a) Segment revenue in the geographical segments considered for disclosure is as follows:
- Revenue within India includes sales to customers located within India.
- Revenue outside India includes sales to customers located outside India.
b) Segment assets include the respective amounts identified to each of the segments and amounts allocated on a
reasonable basis.
c) Capital expenditure also includes expenditure incurred on capital work-in-progress and capital advances.
( in million)
Audit fee 5.50 5.50
Tax audit fee 1.00 1.00
Taxation matters – 1.50
Other services (Certification fees) 0.82 0.78
Out of pocket expenses 0.23 0.11
`
`
` `
`
`
`
*Sales within India includes deemed exports of 21,534.17 million (Previous year 9,505.57 million)` `
36. Segment reporting
37. Payment to Auditors

122
WELSPUN Corp Limited
Notes forming part of the financial statements
38. Operating lease
39. Related Party Disclosures
The Company leases office, residential facilities, equipment etc. under operating lease agreements that are renewable on a periodic
basis at the option of both the lessor and the lessee. The tenure of lease is generally for eleven months to one twenty months.
( in million)
Lease rental charges for the year 71.01 85.86
Future lease rental obligations payable
(under non-cancelable leases)
Not Later than one year 63.06 58.25
Later than one year but not later than five years 7.17 119.02
Later than five years 0.15 0.27
Welspun Pipes Limited Manufacturer of Steel Pipes India 100% (100%)
Welspun Pipes Inc SPV for Steel Pipes Business United States 100% (100%)
of America
Welspun Tradings Limited Trading in Steel Products India 100% (100%)
Welspun Mauritius Holdings Limited SPV for Steel Pipes Business Mauritius 89.98% (89.98%)
Welspun Infratech Limited* Infrastructure Development India --- (100%)
Welspun Natural Resources Private Limited* Oil and Gas Exploration India --- (100%)
Welspun Maxsteel Limited* Manufacturer of Sponge Iron India --- (87.35%)
Welspun Enterprises Limited* SPV for Non-pipe businesses India --- (100%)
Welspun Middle East Pipes Company LLC Manufacturer of Steel Pipes Kingdom of 50.01% (50.01%)
Saudi Arabia
Welspun Middle East Pipes Coating Company LLC Coating of Steel Pipes Kingdom of 50.01% (50.01%)
Saudi Arabia
Welspun Middle East DMCC Marketing Company Dubai, UAE 100% (100%)
(w.e.f. 5 December 2013, earlier 100% subsidiary
of Welspun Mauritius Holdings Limited)
Welspun Tubular LLC Manufacturer of Steel Pipes United States 100% (100%)
of America
Welspun Global Trade LLC Marketing Company United States 100% (100%)
of America
Welspun Plastics Private Limited Oil and Gas Exploration India --- (100%)
Welspun Projects Limited Infrastructure Development India --- (61.12%)
Welspun Road Projects Private Limited Infrastructure Development India --- (100%)
Welspun Infra Projects Private Limited Infrastructure Development India --- (60%)
ARSS Bus Terminal Private Limited Infrastructure Development India --- (45%)
`
2014 2013
a. Particulars of Subsidiaries / Associates / Joint Ventures
Name of the Subsidiaries Nature of Business Country of Extent of
Incorporation Holding (%)
Direct Subsidiaries
Indirect Subsidiaries
Held through Welspun Mauritius Holdings Limited
Held through Welspun Tradings Limited
Held through Welspun Pipes Inc.
Held through Welspun Natural Resources Private Limited*
Held through Welspun Infratech Limited*

123
WELSPUN Corp Limited
Notes forming part of the financial statements
39. Related Party Disclosures (Contd.)
Name of the Subsidiaries Nature of Business Country of Extent of
Incorporation Holding (%)
Held through Welspun Projects Limited*
Held through Welspun Infra Projects Limited*
Associate Companies
Indirect Joint Ventures
b. Other related parties with whom transactions have taken place during the year and/or balances outstanding as on the last
day of the year.
c. Directors / Key Management Personnel
Nature of Relationship
Anjar Road Private Limited Infrastructure Development India --- (100%)
Welspun BOT Projects Private Limited Infrastructure Development India --- (100%)
MSK Projects (Himmatnagar Bypass) Private Limited Infrastructure Development India --- (100%)
MSK Projects (Kim Mandavi Corridor) Private Limited Infrastructure Development India --- (100%)
Leighton Welspun Contractors Private Limited Infrastructure Development India --- (7.5%)
Welspun Energy Transportation Private Limited Infrastructure Development India --- (100%)
Welspun Water Infrastructure Private Limited Infrastructure Development India --- (100%)
Red Lebondal Limited SPV for Steel Pipe Marketing Cyprus 25% (25%)
Welspun Captive Power Generation Limited Power Generation India --- (24%)
(Ceased to be associate w.e.f. 1 April 2013)
Welspun Energy Limited* Power Generation India --- (26%)
Welspun India Limited, Welspun Steel Limited, RMG Alloy Steel Limited (Formerly Remi Metal Gujarat Limited), Welspun Retail
Limited, Welspun Anjar SEZ Limited, Welspun Foundation for Health and Knowledge, Welspun Syntex Limited, Vipuna Trading
Limited, Welspun Logistics Limited, Welspun Realty Private Limited, Welspun Global Brands Limited, Welspun Projects Limited,
Welspun Captive Power Generation Limited, Welspun Energy Limited., Welspun Enterprises (Cyprus) Limited, Welspun
Enterprises Limited, Leighton Welspun Contractors Private Limited (Upto 07 February 2014), Welspun Marine Logistics Limited.
B. K. Goenka Chairman
R. R. Mandawewala Director
Braja Mishra Managing Director
@
#
*Transferred pursuant to the Scheme of Arrangement (Refer note 52)
@Application filed with registrar of companies (Cyprus) for name strike off.
#Direct and Indirect subsidiaries of Welspun Energy Limited - (an associate company): Welspun Energy Madhya Pradesh Limited, Welspun Energy
Anuppur Private Limited , Welspun Energy UP Private Limited , Welspun Urja India Limited, Welspun Energy Chhattisgarh Limited, Welspun Renewable
Energy Limited, Welspun Urja Gujarat Private Limited, Welspun Energy Meghalaya Private Limited, Welspun Energy Jharkhand Private Limited,
Welspun Energy Orissa Private Limited, Welspun Energy Resources Private Limited, Welspun Solar Park Private Limited, Welspun Energy Park Private
Limited, Welspun Solar Tech Private Limited , Welspun Energy Maharashtra Private Limited, Welspun Energy Rajasthan Private Limited , Solarsys
Renewable Energy Private Limited, Welspun Solar Madhya Pradesh Private Limited, Welspun Solar Rajasthan Private Limited, Welspun Solar Punjab
Private Limited, Welspun Solar UP Private Limited, Welspun Solar AP Private Limited, Unity Power Private Limited, Northwest Energy Private Limited,
Dreisatz Mysolar24 Private Limited, SUIL Hydro Power Private Limited, MI Mysolar24 Private Limited, Solarsys Energy Private Limited, Welspun Solar
Kannada Private Limited.
Held through Welspun Natural Resources Private Limited*
Held through Welspun Infra Projects Private Limited*
Held through Welspun Projects Limited*
Adani Welspun Exploration Limited Oil and Gas Exploration India --- (35%)
Leighton Welspun Contractors Private Limited Infrastructure Development India --- (32.38%)
Dewas Bhopal Corridor Limited Infrastructure Development India --- (50%)
Bul MSK Infrastructure Private Limited Infrastructure Development India --- (50%)

124
WELSPUN Corp Limited
Notes forming part of the financial statements
d. Transactions with related parties for the year
( in million)
Sale of goods and services
(36,927.53) (3.73) (1,640.63) – (38,571.89)
Interest and other income
(139.24) – (0.44) – (139.68)
Dividend received
(220.38) – – – (220.38)
Sale/redemption of shares
(879.92) – (0.06) – (879.98)
Purchase of goods and services
(125.67) (238.04) (71.03) – (434.75)
Purchase of fixed assets
(290.40) – – – (290.40)
Sale of fixed assets
(0.07) – (4.84) – (4.91)
Rent and license fees paid
– – (67.72) – (67.72)
Donation paid
– – (80.75) – (80.75)
Reimbursement of expenses (paid) / recovered (Net)
(1,137.89) 17.99 (31.33) – (1,151.23)
Loans, advances and deposits given
(4,376.34) – – – (4,376.34)
Loans, advances and deposits given repaid / adjusted
(2,694.11) – – – (2,694.11)
Advances and deposits taken
– – – – –
Investment in shares / optionally convertible
debentures (4,732.92) (799.56) – – (5,532.47)
Share application money given
(2,581.03) (8.00) – – (2,589.03)
Share application money given repaid / adjusted
(4,777.68) (881.21) – – (5,658.89)
Directors remuneration
– – – (154.42) (154.42)
`
Subsidiaries Associate/ Other Key Total
Joint Related Management
Venture Parties Personnel
24,998.34 – 803.00 – 25,801.35
87.47 – 9.03 – 96.49
– – – – –
860.28 – – – 860.28
38.04 – 356.74 – 394.78
– – 180.77 – 180.77
– – – – –
– – 61.09 – 61.09
– – – – –
138.75 – (6.60) – 132.15
– – – – –
– – – – –
2.00 – – – 2.00
62.31 – 21.55 – 83.86
47.97 – – – 47.97
– – 21.55 – 21.55
– – – 40.29 40.29

125
WELSPUN Corp Limited
Notes forming part of the financial statements
e. Closing balances as at 31 March 2014
( in million)
Loans, advances and deposits given
(1,890.37) – (350.78) – (2,241.15)
Corporate guarantees given
(11,998.22) (6,204.28) (1.46) – (18,203.96)
Investments in shares/optionally convertible
debentures (18,448.94) (1,110.15) (0.77) – (19,559.86)
Share application money given
(610.59) (21.55) – – (632.14)
Trade receivables
(5,667.50) – (27.06) – (5,694.56)
Interest receivable
(102.39) – – – (102.39)
Advances and deposits taken
– – – – –
Trade payables
(1.48) (26.94) (19.85) – (48.26)
Other receivables
(361.22) – – – (361.22)
i Sale of goods and services - Welspun Tradings Limited 19,710.20 million ( 26,642.57 million), Welspun Tubular LLC
5,288.14 million ( 9,958.35 million)
ii Interest and other income includes - Interest received from Welspun Natural Resources Private Limited Nil
( 111.77 million), interest and guarantee commission received from Welspun Pipes Inc 25.13 million ( 27.43 million),
guarantee commission received from Welspun Middle East Pipe Company LLC 58.56 million ( Nil).
iii Dividend received - Welspun Pipes Inc Nil ( 220.38 million)
iv Redemption of preference shares of - Welspun Mauritius Holdings Limited 860.28 million ( Nil) and Welspun Pipes Inc
Nil ( 879.92 million)
v Purchase of goods and services - Welspun Tubular LLC 7.50 million ( 124.05 million), Welspun Logistics Limited
38.76 million ( 54.74 million), Welspun Captive Power Generation Limited 302.37 million ( 238.04 million)
vi Purchase of fixed assets - Welspun Projects Limited 180.77 million ( 290.34 million)
vii Sale of fixed assets - Welspun India Limited Nil ( 4.37 million)
viii Rent and license fees paid - Welspun Realty Private Limited 58.06 million ( 58.99 million)
ix Donation paid - Welspun Foundation for Health and Knowledge Nil ( 80.75 million) (meant for Corporate Social
Responsibility activities)
x Reimbursement of expenses (paid) / recovered (net) includes recovered from Welspun Pipes Inc 36.52 million ( Nil),
Welspun Tubular LLC 34.31 million ( 37.01 million), Welspun Tradings Limited 28.08 million (paid 1,186.56 million),
Welspun Middle East Pipe Coating Company LLC 32.37 million ( 0.15 million), Welspun Captive Power Generation
Limited 15.28 million ( 10.71 million) and paid to Welspun India Limited 25.70 million ( 51.37 million),
`
` `
` `
`
` ` `
` `
` `
` `
` `
` `
` ` ` `
` `
` `
` `
` `
` `
` ` ` `
` `
` ` ` `
Subsidiaries Associate/ Other Key Total
Joint Related Management
Venture Parties Personnel
299.58 – 348.08 83.01 730.67
15,277.48 – 1,871.47 – 17,148.95
3,414.80 0.03 221.59 – 3,636.42
596.15 – – – 596.15
1,497.82 – 72.11 – 1,569.93
20.30 – – – 20.30
735.90 – – – 735.90
– – 32.20 – 32.20
654.24 – 79.52 – 733.76
f. Disclosure in respect of transactions which are more than 10% of the total Transactions of the same type with related parties
during the year:
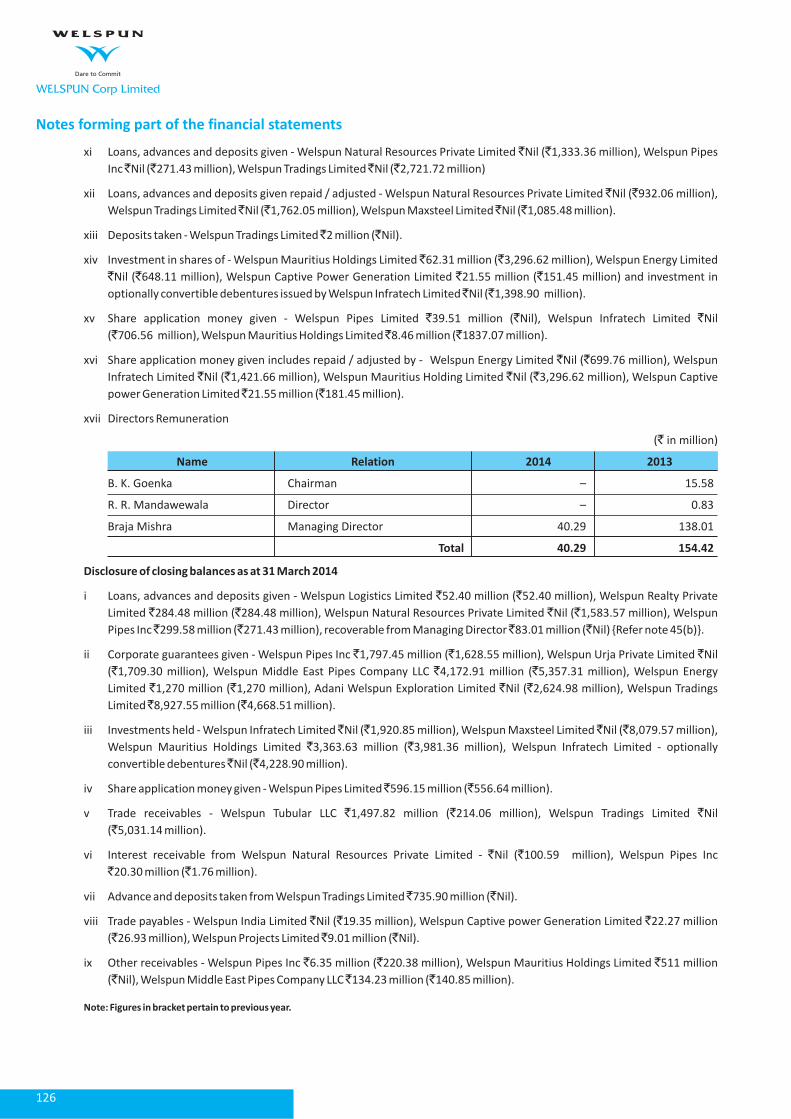
126
WELSPUN Corp Limited
Notes forming part of the financial statements
xi Loans, advances and deposits given - Welspun Natural Resources Private Limited Nil ( 1,333.36 million), Welspun Pipes
Inc Nil ( 271.43 million), Welspun Tradings Limited Nil ( 2,721.72 million)
xii Loans, advances and deposits given repaid / adjusted - Welspun Natural Resources Private Limited Nil ( 932.06 million),
Welspun Tradings Limited Nil ( 1,762.05 million), Welspun Maxsteel Limited Nil ( 1,085.48 million).
xiii Deposits taken - Welspun Tradings Limited 2 million ( Nil).
xiv Investment in shares of - Welspun Mauritius Holdings Limited 62.31 million ( 3,296.62 million), Welspun Energy Limited
Nil ( 648.11 million), Welspun Captive Power Generation Limited 21.55 million ( 151.45 million) and investment in
optionally convertible debentures issued by Welspun Infratech Limited Nil ( 1,398.90 million).
xv Share application money given - Welspun Pipes Limited 39.51 million ( Nil), Welspun Infratech Limited Nil
( 706.56 million), Welspun Mauritius Holdings Limited 8.46 million ( 1837.07 million).
xvi Share application money given includes repaid / adjusted by - Welspun Energy Limited Nil ( 699.76 million), Welspun
Infratech Limited Nil ( 1,421.66 million), Welspun Mauritius Holding Limited Nil ( 3,296.62 million), Welspun Captive
power Generation Limited 21.55 million ( 181.45 million).
xvii Directors Remuneration
( in million)
B. K. Goenka Chairman – 15.58
R. R. Mandawewala Director – 0.83
Braja Mishra Managing Director 40.29 138.01
` `
` ` ` `
` `
` ` ` `
` `
` `
` ` ` `
` `
` ` `
` ` `
` `
` ` ` `
` `
`
` `
` ` ` `
` ` ` `
` ` `
` ` `
` ` ` `
` `
` ` ` `
` `
` `
` `
` ` `
`
` `
` `
` `
` ` `
` ` `
` ` `
` ` `
Name Relation 2014 2013
Total 40.29 154.42
Disclosure of closing balances as at 31 March 2014
i Loans, advances and deposits given - Welspun Logistics Limited 52.40 million ( 52.40 million), Welspun Realty Private
Limited 284.48 million ( 284.48 million), Welspun Natural Resources Private Limited Nil ( 1,583.57 million), Welspun
Pipes Inc 299.58 million ( 271.43 million), recoverable from Managing Director 83.01 million ( Nil) {Refer note 45(b)}.
ii Corporate guarantees given - Welspun Pipes Inc 1,797.45 million ( 1,628.55 million), Welspun Urja Private Limited Nil
( 1,709.30 million), Welspun Middle East Pipes Company LLC 4,172.91 million ( 5,357.31 million), Welspun Energy
Limited 1,270 million ( 1,270 million), Adani Welspun Exploration Limited Nil ( 2,624.98 million), Welspun Tradings
Limited 8,927.55 million ( 4,668.51 million).
iii Investments held - Welspun Infratech Limited Nil ( 1,920.85 million), Welspun Maxsteel Limited Nil ( 8,079.57 million),
Welspun Mauritius Holdings Limited 3,363.63 million ( 3,981.36 million), Welspun Infratech Limited - optionally
convertible debentures Nil ( 4,228.90 million).
iv Share application money given - Welspun Pipes Limited 596.15 million ( 556.64 million).
v Trade receivables - Welspun Tubular LLC 1,497.82 million ( 214.06 million), Welspun Tradings Limited Nil
( 5,031.14 million).
vi Interest receivable from Welspun Natural Resources Private Limited - Nil ( 100.59 million), Welspun Pipes Inc
20.30 million ( 1.76 million).
vii Advance and deposits taken from Welspun Tradings Limited 735.90 million ( Nil).
viii Trade payables - Welspun India Limited Nil ( 19.35 million), Welspun Captive power Generation Limited 22.27 million
( 26.93 million), Welspun Projects Limited 9.01 million ( Nil).
ix Other receivables - Welspun Pipes Inc 6.35 million ( 220.38 million), Welspun Mauritius Holdings Limited 511 million
( Nil), Welspun Middle East Pipes Company LLC 134.23 million ( 140.85 million).
Note: Figures in bracket pertain to previous year.

127
WELSPUN Corp Limited
Notes forming part of the financial statements
40. Disclosure pursuant to Clause 32 of the listing agreement :
e
43. Earnings Per Share (EPS)
44. Other operating revenues
( in million)
- Welspun Natural Resources Private Limited – 1583.57 – 1955.74
- Welspun Plastic Private Limited – 35.38 – 35.38
- Welspun Pipes Inc 299.58 271.43 299.58 271.43
The Company's management is of the opinion that its international and domestic transactions are at arm's length as per the
independent accountants report for the year ended 31 March 2013. Management continues to believe that its international
transactions post March 2014 and the specified domestic transactions covered by the new regulations are at arm's length and that
the transfer pricing legislation will not have any impact on these financial statements, particularly on amount of tax expense and that
of provision of taxation.
Period to which it relates 2012 - 2013 2011 - 2012
Number of non-resident shareholders 20 23
Number of equity shares held on which dividend was due 57,156,754 22,119,265
Amount remitted ( in million) 28.58 11.06
(175.42) 530.86
a) For Basic EPS (Nos) 262,948,299 231,836,824
b) For Diluted EPS (Nos)* 262,948,299 231,836,824
Basic and Diluted ( )* (0.67) 2.29
( in million)
Scrap sales 925.95 1,262.78
Value added tax incentive 727.90 1,359.68
Export benefits 992.76 977.02
Excess provisions written back 100.54 –
Others 30.58 359.93
`
`
`
`
`
`
Balance as on 31 March Maximum amount
outstanding during
the year
2014 2013 2014 2013
Loans and advances in the nature of loans to subsidiaries:
Year of remittance (ending on) 2014 2013
2014 2013
I) Profit after tax for diluted EPS ( in million)
II) Weighted average number of equity shares for EPS computation
III) EPS on Face Value of 5 each
2014 2013
Total 2,777.73 3,959.41
*Foreign currency convertible bonds, Compulsory convertible debentures and Employee stock options plan are anti-dilutive and ignored in the calculation of
diluted earnings per share.
41.
42. Net dividend remitted in foreign exchang

128
WELSPUN Corp Limited
Notes forming part of the financial statements
45. Managerial Remuneration
46. Value of raw materials consumed
47. Value of stores and spares consumed
48. Value of imports on CIF basis in respect of
a) Remuneration paid or provided in accordance with section 198 of the Companies Act , 1956 to the Directors is as under:
( in million)
Salaries and Allowances – 36.79 3.71 131.34
Commission – – 11.87 –
Perquisites / Contribution to Provident Fund – 3.50 – 7.50
b) Application made to the Central Government in the year 2012-13 for appointment and remuneration payable to the Managing
Director, was approved in March 2014, albeit with a lower remuneration than applied. Consequently, payments made to the
Managing Director, based on the agreement and shareholders’ approval, has turned out to be in excess of the limits, specified
u/s. 198 read with Schedule XIII of the Companies Act, 1956 and the aforesaid Central Government approval for the financial
year 2012-13 by 83.01 million and the same is netted in employee benefits expense. The Managing Director holds the said
amount in trust and it is refundable to the Company.
Imported 18,131.97 69.95 33,873.23 81.50
Indigenous 7,787.64 30.05 7,686.69 18.50
Imported 95.09 15.95 228.47 11.79
Indigenous 500.94 84.05 1,709.01 88.21
( in million)
Raw materials 14,598.14 28,884.68
Capital goods 275.51 51.36
Stores and spares 209.41 295.61
Traded goods 4,965.17 9,296.01
Coal 57.16 576.93
`
`
` `
` `
`
2014 2013
Chairman Managing Chairman Managing
Director Director
Total – 40.29 15.58 138.84
2014 2013
in million % of in million % of
Consumption Consumption
Total 25,919.61 100.00 41,559.92 100.00
2014 2013
in million % of in million % of
Consumption Consumption
Total 596.03 100.00 1,937.48 100.00
2014 2013

129
WELSPUN Corp Limited
Notes forming part of the financial statements
49. Expenditure in foreign currency
50. Earnings in foreign exchange
51.
52. Scheme of Arrangement
( in million)
Freight, material handling and transportation expenses 302.63 534.90
Membership and other fees 11.75 8.12
Sales commission 377.13 521.37
Finance cost (including bank charges) 687.67 1,339.96
Professional and consultancy fees 52.33 75.88
Coating and other Job work charges 1,579.39 2,533.62
Others 18.91 98.54
( in million)
FOB value of exports (including goods-in-transit) 11,304.01 20,993.22
Job work charges 58.49 5,729.98
Interest received 19.01 1.76
Guarantee commission / Assignment fees 67.82 77.15
`
`
2014 2013
2014 2013
The company has been getting export/domestic orders and executing those orders through one of its subsidiaries. The realisation,
income/benefits/claims, or expenses relating to such transactions i.e. risks and reward of these transactions are all on company's
account, hence the said subsidiary is allowed to retain a small percentage as profit of turnover.
A Scheme of Arrangement between Welspun Corp Limited ("WCL" or the "Demerged Company") and Welspun Enterprises
Limited ("WEL" or a wholly owned subsidiary of WCL or the Resulting Company) and their respective shareholders and creditors
(the “Scheme”), providing for inter alia transfer of Other Business undertakings {viz. the infrastructure business (including
energy, water, road), the direct reduced iron ore (DRI), EPC contracting, oil and gas business} of WCL to WEL, was approved by
the Hon'ble High Court of Gujarat at Ahmedabad on 10 January 2014. The Scheme became effective on 24 January 2014 on
filing with the Registrar of Companies and consequently all the assets and liabilities of the Other Business undertakings of WCL
have been transferred by WCL with respective book values w.e.f. appointed date 1 April 2012. The Scheme has been given effect
to in these financial statements. However certain assets are under transfer in transferee's name, hence held in the Company's
name till then.
i) The whole of the assets and liabilities of Other Business undertakings of WCL are transferred to/and are vested with WEL
with effect from 1 April 2012 at book values and adjusted to the reserves as under:
a)
b) Pursuant to the Scheme:
( in million)
i) Non-current investments 13,242.36
ii) Loans and advances (including interest receivable and share application money) 2,779.60
iii) Current investments 6,640.00
iv) Cash and bank balances 1,310.00
i) Capital reserve 1,057.26
ii) Securities premium 17,252.74
iii) General reserve 1,696.11
iv) Surplus in the statement of profit and loss 3,965.85
`
23,971.96
Adjustment to reserves
23,971.96
ii) WEL to issue and allot equity shares to each member of WCL in the ratio of one equity share(s) of 10 each in WEL credited
as fully paid up for every 20 equity shares of 5 each fully paid up held by such member in WCL. Accordingly, WEL to issue
and allot 13,147,415 equity shares of 10 each to the members of WCL.
`
`
`

130
WELSPUN Corp Limited
Notes forming part of the financial statements
iii) The investment in equity shares of WEL of 0.5 million held by WCL has been cancelled and adjusted against surplus in the
statement of profit and loss.
iv) The net profit after tax of 25.97 million for the period from appointed date i.e. 1 April 2012 to 31 March 2013 is adjusted in
balance in the statement of profit and loss.
`
`
A Scheme of Arrangement between Welspun Corp Limited ("WCL" or the "Demerged Company") and Welspun Enterprises Limited
("WEL" or a wholly owned subsidiary of WCL and the Resulting Company) and their respective shareholders and creditors (the
“Scheme”) as referred in Note 52 was approved by the Hon'ble High Court of Gujarat at Ahmedabad on 10 January 2014. The Scheme
became effective on 24 January 2014 on filing with the Registrar of Companies and consequently all the assets and liabilities of the
Other Business undertakings of WCL have been transferred by WCL with respective book values w.e.f. appointed date 1 April 2012.
Details of Profit / (Loss) from continuing and discontinued operations ;
Revenue from operations (Net) 48,676.12 – 48,676.12 66,321.65 – 66,321.65
Other income 1,748.13 – 1,748.13 2,244.69 759.08 3,003.77
Total expenditure other than finance costs 48,460.22 – 48,460.22 64,885.75 32.85 64,918.60
Finance costs 2,239.81 – 2,239.81 2,988.98 – 2,988.98
Less: Exceptional item – – – – 538.20 538.20
Tax expense (100.36) – (100.36) 186.73 162.06 348.79
The carrying amount of assets and liabilities pertaining to the discontinued operations are as follows:
Total assets – 23,997.94
Total liabilities – –
Previous years figures have been regrouped / reclassified wherever necessary to correspond with current year's classification /
disclosures and are not comparable with the current year’s figure in view of reasons stated in note 52 above.
For the Year ended 31 March 2014 For the Year ended 31 March 2013
Discontinued Discontinued
operations operations operations operations
Revenue
Total 50,424.25 – 50,424.25 68,566.35 759.08 69,325.42
Expenditure
Total 50,700.03 – 50,700.03 67,874.73 32.85 67,907.58
Profit / (loss) before tax and exceptional item (275.78) – (275.78) 691.62 726.23 1,417.84
Profit / (loss) before tax (275.78) – (275.78) 691.62 188.03 879.65
Profit / (loss) for the year (175.42) – (175.42) 504.89 25.97 530.86
53. Discontinued Operations
54.
( in million)
( in million)
`
`
Continuing Total Continuing Total
As at As at
31 March 2014 31 March 2013
As per our attached report of even date For and on behalf of the Board
MGB & Co. B.K.Goenka Braja Mishra
Mohan Bhandari S. Krishnan Pradeep Joshi
For
Chartered Accountants Chairman Managing Director
Firm Registration Number 101169W
Partner Chief Financial Officer Company Secretary
Membership Number 12912
Mumbai, 29 April 2014

131
WELSPUN Corp Limited
Notes forming part of the financial statements
As per our attached report of even date For and on behalf of the Board
MGB & Co. B.K.Goenka Braja Mishra
Mohan Bhandari S. Krishnan Pradeep Joshi
For
Chartered Accountants Chairman Managing Director
Firm Registration Number 101169W
Partner Chief Financial Officer Company Secretary
Membership Number 12912
Mumbai, 29 April 2014
2014 2013
A) Cash flow from operating activities
Profit/(loss) before tax (including profit before tax from discountinued operations) (275.78) 879.65
Operating profit before working capital changes 3,005.99 2,653.20
Adjustments for
Cash generated from operations 4,045.47 (653.29)
Net cash from/(used in) operating activities (A) 3,900.61 (800.73)
B) Cash flow from investing activities
Net cash from investing activities (B) (78.92) 1,784.60
C) Cash flow from financing activities
Net cash used in financing activities (C) (7,597.75) (3,119.67)
Net changes in cash and bank balances (A+B+C) (3,776.06) (2,135.80)
Cash and bank balances at the end of the year 497.57 4,273.63
Notes:
2014 2013
Adjustments for
Depreciation and amortisation expense 2,255.69 2,289.91
Interest expense 1,993.51 2,280.07
Interest income (1,155.94) (1,691.27)
Loss on sale/discard of tangible assets (net) 1.95 8.29
Provision for impairment of tangible assets 12.45 106.09
Profit on sale/redemption of
- Current investments (207.72) (331.08)
- Non-current investment in subsidiary (242.55) (234.42)
Dividend income on
- Non-current investment in subsidiary – (220.38)
- Current investments (7.93) (249.46)
Provision for doubtful debts and advances (Net) (39.71) 57.11
Provision for diminution in value of non-current investments – 0.80
Employee compensation expenses (Net) (0.73) (6.60)
Exchange adjustments (Net) 672.75 (235.50)
Trade and other receivables 6,375.83 1,286.41
Inventories 9,450.39 1,756.65
Trade and other payables (14,786.74) (6,349.55)
Direct taxes paid (net of refunds) (144.86) (147.44)
Purchase of fixed assets (including capital work-in-progress) (950.54) (1,309.20)
Sale of fixed assets (Net) 22.23 7.45
Purchase of long-term investments in subsidiaries (8.46) (1,877.79)
Sale/redemption of long-term investments in
- Subsidiary 366.25 878.96
- Joint Venture – 0.06
Sale of current investments (Net) (750.03) 2,802.75
(Increase)/decrease in share application money given to
- Subsidiaries (47.96) (610.59)
- Others – (21.55)
Loan given to subsidiary – (502.63)
Dividend received 228.30 249.46
Interest received 1,061.28 2,167.68
Proceeds from issue of equity shares (including securities premium) – 10.27
Proceeds from issue of debentures (Net of issue expenses) – 3,371.60
Redemption of debentures – (1,700.00)
Repurchase of foreign currency convertible bonds (352.85) (3,484.94)
Proceeds from long-term borrowings – 5,498.00
Repayment of long-term borrowings (5,491.44) (2,611.70)
Increase/(decrease) in short-term borrowings (Net) 437.17 (1,750.25)
Interest paid (2,037.89) (2,320.18)
Dividend paid (including corporate dividend tax) (152.74) (132.47)
Cash and bank balances at the beginning of the year 4,273.63 6,409.43
1. Cash and bank balances at the end of the year include unrealised gain of 2.48 million (Unrealized loss of 8.76 million) which is on account of realignment ofcurrent account/fixed deposits held in foreign currency.
2. Transactions pursuant to the Scheme of Arrangement as referred in note 52 is not considered in the above cash flow statement, being non-cash transactions.
3. Cash and bank balances include 444.00 million ( 565.72 million) which is not available for use by the company.
4. Cash flow in respect of ordinary activities attributable to discontinued operations.
Cash and bank balances transferred pursuant to the Scheme of Arrangement (Refer Note 52) – 1,310.00
Cash flow from operating activities – (552.45)
Cash flow from investing activities – (757.55)
Cash flow from financing activities – –
5. Previous year figures have been regrouped/recast wherever necessary.
` `
` `
( in million)`

132
WELSPUN Corp Limited
Sta
tem
en
t P
urs
ua
nt
to S
ect
ion
21
2 o
f th
e C
om
pa
nie
s A
ct,1
95
6,
rela
ted
to
Su
bsi
dia
ry C
om
pa
nie
s
Na
me
of
Th
e S
ub
sid
iary
Co
mp
an
yW
els
pu
nW
els
pu
nW
els
pu
nW
els
pu
nW
els
pu
nW
els
pu
nW
els
pu
nW
els
pu
nW
els
pu
n
Pip
es
Inc
Tub
ula
r LL
CG
lob
al
Pip
es
Ltd
.Tr
ad
ing
s Lt
d.
Ma
uri
tiu
sM
idd
le E
ast
Mid
dle
Ea
stM
idd
le E
ast
Tra
de
LLC
Ho
ldin
gs
Ltd
DM
CC
Pip
es
Pip
es
Co
mp
an
y L
LCC
oa
tin
gs
Co
mp
an
y L
LC
Fin
an
cia
l Ye
ar
of
the
Su
bsi
dia
ry e
nd
ed
on
31
st M
arc
h,
31
st M
arc
h,
31
st M
arc
h,
31
st M
arc
h,
31
st M
arc
h,
31
st M
arc
h,
31
st M
arc
h,
31
st M
arc
h,
31
st M
arc
h,
20
14
20
14
20
14
20
14
20
14
20
14
20
14
20
14
20
14
Sh
are
s o
f th
e S
ub
sid
iary
Co
mp
an
y h
eld
on
th
e
ab
ov
e d
ate
an
d e
xte
nt
of
ho
ldin
g
(i)
Eq
uit
y s
ha
res
1,0
00
----
----
50
,00
0 e
qu
ity
50
,13
,40
21
,02
,08
9--
----
----
--
Co
mm
on
sha
res
of
10
eq
uit
y s
ha
res
eq
uit
y s
ha
res
Sto
ck o
fe
ach
of
10
ea
cho
f U
S$
1 e
ach
$.0
00
1 p
ar
va
lue
ea
ch
(ii)
Pre
fere
nce
Sto
ck--
----
----
----
----
--6
6,1
54
,00
0--
----
----
--
pre
fere
nce
sha
res
of
US
$ 1
ea
ch
(iii
)E
xte
nt
of
ho
ldin
g /
Co
ntr
ol
10
0%
10
0%
10
0%
10
0%
10
0%
89
.98
%1
00
%5
0.0
1%
50
.01
%
Ne
t a
gg
reg
ate
am
ou
nt
of
pro
fit
/ (l
oss
es)
of
sub
sid
iary
fo
r th
e a
bo
ve
fin
an
cia
l y
ea
r so
fa
r
as
the
y c
on
cern
me
mb
ers
of
the
Co
mp
an
y
15
.18
57
9.4
10
.86
(0.0
7)
71
.87
22
2.7
5(4
9.3
2)
98
.26
(72
.21
)
Ne
t a
gg
reg
ate
am
ou
nt
of
pro
fits
/ (
loss
es)
fo
r
pre
vio
us
fin
an
cia
l y
ea
r th
e s
ub
sid
iary
as
far
as
it c
on
cern
th
e m
em
be
rs o
f th
e C
om
pa
ny
25
.13
27
6.6
89
.72
–6
3.9
7(2
34
.46
)(9
.18
)0
.20
90
.47
`
`
` `
(i)
De
alt
wit
h i
n t
he
acc
ou
nts
of
the
Co
mp
an
y
for
the
ye
ar
en
de
d 3
1 M
arc
h 2
01
4 (
mil
lio
n)
(ii)
No
t d
ea
lt w
ith
in
th
e a
cco
un
ts o
f th
e C
om
pa
ny
for
the
ye
ar
en
de
d 3
1 M
arc
h 2
01
4 (
mil
lio
n)
(i)
De
alt
wit
h i
n a
cco
un
ts o
f th
e C
om
pa
ny
(ii)
No
t d
ea
lt w
ith
in
th
e a
cco
un
ts o
f th
e C
om
pa
ny
For
an
d o
n b
eh
alf
of
the
Bo
ar d
B.K
.Go
en
ka
Bra
ja M
ish
ra
S.
Kri
shn
an
Pra
de
ep
Jo
shi
Ch
air
ma
nM
an
ag
ing
Dir
ect
or
Ch
ief
Fin
an
cia
l O
ffic
er
Co
mp
an
y S
ecr
eta
ry
Mu
mb
ai,
29
Ap
ril
20
14
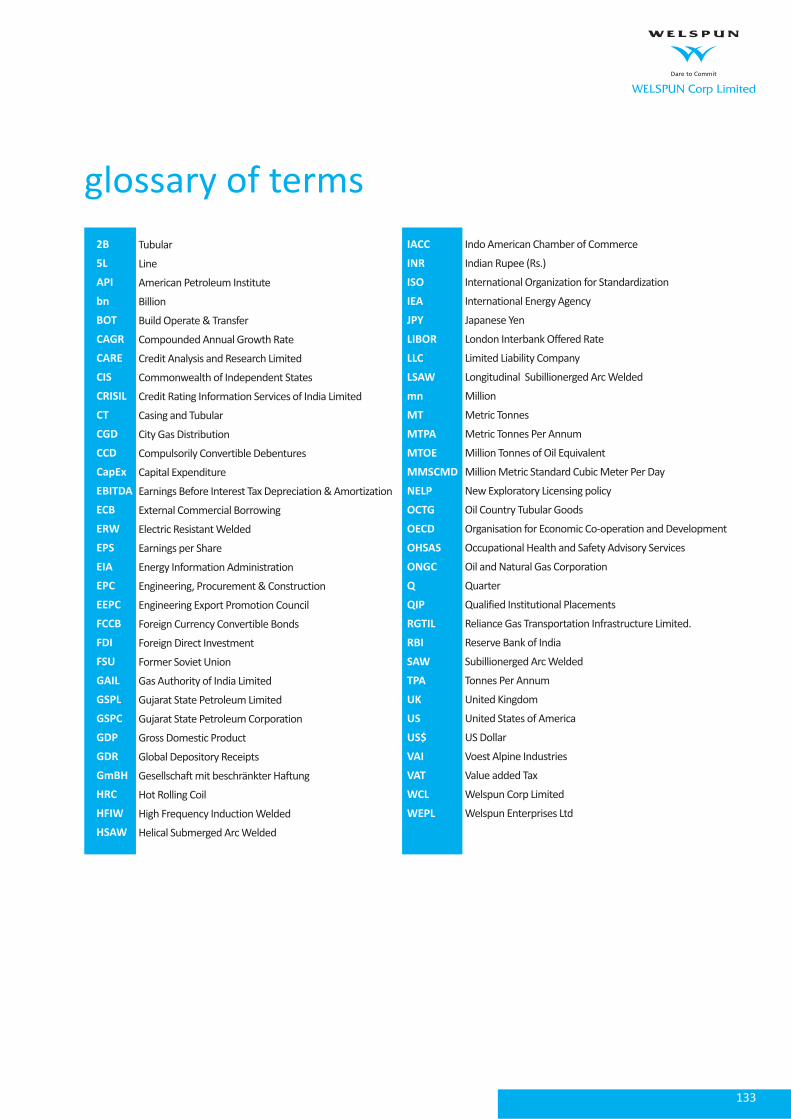
133
WELSPUN Corp Limited
Tubular
Line
American Petroleum Institute
Billion
Build Operate & Transfer
Compounded Annual Growth Rate
Credit Analysis and Research Limited
Commonwealth of Independent States
Credit Rating Information Services of India Limited
Casing and Tubular
City Gas Distribution
Compulsorily Convertible Debentures
Capital Expenditure
Earnings Before Interest Tax Depreciation & Amortization
External Commercial Borrowing
Electric Resistant Welded
Earnings per Share
Energy Information Administration
Engineering, Procurement & Construction
Engineering Export Promotion Council
Foreign Currency Convertible Bonds
Foreign Direct Investment
Former Soviet Union
Gas Authority of India Limited
Gujarat State Petroleum Limited
Gujarat State Petroleum Corporation
Gross Domestic Product
Global Depository Receipts
Gesellschaft mit beschränkter Haftung
Hot Rolling Coil
High Frequency Induction Welded
Helical Submerged Arc Welded
2B
5L
API
bn
BOT
CAGR
CARE
CIS
CRISIL
CT
CGD
CCD
CapEx
EBITDA
ECB
ERW
EPS
EIA
EPC
EEPC
FCCB
FDI
FSU
GAIL
GSPL
GSPC
GDP
GDR
GmBH
HRC
HFIW
HSAW
glossary of terms
IACC
INR
ISO
IEA
JPY
LIBOR
LLC
LSAW
mn
MT
MTPA
MTOE
MMSCMD
NELP
OCTG
OECD
OHSAS
ONGC
Q
QIP
RGTIL
RBI
SAW
TPA
UK
US
US$
VAI
VAT
WCL
WEPL
Indo American Chamber of Commerce
Indian Rupee (Rs.)
International Organization for Standardization
International Energy Agency
Japanese Yen
London Interbank Offered Rate
Limited Liability Company
Longitudinal Subillionerged Arc Welded
Million
Metric Tonnes
Metric Tonnes Per Annum
Million Tonnes of Oil Equivalent
Million Metric Standard Cubic Meter Per Day
New Exploratory Licensing policy
Oil Country Tubular Goods
Organisation for Economic Co-operation and Development
Occupational Health and Safety Advisory Services
Oil and Natural Gas Corporation
Quarter
Qualified Institutional Placements
Reliance Gas Transportation Infrastructure Limited.
Reserve Bank of India
Subillionerged Arc Welded
Tonnes Per Annum
United Kingdom
United States of America
US Dollar
Voest Alpine Industries
Value added Tax
Welspun Corp Limited
Welspun Enterprises Ltd

Star Performer Award for the year 2008-09
– All India Export Excellence Awards
EEPC 20102010
AWARD/RECOGNITION
Top Indian Company under Metal Pipes Dun & Bradstreet2010
National Awards for Export Excellence
- Silver Trophy
Engineering Export
Promotion Council
- India
2009
Most Valuable Company in Metal Pipes Dun & Bradstreet2008
Emerging Company of the Year Economic Times
Corporate
Excellence Award
2008
2nd Largest Steel Pipe Producer in
the World (Large Diameter)
Financial Times (UK)2008
Best Indian Manufacturing Company in the US IACC 20112011
Star Performer GAIL (India) Ltd.2011
Top Export for the Year 2010-11
- Gold Trophy
EEPC2011
BESTOWED BYYEAR
IPLOCA CSR Award (Runner Up) TOTAL2013
Excellence In Global Trade Governor's Award2013

Welspun House, 5th Floor, Kamala Mills Compound, Senapati Bapat Marg, Lower Parel, Mumbai 400 013, India
Tel: +91 22 66136000 / 24908000 Fax: +91 22 24908020 / 24908021 Website: www.welspuncorp.com
www.welspuncorp.com
WELSPUN Corp Limited