west bengal state sentinel surveillance report on hiv...
TRANSCRIPT
West Bengal State Sentinel Surveillance
Report on HIV Infection Status and Trend Analysis: 2008-09
Prepared for
West Bengal State AIDS Prevention and Control Society
FINAL REPORT
Quest Advisory Services Pvt. Ltd.
Flat GA1, 201 Jodhpur Park Kolkata 700 068

CONTENTS
1� Introduction ............................................................................................................................ 1�1.1 Objectives of HIV Surveillance ....................................................................................... 1�1.2 Surveillance in India ........................................................................................................ 1�1.3 Annual Sentinel Surveillance in West Bengal ................................................................. 2�
2� HIV Sentinel Surveillance 2008: 12th round ......................................................................... 3�2.1 Dry Blood Spot Method ................................................................................................... 3�2.2 Sample size per site - 2008 .............................................................................................. 4�
3� Status of HIV & VDRL Infection - 2008, 12 th round ......................................................... 6�3.1 Site Wise Status ............................................................................................................... 7 3.2 District wise HIV Prevalence: 2008 .............................................................................. 10
4� Status of ANC Sites ............................................................................................................. 13�4.1 Round Wise Individual Site Report: ANC Sites ............................................................ 17 4.2 Demographic Characteristics: ANC Sites Attendees ..................................................... 22�
5� Status of STD Sites .............................................................................................................. 26�5.1 Round Wise Individual Site Report: STD Sites ............................................................. 28 5.2 Demographic Characteristics: STD Sites Attendees ...................................................... 32�
6� Status of FSW Sites ............................................................................................................. 40�6.1 Round Wise Individual Site Report: FSW Sites ............................................................ 41 6.2 Demographic Characteristics: FSW Sites Attendees ..................................................... 45�
7� Statue of IDU Sites .............................................................................................................. 47�7.1 Round Wise Individual Site Report: IDU Sites ............................................................. 48 7.2 Demographic Characteristics: IDU Sites Attendees ...................................................... 49�
8� Status of MSM Sites ............................................................................................................ 52�8.1 Round Wise Individual Site Report: MSM Sites ........................................................... 52 8.2 Demographic Characteristics: MSM Sites Attendees .................................................... 54�
9� Status of Truckers Sites ....................................................................................................... 56�9.1 Round Wise Individual Site Report: Truckers Sites ...................................................... 56 9.2 Demographic Characteristics: Trucker Sites Attendees ................................................ 58�
10� Status of Migrant Labourer Sites ......................................................................................... 60�
Annexure 1: List of Sentinel Sites - 2008 ..................................................................................... 62�
Annexure 2: Testing Labs for ANC & STD Sites - 2008 ............................................................. 65�
Annexure 3: Guidelines Overview - 2008 .................................................................................... 66�
Annexure 4: EQA Report of Testing Laboratories ....................................................................... 68

Sentinel Surveillance in West Bengal: 2008
1
1 Introduction HIV surveillance can be defined as “A collection of epidemiological information of sufficient accuracy and completeness regarding the distribution and spread of HIV infection to be relevant for the planning and implementation of HIV / AIDS prevention and control programme activities”.
1.1 Objectives of HIV Surveillance 1. To provide an understanding of the spread of HIV infection by determining the level of
infection in different States and identifying pockets of high prevalence (“hot spots”).
2. To determine the geographical distribution and trends of infection
3. To provide information for the prioritization of resources and evaluation of the national response.
4. To estimate number of people infected with HIV in the country, utilizing the HSS data in the absence of any other reliable community based data.
5. To identify data to facilitate the integration of HIV/AIDS and Reproductive Child Health (RCH) under the National Rural Health Mission (NRHM).
Since the primary objective of surveillance is to monitor trends in HIV infection over time and place, cross-sectional studies of HIV sero-prevalence (also known as prevalence surveys) at regular and repeated intervals among “sentinel groups” need to be conducted using a consistent methodology in the same population group so as to demonstrate the trend or true change, if any, in HIV prevalence. The following epidemiological aspects should be kept in mind when interpreting surveillance data.
• HIV infections are not uniformly distributed in any population. The distribution of HIV infection in the population depends on the prevalence of certain behaviors or practices associated with an increased risk of HIV infection.
• There are limited major modes of HIV transmission and not everyone in the population runs the same risk of HIV infection.
1.2 Surveillance in India
Surveillance activities started in 1985 when ICMR started screening blood from High Risk Groups to find out if HIV was present in the country and the evidence of HIV was first documented in Chennai in 1986. Until 1992, surveillance was based on data generated from 62 surveillance centers and 9 referral centers situated in different parts of the country. Heterosexual route is the predominant mode of transmission, followed by injecting drug use. However as the data was pooled, it did not suit the objective of monitoring HIV trends in the country over different geographic areas. Sentinel Surveillance was adopted in 1993–94 with the objective to monitor trends in specific High Risk Groups e.g. STD patients and in Low Risk Groups consisting of the antenatal clinic attendees. However all the designated sites did not carry out the surveillance activities and the data obtained was incomplete. The system underwent modification from time to time in response to the changing scenario in the country. The 2007 round found an HIV prevalence of 7.76% among IDUs, 5.61% among MSM, 5.92% among FSWs and 0.42%
Sentinel Surveillance in West Bengal: 2008
2
among pregnant women. When compared to the previous year’s figures in 2006 (4.64% among IDUs, 6.12% among MSM and 6.12% among FSWs and 0.40% among pregnant women), the 2007 results suggest that the trend in the epidemic continues; it is concentrated in the high risk groups and trickling into the general population.
1.3 Annual Sentinel Surveillance in West Bengal The HIV sentinel site surveillance is the main source of data on HIV prevalence and related trends in the state. An unlinked anonymous sampling procedure is adopted (according to NACO guidelines) for rapid collection of information from a broad cross-section of the population i.e. critical populations and geographical areas based on epidemiological considerations. Both most-at risk and less vulnerable sections of the population are covered. The first state wide annual sentinel surveillance started in 1998 initially with small number of sites gradually increasing in number of the sites as per guidelines of NACO for widespread representation of the vulnerable areas. The data interpreted is useful for assessing and estimating the currently infected and the number expected to develop AIDS in the future:
i. HIV / AIDS infection status and trend on HIV infection in the State and in the Zone Planning for management of HIV and AIDS cases
ii. To identify priority areas and population groups
iii. To help government and NGO programme managers at State and different local levels to plan effective interventions and services delivery. The information is extremely important in the advocacy process with key local, State and National Policy and Decision makers.
Sentinel Surveillance in West Bengal: 2008
3
2 HIV Sentinel Surveillance 2008: 12th round
Sentinel Surveillance is carried out once a year state-wise, all over India to look at the HIV infection trends. The 12th round of HIV Sentinel Surveillance was carried out at 55 designated sites across West Bengal. 21 sites for ANC attendees, 9 for STD clients, 4 for IDUs, 4 for MSMs, 1 for Migrant Labors, 5 for Truckers and 11 for FSWs have been selected following the operational guidelines for HIV Sentinel Surveillance – 2008.
This year there has been inclusion of one new MSM site, nine new ANC sites (one ANC site at Basulia RH was removed due to incomplete i.e. <60% sample collection in three months during last HSS round) and two new FSW site as well as exclusion of one IDU site( due to closure of one IDU TI-NGO).
Apart from measures undertaken for maintaining quality standards of data collected, the external quality assurance for HIV testing of the samples had been given priority.
During current HSS round, 2008-09 Unlinked Anonymous sampling procedure was followed for ANC and STD sites as previous years. But for the HRG sites (FSW, MSM, IDU, Truckers, Migrant Labours) a new method of Dry Blood Spot collected after obtaining informed consent from the participant was followed.
2.1 Dry Blood Spot Method To reduce the burden of laboratory procedures like collecting, centrifuging, and maintaining cold chain for storage and transportation and generation of biomedical waste NACO introduced a new method of Dry Blood Spot (DBS) during the HSS 2008-09 round.
A self retractable safety lancet was used for finger pricking and blood spots (preferably five) were collected on a specially designed filter paper from the participants. These filter papers were packed in a polythene zip lock bag along with desiccants stored and sent by post to the testing laboratories. Department of Virology, School of Tropical Medicine, Kolkata was the identified testing laboratory for West Bengal among four Regional testing laboratories for DBS.
Any participant satisfying inclusion criteria attending the TI-NGO facility was asked for documented informed consent for participating in HSS. Sampling was done in a consecutive manner till reaching required sample size of 250 within three months. The inclusion criteria were followed according to the NACO HSS Guideline 2008 as follows:
1. First time visitor during the HSS period
2. 18-49 years (15-49 for FSW)
3. a) FSW: Sold sex for money / engaged in consensual sex for money or payment in kind as a principal means of livelihood in last six months
b) MSM: Men who have engaged in sex, anal or oral with another male at least once in the previous month
c) IDU: current users, those who have injected at least once in previous six months (including shadow users)
d) Truckers: Long Distance Truckers (Drivers and Helpers) who travel more than 800 km one way between source and destination
Sentinel Surveillance in West Bengal: 2008
4
e) Migrant Labourers: Men who are living at a place other than “place of usual residence” without spouse or family members for >6 months for purpose of work
The participants may opt out from HSS activities. In the TI-NGO clinic a register was maintained to document the consecutiveness of sampling and reasons of opt outs. The reason of excluding any participant not satisfying the inclusion criteria is also documented in the register for HSS at the TI site.
2.2 Sample size per site - 2008
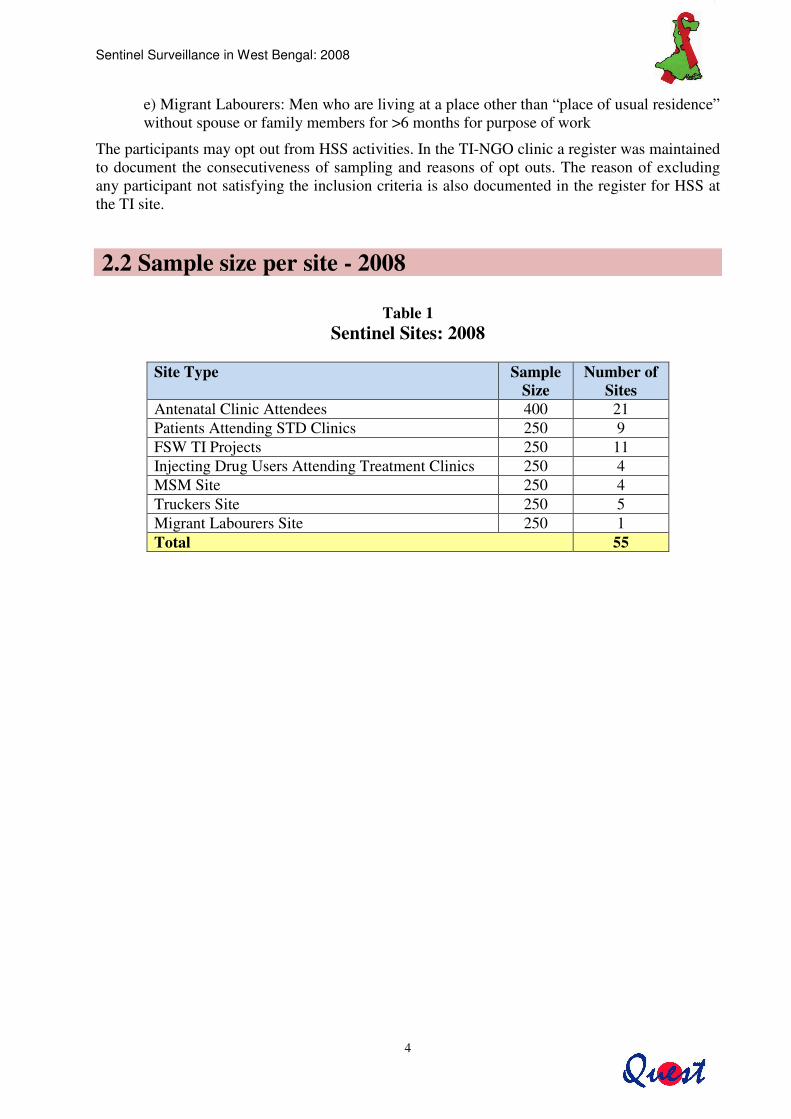
Table 1 Sentinel Sites: 2008
Site Type Sample
Size Number of
Sites Antenatal Clinic Attendees 400 21 Patients Attending STD Clinics 250 9 FSW TI Projects 250 11 Injecting Drug Users Attending Treatment Clinics 250 4 MSM Site 250 4 Truckers Site 250 5 Migrant Labourers Site 250 1 Total 55

Sentinel Surveillance in West Bengal: 2008
5
Figure 1 Site Map
Sentinel Surveillance in West Bengal: 2008
6
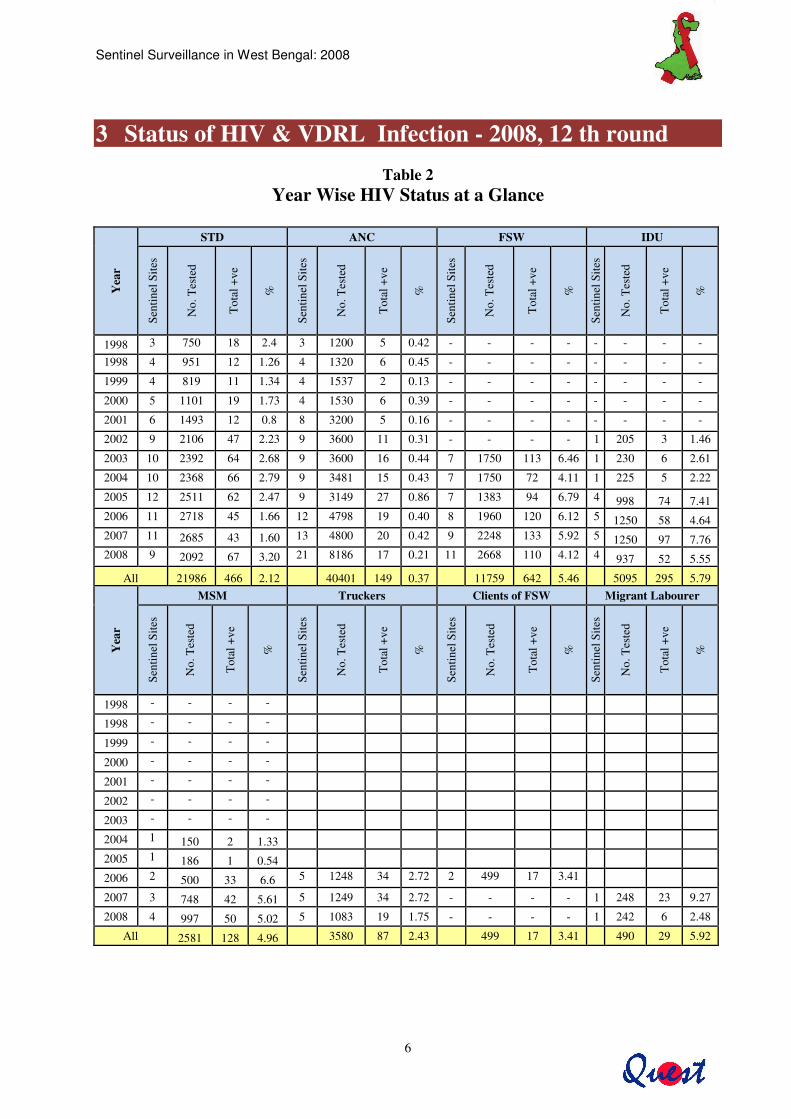
3 Status of HIV & VDRL Infection - 2008, 12 th round
Table 2 Year Wise HIV Status at a Glance
Yea
r
STD ANC FSW IDU
Sent
inel
Site
s
No.
Tes
ted
Tot
al +
ve
%
Sent
inel
Site
s
No.
Tes
ted
Tot
al +
ve
%
Sent
inel
Site
s
No.
Tes
ted
Tot
al +
ve
%
Sent
inel
Site
s
No.
Tes
ted
Tot
al +
ve
%
1998 3 750 18 2.4 3 1200 5 0.42 - - - - - - - -
1998 4 951 12 1.26 4 1320 6 0.45 - - - - - - - -
1999 4 819 11 1.34 4 1537 2 0.13 - - - - - - - -
2000 5 1101 19 1.73 4 1530 6 0.39 - - - - - - - -
2001 6 1493 12 0.8 8 3200 5 0.16 - - - - - - - -
2002 9 2106 47 2.23 9 3600 11 0.31 - - - - 1 205 3 1.46
2003 10 2392 64 2.68 9 3600 16 0.44 7 1750 113 6.46 1 230 6 2.61
2004 10 2368 66 2.79 9 3481 15 0.43 7 1750 72 4.11 1 225 5 2.22
2005 12 2511 62 2.47 9 3149 27 0.86 7 1383 94 6.79 4 998 74 7.41 2006 11 2718 45 1.66 12 4798 19 0.40 8 1960 120 6.12 5 1250 58 4.64 2007 11 2685 43 1.60 13 4800 20 0.42 9 2248 133 5.92 5 1250 97 7.76 2008 9 2092 67 3.20 21 8186 17 0.21 11 2668 110 4.12 4 937 52 5.55
All 21986 466 2.12 40401 149 0.37 11759 642 5.46 5095 295 5.79
Yea
r
MSM Truckers Clients of FSW Migrant Labourer
Sent
inel
Site
s
No.
Tes
ted
Tot
al +
ve
%
Sent
inel
Site
s
No.
Tes
ted
Tot
al +
ve
%
Sent
inel
Site
s
No.
Tes
ted
Tot
al +
ve
%
Sent
inel
Site
s
No.
Tes
ted
Tot
al +
ve
%
1998 - - - -
1998 - - - -
1999 - - - -
2000 - - - -
2001 - - - -
2002 - - - -
2003 - - - -
2004 1 150 2 1.33
2005 1 186 1 0.54
2006 2 500 33 6.6 5 1248 34 2.72 2 499 17 3.41
2007 3 748 42 5.61 5 1249 34 2.72 - - - - 1 248 23 9.27
2008 4 997 50 5.02 5 1083 19 1.75 - - - - 1 242 6 2.48
All 2581 128 4.96 3580 87 2.43 499 17 3.41 490 29 5.92
Sentinel Surveillance in West Bengal: 2008
7
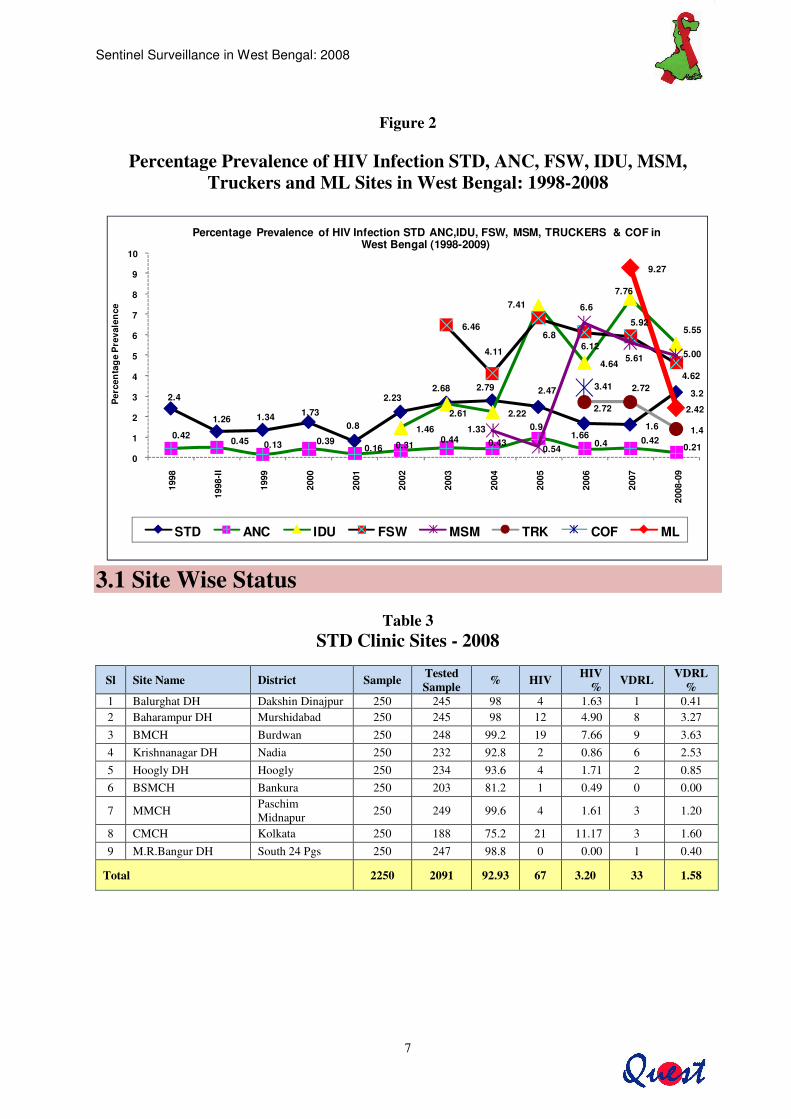
Figure 2
Percentage Prevalence of HIV Infection STD, ANC, FSW, IDU, MSM,
Truckers and ML Sites in West Bengal: 1998-2008
2.4
1.26 1.34 1.730.8
2.232.68 2.79 2.47
1.661.6
3.2
0.420.45 0.13 0.39
0.16 0.31 0.44 0.43
0.9
0.4 0.420.21
1.46
2.61 2.22
7.41
4.64
7.76
5.556.46
4.11
6.86.12
5.92
4.62
1.33
0.54
6.6
5.61 5.00
2.72
2.72
1.4
3.41
9.27
2.42
0
1
2
3
4
5
6
7
8
9
10
1998
1998
-II
1999
2000
2001
2002
2003
2004
2005
2006
2007
2008
-09
Per
cen
tag
e P
reva
len
ce
Percentage Prevalence of HIV Infection STD ANC,IDU, FSW, MSM, TRUCKERS & COF in West Bengal (1998-2009)
STD ANC IDU FSW MSM TRK COF ML
3.1 Site Wise Status
Table 3
STD Clinic Sites - 2008 �
Sl Site Name District Sample Tested Sample % HIV HIV
% VDRL VDRL %
1 Balurghat DH Dakshin Dinajpur 250 245 98 4 1.63 1 0.41 2 Baharampur DH Murshidabad 250 245 98 12 4.90 8 3.27 3 BMCH Burdwan 250 248 99.2 19 7.66 9 3.63 4 Krishnanagar DH Nadia 250 232 92.8 2 0.86 6 2.53 5 Hoogly DH Hoogly 250 234 93.6 4 1.71 2 0.85 6 BSMCH Bankura 250 203 81.2 1 0.49 0 0.00
7 MMCH Paschim Midnapur 250 249 99.6 4 1.61 3 1.20
8 CMCH Kolkata 250 188 75.2 21 11.17 3 1.60 9 M.R.Bangur DH South 24 Pgs 250 247 98.8 0 0.00 1 0.40
Total 2250 2091 92.93 67 3.20 33 1.58
Sentinel Surveillance in West Bengal: 2008
8
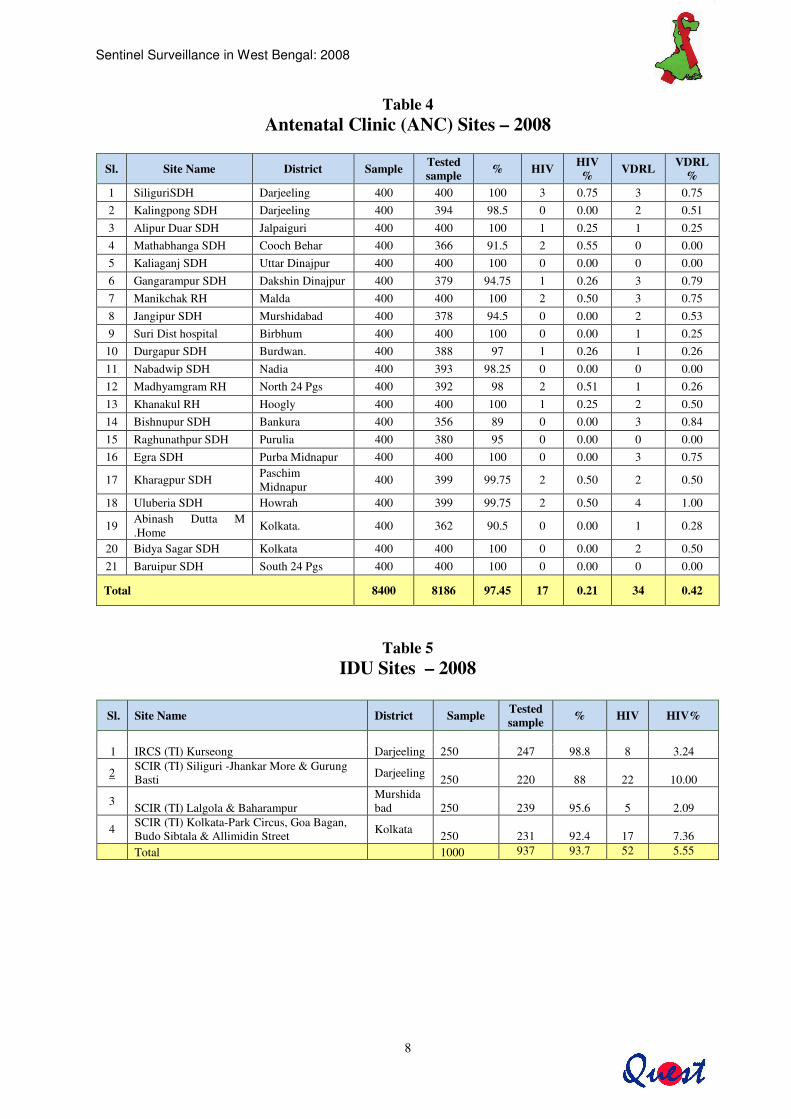
Table 4 Antenatal Clinic (ANC) Sites – 2008
Sl. Site Name District Sample Tested
sample % HIV HIV% VDRL VDRL
% 1 SiliguriSDH Darjeeling 400 400 100 3 0.75 3 0.75 2 Kalingpong SDH Darjeeling 400 394 98.5 0 0.00 2 0.51 3 Alipur Duar SDH Jalpaiguri 400 400 100 1 0.25 1 0.25 4 Mathabhanga SDH Cooch Behar 400 366 91.5 2 0.55 0 0.00 5 Kaliaganj SDH Uttar Dinajpur 400 400 100 0 0.00 0 0.00 6 Gangarampur SDH Dakshin Dinajpur 400 379 94.75 1 0.26 3 0.79 7 Manikchak RH Malda 400 400 100 2 0.50 3 0.75 8 Jangipur SDH Murshidabad 400 378 94.5 0 0.00 2 0.53 9 Suri Dist hospital Birbhum 400 400 100 0 0.00 1 0.25 10 Durgapur SDH Burdwan. 400 388 97 1 0.26 1 0.26 11 Nabadwip SDH Nadia 400 393 98.25 0 0.00 0 0.00 12 Madhyamgram RH North 24 Pgs 400 392 98 2 0.51 1 0.26 13 Khanakul RH Hoogly 400 400 100 1 0.25 2 0.50 14 Bishnupur SDH Bankura 400 356 89 0 0.00 3 0.84 15 Raghunathpur SDH Purulia 400 380 95 0 0.00 0 0.00 16 Egra SDH Purba Midnapur 400 400 100 0 0.00 3 0.75
17 Kharagpur SDH Paschim Midnapur 400 399 99.75 2 0.50 2 0.50
18 Uluberia SDH Howrah 400 399 99.75 2 0.50 4 1.00
19 Abinash Dutta M .Home Kolkata. 400 362 90.5 0 0.00 1 0.28
20 Bidya Sagar SDH Kolkata 400 400 100 0 0.00 2 0.50 21 Baruipur SDH South 24 Pgs 400 400 100 0 0.00 0 0.00
Total 8400 8186 97.45 17 0.21 34 0.42
�
�
�
�
�
�
�
�
�
�
�
Table 5 IDU Sites – 2008
Sl. Site Name District Sample Tested
sample % HIV HIV%
1 IRCS (TI) Kurseong Darjeeling 250 247 98.8 8 3.24
2 SCIR (TI) Siliguri -Jhankar More & Gurung Basti Darjeeling
250
220
88
22
10.00
3 SCIR (TI) Lalgola & Baharampur Murshidabad
250
239
95.6
5
2.09
4 SCIR (TI) Kolkata-Park Circus, Goa Bagan, Budo Sibtala & Allimidin Street Kolkata
250
231
92.4
17
7.36 Total 1000 937 93.7 52 5.55

Sentinel Surveillance in West Bengal: 2008
9
Table 7
MSM Sites – 2008
Table 8
Truckers Site – 2008
Table 9
ML Site – 2008
�
Site Name District Sample Tested sample
% HIV HIV%
1. HDRI Kolkata Kolkata 250 242 96.8 6 2.48
Total 250 242 96.8 6 2.48
Table 6
FSW Sites – 2008
Sl. Site Name District Sample Tested sample % HIV HIV %
1 DMSC(TI) Khalpara,Darjeeling Darjeeling 250 250 100 2 0.80
2 Jalpaiguri (TI) Hriday Jalpaiguri 250 250 100 0 0.00 3 DMSC (TI)Islampur/Panjipara Uttar Dinajpur 250 243 97.2 18 7.41 4 SPMUS (TI) Behrampur Murshidabad 250 249 99.6 3 1.20 5 Suri & Sainthia EICS (TI) Birbhum 250 244 97.6 7 2.87 6 DMSC (TI) Durgapur Burdwan 250 246 98.4 8 3.25 7 DISHA(TI)Janakalyan Kendra Burdwan 250 200 80 6 3.00 8 SBMS (TI) Basirhat North 24 Pgs 250 234 93.6 23 9.83 9 VES(TI) Haldia Purba Medinipur 253 253 100 17 6.72 10 SHIP (TI) Kol Kolkata 250 249 99.6 22 8.84 11 CWRC (TI) Diamond Harbou South 24 Pgs 250 250 100 4 1.60
Total 2753 2668 97.0 110 4.12
Sl Site Name District Sample Tested sample % HIV HIV%
1 Manas Bangla (TI) Siliguri Darjeeling 250 248 99.2 9 3.63
2 Manas Bangla (TI) Srerampur & Hooghly Hooghly 250 250 100 10 4.00
3 Manas Bangla (TI) Burdwan Burdwan 250 250 100 8 3.20 4 Manas Bangla (TI) Kasba & Sobhabazar Kolkata 250 249 99.6 23 0.24
Total 1000 997 99.7 50 5.02
Sl Site Name District Sample Tested sample % HIV HIV%
1. GUP (TI) Jalpaiguri Jalpaiguri 250 250 100 2 0.80 2. NMMS (TI) Hilli Dakshin Dinajpur 250 248 99.2 6 2.42
3. SSSS (TI) Burdwan Burdwan 250 249 99.6 7 2.81
4. HVP (TI) Haldia Purba Medinipur 250 249 99.6 4 1.61
5. BPWT(TI) Haldia Kolkata 250 87 34.8 0 0.00
Total 1250 1083 86.6 19 1.75
Sentinel Surveillance in West Bengal: 2008
10
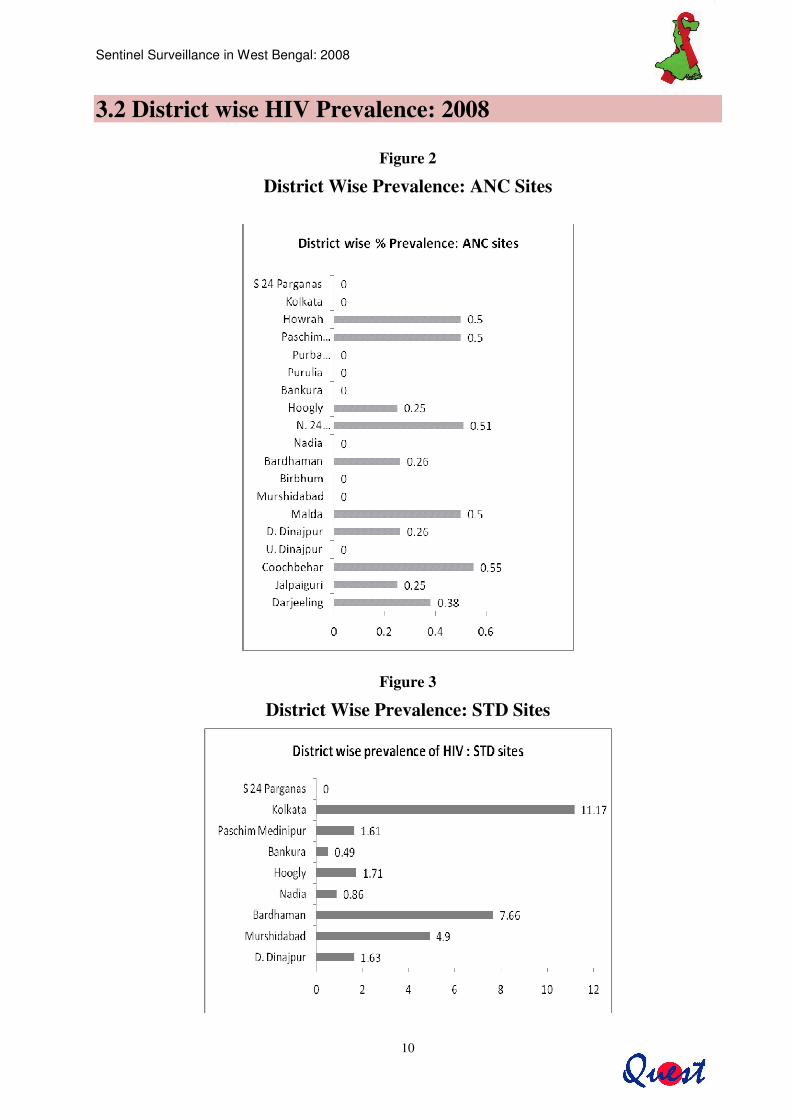
3.2 District wise HIV Prevalence: 2008
Figure 2
District Wise Prevalence: ANC Sites �
�
�
Figure 3
District Wise Prevalence: STD Sites
Sentinel Surveillance in West Bengal: 2008
11
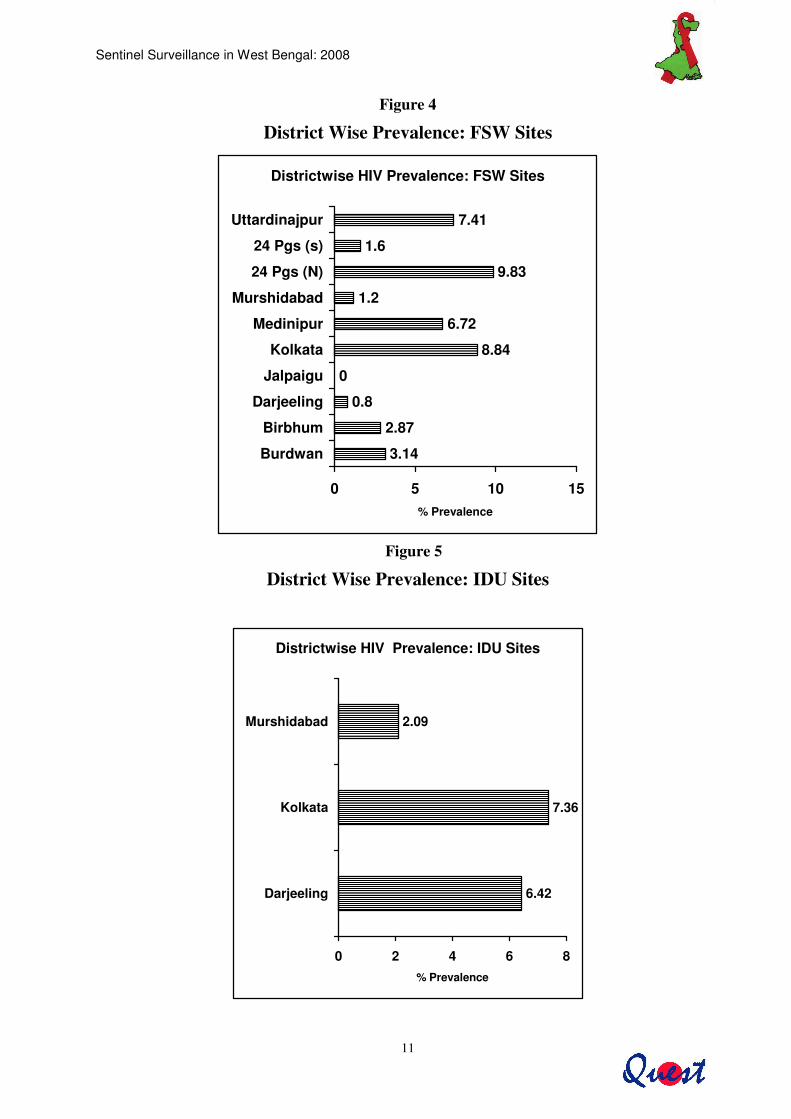
Figure 4
District Wise Prevalence: FSW Sites
Districtwise HIV Prevalence: FSW Sites
3.14
2.87
0.8
0
8.84
6.72
1.2
9.83
1.6
7.41
0 5 10 15
Burdwan
Birbhum
Darjeeling
Jalpaigu
Kolkata
Medinipur
Murshidabad
24 Pgs (N)
24 Pgs (s)
Uttardinajpur
% Prevalence
Figure 5
District Wise Prevalence: IDU Sites
Districtwise HIV Prevalence: IDU Sites
6.42
7.36
2.09
0 2 4 6 8
Darjeeling
Kolkata
Murshidabad
% Prevalence
Sentinel Surveillance in West Bengal: 2008
12
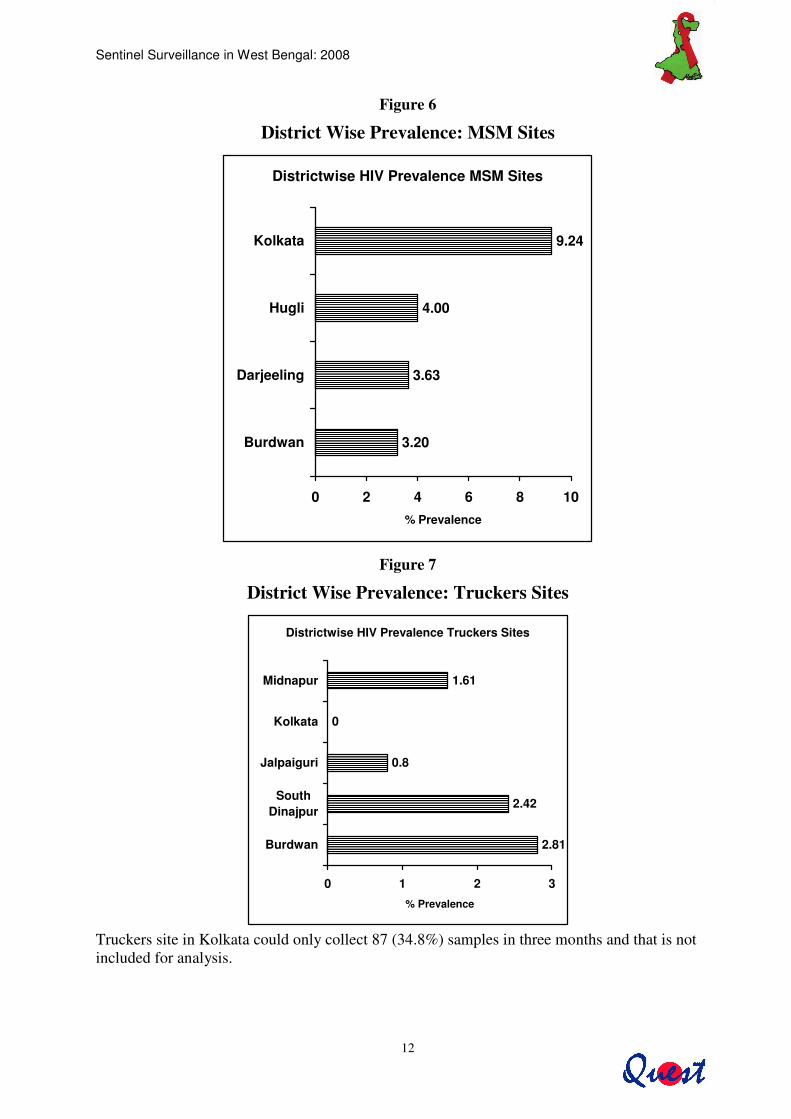
Figure 6
District Wise Prevalence: MSM Sites
Districtwise HIV Prevalence MSM Sites
3.20
3.63
4.00
9.24
0 2 4 6 8 10
Burdwan
Darjeeling
Hugli
Kolkata
% Prevalence
Figure 7
District Wise Prevalence: Truckers Sites
Districtwise HIV Prevalence Truckers Sites
2.81
2.42
0.8
0
1.61
0 1 2 3
Burdwan
SouthDinajpur
Jalpaiguri
Kolkata
Midnapur
% Prevalence
Truckers site in Kolkata could only collect 87 (34.8%) samples in three months and that is not included for analysis.
Sentinel Surveillance in West Bengal: 2008
13
4 Status of ANC Sites
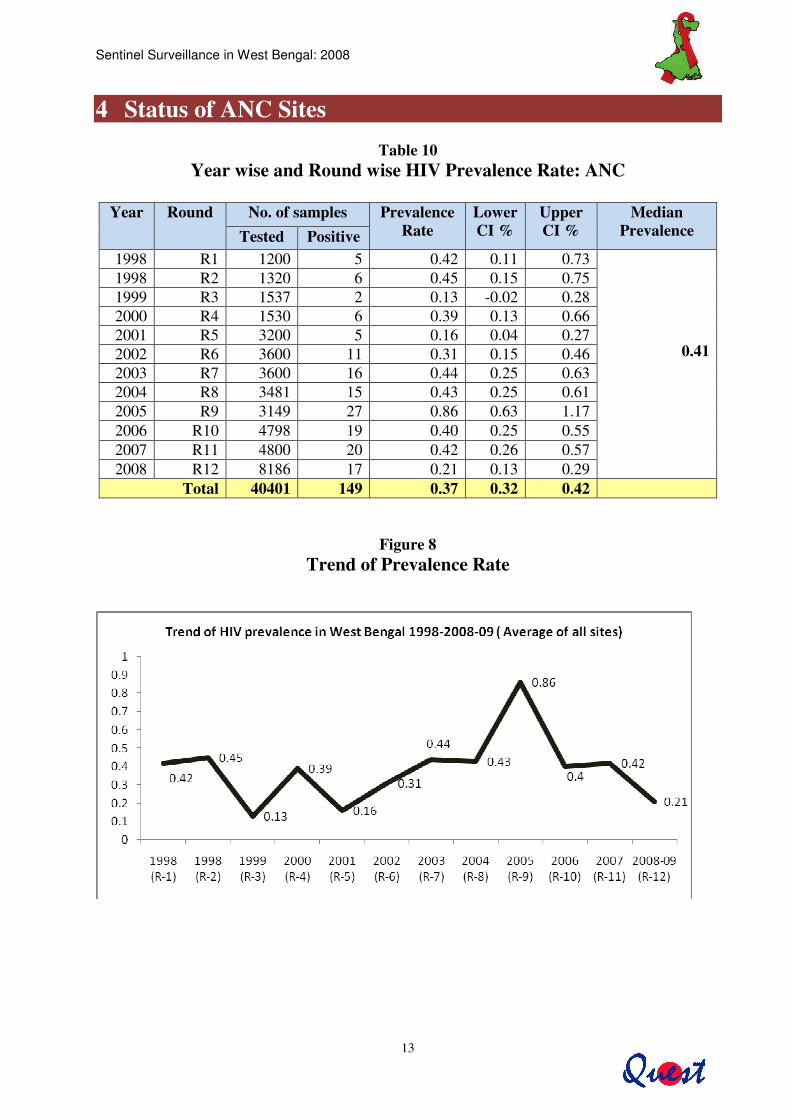
Table 10 Year wise and Round wise HIV Prevalence Rate: ANC
Year Round No. of samples Prevalence
Rate Lower CI %
Upper CI %
Median Prevalence Tested Positive
1998 R1 1200 5 0.42 0.11 0.73
0.41
1998 R2 1320 6 0.45 0.15 0.75 1999 R3 1537 2 0.13 -0.02 0.28 2000 R4 1530 6 0.39 0.13 0.66 2001 R5 3200 5 0.16 0.04 0.27 2002 R6 3600 11 0.31 0.15 0.46 2003 R7 3600 16 0.44 0.25 0.63 2004 R8 3481 15 0.43 0.25 0.61 2005 R9 3149 27 0.86 0.63 1.17 2006 R10 4798 19 0.40 0.25 0.55 2007 R11 4800 20 0.42 0.26 0.57 2008 R12 8186 17 0.21 0.13 0.29
Total 40401 149 0.37 0.32 0.42
Figure 8 Trend of Prevalence Rate
Sentinel Surveillance in West Bengal: 2008
14
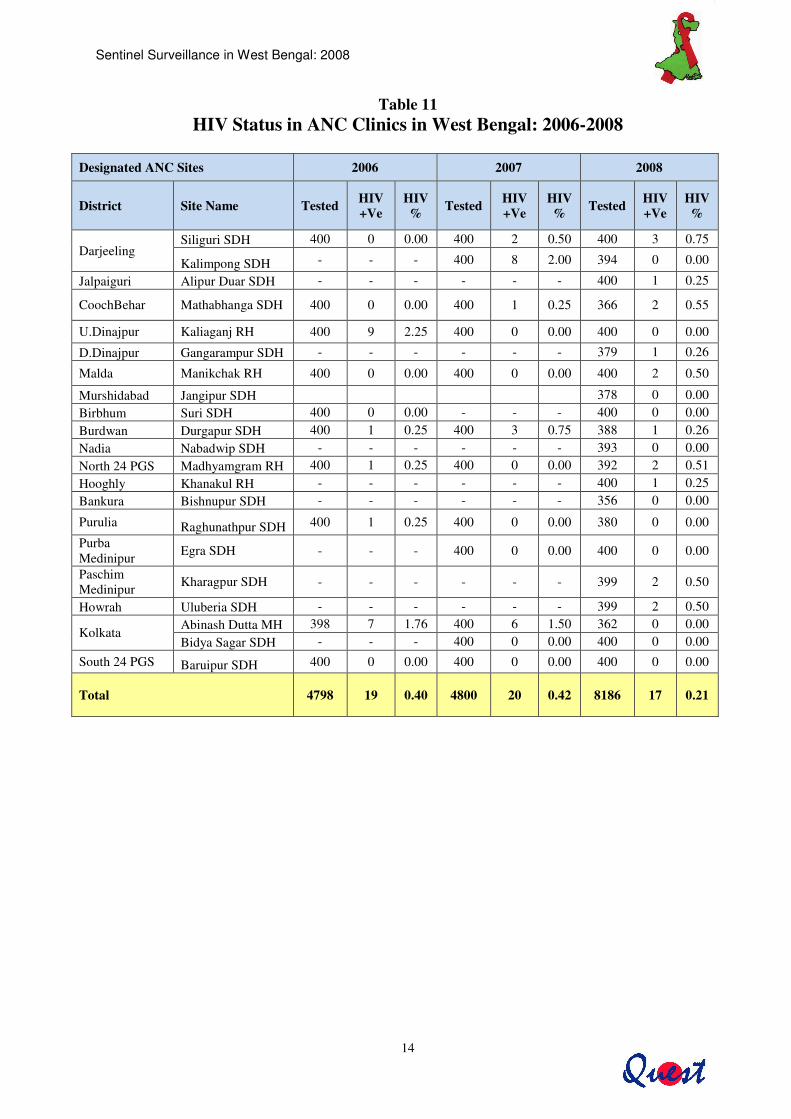
Table 11 HIV Status in ANC Clinics in West Bengal: 2006-2008
Designated ANC Sites 2006 2007 2008
District Site Name Tested HIV +Ve
HIV% Tested HIV
+Ve HIV% Tested HIV
+Ve HIV%
Darjeeling Siliguri SDH 400 0 0.00 400 2 0.50 400 3 0.75
Kalimpong SDH - - - 400 8 2.00 394 0 0.00
Jalpaiguri Alipur Duar SDH - - - - - - 400 1 0.25
CoochBehar Mathabhanga SDH 400 0 0.00 400 1 0.25 366 2 0.55
U.Dinajpur Kaliaganj RH 400 9 2.25 400 0 0.00 400 0 0.00
D.Dinajpur Gangarampur SDH - - - - - - 379 1 0.26
Malda Manikchak RH 400 0 0.00 400 0 0.00 400 2 0.50
Murshidabad Jangipur SDH 378 0 0.00 Birbhum Suri SDH 400 0 0.00 - - - 400 0 0.00 Burdwan Durgapur SDH 400 1 0.25 400 3 0.75 388 1 0.26 Nadia Nabadwip SDH - - - - - - 393 0 0.00 North 24 PGS Madhyamgram RH 400 1 0.25 400 0 0.00 392 2 0.51 Hooghly Khanakul RH - - - - - - 400 1 0.25 Bankura Bishnupur SDH - - - - - - 356 0 0.00
Purulia Raghunathpur SDH 400 1 0.25 400 0 0.00 380 0 0.00
Purba Medinipur Egra SDH - - - 400 0 0.00 400 0 0.00
Paschim Medinipur Kharagpur SDH - - - - - - 399 2 0.50
Howrah Uluberia SDH - - - - - - 399 2 0.50
Kolkata Abinash Dutta MH 398 7 1.76 400 6 1.50 362 0 0.00 Bidya Sagar SDH - - - 400 0 0.00 400 0 0.00
South 24 PGS Baruipur SDH 400 0 0.00 400 0 0.00 400 0 0.00
Total 4798 19 0.40 4800 20 0.42 8186 17 0.21

Sentinel Surveillance in West Bengal: 2008
15
Table 12 VDRL Status in ANC Clinics in West Bengal: 2006-2008
Designated ANC Sites 2006 2007 2008
District Site Name Tested VDRL +Ve % Tested VDRL
+Ve % Tested VDRL +Ve %
Darjeeling Siliguri SDH 400 10 2.50 400 9 2.25 400 3 0.75
Kalinpong SDH - 400 7 1.75 394 2 0.51
Jalpaiguri Alipur Duar SDH - - 400 1 0.25
CoochBehar Mathabhanga SDH 400 18 4.50 400 6 1.50 366 0 0.00
U.Dinajpur Kaliaganj RH 400 5 1.25 400 5 1.25 400 0 0.00
D.Dinajpur Gangarampur SDH - - 379 3 0.79
Malda Manikchak RH 400 1 0.25 400 1 0.25 400 3 0.75
Murshidabad Jangipur SDH 378 2 0.53
Birbhum Suri SDH 400 1 0.25 - 400 1 0.25
Burdwan Durgapur SDH 400 2 0.50 400 1 0.25 388 1 0.26
Nadia Nabadwip SDH - - 393 0 0.00
North 24 PGS
Madhyamgram RH 400 5 1.25 400 1 0.25 392 1 0.26
Hooghly Khanakul RH - - 400 2 0.50
Bankura Bishnupur SDH - - 356 3 0.84
Purulia Raghunathpur SDH
400 1 0.25 400 0 0.00 380 0 0.00
Purba Medinipur Egra SDH - 400 0 0.00 400 3 0.75
Paschim Medinipur Kharagpur SDH - - 399 2 0.50
Howrah Uluberia SDH - - 399 4 1.00
Kolkata Abinash Dutta MH 398 2 0.50 400 5 1.25 362 1 0.28
Bidya Sagar SDH - 400 3 0.75 400 2 0.50
South 24 PGS Baruipur SDH
400 1 0.25 400 3 0.75 400 0 0.00
Total 4798 46 0.96 4800 41 0.85 8186 34 0.42

Sentinel Surveillance in West Bengal: 2008
16
ANC Designated Site Wise Comparison of HIV Prevalence Rate -2006-2008 in West Bengal
����
�
����
����
����
����
���
�
����
����
�
�
�
���
�
�
����
�
����
����
�
����
���
�
�
����
�
����
����
�
�
�
���
���
�
�
�
0 0.5 1 1.5 2 2.5
Siliguri SDH
Kalinpong SDH
Alipur Duar SDH
Mathabhanga SDH
Kaliaganj RH
Gangarampur SDH
Manikchak RH
Jangipur SDH
Suri SDH
Durgapur SDH
Nabadwip SGH
Madhyamgram RH
Khanakul R.H
Bishnupur SDH
Raghunathpur SDH
Mahishadal RH
Egra SDH
Kharagpur SDH
Uluberia SDH
Abinash Dutta MH
Bidya Sagar SDH
Baruipur SDH
% P
reva
len
ce
2008
2007
2006
Figure 9 HIV Status in ANC Sites: 2006-2008
Sentinel Surveillance in West Bengal: 2008
17
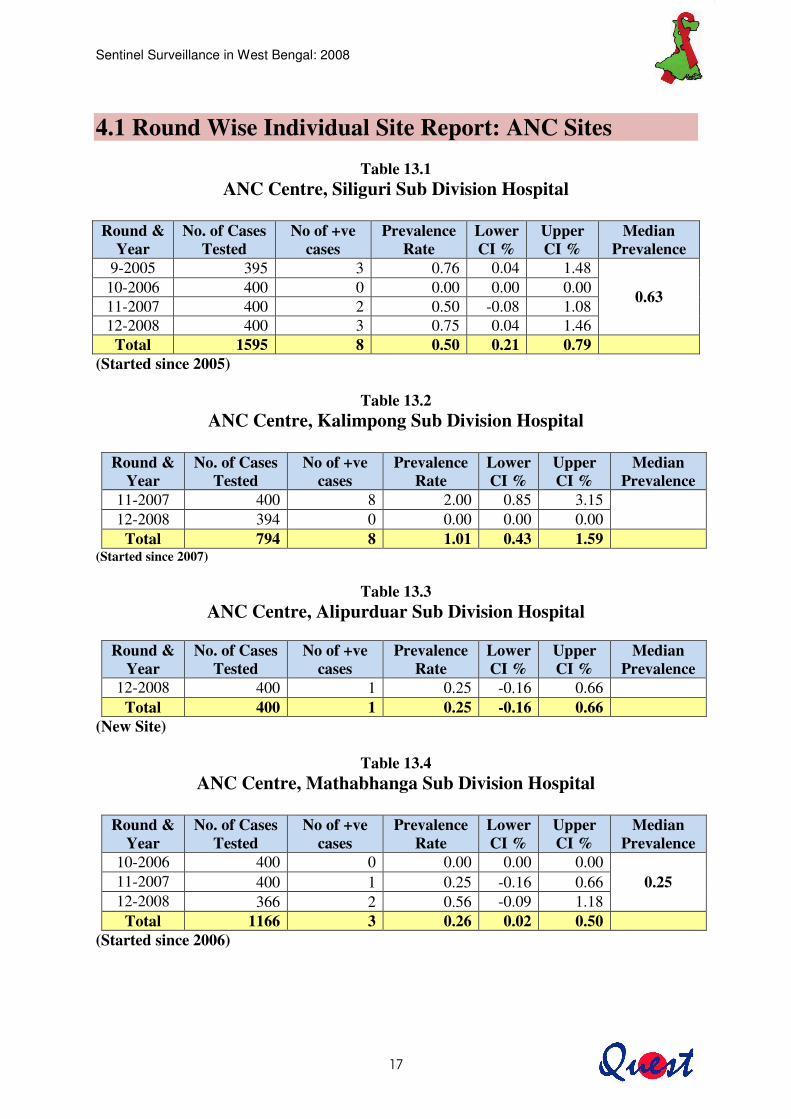
4.1 Round Wise Individual Site Report: ANC Sites �
Table 13.1 ANC Centre, Siliguri Sub Division Hospital
Round &
Year No. of Cases
Tested No of +ve
cases Prevalence
Rate Lower CI %
Upper CI %
Median Prevalence
9-2005 395 3 0.76 0.04 1.48
0.63 10-2006 400 0 0.00 0.00 0.00 11-2007 400 2 0.50 -0.08 1.08 12-2008 400 3 0.75 0.04 1.46
Total 1595 8 0.50 0.21 0.79 (Started since 2005)
Table 13.2 ANC Centre, Kalimpong Sub Division Hospital
Round &
Year No. of Cases
Tested No of +ve
cases Prevalence
Rate Lower CI %
Upper CI %
Median Prevalence
11-2007 400 8 2.00 0.85 3.15
12-2008 394 0 0.00 0.00 0.00 Total 794 8 1.01 0.43 1.59
(Started since 2007)
Table 13.3 ANC Centre, Alipurduar Sub Division Hospital
Round &
Year No. of Cases
Tested No of +ve
cases Prevalence
Rate Lower CI %
Upper CI %
Median Prevalence
12-2008 400 1 0.25 -0.16 0.66 Total 400 1 0.25 -0.16 0.66
(New Site)
Table 13.4 ANC Centre, Mathabhanga Sub Division Hospital
Round &
Year No. of Cases
Tested No of +ve
cases Prevalence
Rate Lower CI %
Upper CI %
Median Prevalence
10-2006 400 0 0.00 0.00 0.00 0.25 11-2007 400 1 0.25 -0.16 0.66
12-2008 366 2 0.56 -0.09 1.18 Total 1166 3 0.26 0.02 0.50
(Started since 2006)
Sentinel Surveillance in West Bengal: 2008
18
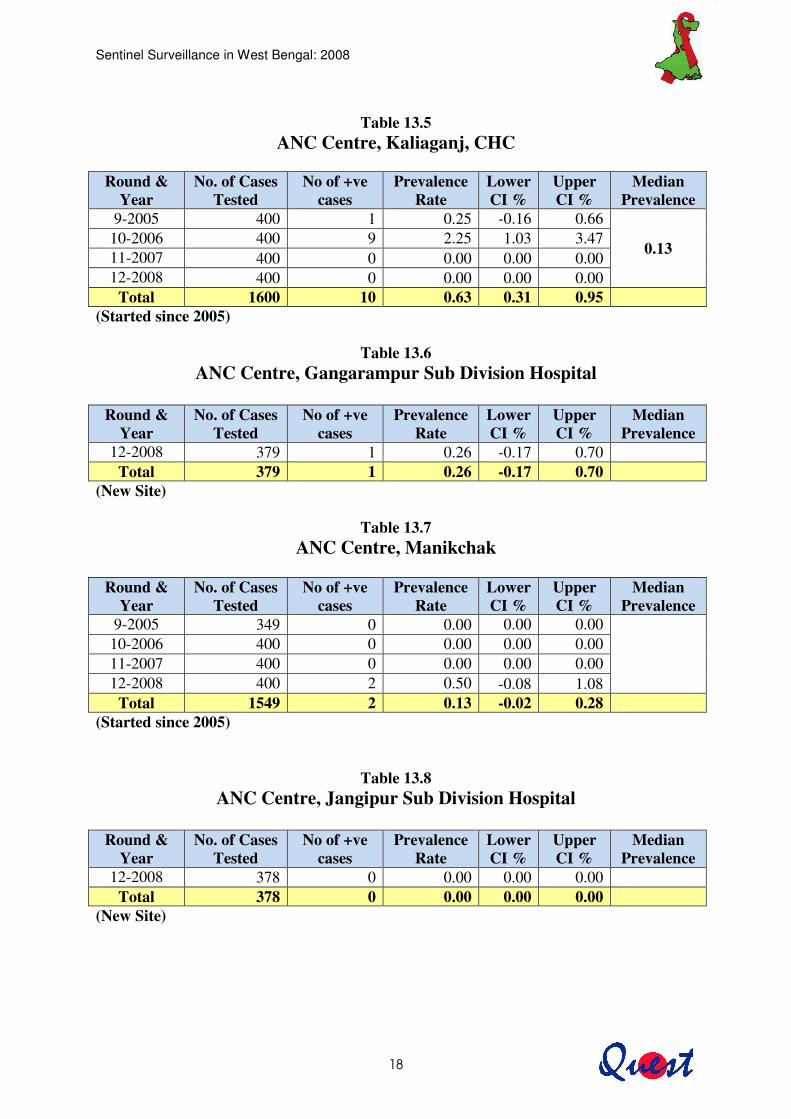
Table 13.5 ANC Centre, Kaliaganj, CHC
Round &
Year No. of Cases
Tested No of +ve
cases Prevalence
Rate Lower CI %
Upper CI %
Median Prevalence
9-2005 400 1 0.25 -0.16 0.66
0.13 10-2006 400 9 2.25 1.03 3.47 11-2007 400 0 0.00 0.00 0.00 12-2008 400 0 0.00 0.00 0.00
Total 1600 10 0.63 0.31 0.95 (Started since 2005)
Table 13.6 ANC Centre, Gangarampur Sub Division Hospital
Round &
Year No. of Cases
Tested No of +ve
cases Prevalence
Rate Lower CI %
Upper CI %
Median Prevalence
12-2008 379 1 0.26 -0.17 0.70 Total 379 1 0.26 -0.17 0.70
(New Site)
Table 13.7 ANC Centre, Manikchak
�
Round & Year
No. of Cases Tested
No of +ve cases
Prevalence Rate
Lower CI %
Upper CI %
Median Prevalence
9-2005 349 0 0.00 0.00 0.00
10-2006 400 0 0.00 0.00 0.00 11-2007 400 0 0.00 0.00 0.00 12-2008 400 2 0.50 -0.08 1.08
Total 1549 2 0.13 -0.02 0.28 (Started since 2005) �
Table 13.8 ANC Centre, Jangipur Sub Division Hospital
Round &
Year No. of Cases
Tested No of +ve
cases Prevalence
Rate Lower CI %
Upper CI %
Median Prevalence
12-2008 378 0 0.00 0.00 0.00 Total 378 0 0.00 0.00 0.00
(New Site) �
�
Sentinel Surveillance in West Bengal: 2008
19
�
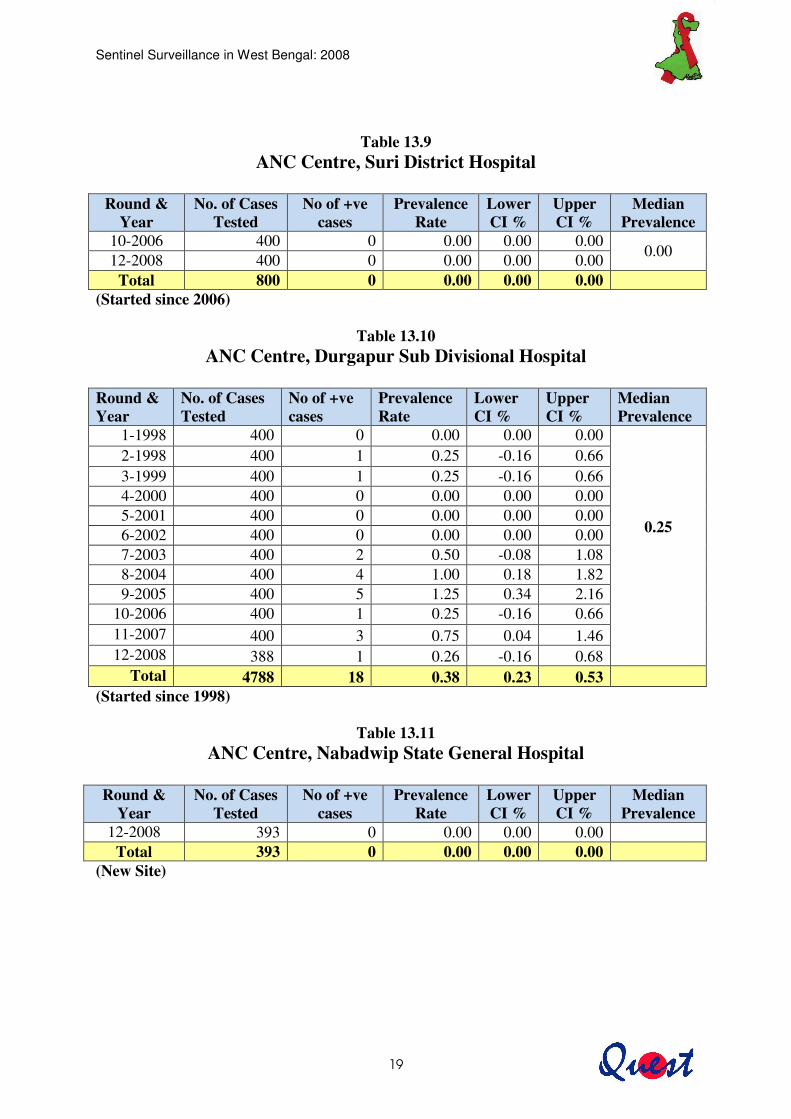
Table 13.9 ANC Centre, Suri District Hospital
Round &
Year No. of Cases
Tested No of +ve
cases Prevalence
Rate Lower CI %
Upper CI %
Median Prevalence
10-2006 400 0 0.00 0.00 0.00 0.00 12-2008 400 0 0.00 0.00 0.00
Total 800 0 0.00 0.00 0.00 (Started since 2006)
Table 13.10 ANC Centre, Durgapur Sub Divisional Hospital
Round & Year
No. of Cases Tested
No of +ve cases
Prevalence Rate
Lower CI %
Upper CI %
Median Prevalence
1-1998 400 0 0.00 0.00 0.00
0.25
2-1998 400 1 0.25 -0.16 0.66 3-1999 400 1 0.25 -0.16 0.66 4-2000 400 0 0.00 0.00 0.00 5-2001 400 0 0.00 0.00 0.00 6-2002 400 0 0.00 0.00 0.00 7-2003 400 2 0.50 -0.08 1.08 8-2004 400 4 1.00 0.18 1.82 9-2005 400 5 1.25 0.34 2.16
10-2006 400 1 0.25 -0.16 0.66 11-2007 400 3 0.75 0.04 1.46 12-2008 388 1 0.26 -0.16 0.68
Total 4788 18 0.38 0.23 0.53 (Started since 1998)
Table 13.11 ANC Centre, Nabadwip State General Hospital
Round &
Year No. of Cases
Tested No of +ve
cases Prevalence
Rate Lower CI %
Upper CI %
Median Prevalence
12-2008 393 0 0.00 0.00 0.00 Total 393 0 0.00 0.00 0.00
(New Site)
Sentinel Surveillance in West Bengal: 2008
20
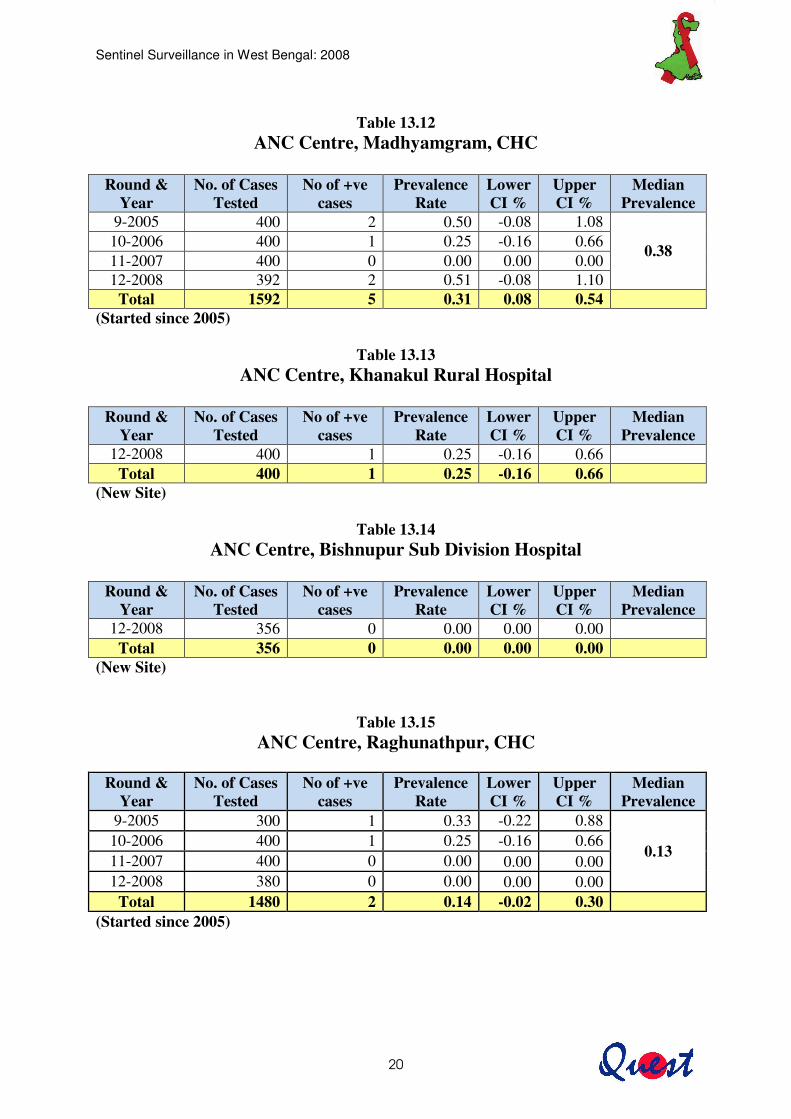
Table 13.12 ANC Centre, Madhyamgram, CHC
Round &
Year No. of Cases
Tested No of +ve
cases Prevalence
Rate Lower CI %
Upper CI %
Median Prevalence
9-2005 400 2 0.50 -0.08 1.08
0.38 10-2006 400 1 0.25 -0.16 0.66 11-2007 400 0 0.00 0.00 0.00 12-2008 392 2 0.51 -0.08 1.10
Total 1592 5 0.31 0.08 0.54 (Started since 2005)
Table 13.13 ANC Centre, Khanakul Rural Hospital
Round &
Year No. of Cases
Tested No of +ve
cases Prevalence
Rate Lower CI %
Upper CI %
Median Prevalence
12-2008 400 1 0.25 -0.16 0.66 Total 400 1 0.25 -0.16 0.66
(New Site)
Table 13.14 ANC Centre, Bishnupur Sub Division Hospital
Round &
Year No. of Cases
Tested No of +ve
cases Prevalence
Rate Lower CI %
Upper CI %
Median Prevalence
12-2008 356 0 0.00 0.00 0.00 Total 356 0 0.00 0.00 0.00
(New Site)
Table 13.15 ANC Centre, Raghunathpur, CHC
��
Round & Year
No. of Cases Tested
No of +ve cases
Prevalence Rate
Lower CI %
Upper CI %
Median Prevalence
9-2005 300 1 0.33 -0.22 0.88
0.13 10-2006 400 1 0.25 -0.16 0.66 11-2007 400 0 0.00 0.00 0.00 12-2008 380 0 0.00 0.00 0.00
Total 1480 2 0.14 -0.02 0.30 (Started since 2005)
Sentinel Surveillance in West Bengal: 2008
21
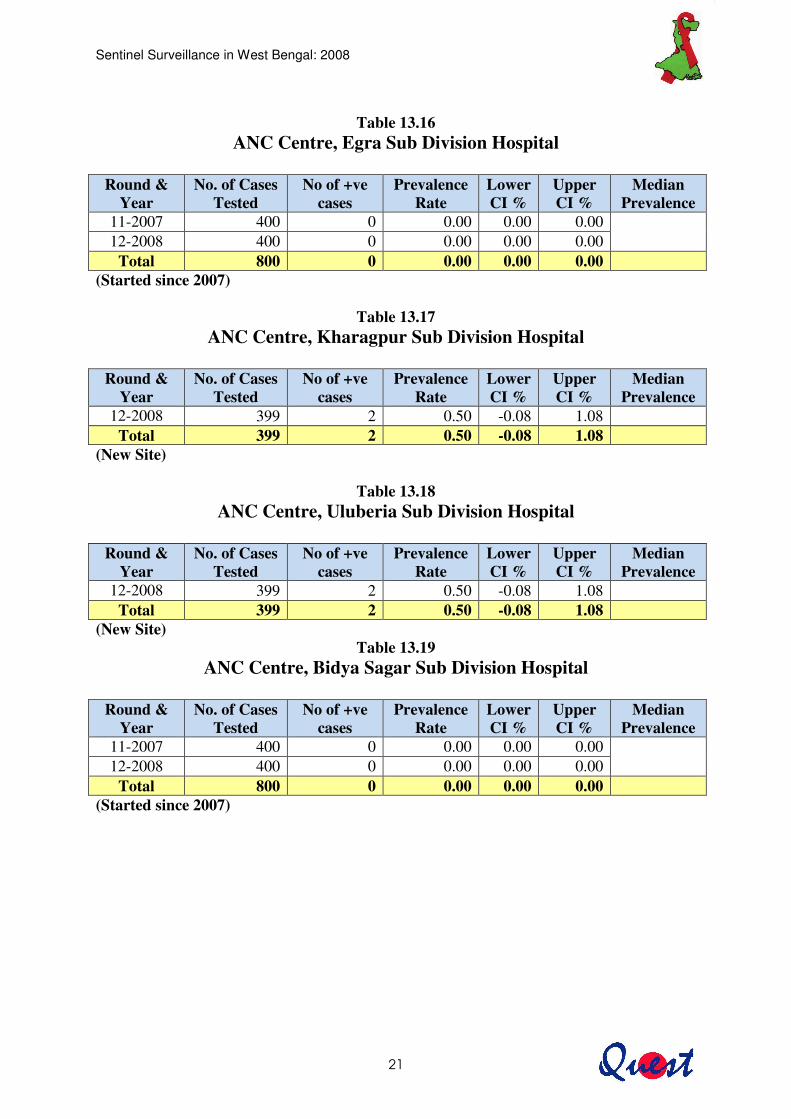
Table 13.16 ANC Centre, Egra Sub Division Hospital
Round &
Year No. of Cases
Tested No of +ve
cases Prevalence
Rate Lower CI %
Upper CI %
Median Prevalence
11-2007 400 0 0.00 0.00 0.00 12-2008 400 0 0.00 0.00 0.00
Total 800 0 0.00 0.00 0.00 (Started since 2007)
Table 13.17 ANC Centre, Kharagpur Sub Division Hospital
Round &
Year No. of Cases
Tested No of +ve
cases Prevalence
Rate Lower CI %
Upper CI %
Median Prevalence
12-2008 399 2 0.50 -0.08 1.08 Total 399 2 0.50 -0.08 1.08
(New Site)
Table 13.18 ANC Centre, Uluberia Sub Division Hospital
Round &
Year No. of Cases
Tested No of +ve
cases Prevalence
Rate Lower CI %
Upper CI %
Median Prevalence
12-2008 399 2 0.50 -0.08 1.08 Total 399 2 0.50 -0.08 1.08
(New Site) Table 13.19
ANC Centre, Bidya Sagar Sub Division Hospital
Round & Year
No. of Cases Tested
No of +ve cases
Prevalence Rate
Lower CI %
Upper CI %
Median Prevalence
11-2007 400 0 0.00 0.00 0.00 12-2008 400 0 0.00 0.00 0.00
Total 800 0 0.00 0.00 0.00 (Started since 2007)

Sentinel Surveillance in West Bengal: 2008
22
Table 13.20 ANC Centre, Abinash Dutta Maternity Home
Round &
Year No. of Cases
Tested No of +ve
cases Prevalence
Rate Lower CI %
Upper CI %
Median Prevalence
8-2004 400 5 1.25 0.34 2.16
1.50
9-2005 400 9 2.25 1.03 3.47 10-2006 398 7 1.76 0.67 2.85 11-2007 400 6 1.50 0.50 2.50 12-2008 362 0 0.00 0.00 0.00
Total 1960 27 1.38 0.95 1.81 (Started since 2004)
Table 13.21 ANC Centre, Baruipur Sub Division Hospital
Round &
Year No. of Cases
Tested No of +ve
cases Prevalence
Rate Lower CI %
Upper CI %
Median Prevalence
9-2005 400 4 1.00 0.18 1.82
0.00 10-2006 400 0 0.00 0.00 0.00 11-2007 400 0 0.00 0.00 0.00 12-2008 400 0 0.00 0.00 0.00
Total 1600 4 0.25 0.04 0.46 (Started since 2005) 4.2 Demographic Characteristics: ANC Sites Attendees
Figure 10
HIV & VDRL Sero-positive Status by Age Group among ANC attendees
�������������������������� �
No of Sites-21 HIV VDRL Sample Tested 8186 8186 Found Positive 17 34
Sentinel Surveillance in West Bengal: 2008
23
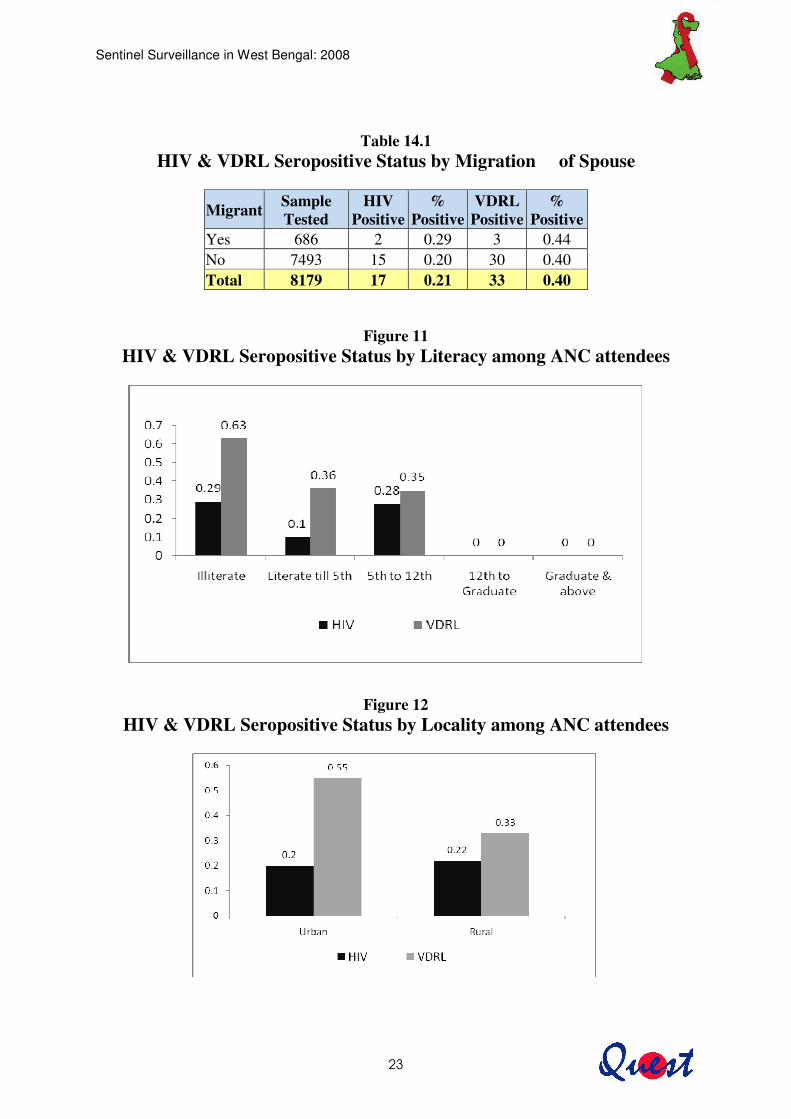
Table 14.1
HIV & VDRL Seropositive Status by Migration of Spouse
Migrant Sample Tested
HIV Positive
% Positive
VDRL Positive
% Positive
Yes 686 2 0.29 3 0.44 No 7493 15 0.20 30 0.40 Total 8179 17 0.21 33 0.40
Figure 11 HIV & VDRL Seropositive Status by Literacy among ANC attendees
Figure 12 HIV & VDRL Seropositive Status by Locality among ANC attendees
Sentinel Surveillance in West Bengal: 2008
24
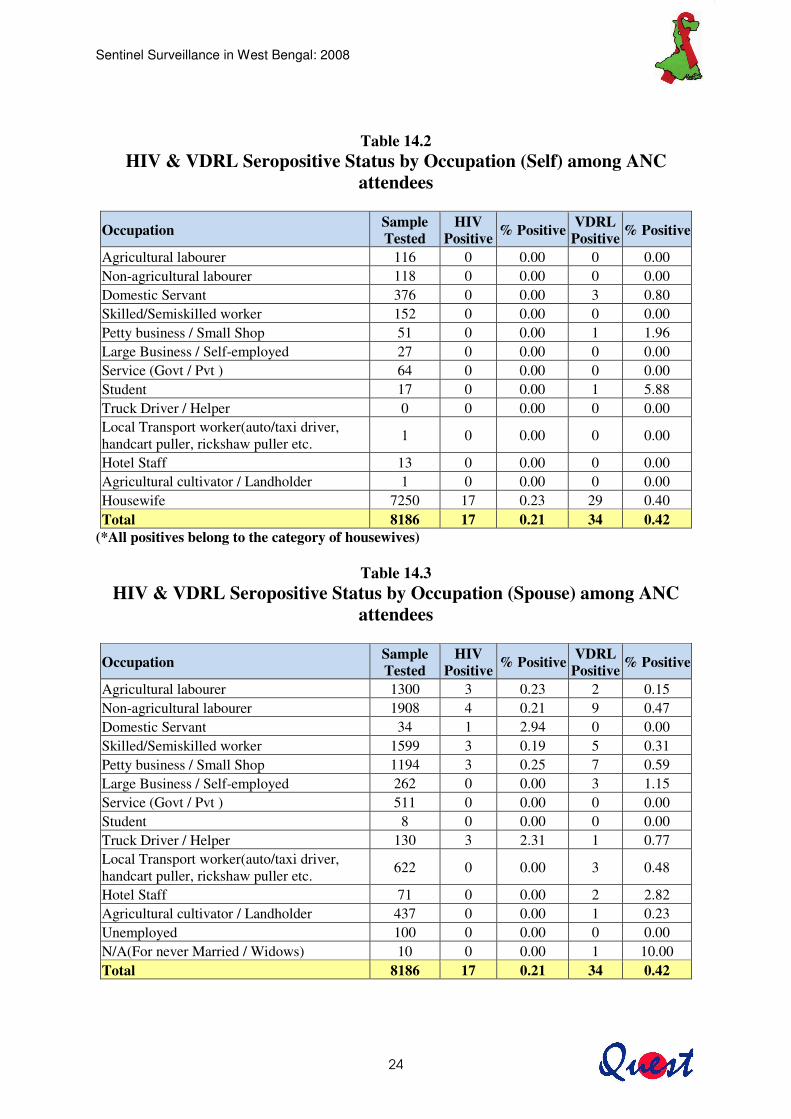
Table 14.2
HIV & VDRL Seropositive Status by Occupation (Self) among ANC attendees
Occupation Sample Tested
HIV Positive % Positive VDRL
Positive % Positive
Agricultural labourer 116 0 0.00 0 0.00 Non-agricultural labourer 118 0 0.00 0 0.00 Domestic Servant 376 0 0.00 3 0.80 Skilled/Semiskilled worker 152 0 0.00 0 0.00 Petty business / Small Shop 51 0 0.00 1 1.96 Large Business / Self-employed 27 0 0.00 0 0.00 Service (Govt / Pvt ) 64 0 0.00 0 0.00 Student 17 0 0.00 1 5.88 Truck Driver / Helper 0 0 0.00 0 0.00 Local Transport worker(auto/taxi driver, handcart puller, rickshaw puller etc. 1 0 0.00 0 0.00
Hotel Staff 13 0 0.00 0 0.00 Agricultural cultivator / Landholder 1 0 0.00 0 0.00 Housewife 7250 17 0.23 29 0.40 Total 8186 17 0.21 34 0.42
(*All positives belong to the category of housewives)
Table 14.3 HIV & VDRL Seropositive Status by Occupation (Spouse) among ANC
attendees
Occupation Sample Tested
HIV Positive % Positive VDRL
Positive % Positive
Agricultural labourer 1300 3 0.23 2 0.15 Non-agricultural labourer 1908 4 0.21 9 0.47 Domestic Servant 34 1 2.94 0 0.00 Skilled/Semiskilled worker 1599 3 0.19 5 0.31 Petty business / Small Shop 1194 3 0.25 7 0.59 Large Business / Self-employed 262 0 0.00 3 1.15 Service (Govt / Pvt ) 511 0 0.00 0 0.00 Student 8 0 0.00 0 0.00 Truck Driver / Helper 130 3 2.31 1 0.77 Local Transport worker(auto/taxi driver, handcart puller, rickshaw puller etc. 622 0 0.00 3 0.48
Hotel Staff 71 0 0.00 2 2.82 Agricultural cultivator / Landholder 437 0 0.00 1 0.23 Unemployed 100 0 0.00 0 0.00 N/A(For never Married / Widows) 10 0 0.00 1 10.00 Total 8186 17 0.21 34 0.42
Sentinel Surveillance in West Bengal: 2008
25
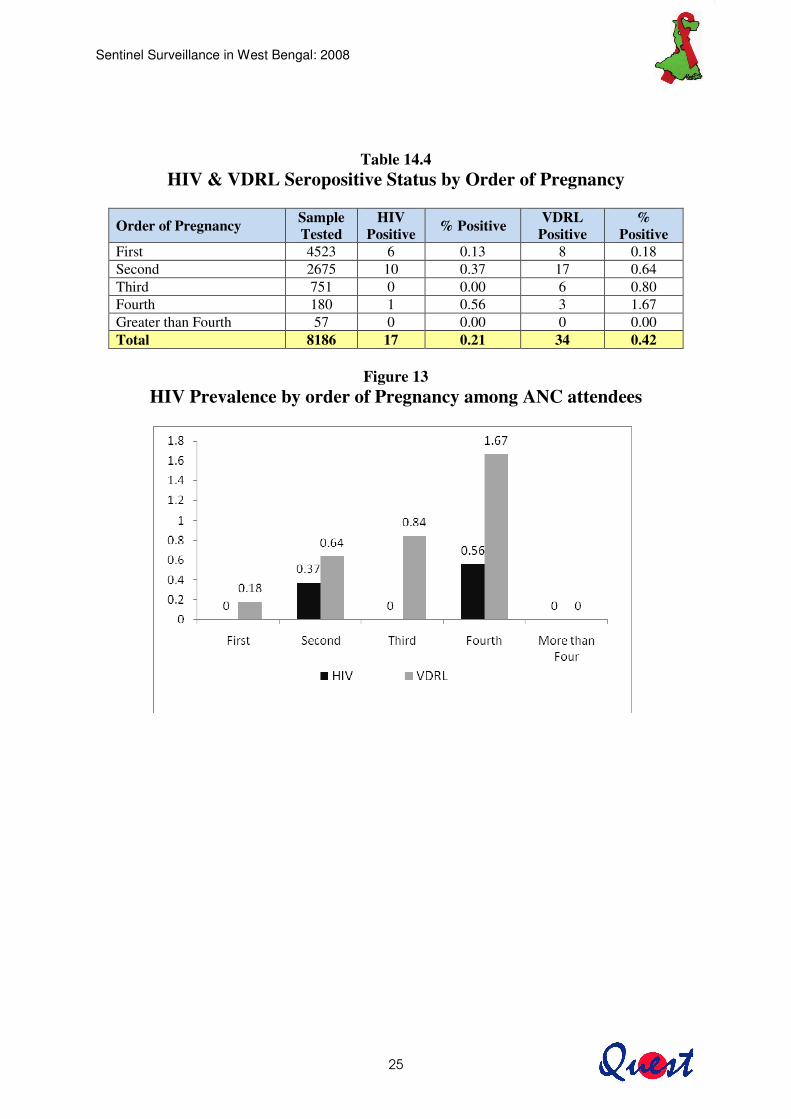
Table 14.4 HIV & VDRL Seropositive Status by Order of Pregnancy
Order of Pregnancy Sample Tested
HIV Positive % Positive VDRL
Positive %
Positive First 4523 6 0.13 8 0.18 Second 2675 10 0.37 17 0.64 Third 751 0 0.00 6 0.80 Fourth 180 1 0.56 3 1.67 Greater than Fourth 57 0 0.00 0 0.00 Total 8186 17 0.21 34 0.42
Figure 13
HIV Prevalence by order of Pregnancy among ANC attendees
Sentinel Surveillance in West Bengal: 2008
26
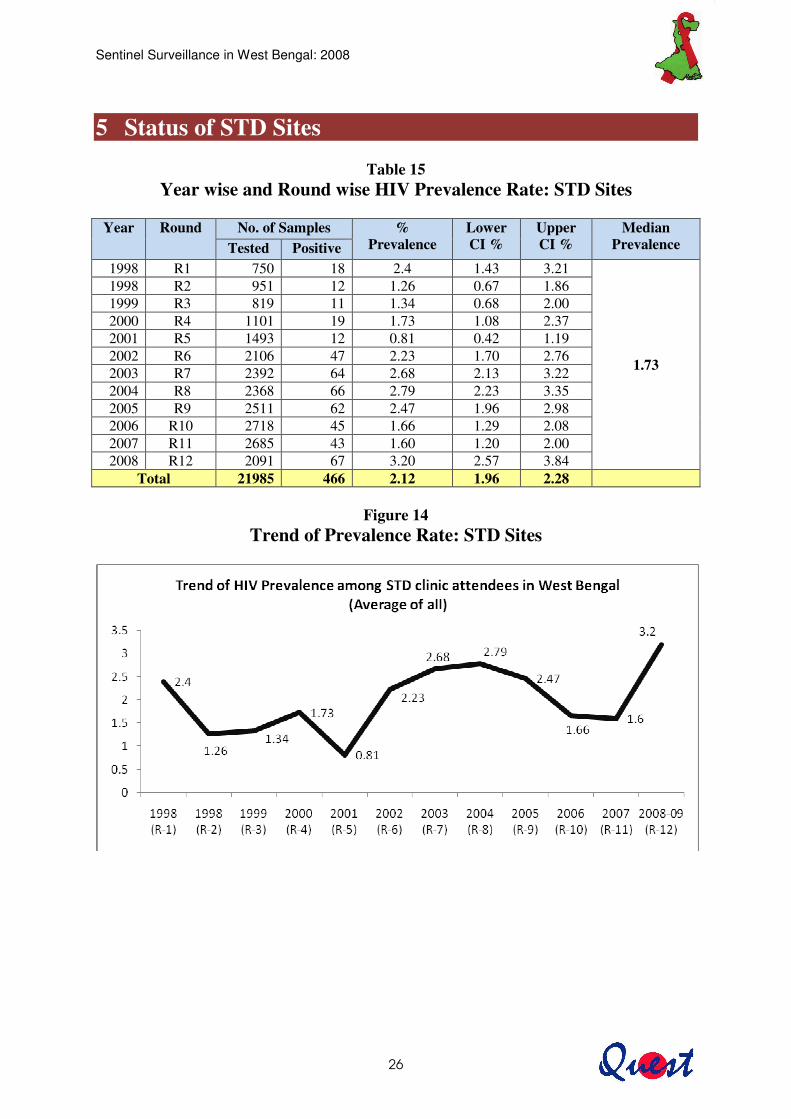
5 Status of STD Sites �
Table 15 Year wise and Round wise HIV Prevalence Rate: STD Sites
Year Round No. of Samples %
Prevalence Lower CI %
Upper CI %
Median Prevalence Tested Positive
1998 R1 750 18 2.4 1.43 3.21
1.73
1998 R2 951 12 1.26 0.67 1.86 1999 R3 819 11 1.34 0.68 2.00 2000 R4 1101 19 1.73 1.08 2.37 2001 R5 1493 12 0.81 0.42 1.19 2002 R6 2106 47 2.23 1.70 2.76 2003 R7 2392 64 2.68 2.13 3.22 2004 R8 2368 66 2.79 2.23 3.35 2005 R9 2511 62 2.47 1.96 2.98 2006 R10 2718 45 1.66 1.29 2.08 2007 R11 2685 43 1.60 1.20 2.00 2008 R12 2091 67 3.20 2.57 3.84
Total 21985 466 2.12 1.96 2.28
Figure 14 Trend of Prevalence Rate: STD Sites
Sentinel Surveillance in West Bengal: 2008
27
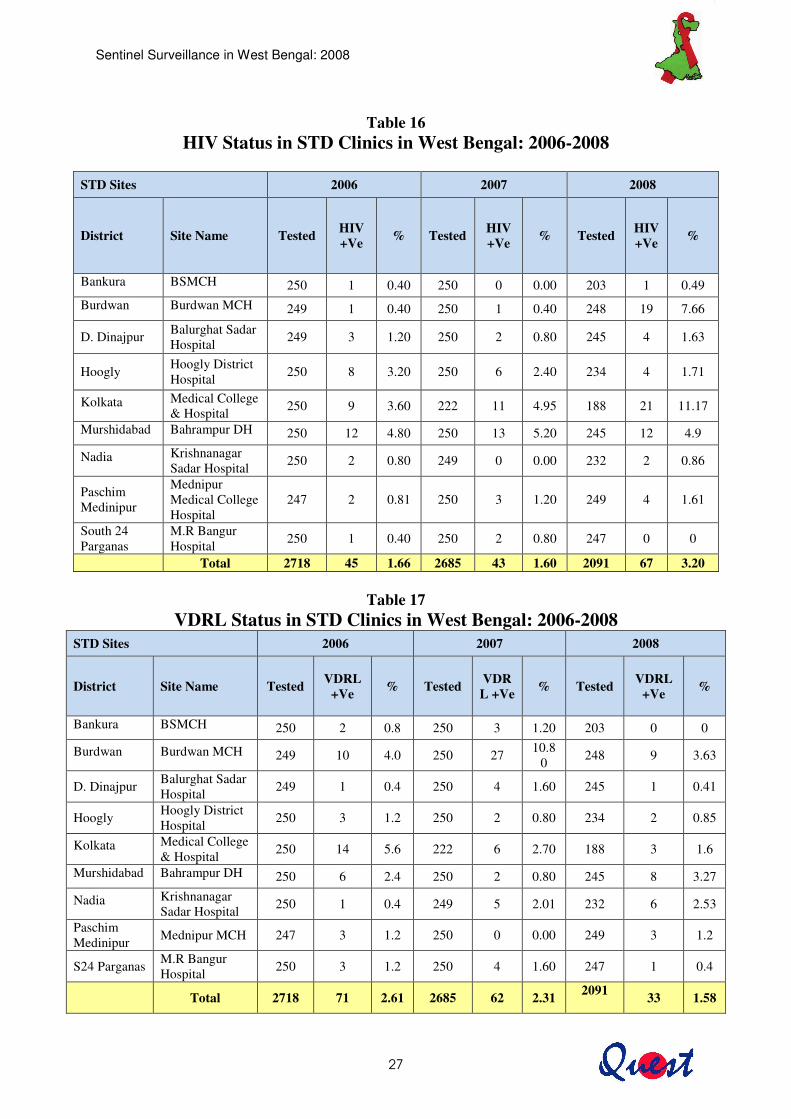
Table 16 HIV Status in STD Clinics in West Bengal: 2006-2008
STD Sites 2006 2007 2008
District Site Name Tested HIV +Ve % Tested HIV
+Ve % Tested HIV +Ve %
Bankura BSMCH 250 1 0.40 250 0 0.00 203 1 0.49 Burdwan Burdwan MCH 249 1 0.40 250 1 0.40 248 19 7.66
D. Dinajpur Balurghat Sadar Hospital 249 3 1.20 250 2 0.80 245 4 1.63
Hoogly Hoogly District Hospital 250 8 3.20 250 6 2.40 234 4 1.71
Kolkata Medical College & Hospital 250 9 3.60 222 11 4.95 188 21 11.17
Murshidabad Bahrampur DH 250 12 4.80 250 13 5.20 245 12 4.9
Nadia Krishnanagar Sadar Hospital 250 2 0.80 249 0 0.00 232 2 0.86
Paschim Medinipur
Mednipur Medical College Hospital
247 2 0.81 250 3 1.20 249 4 1.61
South 24 Parganas
M.R Bangur Hospital 250 1 0.40 250 2 0.80 247 0 0
Total 2718 45 1.66 2685 43 1.60 2091 67 3.20
Table 17 VDRL Status in STD Clinics in West Bengal: 2006-2008
STD Sites 2006 2007 2008
District Site Name Tested VDRL +Ve % Tested VDR
L +Ve % Tested VDRL +Ve %
Bankura BSMCH 250 2 0.8 250 3 1.20 203 0 0
Burdwan Burdwan MCH 249 10 4.0 250 27 10.80 248 9 3.63
D. Dinajpur Balurghat Sadar Hospital 249 1 0.4 250 4 1.60 245 1 0.41
Hoogly Hoogly District Hospital 250 3 1.2 250 2 0.80 234 2 0.85
Kolkata Medical College & Hospital 250 14 5.6 222 6 2.70 188 3 1.6
Murshidabad Bahrampur DH 250 6 2.4 250 2 0.80 245 8 3.27
Nadia Krishnanagar Sadar Hospital 250 1 0.4 249 5 2.01 232 6 2.53
Paschim Medinipur Mednipur MCH 247 3 1.2 250 0 0.00 249 3 1.2
S24 Parganas M.R Bangur Hospital 250 3 1.2 250 4 1.60 247 1 0.4
Total 2718 71 2.61 2685 62 2.31 2091 33 1.58
Sentinel Surveillance in West Bengal: 2008
28
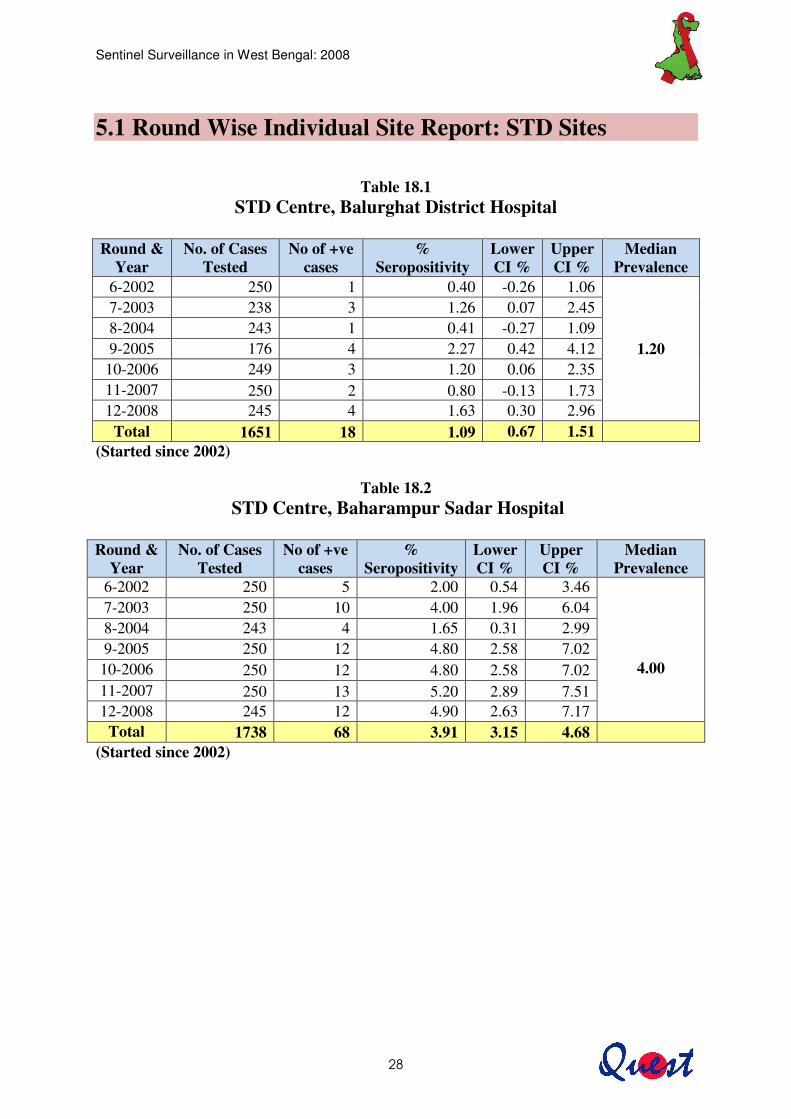
5.1 Round Wise Individual Site Report: STD Sites
Table 18.1
STD Centre, Balurghat District Hospital
Round & Year
No. of Cases Tested
No of +ve cases
% Seropositivity
Lower CI %
Upper CI %
Median Prevalence
6-2002 250 1 0.40 -0.26 1.06
1.20
7-2003 238 3 1.26 0.07 2.45 8-2004 243 1 0.41 -0.27 1.09 9-2005 176 4 2.27 0.42 4.12
10-2006 249 3 1.20 0.06 2.35 11-2007 250 2 0.80 -0.13 1.73 12-2008 245 4 1.63 0.30 2.96
Total 1651 18 1.09 0.67 1.51 (Started since 2002)
Table 18.2
STD Centre, Baharampur Sadar Hospital
Round & Year
No. of Cases Tested
No of +ve cases
% Seropositivity
Lower CI %
Upper CI %
Median Prevalence
6-2002 250 5 2.00 0.54 3.46
4.00
7-2003 250 10 4.00 1.96 6.04 8-2004 243 4 1.65 0.31 2.99 9-2005 250 12 4.80 2.58 7.02
10-2006 250 12 4.80 2.58 7.02 11-2007 250 13 5.20 2.89 7.51 12-2008 245 12 4.90 2.63 7.17
Total 1738 68 3.91 3.15 4.68 (Started since 2002)
Sentinel Surveillance in West Bengal: 2008
29
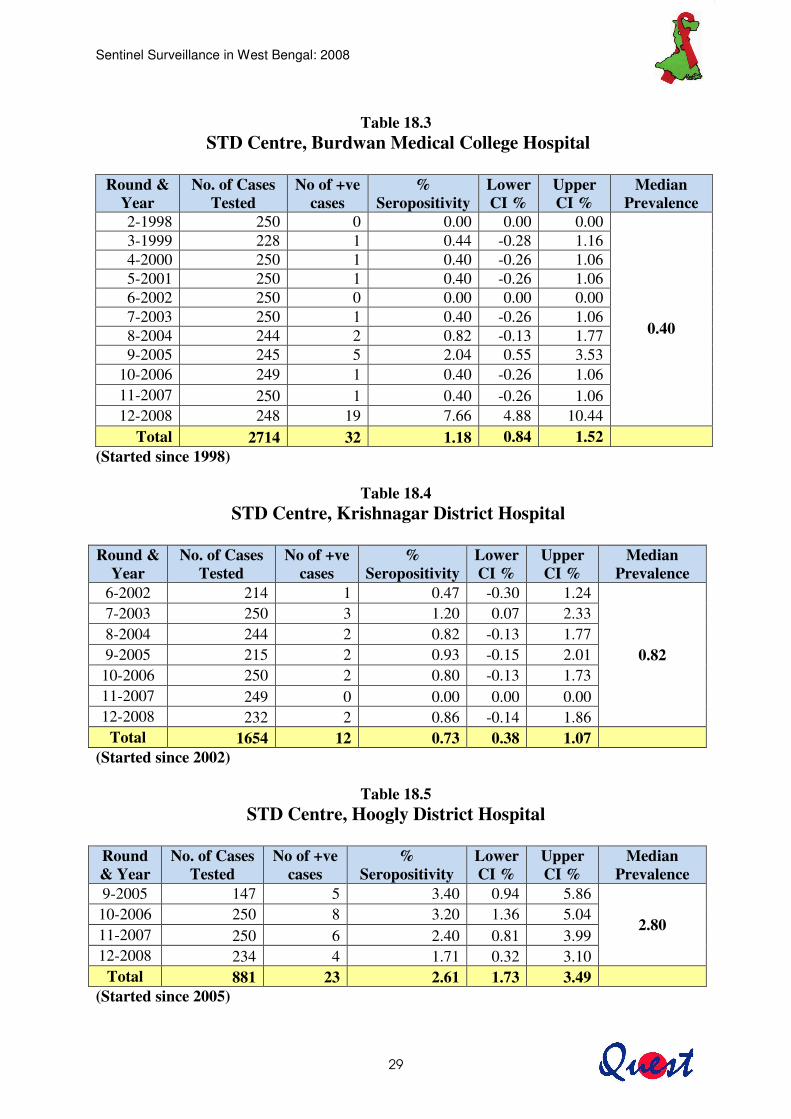
Table 18.3 STD Centre, Burdwan Medical College Hospital
Round &
Year No. of Cases
Tested No of +ve
cases %
Seropositivity Lower CI %
Upper CI %
Median Prevalence
2-1998 250 0 0.00 0.00 0.00
0.40
3-1999 228 1 0.44 -0.28 1.16 4-2000 250 1 0.40 -0.26 1.06 5-2001 250 1 0.40 -0.26 1.06 6-2002 250 0 0.00 0.00 0.00 7-2003 250 1 0.40 -0.26 1.06 8-2004 244 2 0.82 -0.13 1.77 9-2005 245 5 2.04 0.55 3.53
10-2006 249 1 0.40 -0.26 1.06 11-2007 250 1 0.40 -0.26 1.06 12-2008 248 19 7.66 4.88 10.44
Total 2714 32 1.18 0.84 1.52 (Started since 1998)
Table 18.4
STD Centre, Krishnagar District Hospital
Round & Year
No. of Cases Tested
No of +ve cases
% Seropositivity
Lower CI %
Upper CI %
Median Prevalence
6-2002 214 1 0.47 -0.30 1.24
0.82
7-2003 250 3 1.20 0.07 2.33 8-2004 244 2 0.82 -0.13 1.77 9-2005 215 2 0.93 -0.15 2.01
10-2006 250 2 0.80 -0.13 1.73 11-2007 249 0 0.00 0.00 0.00 12-2008 232 2 0.86 -0.14 1.86
Total 1654 12 0.73 0.38 1.07 (Started since 2002)
Table 18.5 STD Centre, Hoogly District Hospital
Round & Year
No. of Cases Tested
No of +ve cases
% Seropositivity
Lower CI %
Upper CI %
Median Prevalence
9-2005 147 5 3.40 0.94 5.86
2.80 10-2006 250 8 3.20 1.36 5.04 11-2007 250 6 2.40 0.81 3.99 12-2008 234 4 1.71 0.32 3.10
Total 881 23 2.61 1.73 3.49 (Started since 2005)
Sentinel Surveillance in West Bengal: 2008
30
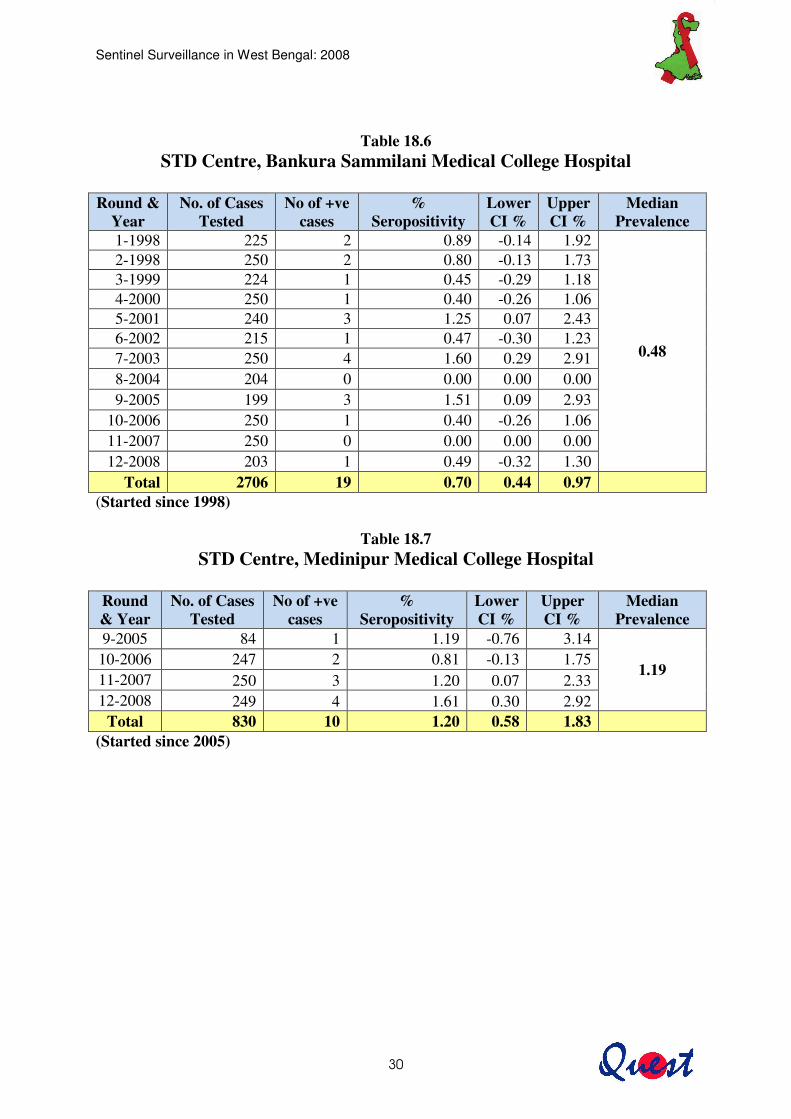
Table 18.6
STD Centre, Bankura Sammilani Medical College Hospital
Round & Year
No. of Cases Tested
No of +ve cases
% Seropositivity
Lower CI %
Upper CI %
Median Prevalence
1-1998 225 2 0.89 -0.14 1.92
0.48
2-1998 250 2 0.80 -0.13 1.73 3-1999 224 1 0.45 -0.29 1.18 4-2000 250 1 0.40 -0.26 1.06 5-2001 240 3 1.25 0.07 2.43 6-2002 215 1 0.47 -0.30 1.23 7-2003 250 4 1.60 0.29 2.91 8-2004 204 0 0.00 0.00 0.00 9-2005 199 3 1.51 0.09 2.93
10-2006 250 1 0.40 -0.26 1.06 11-2007 250 0 0.00 0.00 0.00 12-2008 203 1 0.49 -0.32 1.30
Total 2706 19 0.70 0.44 0.97 (Started since 1998)
Table 18.7
STD Centre, Medinipur Medical College Hospital
Round & Year
No. of Cases Tested
No of +ve cases
% Seropositivity
Lower CI %
Upper CI %
Median Prevalence
9-2005 84 1 1.19 -0.76 3.14
1.19 10-2006 247 2 0.81 -0.13 1.75 11-2007 250 3 1.20 0.07 2.33 12-2008 249 4 1.61 0.30 2.92
Total 830 10 1.20 0.58 1.83 (Started since 2005)

Sentinel Surveillance in West Bengal: 2008
31
Table 18.8 STD Centre, Calcutta Medical College Hospital
Round &
Year No. of Cases
Tested No of +ve
cases %
Seropositivity Lower CI %
Upper CI %
Median Prevalence
1-1998 300 12 4.00 2.14 5.86
4.40
2-1998 250 6 2.39 0.80 3.98 3-1999 250 6 2.39 0.80 3.98 4-2000 247 8 3.24 1.39 5.09 5-2001 250 6 2.40 0.81 3.99 6-2002 177 11 6.21 3.22 9.21 7-2003 250 24 9.60 6.54 12.66 8-2004 233 46 19.74 15.45 24.03 9-2005 250 12 4.80 2.58 7.02
10-2006 250 9 3.60 1.66 5.54 11-2007 222 11 4.96 2.56 7.35 12-2008 188 21 11.17 7.39 14.95
Total 2867 172 6.00 5.27 6.73 (Started since 1998)
Table 18.9
STD Centre, M.R. Bangur Hospital
Round & Year
No. of Cases Tested
No of +ve cases
% Seropositivity
Lower CI %
Upper CI %
Median Prevalence
4-2000 252 7 2.78 1.07 4.48
1.20
5-2001 250 2 0.80 -0.13 1.73 6-2002 250 7 2.80 1.08 4.52 7-2003 250 10 4.00 1.96 6.04 8-2004 250 3 1.20 0.07 2.33 9-2005 247 8 3.24 1.39 5.09
10-2006 250 1 0.40 -0.26 1.06 11-2007 250 2 0.80 -0.13 1.73 12-2008 247 0 0.00 0.00 0.00
Total 2246 40 1.78 1.32 2.24 (Started since 2000)
Sentinel Surveillance in West Bengal: 2008
32
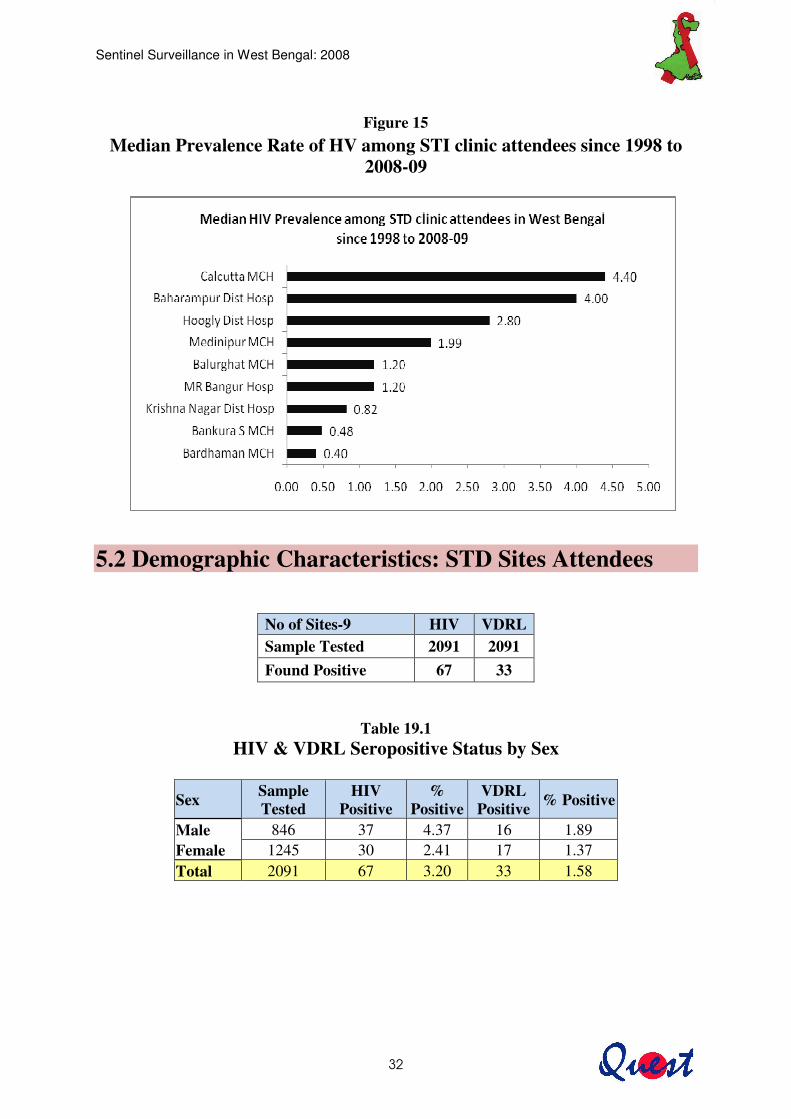
Figure 15 Median Prevalence Rate of HV among STI clinic attendees since 1998 to
2008-09
5.2 Demographic Characteristics: STD Sites Attendees
No of Sites-9 HIV VDRL Sample Tested 2091 2091 Found Positive 67 33
Table 19.1 HIV & VDRL Seropositive Status by Sex
Sex Sample Tested
HIV Positive
% Positive
VDRL Positive % Positive
Male 846 37 4.37 16 1.89 Female 1245 30 2.41 17 1.37 Total 2091 67 3.20 33 1.58
Sentinel Surveillance in West Bengal: 2008
33
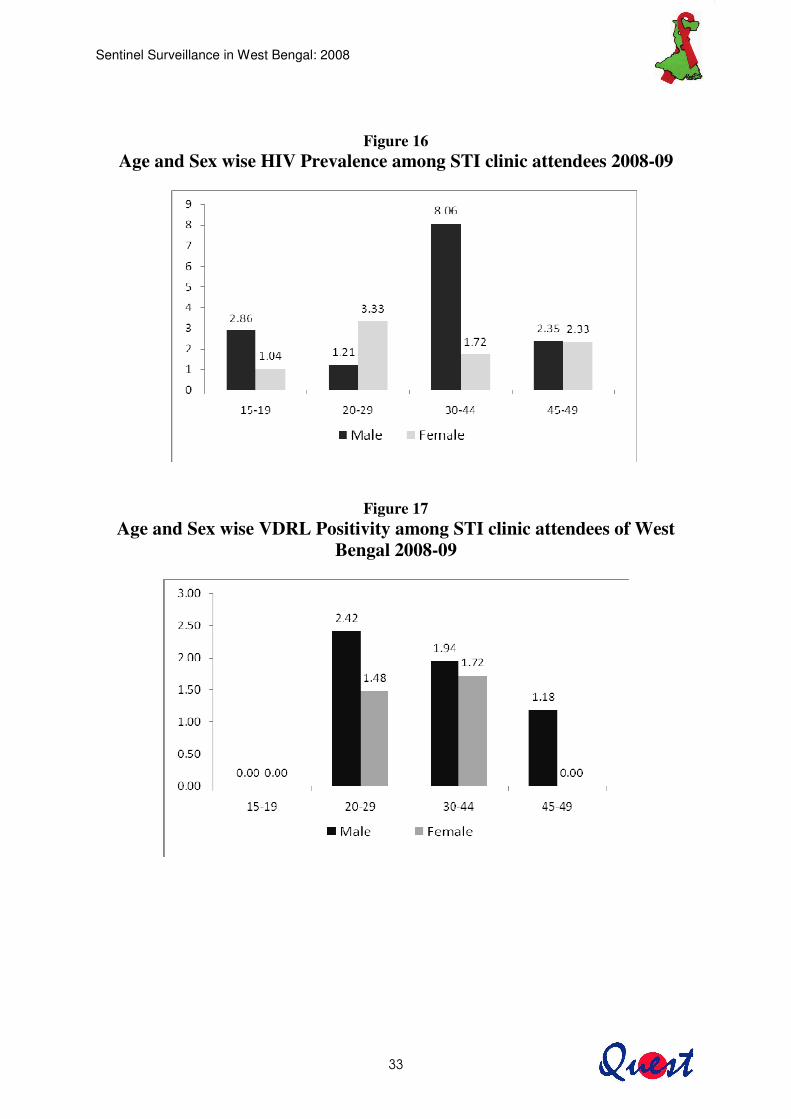
Figure 16
Age and Sex wise HIV Prevalence among STI clinic attendees 2008-09
Figure 17 Age and Sex wise VDRL Positivity among STI clinic attendees of West
Bengal 2008-09
Sentinel Surveillance in West Bengal: 2008
34
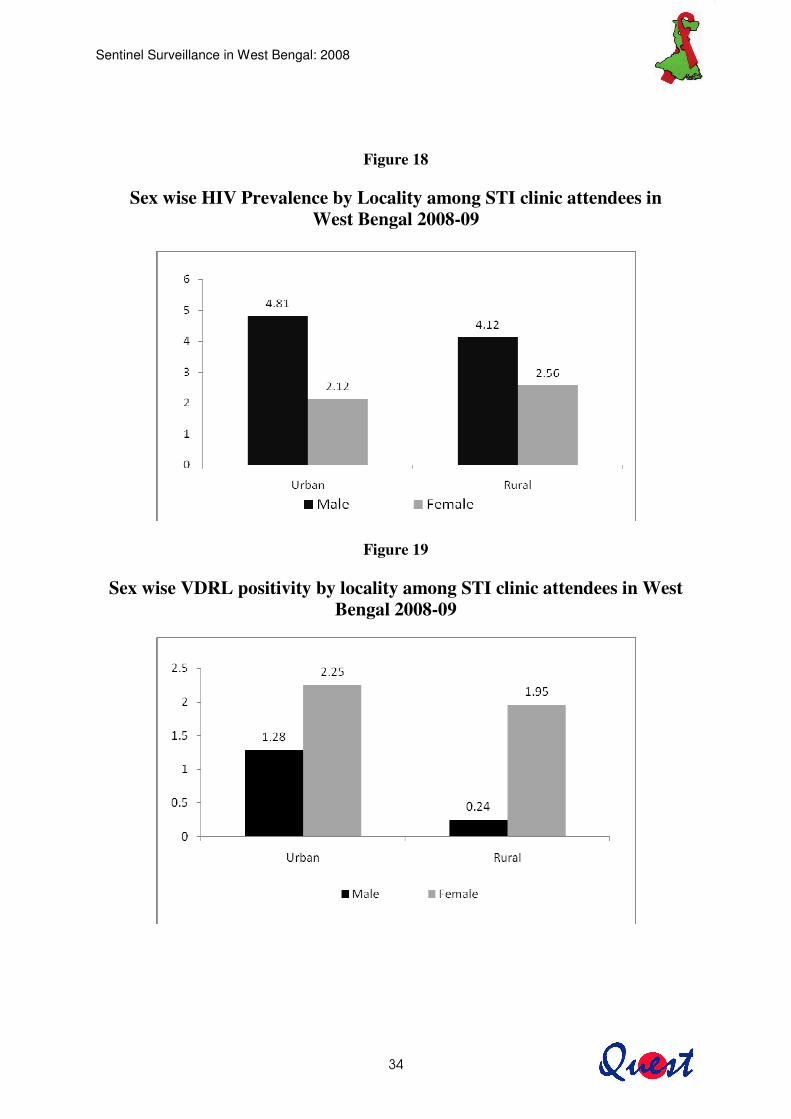
Figure 18
Sex wise HIV Prevalence by Locality among STI clinic attendees in West Bengal 2008-09
Figure 19
Sex wise VDRL positivity by locality among STI clinic attendees in West Bengal 2008-09
Sentinel Surveillance in West Bengal: 2008
35
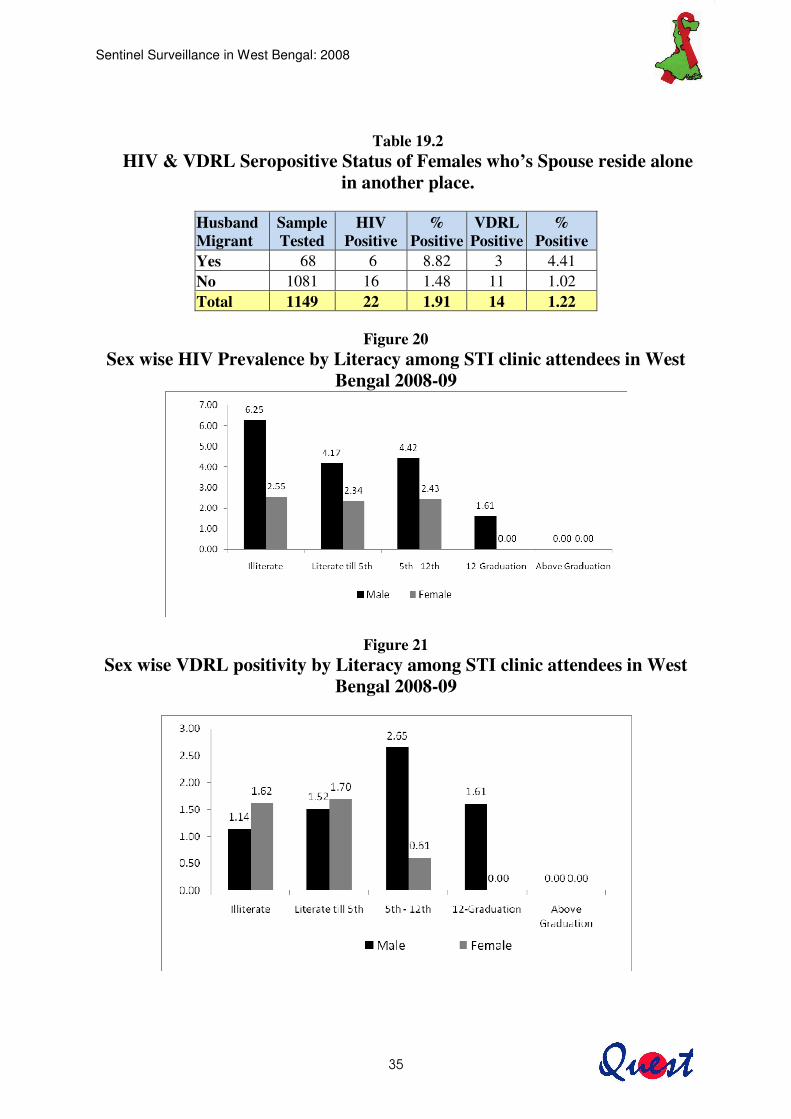
Table 19.2
HIV & VDRL Seropositive Status of Females who’s Spouse reside alone in another place.
Husband Migrant
Sample Tested
HIV Positive
% Positive
VDRL Positive
% Positive
Yes 68 6 8.82 3 4.41 No 1081 16 1.48 11 1.02 Total 1149 22 1.91 14 1.22
Figure 20
Sex wise HIV Prevalence by Literacy among STI clinic attendees in West Bengal 2008-09
Figure 21 Sex wise VDRL positivity by Literacy among STI clinic attendees in West
Bengal 2008-09
Sentinel Surveillance in West Bengal: 2008
36
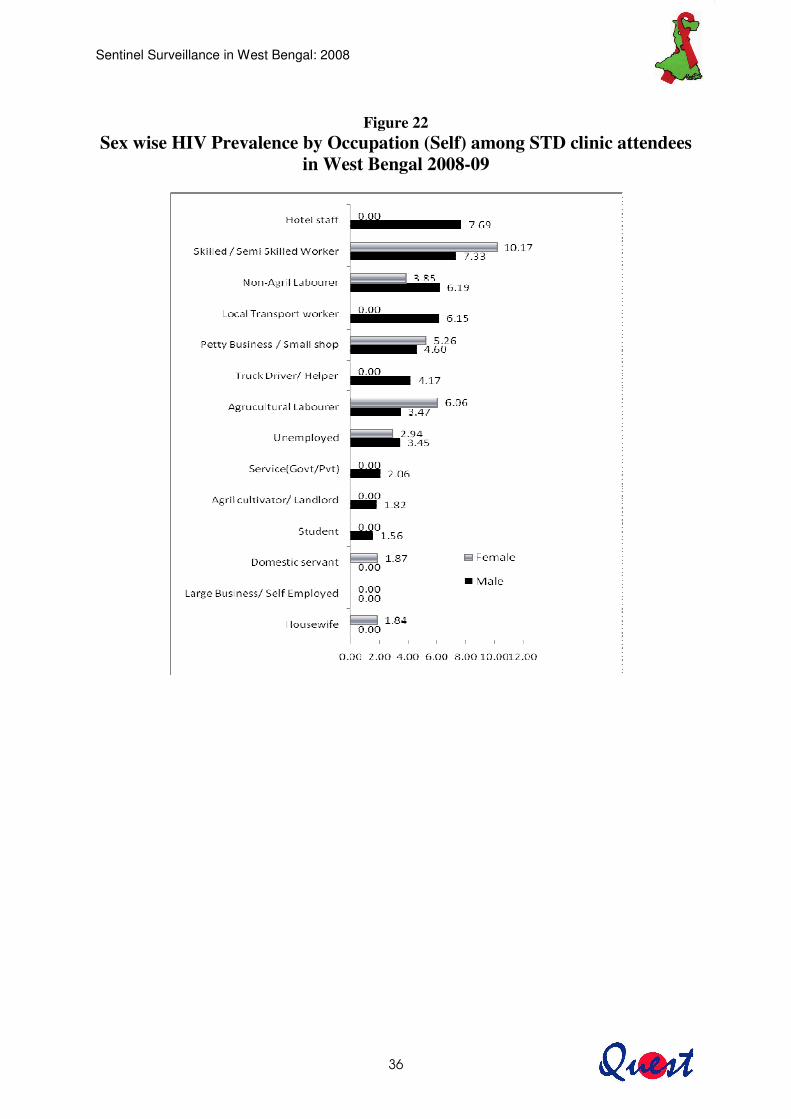
Figure 22 Sex wise HIV Prevalence by Occupation (Self) among STD clinic attendees
in West Bengal 2008-09
Sentinel Surveillance in West Bengal: 2008
37
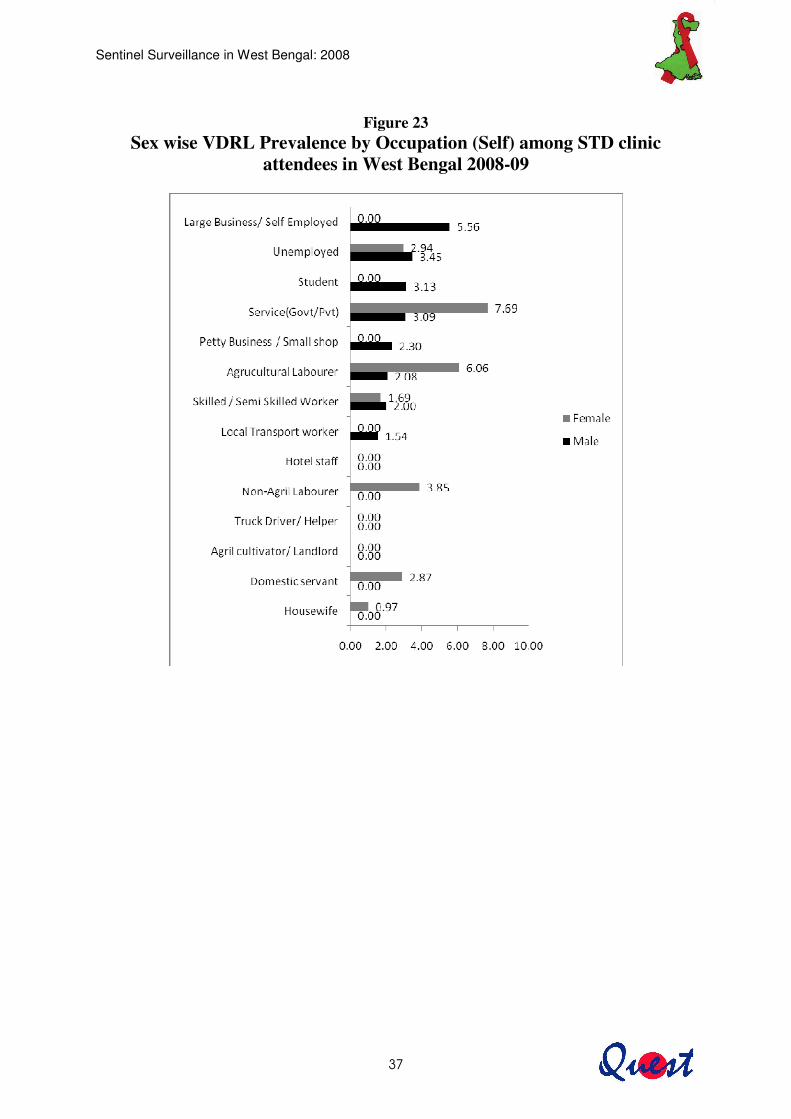
Figure 23 Sex wise VDRL Prevalence by Occupation (Self) among STD clinic
attendees in West Bengal 2008-09

Sentinel Surveillance in West Bengal: 2008
38
Table 19.3 HIV & VDRL Seropositivity Status by Occupation of Spouses of STI clinic attendees in West Bengal 2008-09
Occupation
Male Female Total
Sam
ple
Tes
ted
HIV
Po
sitiv
e
%
Posi
tive
VD
RL
+v
e
%
Posi
tive
Sam
ple
Tes
ted
HIV
+v
e
%
Posi
tive
VD
RL
+v
e %
Po
sitiv
e Sa
mpl
e T
este
d H
IV
+ve
%
Posi
tive
VD
RL
+v
e %
Po
sitiv
e
Agricultural Labourer 20 0 0.00 1 5.00 213 5 2.35 6 2.82 233 5 2.15 7 3.00 Non-agricultural Labourer 8 1 12.50 0 0.00 142 2 1.41 2 1.41 150 3 2.00 2 1.33 Domestic Servant 40 3 7.50 2 5.00 5 0 0.00 0 0.00 45 3 6.67 2 4.44 Skilled/Semi Skilled Worker 11 1 9.09 0 0.00 167 5 2.99 0 0.00 178 6 3.37 0 0.00 Petty Business/Small Shop 4 0 0.00 0 0.00 156 3 1.92 0 0.00 160 3 1.88 0 0.00 Large Business/Self Employed 1 0 0.00 0 0.00 26 0 0.00 1 3.85 27 0 0.00 1 3.70 Service (Govt/Pvt) 8 0 0.00 0 0.00 75 3 4.00 1 1.33 83 3 3.61 1 1.20 Student 0 0 0.00 0 0.00 0 0 0.00 0 0.00 0 0 0.00 0 0.00 Truck Driver/Helper 0 0 0.00 0 0.00 45 1 0.00 0 0.00 45 1 2.22 0 0.00 Local Transport Worker(Auto/ Taxi, Hand Cart, Rickshaw Puller 0 0 0.00 0 0.00 121 1 0.00 0 0.00 121 1 0.83 0 0.00
Hotel Stuff 2 0 0.00 1 50.00 18 1 5.56 1 5.56 20 1 5.00 2 10.00 Agricultural Cultivator/Landlord 1 0 0.00 0 0.00 150 0 0.00 1 0.67 151 0 0.00 1 0.66 Unemployed 0 0 0.00 0 0.00 21 0 0.00 2 9.52 21 0 0.00 2 9.52 Housewife 499 0 0.00 6 1.20 0 0 0.00 0 0.00 499 22 4.41 6 1.20 Not Applicable 252 10 3.97 6 2.38 106 9 8.49 3 2.83 358 19 5.31 9 2.51
Total 846 37 4.37 16 1.89 1245 30 2.41 17 1.37 2091 67 3.20 33 1.58

Sentinel Surveillance in West Bengal: 2008
39
Table 19.4
HIV & VDRL Seropositivity Status by Clinical Diagnosis among STI clinic attendees in West Bengal 2008-09 �
Syndromic Diagnosis.
Male Female Total
Sam
ple
Tes
ted
HIV
+ve
%
Posi
tive
VD
RL
+v
e %
Po
sitiv
e Sa
mpl
e T
este
d H
IV +
ve
%
Posi
tive
VD
RL
+v
e %
Po
sitiv
e Sa
mpl
e T
este
d
HIV
+ve
%
Posi
tive
VD
RL
+v
e %
Po
sitiv
e
Ano-genital Ulcers 450 24 5.33 11 2.44 168 10 5.95 3 1.79 618 34 5.50 14 2.27 Urethral Discharge/ Cervical Discharge 221 5 2.26 4 1.81 812 11 1.35 10 1.23 1033 16 1.55 14 1.36
Genital Ulcers & Urethral Discharge/ Cervical Discharge 97 0 0.00 1 1.03 226 4 1.77 3 1.33 323 4 1.24 4 1.24
Ano-genital Warts 78 8 10.26 0 0.00 39 5 12.82 1 2.56 117 13 11.11 1 0.85 Total 846 37 4.37 16 1.89 1245 30 2.41 17 1.37 2091 67 3.20 33 1.58
Sentinel Surveillance in West Bengal: 2008
40
6 Status of FSW Sites
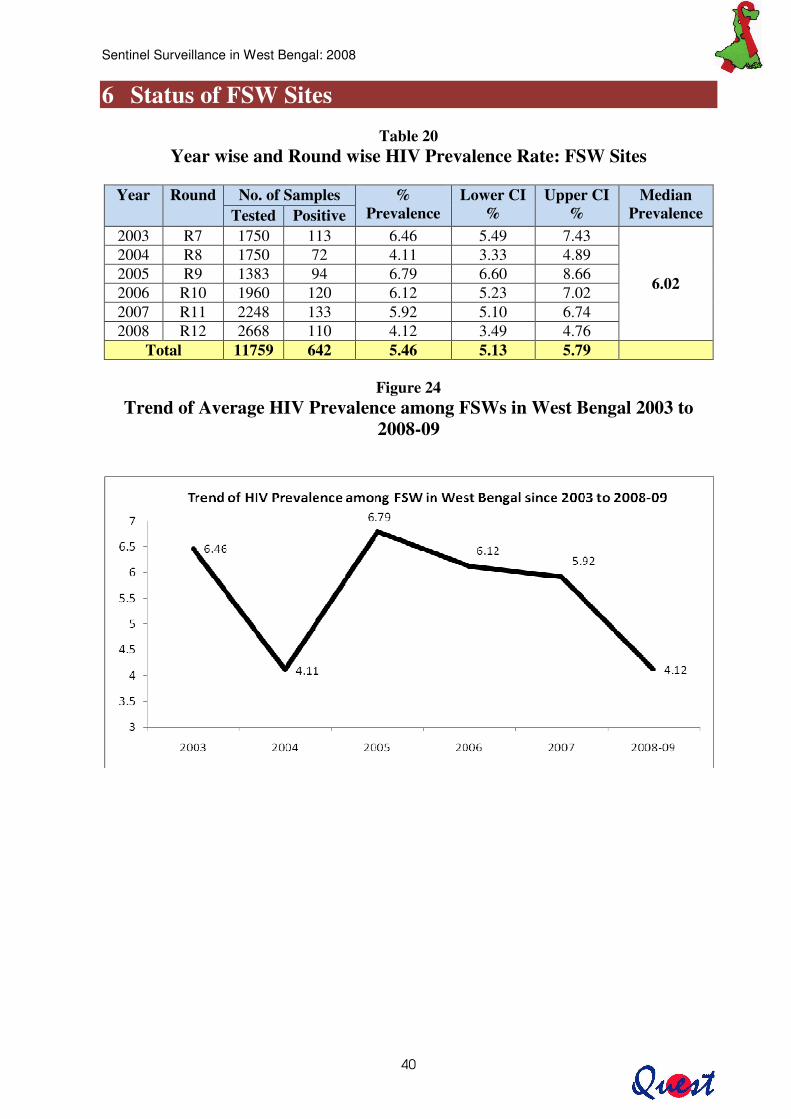
Table 20 Year wise and Round wise HIV Prevalence Rate: FSW Sites
Year Round No. of Samples %
Prevalence Lower CI
% Upper CI
% Median
Prevalence Tested Positive 2003 R7 1750 113 6.46 5.49 7.43
6.02
2004 R8 1750 72 4.11 3.33 4.89 2005 R9 1383 94 6.79 6.60 8.66 2006 R10 1960 120 6.12 5.23 7.02 2007 R11 2248 133 5.92 5.10 6.74 2008 R12 2668 110 4.12 3.49 4.76
Total 11759 642 5.46 5.13 5.79
Figure 24 Trend of Average HIV Prevalence among FSWs in West Bengal 2003 to
2008-09
Sentinel Surveillance in West Bengal: 2008
41
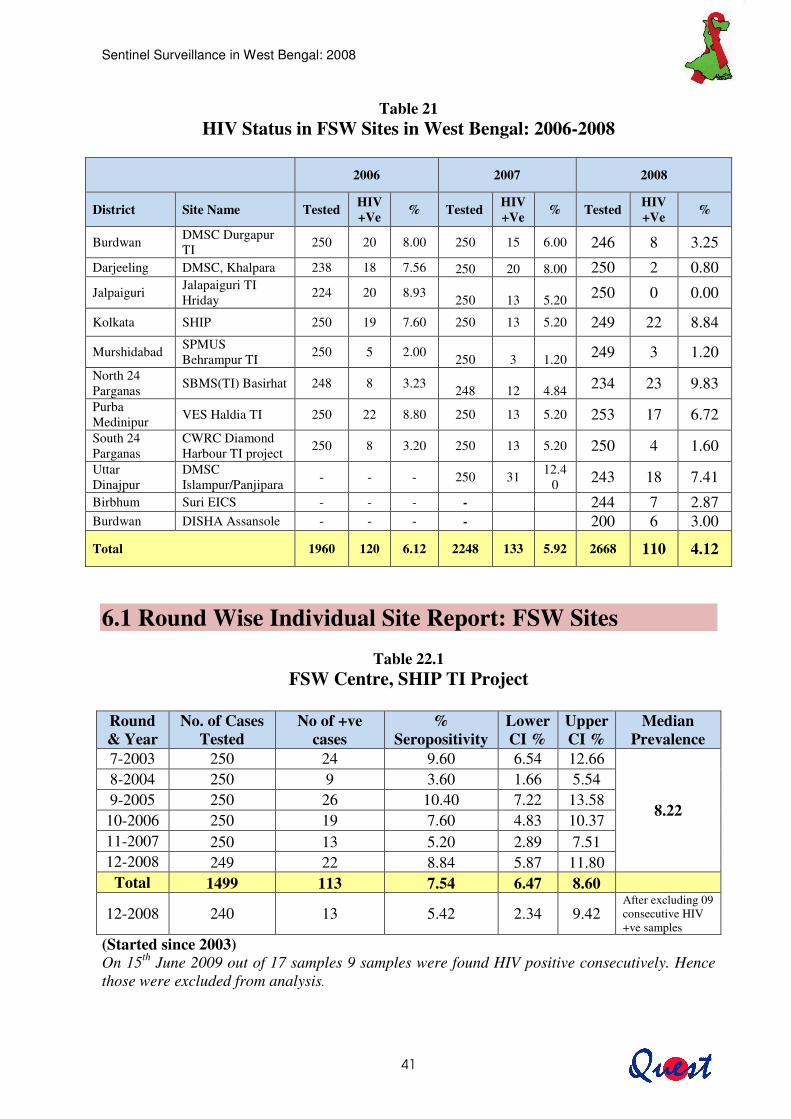
Table 21
HIV Status in FSW Sites in West Bengal: 2006-2008
2006 2007 2008
District Site Name Tested HIV +Ve % Tested HIV
+Ve % Tested HIV +Ve %
Burdwan DMSC Durgapur TI 250 20 8.00 250 15 6.00 246 8 3.25
Darjeeling DMSC, Khalpara 238 18 7.56 250 20 8.00 250 2 0.80
Jalpaiguri Jalapaiguri TI Hriday 224 20 8.93 250 13 5.20 250 0 0.00
Kolkata SHIP 250 19 7.60 250 13 5.20 249 22 8.84
Murshidabad SPMUS Behrampur TI 250 5 2.00 250 3 1.20 249 3 1.20
North 24 Parganas SBMS(TI) Basirhat 248 8 3.23 248 12 4.84 234 23 9.83 Purba Medinipur VES Haldia TI 250 22 8.80 250 13 5.20 253 17 6.72 South 24 Parganas
CWRC Diamond Harbour TI project 250 8 3.20 250 13 5.20 250 4 1.60
Uttar Dinajpur
DMSC Islampur/Panjipara - - - 250 31 12.4
0 243 18 7.41
Birbhum Suri EICS - - - - 244 7 2.87 Burdwan DISHA Assansole - - - - 200 6 3.00
Total 1960 120 6.12 2248 133 5.92 2668 110 4.12
6.1 Round Wise Individual Site Report: FSW Sites
Table 22.1 FSW Centre, SHIP TI Project
Round & Year
No. of Cases Tested
No of +ve cases
% Seropositivity
Lower CI %
Upper CI %
Median Prevalence
7-2003 250 24 9.60 6.54 12.66
8.22
8-2004 250 9 3.60 1.66 5.54 9-2005 250 26 10.40 7.22 13.58
10-2006 250 19 7.60 4.83 10.37 11-2007 250 13 5.20 2.89 7.51 12-2008 249 22 8.84 5.87 11.80
Total 1499 113 7.54 6.47 8.60
12-2008 240 13 5.42 2.34 9.42 After excluding 09 consecutive HIV +ve samples
(Started since 2003) On 15th June 2009 out of 17 samples 9 samples were found HIV positive consecutively. Hence those were excluded from analysis.
Sentinel Surveillance in West Bengal: 2008
42
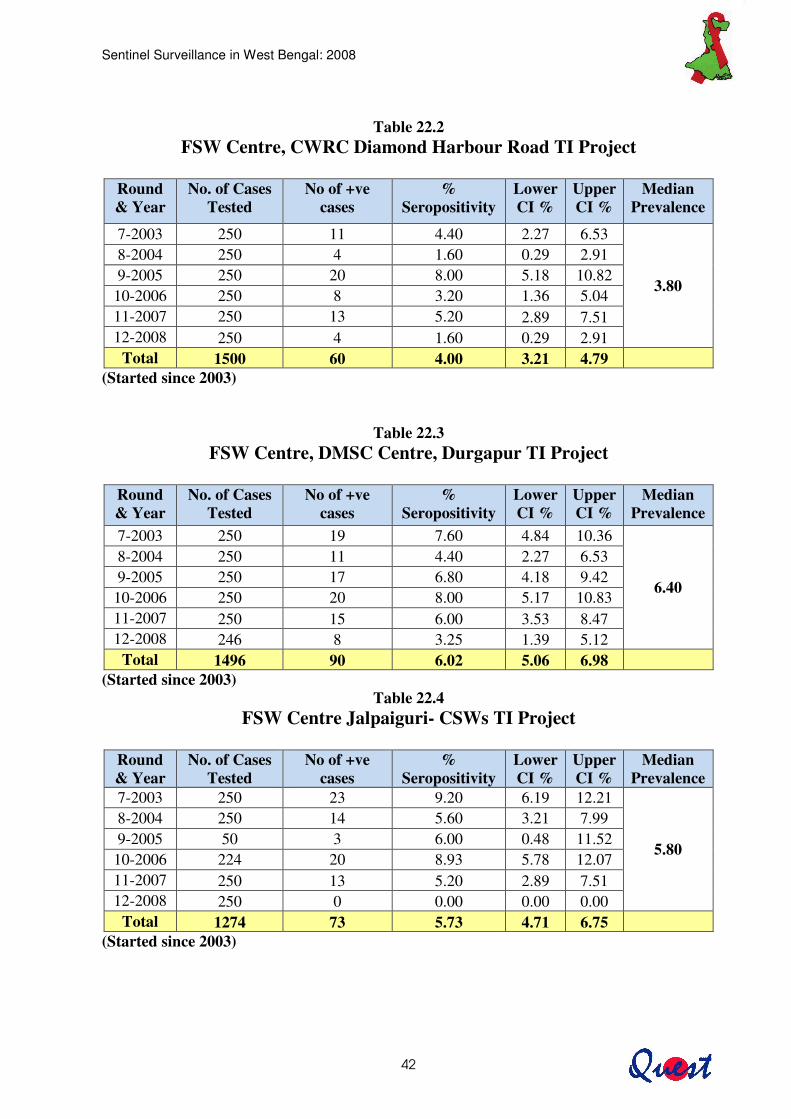
Table 22.2 FSW Centre, CWRC Diamond Harbour Road TI Project
Round & Year
No. of Cases Tested
No of +ve cases
% Seropositivity
Lower CI %
Upper CI %
Median Prevalence
7-2003 250 11 4.40 2.27 6.53
3.80
8-2004 250 4 1.60 0.29 2.91 9-2005 250 20 8.00 5.18 10.82
10-2006 250 8 3.20 1.36 5.04 11-2007 250 13 5.20 2.89 7.51 12-2008 250 4 1.60 0.29 2.91
Total 1500 60 4.00 3.21 4.79 (Started since 2003)
Table 22.3 FSW Centre, DMSC Centre, Durgapur TI Project
Round & Year
No. of Cases Tested
No of +ve cases
% Seropositivity
Lower CI %
Upper CI %
Median Prevalence
7-2003 250 19 7.60 4.84 10.36
6.40
8-2004 250 11 4.40 2.27 6.53 9-2005 250 17 6.80 4.18 9.42
10-2006 250 20 8.00 5.17 10.83 11-2007 250 15 6.00 3.53 8.47 12-2008 246 8 3.25 1.39 5.12
Total 1496 90 6.02 5.06 6.98 (Started since 2003)
Table 22.4 FSW Centre Jalpaiguri- CSWs TI Project
Round & Year
No. of Cases Tested
No of +ve cases
% Seropositivity
Lower CI %
Upper CI %
Median Prevalence
7-2003 250 23 9.20 6.19 12.21
5.80
8-2004 250 14 5.60 3.21 7.99 9-2005 50 3 6.00 0.48 11.52
10-2006 224 20 8.93 5.78 12.07 11-2007 250 13 5.20 2.89 7.51 12-2008 250 0 0.00 0.00 0.00
Total 1274 73 5.73 4.71 6.75 (Started since 2003)
Sentinel Surveillance in West Bengal: 2008
43
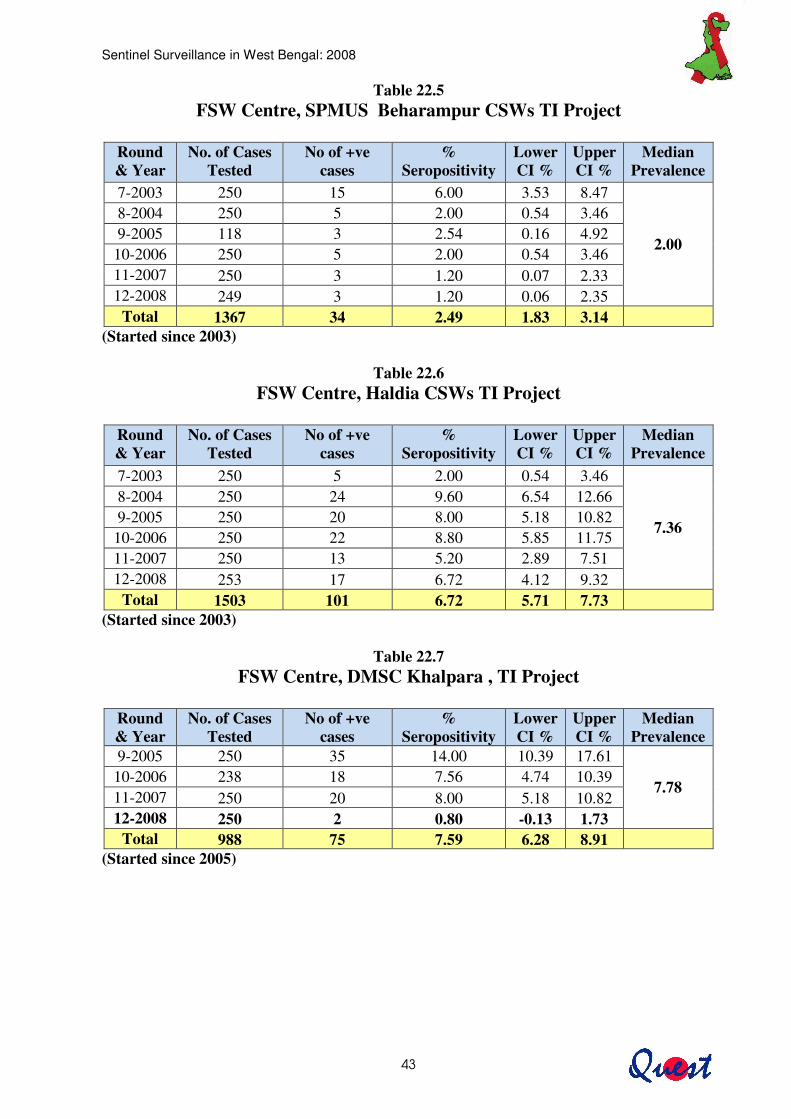
Table 22.5 FSW Centre, SPMUS Beharampur CSWs TI Project
Round & Year
No. of Cases Tested
No of +ve cases
% Seropositivity
Lower CI %
Upper CI %
Median Prevalence
7-2003 250 15 6.00 3.53 8.47
2.00
8-2004 250 5 2.00 0.54 3.46 9-2005 118 3 2.54 0.16 4.92
10-2006 250 5 2.00 0.54 3.46 11-2007 250 3 1.20 0.07 2.33 12-2008 249 3 1.20 0.06 2.35
Total 1367 34 2.49 1.83 3.14 (Started since 2003)
Table 22.6 FSW Centre, Haldia CSWs TI Project
Round & Year
No. of Cases Tested
No of +ve cases
% Seropositivity
Lower CI %
Upper CI %
Median Prevalence
7-2003 250 5 2.00 0.54 3.46
7.36
8-2004 250 24 9.60 6.54 12.66 9-2005 250 20 8.00 5.18 10.82
10-2006 250 22 8.80 5.85 11.75 11-2007 250 13 5.20 2.89 7.51 12-2008 253 17 6.72 4.12 9.32
Total 1503 101 6.72 5.71 7.73 (Started since 2003)
Table 22.7 FSW Centre, DMSC Khalpara , TI Project
Round & Year
No. of Cases Tested
No of +ve cases
% Seropositivity
Lower CI %
Upper CI %
Median Prevalence
9-2005 250 35 14.00 10.39 17.61
7.78 10-2006 238 18 7.56 4.74 10.39 11-2007 250 20 8.00 5.18 10.82 12-2008 250 2 0.80 -0.13 1.73
Total 988 75 7.59 6.28 8.91 (Started since 2005)
Sentinel Surveillance in West Bengal: 2008
44
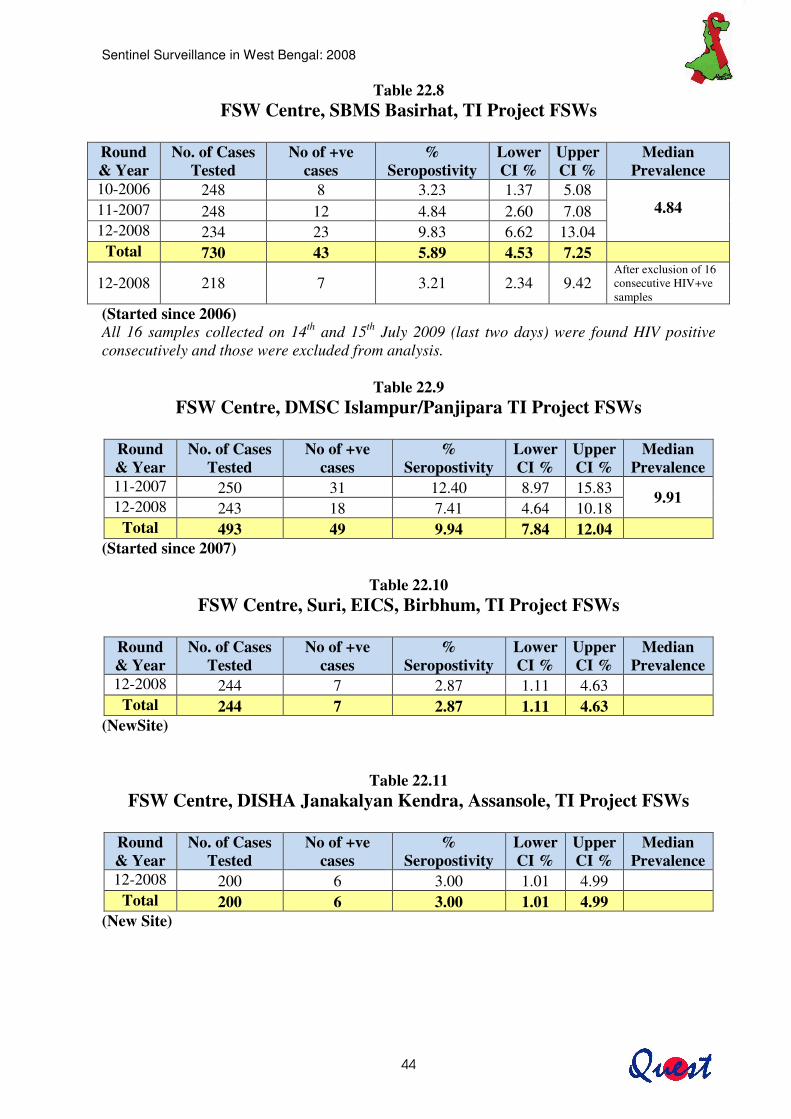
Table 22.8 FSW Centre, SBMS Basirhat, TI Project FSWs
Round & Year
No. of Cases Tested
No of +ve cases
% Seropostivity
Lower CI %
Upper CI %
Median Prevalence
10-2006 248 8 3.23 1.37 5.08 4.84 11-2007 248 12 4.84 2.60 7.08
12-2008 234 23 9.83 6.62 13.04 Total 730 43 5.89 4.53 7.25
12-2008 218 7 3.21 2.34 9.42 After exclusion of 16 consecutive HIV+ve samples
(Started since 2006) All 16 samples collected on 14th and 15th July 2009 (last two days) were found HIV positive consecutively and those were excluded from analysis.
Table 22.9
FSW Centre, DMSC Islampur/Panjipara TI Project FSWs
Round & Year
No. of Cases Tested
No of +ve cases
% Seropostivity
Lower CI %
Upper CI %
Median Prevalence
11-2007 250 31 12.40 8.97 15.83 9.91 12-2008 243 18 7.41 4.64 10.18 Total 493 49 9.94 7.84 12.04
(Started since 2007)
Table 22.10 FSW Centre, Suri, EICS, Birbhum, TI Project FSWs
Round & Year
No. of Cases Tested
No of +ve cases
% Seropostivity
Lower CI %
Upper CI %
Median Prevalence
12-2008 244 7 2.87 1.11 4.63 Total 244 7 2.87 1.11 4.63
(NewSite)
Table 22.11 FSW Centre, DISHA Janakalyan Kendra, Assansole, TI Project FSWs
Round & Year
No. of Cases Tested
No of +ve cases
% Seropostivity
Lower CI %
Upper CI %
Median Prevalence
12-2008 200 6 3.00 1.01 4.99 Total 200 6 3.00 1.01 4.99
(New Site)
Sentinel Surveillance in West Bengal: 2008
45
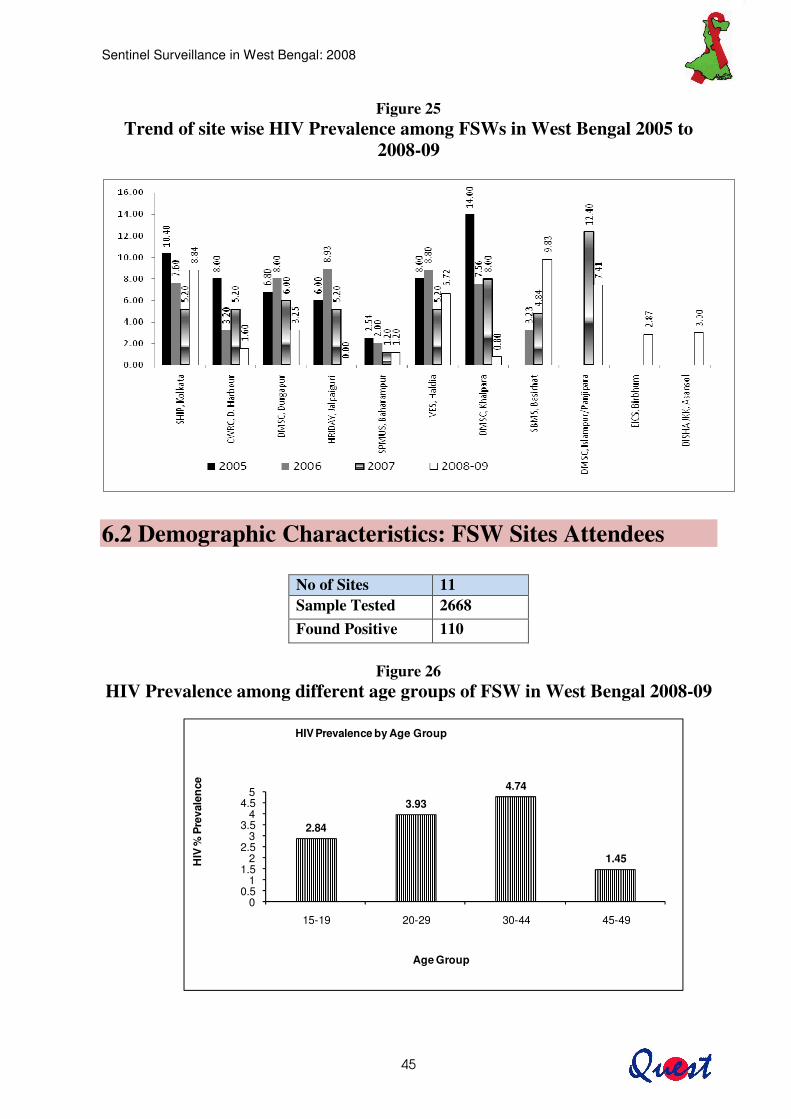
Figure 25
Trend of site wise HIV Prevalence among FSWs in West Bengal 2005 to 2008-09
6.2 Demographic Characteristics: FSW Sites Attendees
No of Sites 11 Sample Tested 2668 Found Positive 110
Figure 26
HIV Prevalence among different age groups of FSW in West Bengal 2008-09
2.84
3.93
4.74
1.45
00.5
11.5
22.5
33.5
44.5
5
15-19 20-29 30-44 45-49
HIV
% P
reva
len
ce
Age Group
HIV Prevalence by Age Group
Sentinel Surveillance in West Bengal: 2008
46
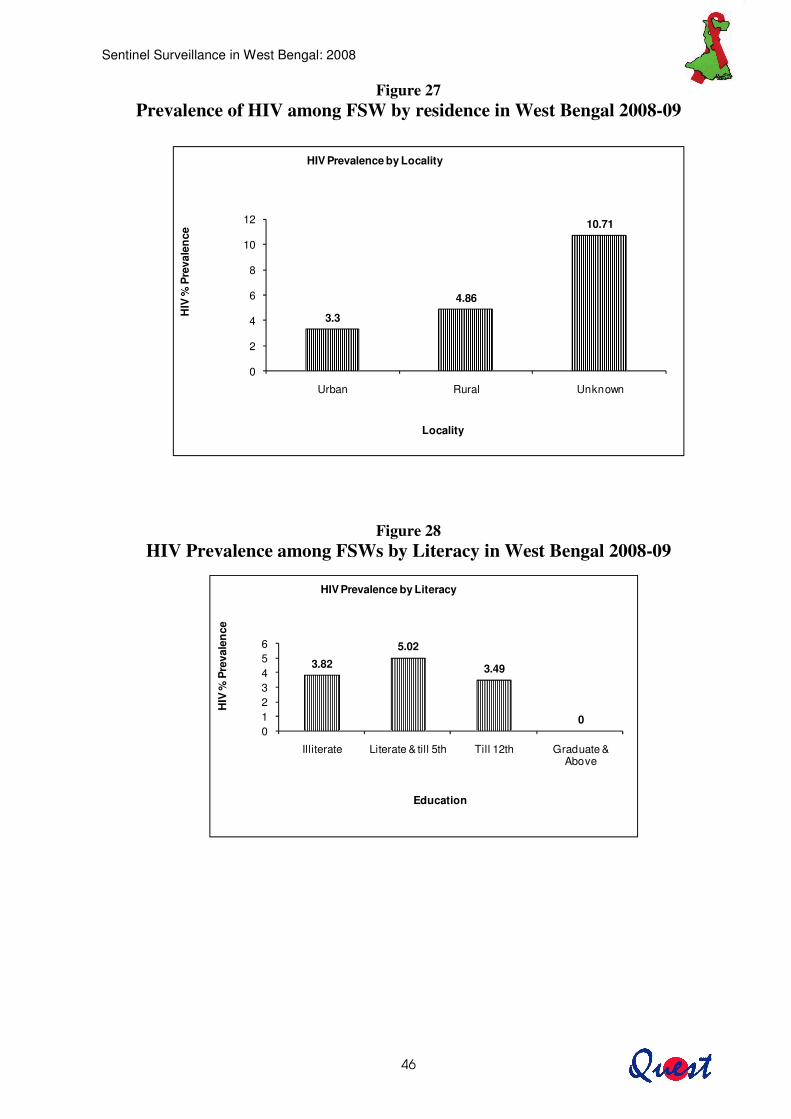
3.82
5.02
3.49
00123456
Illiterate Literate & till 5th Till 12th Graduate & Above
HIV
% P
reva
len
ce
Education
HIV Prevalence by Literacy
Figure 27 Prevalence of HIV among FSW by residence in West Bengal 2008-09
Figure 28 HIV Prevalence among FSWs by Literacy in West Bengal 2008-09
3.3
4.86
10.71
0
2
4
6
8
10
12
Urban Rural Unknown
HIV
% P
reva
len
ce
Locality
HIV Prevalence by Locality
Sentinel Surveillance in West Bengal: 2008
47
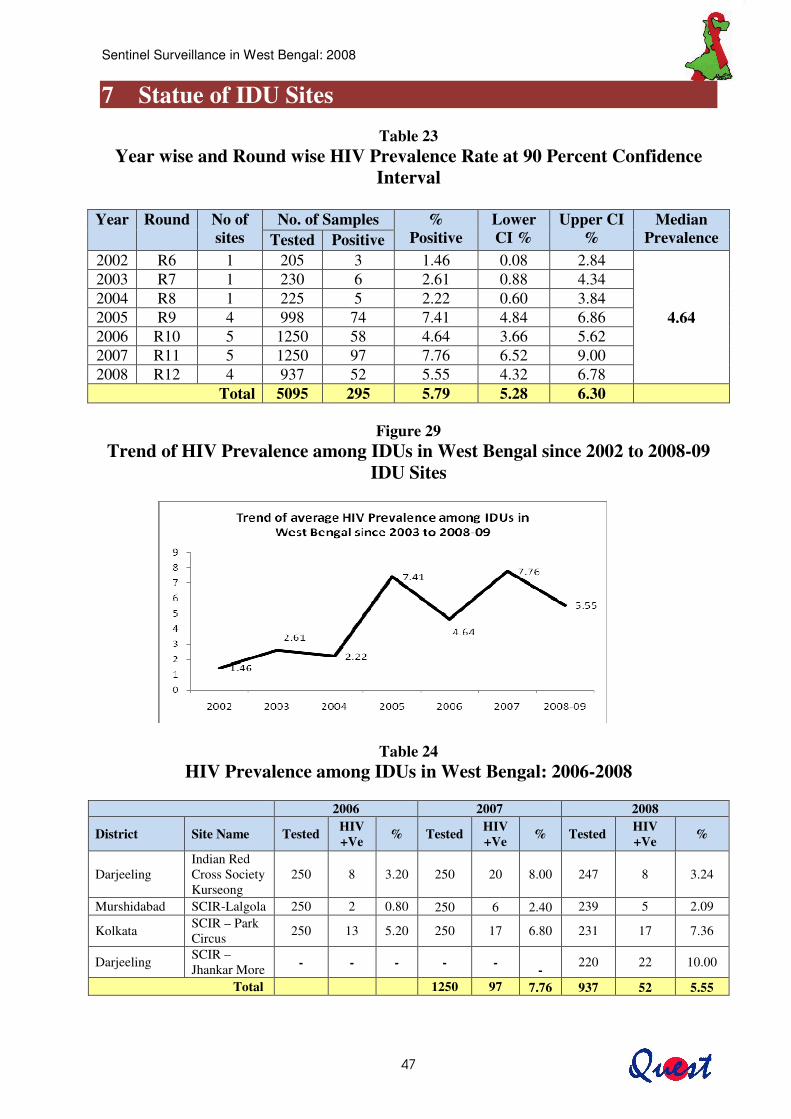
7 Statue of IDU Sites
Table 23 Year wise and Round wise HIV Prevalence Rate at 90 Percent Confidence
Interval
Year Round No of sites
No. of Samples % Positive
Lower CI %
Upper CI %
Median Prevalence Tested Positive
2002 R6 1 205 3 1.46 0.08 2.84
4.64
2003 R7 1 230 6 2.61 0.88 4.34 2004 R8 1 225 5 2.22 0.60 3.84 2005 R9 4 998 74 7.41 4.84 6.86 2006 R10 5 1250 58 4.64 3.66 5.62 2007 R11 5 1250 97 7.76 6.52 9.00 2008 R12 4 937 52 5.55 4.32 6.78
Total 5095 295 5.79 5.28 6.30
Figure 29 Trend of HIV Prevalence among IDUs in West Bengal since 2002 to 2008-09
IDU Sites
Table 24 HIV Prevalence among IDUs in West Bengal: 2006-2008
2006 2007 2008
District Site Name Tested HIV +Ve % Tested HIV
+Ve % Tested HIV +Ve %
Darjeeling Indian Red Cross Society Kurseong
250 8 3.20 250 20 8.00 247 8 3.24
Murshidabad SCIR-Lalgola 250 2 0.80 250 6 2.40 239 5 2.09
Kolkata SCIR – Park Circus 250 13 5.20 250 17 6.80 231 17 7.36
Darjeeling SCIR – Jhankar More - - - - - - 220 22 10.00
Total 1250 97 7.76 937 52 5.55
Sentinel Surveillance in West Bengal: 2008
48
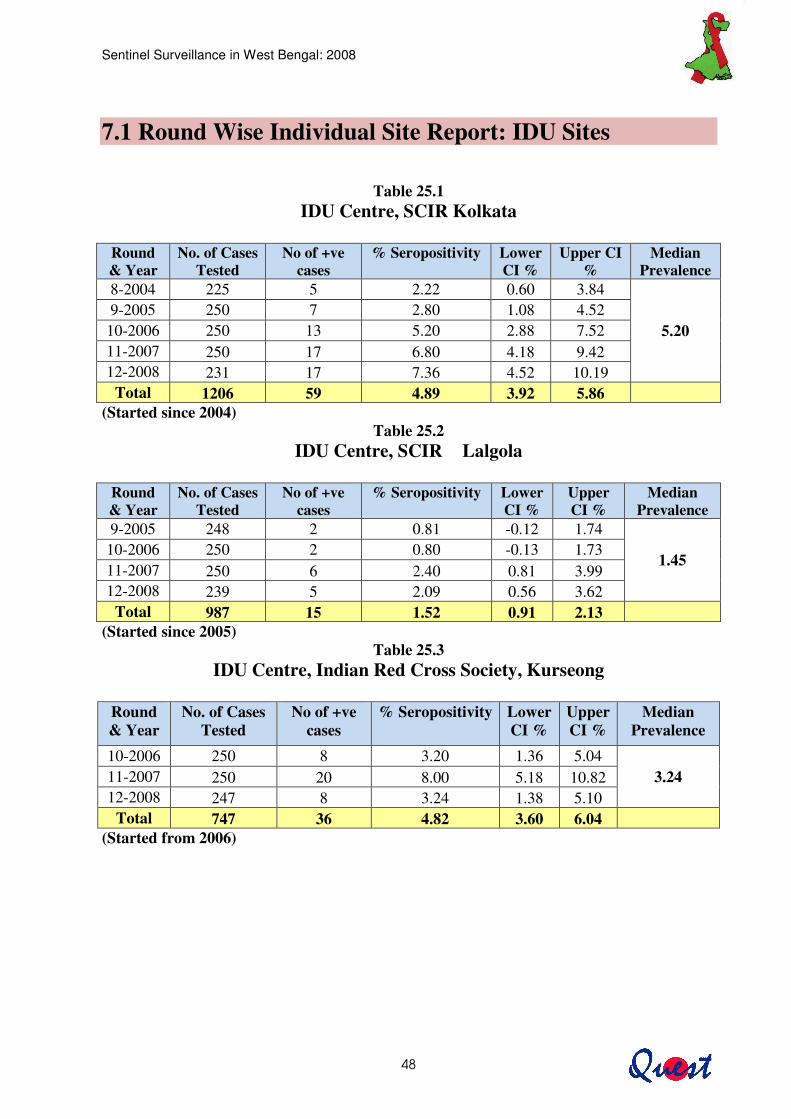
7.1 Round Wise Individual Site Report: IDU Sites
Table 25.1 IDU Centre, SCIR Kolkata
Round & Year
No. of Cases Tested
No of +ve cases
% Seropositivity Lower CI %
Upper CI %
Median Prevalence
8-2004 225 5 2.22 0.60 3.84
5.20 9-2005 250 7 2.80 1.08 4.52
10-2006 250 13 5.20 2.88 7.52 11-2007 250 17 6.80 4.18 9.42 12-2008 231 17 7.36 4.52 10.19
Total 1206 59 4.89 3.92 5.86 (Started since 2004)
Table 25.2 IDU Centre, SCIR Lalgola
Round & Year
No. of Cases Tested
No of +ve cases
% Seropositivity Lower CI %
Upper CI %
Median Prevalence
9-2005 248 2 0.81 -0.12 1.74
1.45 10-2006 250 2 0.80 -0.13 1.73 11-2007 250 6 2.40 0.81 3.99 12-2008 239 5 2.09 0.56 3.62
Total 987 15 1.52 0.91 2.13 (Started since 2005)
Table 25.3 IDU Centre, Indian Red Cross Society, Kurseong
Round & Year
No. of Cases Tested
No of +ve cases
% Seropositivity Lower CI %
Upper CI %
Median Prevalence
10-2006 250 8 3.20 1.36 5.04 3.24 11-2007 250 20 8.00 5.18 10.82
12-2008 247 8 3.24 1.38 5.10 Total 747 36 4.82 3.60 6.04
(Started from 2006)
Sentinel Surveillance in West Bengal: 2008
49
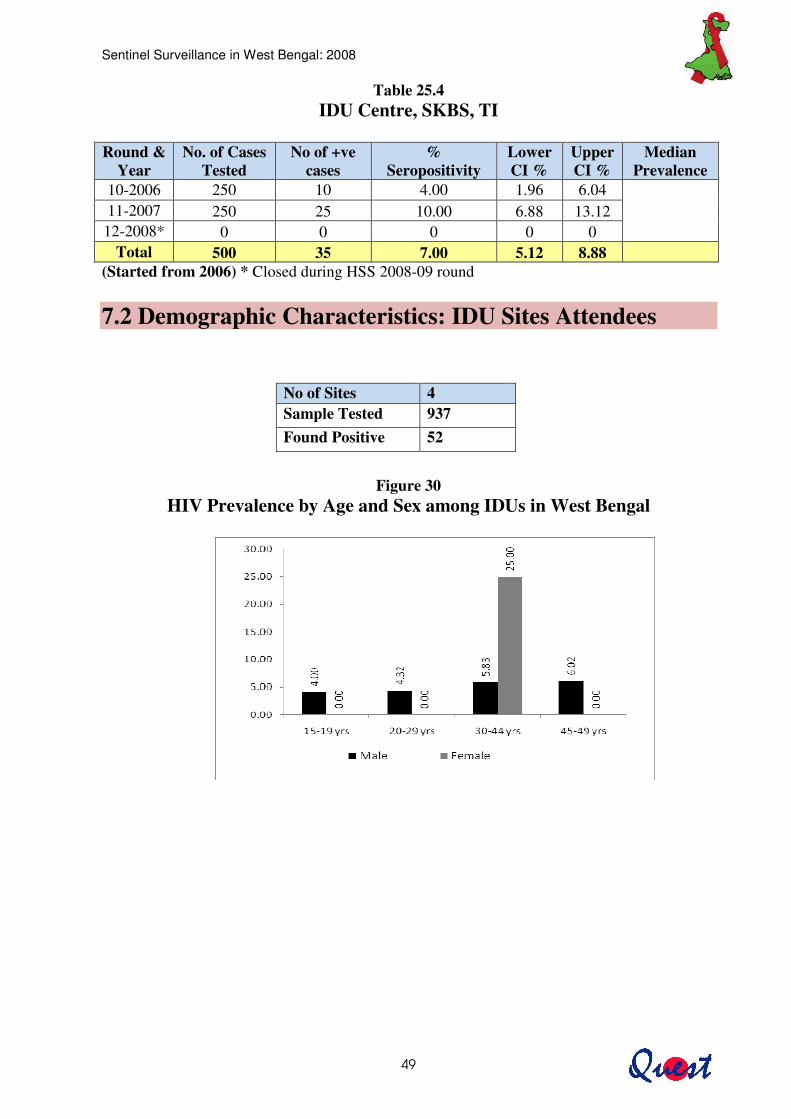
Table 25.4 IDU Centre, SKBS, TI
Round &
Year No. of Cases
Tested No of +ve
cases %
Seropositivity Lower CI %
Upper CI %
Median Prevalence
10-2006 250 10 4.00 1.96 6.04 11-2007 250 25 10.00 6.88 13.12
12-2008* 0 0 0 0 0 Total 500 35 7.00 5.12 8.88
(Started from 2006) * Closed during HSS 2008-09 round 7.2 Demographic Characteristics: IDU Sites Attendees
Figure 30
HIV Prevalence by Age and Sex among IDUs in West Bengal
No of Sites 4 Sample Tested 937 Found Positive 52

Sentinel Surveillance in West Bengal: 2008
50
Figure 31 HIV Prevalence by Locality among IDUs in West Bengal
Figure 32 HIV Prevalence by Literacy among IDUs of West Bengal
Sentinel Surveillance in West Bengal: 2008
51
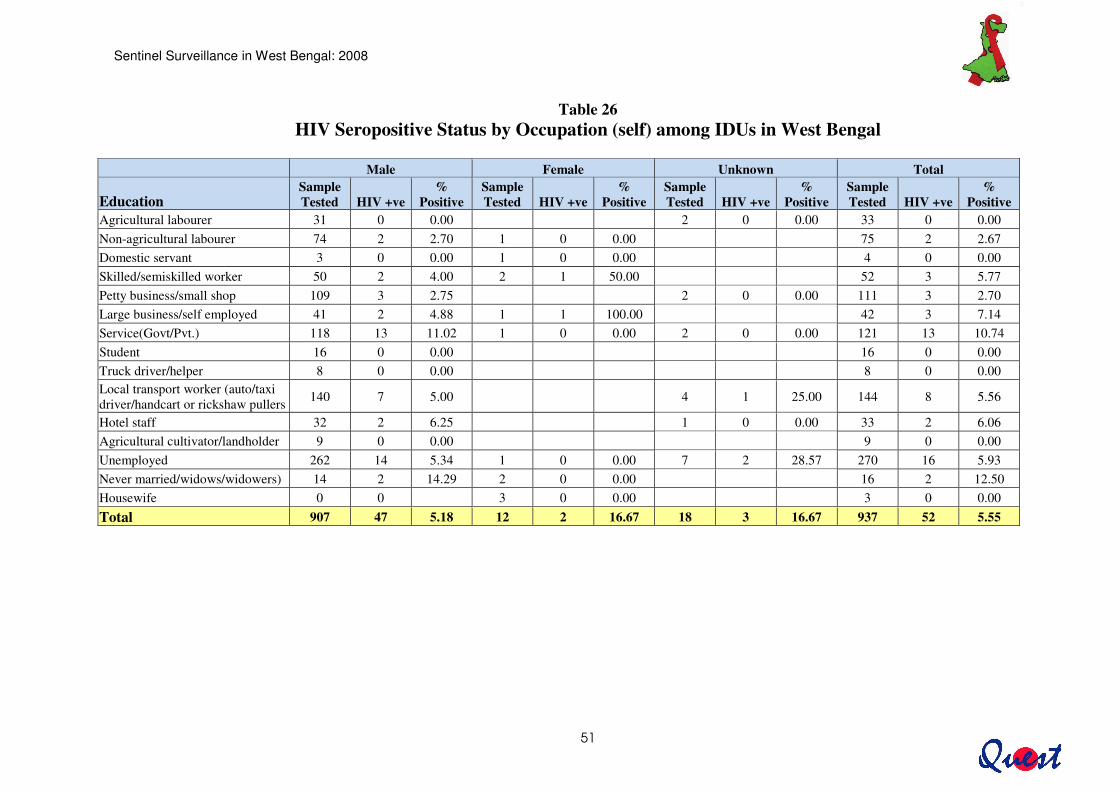
Table 26
HIV Seropositive Status by Occupation (self) among IDUs in West Bengal
Male Female Unknown Total
Education Sample Tested HIV +ve
% Positive
Sample Tested HIV +ve
% Positive
Sample Tested HIV +ve
% Positive
Sample Tested HIV +ve
% Positive
Agricultural labourer 31 0 0.00 2 0 0.00 33 0 0.00 Non-agricultural labourer 74 2 2.70 1 0 0.00 75 2 2.67 Domestic servant 3 0 0.00 1 0 0.00 4 0 0.00 Skilled/semiskilled worker 50 2 4.00 2 1 50.00 52 3 5.77 Petty business/small shop 109 3 2.75 2 0 0.00 111 3 2.70 Large business/self employed 41 2 4.88 1 1 100.00 42 3 7.14 Service(Govt/Pvt.) 118 13 11.02 1 0 0.00 2 0 0.00 121 13 10.74 Student 16 0 0.00 16 0 0.00 Truck driver/helper 8 0 0.00 8 0 0.00 Local transport worker (auto/taxi driver/handcart or rickshaw pullers 140 7 5.00 4 1 25.00 144 8 5.56
Hotel staff 32 2 6.25 1 0 0.00 33 2 6.06 Agricultural cultivator/landholder 9 0 0.00 9 0 0.00 Unemployed 262 14 5.34 1 0 0.00 7 2 28.57 270 16 5.93 Never married/widows/widowers) 14 2 14.29 2 0 0.00 16 2 12.50 Housewife 0 0 3 0 0.00 3 0 0.00 Total 907 47 5.18 12 2 16.67 18 3 16.67 937 52 5.55
Sentinel Surveillance in West Bengal: 2008
52
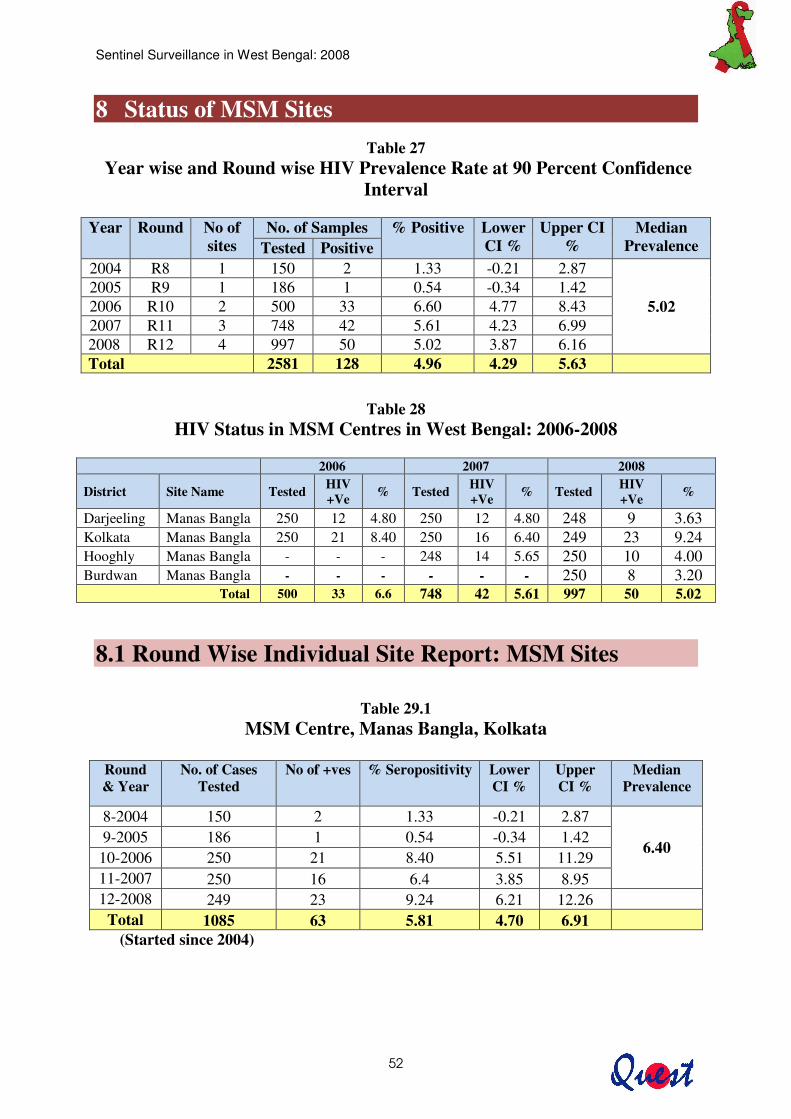
8 Status of MSM Sites �
Table 27 Year wise and Round wise HIV Prevalence Rate at 90 Percent Confidence
Interval
Year Round No of sites
No. of Samples % Positive Lower CI %
Upper CI %
Median Prevalence Tested Positive
2004 R8 1 150 2 1.33 -0.21 2.87
5.02 2005 R9 1 186 1 0.54 -0.34 1.42 2006 R10 2 500 33 6.60 4.77 8.43 2007 R11 3 748 42 5.61 4.23 6.99 2008 R12 4 997 50 5.02 3.87 6.16 Total 2581 128 4.96 4.29 5.63
Table 28 HIV Status in MSM Centres in West Bengal: 2006-2008
2006 2007 2008
District Site Name Tested HIV +Ve % Tested HIV
+Ve % Tested HIV +Ve %
Darjeeling Manas Bangla 250 12 4.80 250 12 4.80 248 9 3.63 Kolkata Manas Bangla 250 21 8.40 250 16 6.40 249 23 9.24 Hooghly Manas Bangla - - - 248 14 5.65 250 10 4.00 Burdwan Manas Bangla - - - - - - 250 8 3.20
Total 500 33 6.6 748 42 5.61 997 50 5.02
8.1 Round Wise Individual Site Report: MSM Sites �
�
Table 29.1 MSM Centre, Manas Bangla, Kolkata
Round & Year
No. of Cases Tested
No of +ves % Seropositivity Lower CI %
Upper CI %
Median Prevalence
8-2004 150 2 1.33 -0.21 2.87
6.40 9-2005 186 1 0.54 -0.34 1.42
10-2006 250 21 8.40 5.51 11.29 11-2007 250 16 6.4 3.85 8.95 12-2008 249 23 9.24 6.21 12.26
Total 1085 63 5.81 4.70 6.91 (Started since 2004)

Sentinel Surveillance in West Bengal: 2008
53
Table 29.2 MSM Centre, Manas Bangla, Siliguri
Round & Year
No. of Cases Tested
No of +ve cases
% Seropositivity
Lower CI %
Upper CI %
Median Prevalence
10-2006 250 12 4.80 2.57 7.03 4.80 11-2007 250 12 4.80 2.58 7.02
12-2008 248 9 3.63 1.67 5.59 Total 748 33 4.41 3.24 5.58 (Started since 2006)
Table 29.3
MSM Centre, Manas Bangla, Hooghly
Round & Year
No. of Cases Tested
No of +ve cases
% Seropositivity
Lower CI %
Upper CI %
Median Prevalence
11-2007 248 14 5.65 3.23 8.06 12-2008 250 10 4.00 1.96 6.04
Total 498 24 4.82 3.32 6.32 (Started since 2007)
Table 29.4
MSM Centre, Manas Bangla, Burdwan
Round & Year
No. of Cases Tested
No of +ve cases
% Seropositivity
Lower CI %
Upper CI %
Median Prevalence
12-2008 250 8 3.20 1.36 5.04 Total 250 8 3.20 1.36 5.04 (New Site)
Sentinel Surveillance in West Bengal: 2008
54
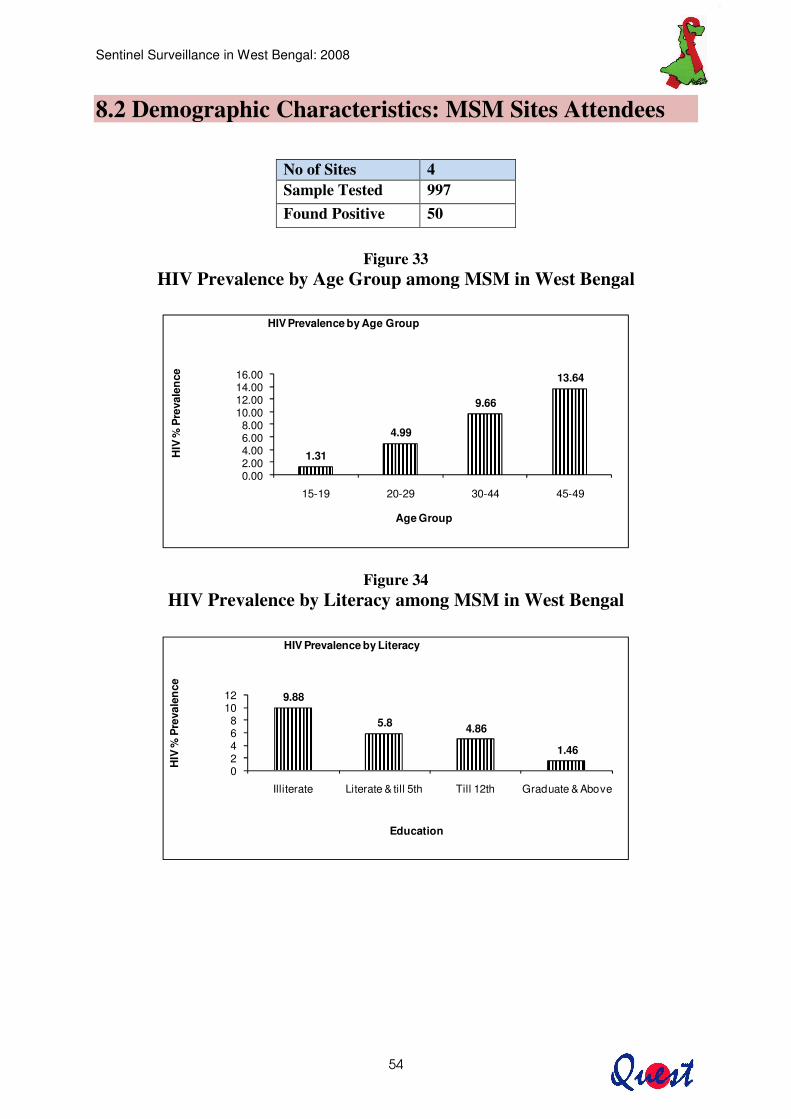
8.2 Demographic Characteristics: MSM Sites Attendees
No of Sites 4 Sample Tested 997 Found Positive 50
Figure 33
HIV Prevalence by Age Group among MSM in West Bengal �
�
Figure 34 HIV Prevalence by Literacy among MSM in West Bengal
1.31
4.99
9.66
13.64
0.002.004.006.008.00
10.0012.0014.0016.00
15-19 20-29 30-44 45-49
HIV
% P
reva
len
ce
Age Group
HIV Prevalence by Age Group
9.88
5.8 4.86
1.46
02468
1012
Illiterate Literate & till 5th Till 12th Graduate & Above
HIV
% P
reva
len
ce
Education
HIV Prevalence by Literacy
Sentinel Surveillance in West Bengal: 2008
55
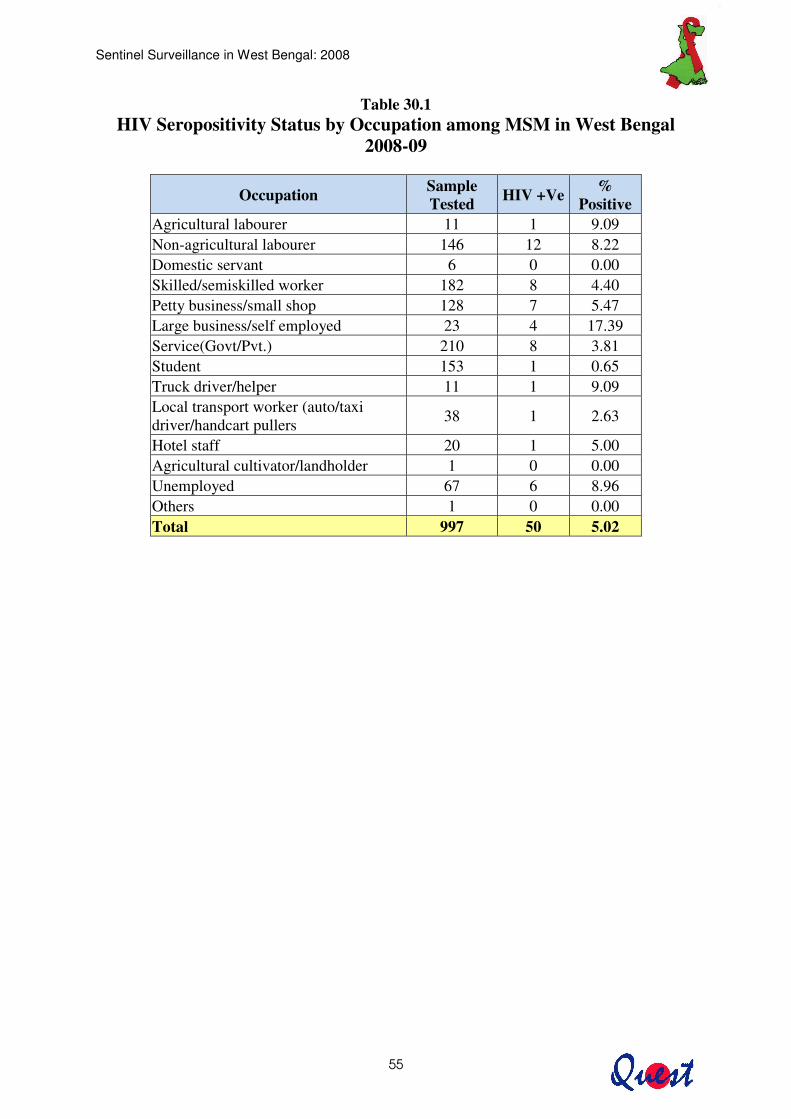
Table 30.1 HIV Seropositivity Status by Occupation among MSM in West Bengal
2008-09
Occupation Sample Tested HIV +Ve %
Positive Agricultural labourer 11 1 9.09 Non-agricultural labourer 146 12 8.22 Domestic servant 6 0 0.00 Skilled/semiskilled worker 182 8 4.40 Petty business/small shop 128 7 5.47 Large business/self employed 23 4 17.39 Service(Govt/Pvt.) 210 8 3.81 Student 153 1 0.65 Truck driver/helper 11 1 9.09 Local transport worker (auto/taxi driver/handcart pullers 38 1 2.63
Hotel staff 20 1 5.00 Agricultural cultivator/landholder 1 0 0.00 Unemployed 67 6 8.96 Others 1 0 0.00 Total 997 50 5.02
Sentinel Surveillance in West Bengal: 2008
56
9 Status of Truckers Sites
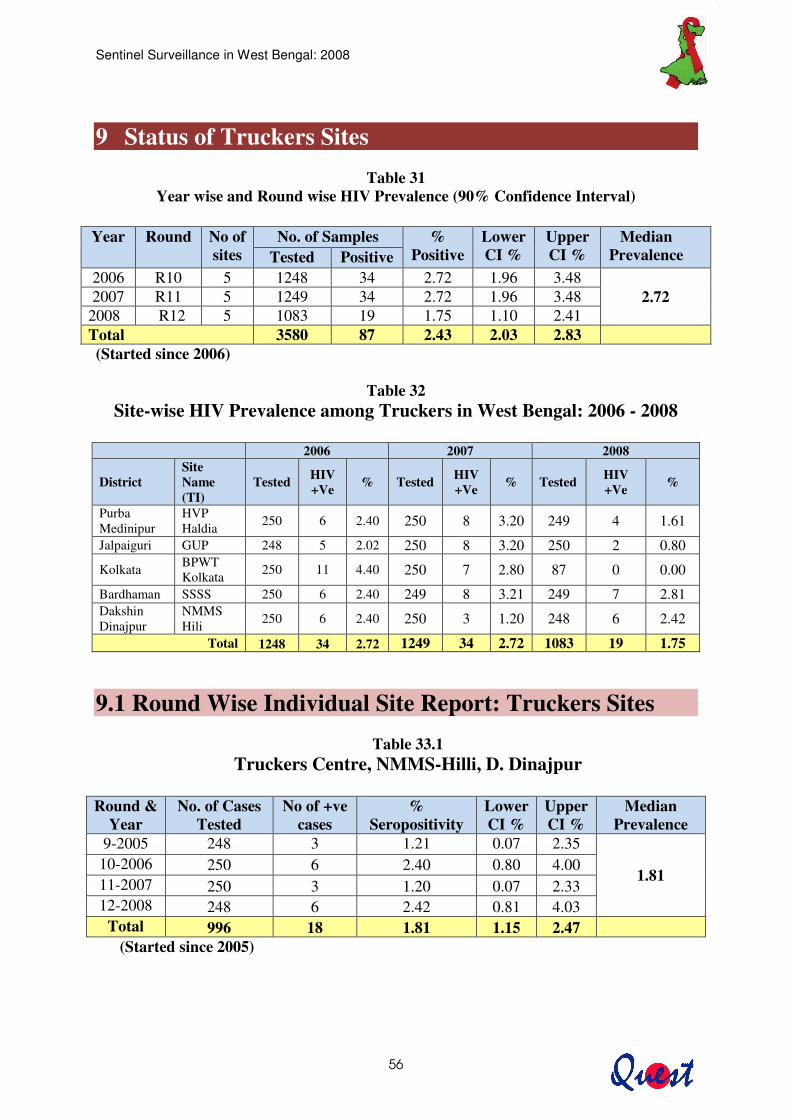
Table 31 Year wise and Round wise HIV Prevalence (90% Confidence Interval)
Year Round No of
sites No. of Samples %
Positive Lower CI %
Upper CI %
Median Prevalence Tested Positive
2006 R10 5 1248 34 2.72 1.96 3.48 2.72 2007 R11 5 1249 34 2.72 1.96 3.48
2008 R12 5 1083 19 1.75 1.10 2.41 Total 3580 87 2.43 2.03 2.83 (Started since 2006)
Table 32 Site-wise HIV Prevalence among Truckers in West Bengal: 2006 - 2008
2006 2007 2008
District Site Name (TI)
Tested HIV +Ve % Tested HIV
+Ve % Tested HIV +Ve %
Purba Medinipur
HVP Haldia 250 6 2.40 250 8 3.20 249 4 1.61
Jalpaiguri GUP 248 5 2.02 250 8 3.20 250 2 0.80
Kolkata BPWT Kolkata 250 11 4.40 250 7 2.80 87 0 0.00
Bardhaman SSSS 250 6 2.40 249 8 3.21 249 7 2.81 Dakshin Dinajpur
NMMS Hili 250 6 2.40 250 3 1.20 248 6 2.42
Total 1248 34 2.72 1249 34 2.72 1083 19 1.75
9.1 Round Wise Individual Site Report: Truckers Sites
Table 33.1 Truckers Centre, NMMS-Hilli, D. Dinajpur
Round &
Year No. of Cases
Tested No of +ve
cases %
Seropositivity Lower CI %
Upper CI %
Median Prevalence
9-2005 248 3 1.21 0.07 2.35
1.81 10-2006 250 6 2.40 0.80 4.00 11-2007 250 3 1.20 0.07 2.33 12-2008 248 6 2.42 0.81 4.03
Total 996 18 1.81 1.15 2.47 (Started since 2005)
Sentinel Surveillance in West Bengal: 2008
57
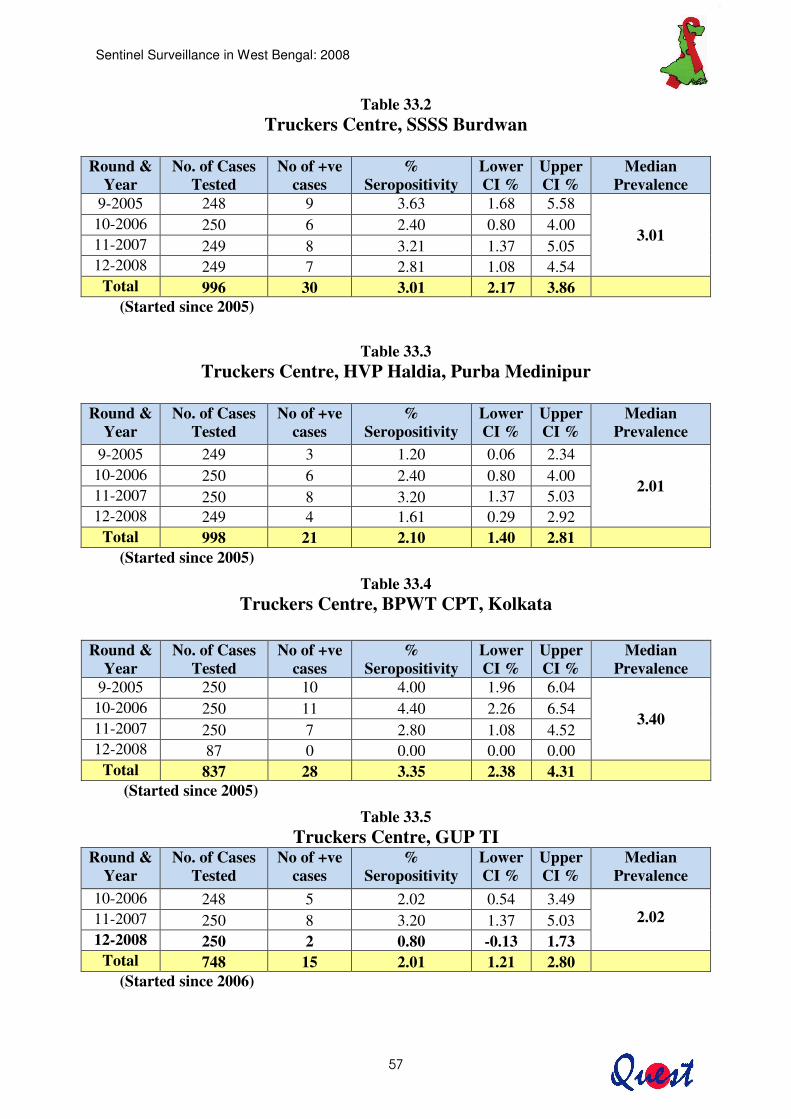
Table 33.2 Truckers Centre, SSSS Burdwan
Round &
Year No. of Cases
Tested No of +ve
cases %
Seropositivity Lower CI %
Upper CI %
Median Prevalence
9-2005 248 9 3.63 1.68 5.58
3.01 10-2006 250 6 2.40 0.80 4.00 11-2007 249 8 3.21 1.37 5.05 12-2008 249 7 2.81 1.08 4.54
Total 996 30 3.01 2.17 3.86 (Started since 2005)
Table 33.3
Truckers Centre, HVP Haldia, Purba Medinipur
Round & Year
No. of Cases Tested
No of +ve cases
% Seropositivity
Lower CI %
Upper CI %
Median Prevalence
9-2005 249 3 1.20 0.06 2.34
2.01 10-2006 250 6 2.40 0.80 4.00 11-2007 250 8 3.20 1.37 5.03 12-2008 249 4 1.61 0.29 2.92
Total 998 21 2.10 1.40 2.81 (Started since 2005)
Table 33.4 Truckers Centre, BPWT CPT, Kolkata
(Started since 2005)
Table 33.5 Truckers Centre, GUP TI
Round & Year
No. of Cases Tested
No of +ve cases
% Seropositivity
Lower CI %
Upper CI %
Median Prevalence
10-2006 248 5 2.02 0.54 3.49 2.02 11-2007 250 8 3.20 1.37 5.03
12-2008 250 2 0.80 -0.13 1.73 Total 748 15 2.01 1.21 2.80
(Started since 2006)
Round & Year
No. of Cases Tested
No of +ve cases
% Seropositivity
Lower CI %
Upper CI %
Median Prevalence
9-2005 250 10 4.00 1.96 6.04
3.40 10-2006 250 11 4.40 2.26 6.54 11-2007 250 7 2.80 1.08 4.52 12-2008 87 0 0.00 0.00 0.00
Total 837 28 3.35 2.38 4.31
Sentinel Surveillance in West Bengal: 2008
58
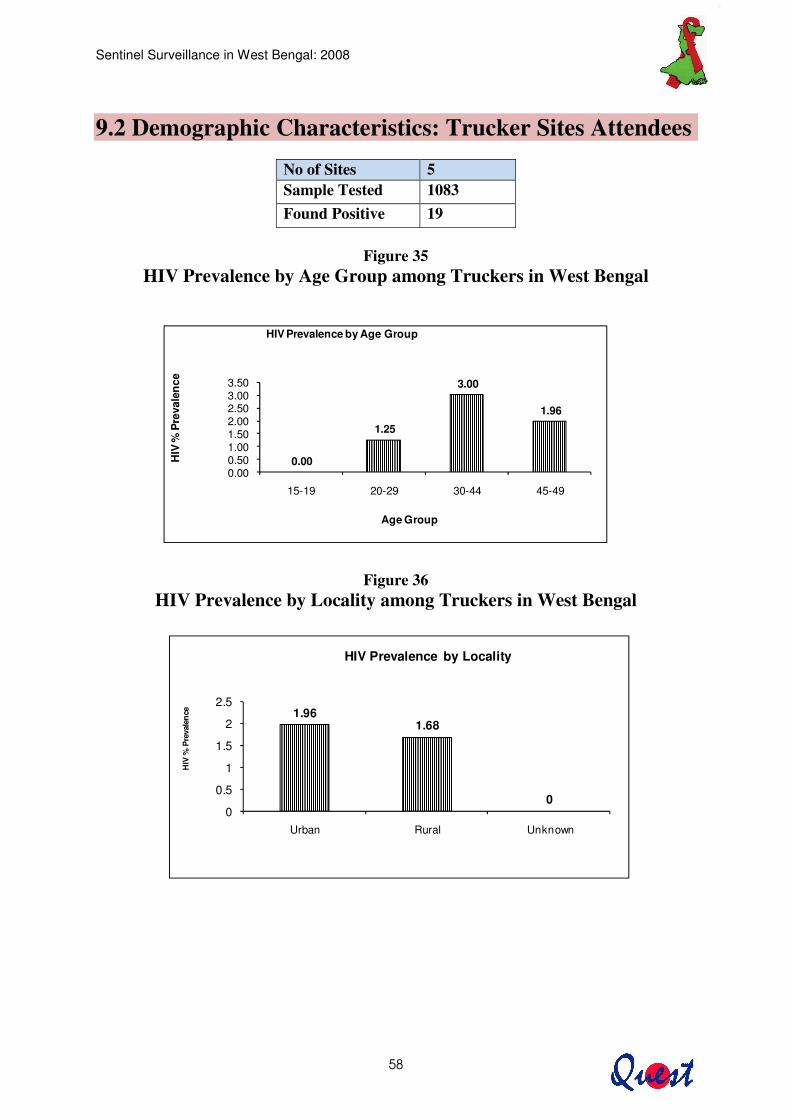
9.2 Demographic Characteristics: Trucker Sites Attendees
No of Sites 5 Sample Tested 1083 Found Positive 19
Figure 35
HIV Prevalence by Age Group among Truckers in West Bengal
Figure 36
HIV Prevalence by Locality among Truckers in West Bengal
0.00
1.25
3.00
1.96
0.000.501.001.502.002.503.003.50
15-19 20-29 30-44 45-49
HIV
% P
reva
len
ce
Age Group
HIV Prevalence by Age Group
1.961.68
00
0.5
1
1.5
2
2.5
Urban Rural Unknown
HIV
% P
reva
len
ce
HIV Prevalence by Locality
Sentinel Surveillance in West Bengal: 2008
59
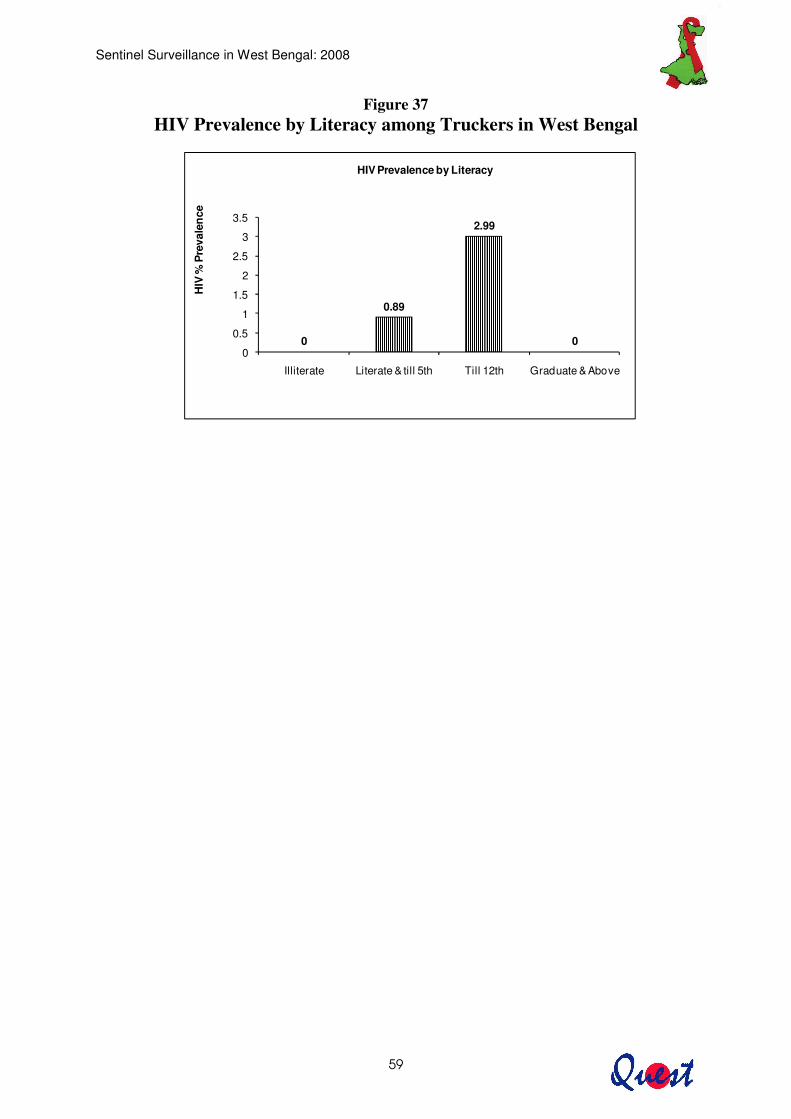
Figure 37 HIV Prevalence by Literacy among Truckers in West Bengal
0
0.89
2.99
00
0.5
1
1.5
2
2.5
3
3.5
Illiterate Literate & till 5th Till 12th Graduate & Above
HIV
% P
reva
len
ce
HIV Prevalence by Literacy
Sentinel Surveillance in West Bengal: 2008
60
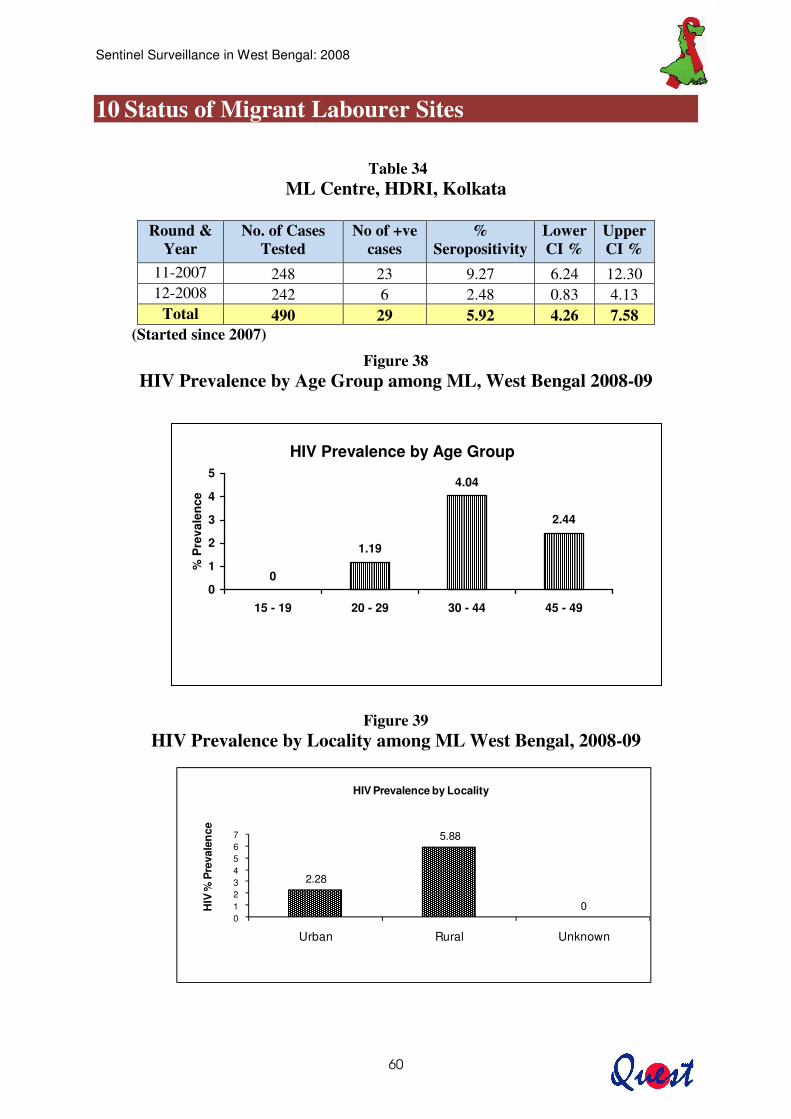
10 Status of Migrant Labourer Sites
Table 34
ML Centre, HDRI, Kolkata
Round & Year
No. of Cases Tested
No of +ve cases
% Seropositivity
Lower CI %
Upper CI %
11-2007 248 23 9.27 6.24 12.30 12-2008 242 6 2.48 0.83 4.13
Total 490 29 5.92 4.26 7.58 (Started since 2007)
Figure 38 HIV Prevalence by Age Group among ML, West Bengal 2008-09
Figure 39 HIV Prevalence by Locality among ML West Bengal, 2008-09
2.28
5.88
001234567
Urban Rural Unknown
HIV
% P
reva
len
ce
HIV Prevalence by Locality
HIV Prevalence by Age Group
0
1.19
4.04
2.44
0
1
2
3
4
5
15 - 19 20 - 29 30 - 44 45 - 49
% P
reva
lenc
e

Sentinel Surveillance in West Bengal: 2008
61
Figure 40 HIV Prevalence by Literacy Group among ML West Bengal, 2008-09
Table 35 HIV Sero-positive Status by Occupation (Self) among ML, West Bengal
Occupation Sample Tested HIV +ve % Positive
Non-agricultural labourer 184 4 2.17 Domestic servant 2 0 0.00 Petty business/small shop 30 1 3.33 Service (Govt/Pvt.) 9 0 0.00 Truck driver/helper 1 0 0.00 Local transport worker (auto/taxi driver/handcart pullers 13 1 7.69
Hotel staff 1 0 0.00 Others 2 0 0.00 Total 242 6 2.48
3.13 1.90 0.00 0
50.00
0
20
40
60
Illiterate Literate & till 5th Till 12th Graduate & above
Unknown
HIV
% P
reva
len
ce
HIV Prevalence by Literacy
Sentinel Surveillance in West Bengal: 2008
62
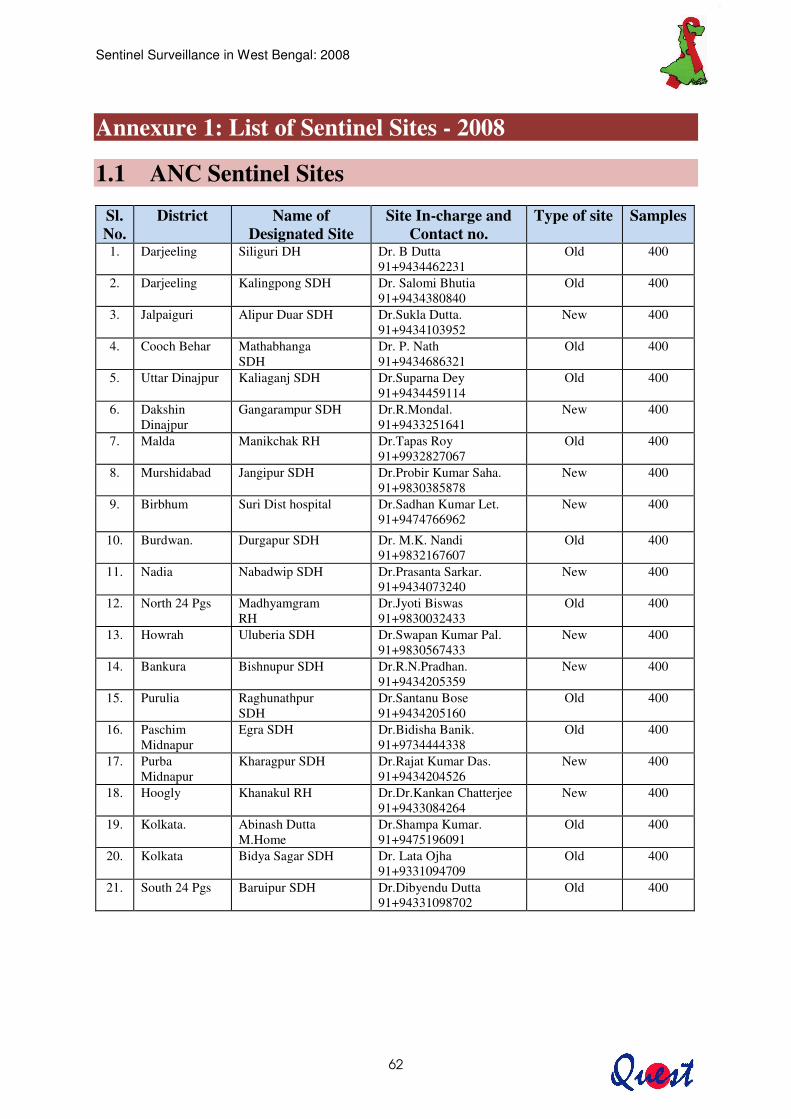
Annexure 1: List of Sentinel Sites - 2008
1.1 ANC Sentinel Sites
Sl. No.
District Name of Designated Site
Site In-charge and Contact no.
Type of site
Samples
1. Darjeeling Siliguri DH
Dr. B Dutta 91+9434462231
Old 400
2. Darjeeling Kalingpong SDH Dr. Salomi Bhutia 91+9434380840
Old 400
3. Jalpaiguri Alipur Duar SDH Dr.Sukla Dutta. 91+9434103952
New 400
4. Cooch Behar Mathabhanga SDH
Dr. P. Nath 91+9434686321
Old 400
5. Uttar Dinajpur Kaliaganj SDH Dr.Suparna Dey 91+9434459114
Old 400
6. Dakshin Dinajpur
Gangarampur SDH Dr.R.Mondal. 91+9433251641
New 400
7. Malda Manikchak RH Dr.Tapas Roy 91+9932827067
Old 400
8. Murshidabad Jangipur SDH
Dr.Probir Kumar Saha. 91+9830385878
New 400
9. Birbhum Suri Dist hospital Dr.Sadhan Kumar Let. 91+9474766962
New 400
10. Burdwan. Durgapur SDH Dr. M.K. Nandi 91+9832167607
Old 400
11. Nadia Nabadwip SDH Dr.Prasanta Sarkar. 91+9434073240
New 400
12. North 24 Pgs Madhyamgram RH
Dr.Jyoti Biswas 91+9830032433
Old 400
13. Howrah Uluberia SDH
Dr.Swapan Kumar Pal. 91+9830567433
New 400
14. Bankura Bishnupur SDH Dr.R.N.Pradhan. 91+9434205359
New 400
15. Purulia Raghunathpur SDH
Dr.Santanu Bose 91+9434205160
Old 400
16. Paschim Midnapur
Egra SDH Dr.Bidisha Banik. 91+9734444338
Old 400
17. Purba Midnapur
Kharagpur SDH Dr.Rajat Kumar Das. 91+9434204526
New 400
18. Hoogly Khanakul RH
Dr.Dr.Kankan Chatterjee 91+9433084264
New 400
19. Kolkata. Abinash Dutta M.Home
Dr.Shampa Kumar. 91+9475196091
Old 400
20. Kolkata Bidya Sagar SDH Dr. Lata Ojha 91+9331094709
Old 400
21. South 24 Pgs Baruipur SDH Dr.Dibyendu Dutta 91+94331098702
Old 400
Sentinel Surveillance in West Bengal: 2008
63
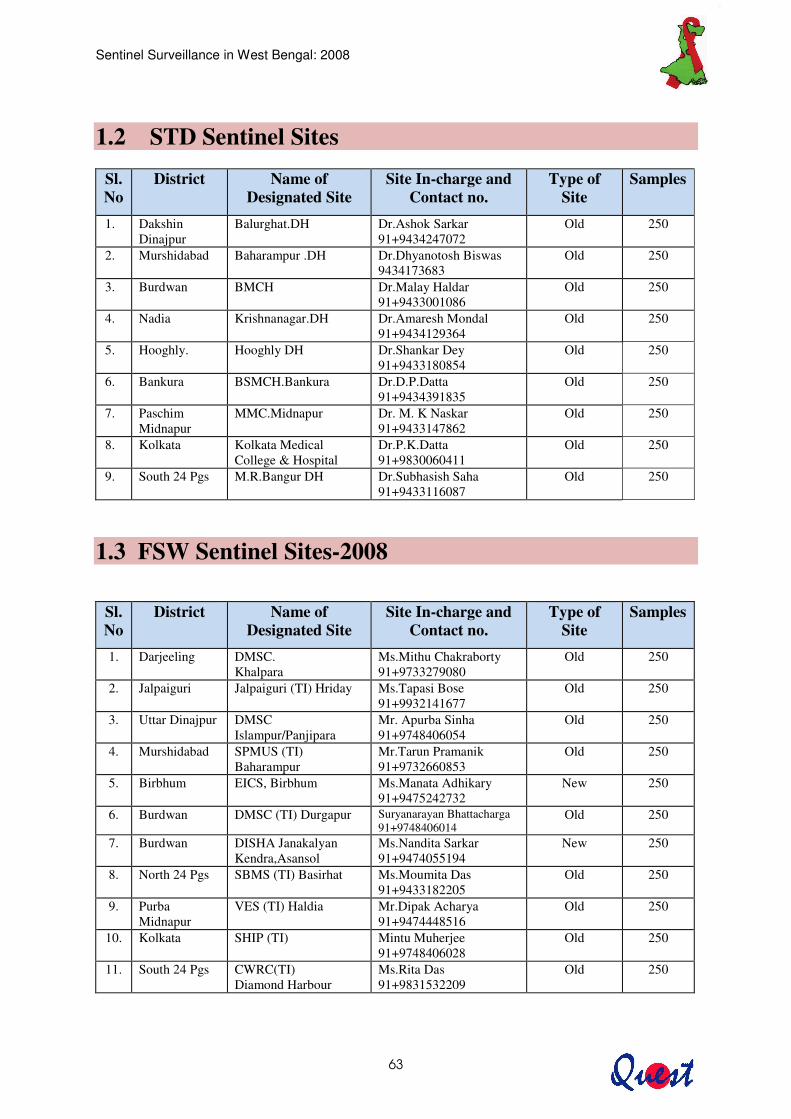
1.2 STD Sentinel Sites
Sl. No
District Name of Designated Site
Site In-charge and Contact no.
Type of Site
Samples
1. Dakshin Dinajpur
Balurghat.DH Dr.Ashok Sarkar 91+9434247072
Old 250
2. Murshidabad Baharampur .DH Dr.Dhyanotosh Biswas 9434173683
Old 250
3. Burdwan BMCH Dr.Malay Haldar 91+9433001086
Old 250
4. Nadia Krishnanagar.DH Dr.Amaresh Mondal 91+9434129364
Old 250
5. Hooghly. Hooghly DH Dr.Shankar Dey 91+9433180854
Old 250
6. Bankura BSMCH.Bankura Dr.D.P.Datta 91+9434391835
Old 250
7. Paschim Midnapur
MMC.Midnapur Dr. M. K Naskar 91+9433147862
Old 250
8. Kolkata Kolkata Medical College & Hospital
Dr.P.K.Datta 91+9830060411
Old 250
9. South 24 Pgs M.R.Bangur DH Dr.Subhasish Saha 91+9433116087
Old 250
1.3 FSW Sentinel Sites-2008
Sl. No
District Name of Designated Site
Site In-charge and Contact no.
Type of Site
Samples
1. Darjeeling DMSC. Khalpara
Ms.Mithu Chakraborty 91+9733279080
Old 250
2. Jalpaiguri Jalpaiguri (TI) Hriday Ms.Tapasi Bose 91+9932141677
Old 250
3. Uttar Dinajpur DMSC Islampur/Panjipara
Mr. Apurba Sinha 91+9748406054
Old 250
4. Murshidabad SPMUS (TI) Baharampur
Mr.Tarun Pramanik 91+9732660853
Old 250
5. Birbhum EICS, Birbhum
Ms.Manata Adhikary 91+9475242732
New 250
6. Burdwan DMSC (TI) Durgapur Suryanarayan Bhattacharga 91+9748406014
Old 250
7. Burdwan DISHA Janakalyan Kendra,Asansol
Ms.Nandita Sarkar 91+9474055194
New 250
8. North 24 Pgs SBMS (TI) Basirhat Ms.Moumita Das 91+9433182205
Old 250
9. Purba Midnapur
VES (TI) Haldia Mr.Dipak Acharya 91+9474448516
Old 250
10. Kolkata SHIP (TI) Mintu Muherjee 91+9748406028
Old 250
11. South 24 Pgs CWRC(TI) Diamond Harbour
Ms.Rita Das 91+9831532209
Old 250
Sentinel Surveillance in West Bengal: 2008
64
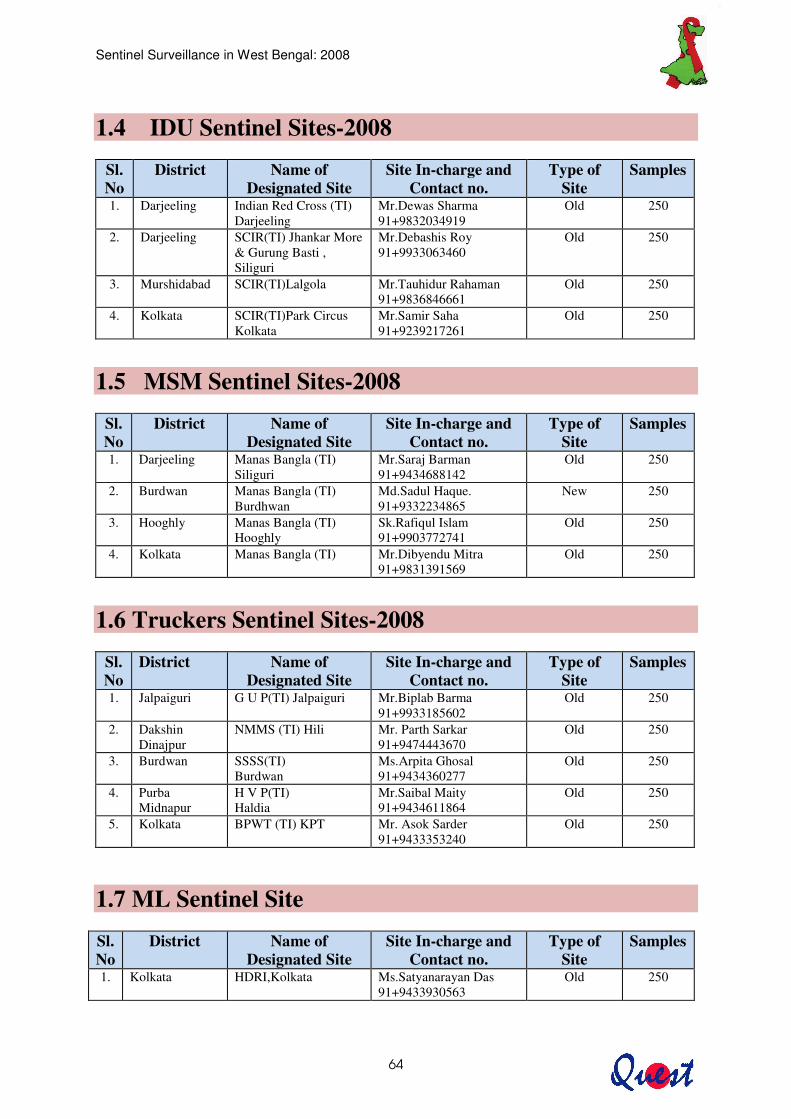
1.4 IDU Sentinel Sites-2008
Sl. No
District Name of Designated Site
Site In-charge and Contact no.
Type of Site
Samples
1. Darjeeling Indian Red Cross (TI) Darjeeling
Mr.Dewas Sharma 91+9832034919
Old 250
2. Darjeeling SCIR(TI) Jhankar More & Gurung Basti , Siliguri
Mr.Debashis Roy 91+9933063460
Old 250
3. Murshidabad SCIR(TI)Lalgola Mr.Tauhidur Rahaman 91+9836846661
Old 250
4. Kolkata SCIR(TI)Park Circus Kolkata
Mr.Samir Saha 91+9239217261
Old 250
1.5 MSM Sentinel Sites-2008
Sl. No
District Name of Designated Site
Site In-charge and Contact no.
Type of Site
Samples
1. Darjeeling Manas Bangla (TI) Siliguri
Mr.Saraj Barman 91+9434688142
Old 250
2. Burdwan Manas Bangla (TI) Burdhwan
Md.Sadul Haque. 91+9332234865
New 250
3. Hooghly Manas Bangla (TI) Hooghly
Sk.Rafiqul Islam 91+9903772741
Old 250
4. Kolkata Manas Bangla (TI) Mr.Dibyendu Mitra 91+9831391569
Old 250
1.6 Truckers Sentinel Sites-2008
Sl. No
District Name of Designated Site
Site In-charge and Contact no.
Type of Site
Samples
1. Jalpaiguri
G U P(TI) Jalpaiguri Mr.Biplab Barma 91+9933185602
Old 250
2. Dakshin Dinajpur
NMMS (TI) Hili Mr. Parth Sarkar 91+9474443670
Old 250
3. Burdwan SSSS(TI) Burdwan
Ms.Arpita Ghosal 91+9434360277
Old 250
4. Purba Midnapur
H V P(TI) Haldia
Mr.Saibal Maity 91+9434611864
Old 250
5. Kolkata BPWT (TI) KPT Mr. Asok Sarder 91+9433353240
Old 250
1.7 ML Sentinel Site Sl. No
District Name of Designated Site
Site In-charge and Contact no.
Type of Site
Samples
1. Kolkata HDRI,Kolkata Ms.Satyanarayan Das 91+9433930563
Old 250
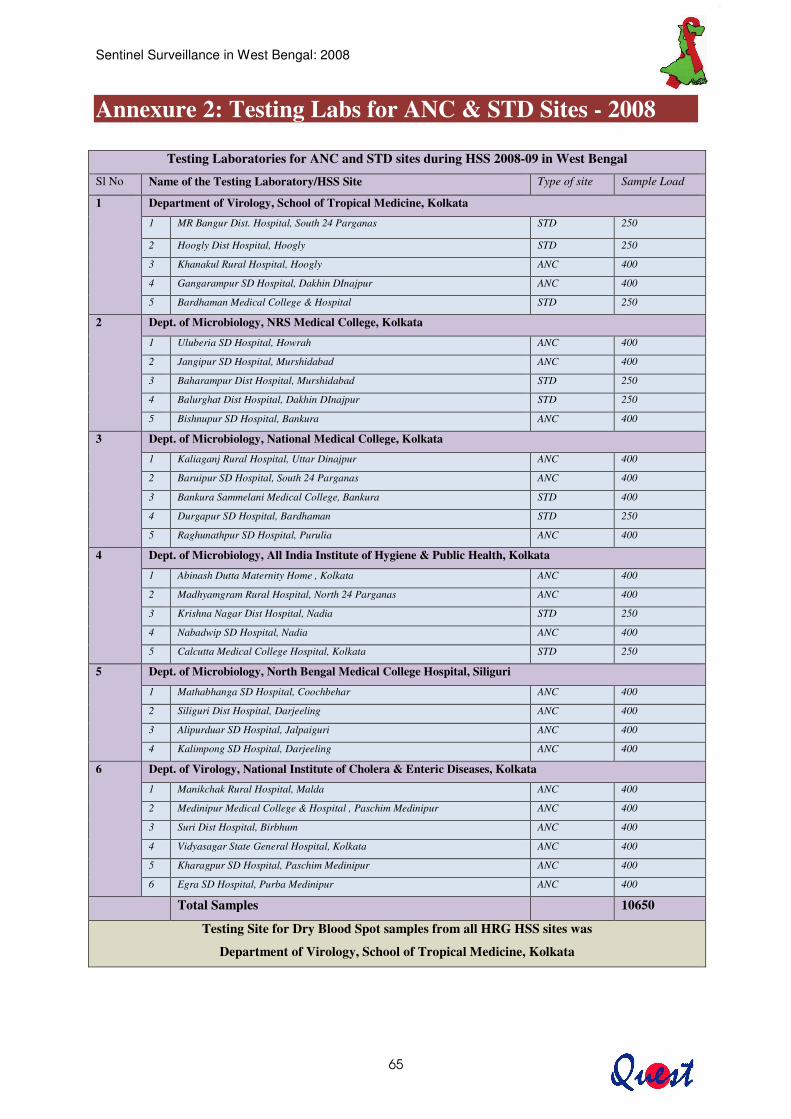
Sentinel Surveillance in West Bengal: 2008
65
Annexure 2: Testing Labs for ANC & STD Sites - 2008
Testing Laboratories for ANC and STD sites during HSS 2008-09 in West Bengal
Sl No Name of the Testing Laboratory/HSS Site Type of site Sample Load
1 Department of Virology, School of Tropical Medicine, Kolkata
1 MR Bangur Dist. Hospital, South 24 Parganas STD 250
2 Hoogly Dist Hospital, Hoogly STD 250
3 Khanakul Rural Hospital, Hoogly ANC 400
4 Gangarampur SD Hospital, Dakhin DInajpur ANC 400
5 Bardhaman Medical College & Hospital STD 250
2 Dept. of Microbiology, NRS Medical College, Kolkata
1 Uluberia SD Hospital, Howrah ANC 400
2 Jangipur SD Hospital, Murshidabad ANC 400
3 Baharampur Dist Hospital, Murshidabad STD 250
4 Balurghat Dist Hospital, Dakhin DInajpur STD 250
5 Bishnupur SD Hospital, Bankura ANC 400
3 Dept. of Microbiology, National Medical College, Kolkata
1 Kaliaganj Rural Hospital, Uttar Dinajpur ANC 400
2 Baruipur SD Hospital, South 24 Parganas ANC 400
3 Bankura Sammelani Medical College, Bankura STD 400
4 Durgapur SD Hospital, Bardhaman STD 250
5 Raghunathpur SD Hospital, Purulia ANC 400
4 Dept. of Microbiology, All India Institute of Hygiene & Public Health, Kolkata
1 Abinash Dutta Maternity Home , Kolkata ANC 400
2 Madhyamgram Rural Hospital, North 24 Parganas ANC 400
3 Krishna Nagar Dist Hospital, Nadia STD 250
4 Nabadwip SD Hospital, Nadia ANC 400
5 Calcutta Medical College Hospital, Kolkata STD 250
5 Dept. of Microbiology, North Bengal Medical College Hospital, Siliguri
1 Mathabhanga SD Hospital, Coochbehar ANC 400
2 Siliguri Dist Hospital, Darjeeling ANC 400
3 Alipurduar SD Hospital, Jalpaiguri ANC 400
4 Kalimpong SD Hospital, Darjeeling ANC 400
6 Dept. of Virology, National Institute of Cholera & Enteric Diseases, Kolkata
1 Manikchak Rural Hospital, Malda ANC 400
2 Medinipur Medical College & Hospital , Paschim Medinipur ANC 400
3 Suri Dist Hospital, Birbhum ANC 400
4 Vidyasagar State General Hospital, Kolkata ANC 400
5 Kharagpur SD Hospital, Paschim Medinipur ANC 400
6 Egra SD Hospital, Purba Medinipur ANC 400
Total Samples 10650
Testing Site for Dry Blood Spot samples from all HRG HSS sites was
Department of Virology, School of Tropical Medicine, Kolkata
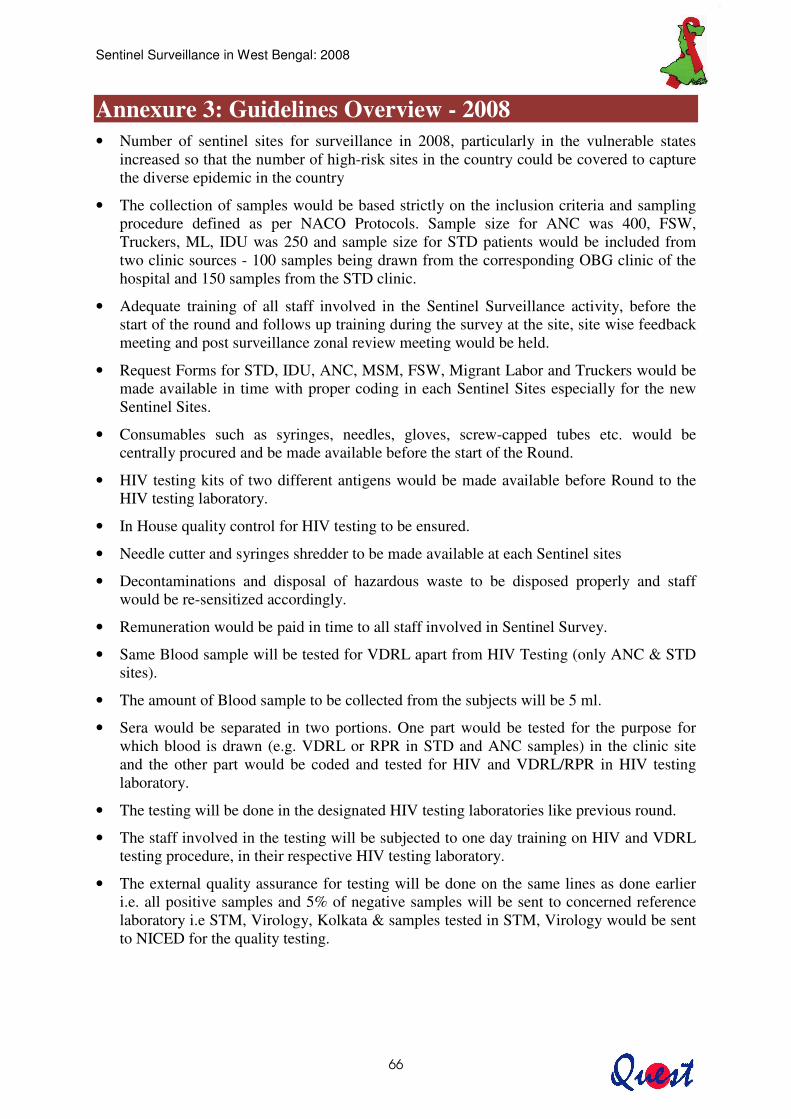
Sentinel Surveillance in West Bengal: 2008
66
Annexure 3: Guidelines Overview - 2008 • Number of sentinel sites for surveillance in 2008, particularly in the vulnerable states
increased so that the number of high-risk sites in the country could be covered to capture the diverse epidemic in the country
• The collection of samples would be based strictly on the inclusion criteria and sampling procedure defined as per NACO Protocols. Sample size for ANC was 400, FSW, Truckers, ML, IDU was 250 and sample size for STD patients would be included from two clinic sources - 100 samples being drawn from the corresponding OBG clinic of the hospital and 150 samples from the STD clinic.
• Adequate training of all staff involved in the Sentinel Surveillance activity, before the start of the round and follows up training during the survey at the site, site wise feedback meeting and post surveillance zonal review meeting would be held.
• Request Forms for STD, IDU, ANC, MSM, FSW, Migrant Labor and Truckers would be made available in time with proper coding in each Sentinel Sites especially for the new Sentinel Sites.
• Consumables such as syringes, needles, gloves, screw-capped tubes etc. would be centrally procured and be made available before the start of the Round.
• HIV testing kits of two different antigens would be made available before Round to the HIV testing laboratory.
• In House quality control for HIV testing to be ensured.
• Needle cutter and syringes shredder to be made available at each Sentinel sites
• Decontaminations and disposal of hazardous waste to be disposed properly and staff would be re-sensitized accordingly.
• Remuneration would be paid in time to all staff involved in Sentinel Survey.
• Same Blood sample will be tested for VDRL apart from HIV Testing (only ANC & STD sites).
• The amount of Blood sample to be collected from the subjects will be 5 ml.
• Sera would be separated in two portions. One part would be tested for the purpose for which blood is drawn (e.g. VDRL or RPR in STD and ANC samples) in the clinic site and the other part would be coded and tested for HIV and VDRL/RPR in HIV testing laboratory.
• The testing will be done in the designated HIV testing laboratories like previous round.
• The staff involved in the testing will be subjected to one day training on HIV and VDRL testing procedure, in their respective HIV testing laboratory.
• The external quality assurance for testing will be done on the same lines as done earlier i.e. all positive samples and 5% of negative samples will be sent to concerned reference laboratory i.e STM, Virology, Kolkata & samples tested in STM, Virology would be sent to NICED for the quality testing.
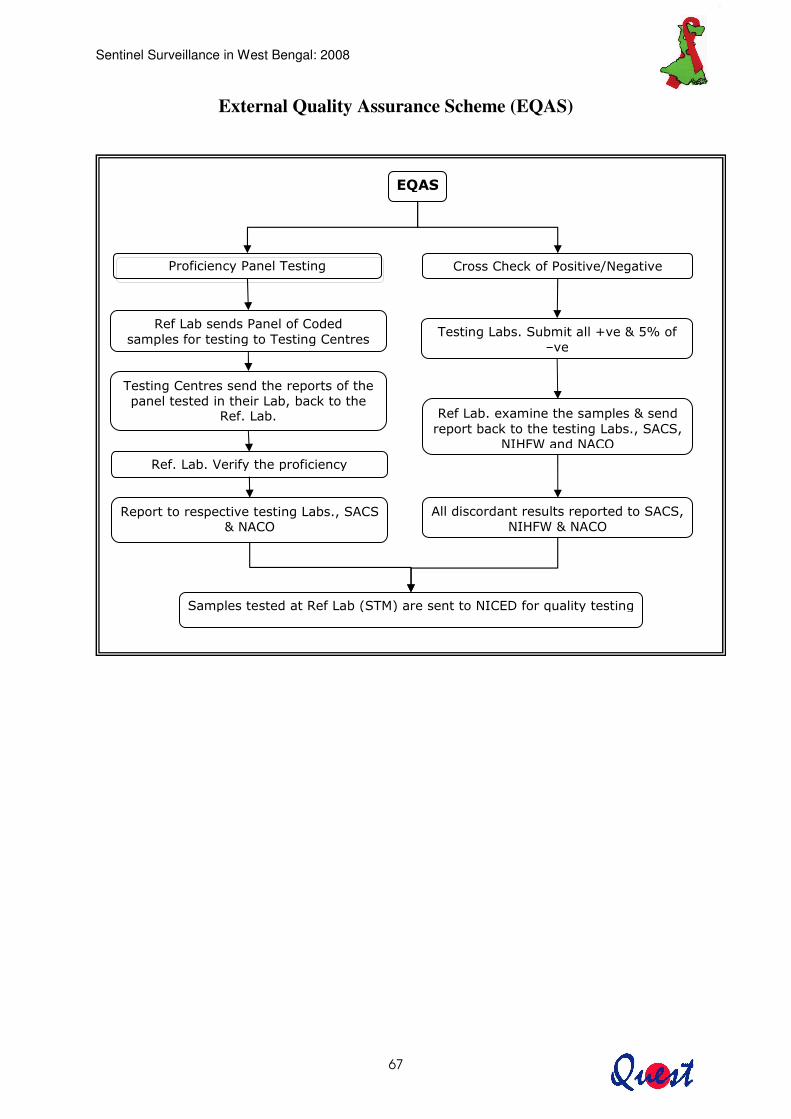
Sentinel Surveillance in West Bengal: 2008
67
External Quality Assurance Scheme (EQAS)
�����
��������������� ������ �����������������������������
�������
�����������������������
������������������� �������������
��������������������������������
���������������������������������������
������������ �������!��"#$��
%��
��������&���������������"����
�����������������������������'���
�()*+����'�,
��������-�����������������
��������������������������������'��"�'�,
'��������������� ��������������'���
�()*+"�'�,
���������������������.� /0����������(�12���3 �����������
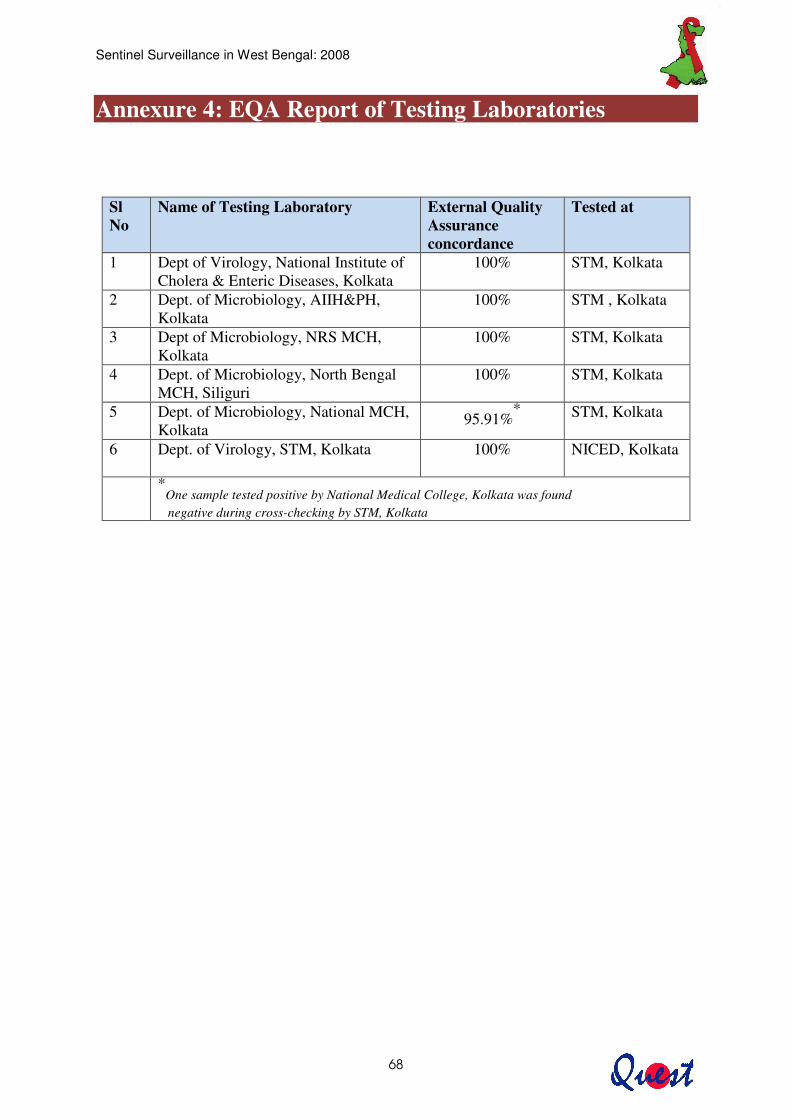
Sentinel Surveillance in West Bengal: 2008
68
Annexure 4: EQA Report of Testing Laboratories
Sl No
Name of Testing Laboratory External Quality Assurance concordance
Tested at
1 Dept of Virology, National Institute of Cholera & Enteric Diseases, Kolkata
100% STM, Kolkata
2 Dept. of Microbiology, AIIH&PH, Kolkata
100% STM , Kolkata
3 Dept of Microbiology, NRS MCH, Kolkata
100% STM, Kolkata
4 Dept. of Microbiology, North Bengal MCH, Siliguri
100% STM, Kolkata
5 Dept. of Microbiology, National MCH, Kolkata
95.91%* STM, Kolkata
6 Dept. of Virology, STM, Kolkata 100% NICED, Kolkata
*One sample tested positive by National Medical College, Kolkata was found
negative during cross-checking by STM, Kolkata