west kill project report - catskill...
TRANSCRIPT

PROJECT REPORT Westkill Stream Restoration Demonstration Project
Greene County & Water Conservation District December 2005

1
Table of Contents
1.0 Project Description 2.0 Problem Assessment 3.0 Restoration Strategy 4.0 Restoration Design
4.1 Drainage area 4.2 Bankfull Discharge
Calculations 4.3 Bankfull Dimensions 4.4 Stream Planform 4.5 Entrainment
Computations 4.6 Design Channel
Dimensions 4.6.1 Mean Depth 4.6.2 Cross-sectional
Area 4.6.3 Reference
Reach 5.0 Flood Analysis 6.0 Summary of Final Design
Features 6.1 Cut/Fill volumes 6.2 Rock volumes 6.3 Vegetation plantings
7.0 Project Specifications 8.0 Project Estimates 9.0 Project Implementation
9.1 Installation Procedure 9.2 Construction Schedule
10.0 Current Status 10.1 Earthwork 10.2 Rock Structures 10.3 Vegetation 10.4 Costs 10.5 Monitoring
11.0 Summary
1 1 2 3 3 3
3 4 4
4
4 4
5
6 6
7 7 7 8 8 8 8 9
10 10 10 10 11 11 11

1
1.0 Project Description The project as set forth in this design document involves the stabilization of a +3,086 linear foot stream reach on the West Kill stream. The project starts approximately 511 feet downstream of the Shoemaker Road Bridge, and continues upstream for a distance of 2575 linear feet. It is located along county Route 6 in the Town of Lexington, County of Greene, State of New York. 2.0 Problem Assessment The West Kill stream in the project reach was experiencing significant degradation as the result of flood events in 1987, 1996 and 1999. In the 1996 flood event, high flows stripped the streambed of its protective armor, exposing deposits of lacusterine clays and causing rapid incisement (down cutting) of the stream reach. As a result of this incisement, the stream became extremely entrenched, and the adjoining slope experienced a geo-technical failure that damaged a nearby county road (CRT 6) and resulted in the loss of a county bridge. While the GCSWCD did not install monitoring cross sections in the reach, repeated visits to the site during development of the project resulted in observations that the channel had downcut as much as six (6) feet in depth or more in less than two years. In addition, down cutting of the channel under the Shoemaker Road Bridge also resulted in a bank failure that resulted in the abutment dropping approximately four feet making the bridge impassable.
Figure 1: Extensive clay exposures due to channel down cutting presented a significant water quality impact, as well as extensive infrastructure damage.
Figure 2: Coarse gravel/cobble materials seen on the right and left banks represent the channel invert elevation prior to downcutting Note the clay present in the current channel bottom

2
Due to extensive flood damage in Greene County from the 1996 event, repairs at the site were delayed until 1998. The initial mitigation solution was installed under the FEMA Public Assistance Program (PA) and included installation of concrete Sta-pods and riprap at the center of the project reach, as well as replacement of the Shoemaker Road Bridge. Less than one year after the repairs, a second flood associated with Hurricane Floyd in September 1999 resulted in failure of the FEMA funded PA projects when the stream continued to incise, and the slope again experienced a geo-technical failure. The Sta-pods rotated when the slope failed and the riprap slid down the slope. Additionally, the south abutment of Shoemaker Road bridge was substantially damaged due to further incisement of the stream system. The initial measures installed after the 1996 flood event did not address stream bottom stability. As a result of the 1999 event, FEMA PA Program funded additional stabilization of the previous work and the bridge. This work did address downcutting in a very localized area by using steel sheet piling grade control and the placement of heavy stone fill on the stream bottom. While the second repair effort appears to have addressed the downcutting in those localized areas, the incisement problem at the project site was still occurring, and if not mitigated would result in migration of the bank failure upstream and down stream, as well as failure of the previous work. Based on Greene County Soil and Water Conservation District’s (GCSWCD) monitoring of the site and observations of the stream’s morphological state, the following conclusions regarding the stability problem have been made.
1. This reach of the West Kill is experiencing significant incisement into the valley floor. The presence of deep clay layers and the loss of streambed armor has accelerated this process. Placement of heavy stone fill in the stream bottom in 2000 also has flattened the stream slope through the reach and the channel is trying to correct for this both downstream with additional incisement and upstream with deposition.
2. Incisement of the streambed has resulted in severe entrenchment of the
stream system and accelerated velocities through the project reach. These conditions make it highly improbable that the stream will reach a stable state in the foreseeable future without assistance.
3. Incisement of the streambed is causing additional failure on the adjoining
slopes. Down-cutting has continued to destabilize the base of these slopes, resulting in geo-technical failures.
4. At two locations within the project reach, meander adjustments have
resulted in a shorter (tighter) radius of curvature. These meander adjustments are being transferred downstream, with increased shear

3
stresses against two locations along CRT 6. In both cases, these meander adjustments are placing stress on the opposite bank immediately upstream of the protective riprap placed under the PA program. In the next flood event, the meander adjustments will place extreme stress upstream of the riprap and will most likely result in failure of the riprap.
5. Exposure of clay deposits in the streambed has resulted in a severe
water quality problem. The GCSWCD has been monitoring high turbidity levels from exposures at these sites.
6. Stabilization measures implemented after the 1999 flood event have
resulted in a significant fisheries migration barrier. Under base flow conditions, the West Kill has been running subterranean for over 400 feet.
3.0 Restoration Strategy Based on observations of the stream system, history of the reach and measurements of the stream channel morphology, Kaaterskill Engineering Associates (KEA) and GCSWCD selected a stream restoration strategy, which should provide a stable stream form and restore stream function. The selected mitigation measures will address the stability of the streambed, establish a stable planform and create a working two-stage channel with a bankfull channel and an adjoining floodplain area. Based on valley slope and available belt-width, the GCSWCD selected a B3C (Rosgen Classification System) stream type for restoration. The following strategy was selected for the stream design;
1. Develop a stable planform; with acceptable meander curvature to eliminate on-going adjustments in the streams plan form.
2. Construct a stream channel with a stable profile. Develop an acceptable
slope for valley conditions and utilize in-stream rock structures (Cross Vanes) to provide grade control.
3. Construct a channel cross-section, which provides for a properly
functioning bankfull channel, as well as maximizes the benefit of an adjoining floodplain. Construct a bankfull channel appropriately sized to carry the streams bedload supply without aggrading or incising.
4. Provide for long-term stabilization of the stream banks by the construction
of Rock Vanes to reduce shear stress, and by extensive plantings of riparian vegetation.

4
4.0 Restoration Design Many parameters must be considered and calculated for a stream restoration project to be successful. These include watershed wide variables such as drainage area, and reach wide variables such as discharge, channel dimensions, and stream planform. Many of the reach wide variables are based on field measurements taken at a stable section of stream known as a reference reach. Further consideration also must be given to the sediment transport ability of the restored stream. Please refer to Appendix A to review a summary of the design calculations for the design stream channel. GCSWCD and KEA staff completed the stream design.
4.1 Drainage Area (NYCDEP DEM) Drainage area at the project site ranges from 15.6 mi2, at the upper limits of the project reach, to 16.8 mi2, at the lower limits of the project reach. Channel geometry was developed based upon calculations that vary relative to increasing drainage area.
4.2 Bank Full Discharge Calculations Determination of the discharge (stream flow) associated with the bankfull channel is critical to the restoration design. Discharge is a critical function in stream systems, and is used in important calculations during the design process. To determine the correct bankfull discharge, the GCSWCD used several methods. 4.3 Bankfull Dimensions To determine the design dimensions for the bankfull channel, the GCSWCD again used a variety of resources as a cross check. Bankfull cross sectional area, bankfull width and bankfull depth were selected after reviewing all available data from established curves as well as reference reach measurements.
4.4 Stream Planform During the design process, the GCSWCD evaluated the planform of the stream channel. Typically this is addressed by reviewing the streams sinuosity as well as the radius of curvature of meanders within the project site. In this case, observations of meander radius were not practical due to previously installed constraints on the stream channel; therefore evaluations were limited to the stream’s sinuosity.
4.5 Entrainment Computations (Sediment Transport Validation) Determination of the channel’s competence to transport its bedload is critical to the development of stable channel geometry. Computing Critical Dimensionless Shear Stress (Jci) was the first step in the Entrainment Analysis that was performed for both the existing and proposed channel. Please refer to Appendix B for procedures and examples of entrainment computations.

5
4.6 Design Channel Dimensions
4.6.1 Mean Depth - The mean depth for the stream stabilization component of the Westkill phase II project was based on the entrainment computations and sediment transport validations detailed above.
4.6.2 Cross-Sectional Area - A channel cross sectional area was first developed from empirically derived regional curves for cross-sectional area as a function of drainage area. Using the mean depth and area, a bankfull width was calculated using the following equation
(Axs / dmean = Wbkf) Below is a summary table of the channel dimensions applied to the design of the Westkill Phase II Project reach.
Stream Type B3cDrainage Area 15.6 - 16.8Bankfull WidthZone 1 55 ftZone 2 59 ftZone 3 50 ftBankfull dmean P-P / Wbkf R-R / Wbkf
Zone 1 3.2 ft Jci = .026 8.14615763 4.358908907 upper
Zone 2 3.2 ft Jci = .026 5.067529344 4.28149659 mean
Zone 3 3.7 ft Jci = .026 1.988901059 4.204084274 lowerWidth / DepthZone 1 17.6Zone 2 18.6 Lengthpool /Wbkf Lengthriff /WbkfZone 3 13.6 3.025035143 5.121122487 upperBankfull Axs 1.840031219 3.227498125 meanZone 1 175 0.655027295 1.333873764 lowerZone 2 185Zone 3 185Bankfull Vmean 6.5 ft/sbankfull QZone 1 1140 ft3/sZone 2 1200 ft3/sZone 3 1200 ft3/sRatio Driff / dmean 1.31Ratio Dpool / dmean 2.01Entrenchment 1.7
Lengths
Spacing
Westkill Phase 2 - Stream StabilizationChannel Design Summary

6
4.6.3 Reference Reach - Stable channel dimensions were field collected from a reference reach exhibiting valley morphology, hydrography and channel morphology similar to that of the project reach. An ideal reference reach should exhibit a stable, desirable form capable of conveying its sediment and flow without significant aggradation, degradation, or lateral migration over time.
Channel dimensions including width, mean depth, maximum depths, feature spacing (i.e. pools, glides, riffles, runs), feature lengths and feature slopes were reduced into dimensionless ratios. The ratios are a function of bankfull width and mean values for depth and slope. Channel dimensions for the project reach were then back calculated from the dimensionless ratios using values for mean depth, bankfull width, and slope calculated for the project area.
5.0 Flood Analysis The GCSWCD and KEA did not complete a flood analysis due to: site similarities with another prospective project location where a full flood analysis was already completed and the prohibitive costs of performing another analysis. The following points are presented regarding the flood analysis;
• Due to extreme stream disturbances, it is not possible to compare the proposed work with the conditions which were present when the Flood Insurance Rate Maps (FIRM) were developed. The significant incisement of the streambed, as a result of the bank instability since the publication of the FIRM maps, has caused a general trend of dropping flood elevations which has resulted in the disconnectedness of the associated floodplain.
• Central to the design of the stream restoration components is the
creation of new floodplain area within the stream corridor. Cross sectional area will be increased and will result in a direct lowering of the current flood elevation.
• In the few isolated areas where the stream channel bottom is being
elevated during the restoration project, the final design channel will still be at a lower level than the channel as it existed prior to the appearance of the bank instability. The previous channel bottom’s elevation is based on observations of an existing floodplain.
• Additionally, no structures, public or private, are at a low elevation near
the stream. Residential and other structures as well as roads and

7
bridges sit high above the stream and will not be impacted by the restoration.
In summary, the GCSWCD proposes that the project will have essentially the same impact on flood elevations as the aforementioned prospective project and that another HEC-RAS analysis is not necessary.
6.0 Summary of Final Design Features
In addition to the information presented above on the design of the proposed channel dimensions, the following is a summary of the stream restoration component design;
6.1 Cut/Fill Volumes - On this component of the project, the design cross sections and proposed final grade lines indicate there will be + 6,500 yds3 of material to be removed from the project area. The materials will be disposed of at an upland location, contoured to an acceptable grade, and stabilized by seeding and mulching.
6.2 Rock Volumes- The stream restoration project will involve the
placement of heavy rock materials used to construct in-stream structures. The project will involve the construction of Cross Vanes which function to reduce shear stress in the near bank area, concentrate velocities in the center of the channel, provide grade control via a fixed grade sill and create plunge pools which reduce stream energy under flood conditions. Additionally, Rock Vanes will be used on the outside of all meander bends. Rock Vanes reduce shear stress in the near bank region (reducing erosional forces) and maintaining stream pool features.
6.3 Vegetation Plantings - Critical to the success of stream restoration projects is the establishment of an effective riparian buffer zone. On this project, a combination of dormant materials, conservation seed mixtures and plantings of trees and shrubs will be used to provide streambank stability. Native willow and dogwood species will be planted on the streambanks, with Brush Layering techniques used immediately below each rock structure arm, and single and double rows of Live Fascines used along the remaining streambank, floodprone bench areas and alongside each of the vane structures.
No woody vegetation is planted in the active point bar areas to prevent a reduction of the stream’s bedload transport capacity. All other areas of disturbance will be seeded and mulched using conservation seed

8
mix and hydro-seeding methods. Various species of woody shrubs and trees appropriate for the riparian zone shall be planted in the disturbed upland areas.
7.0 Project Specifications Under this project, the GCSWCD will be using stream restoration specifications developed by the GCSWCD. These specifications were a critical component of the final bid documents for this project. Please refer to the GCSWCD website at www.gcswcd.com/stream to review sample specifications. 8.0 Project Estimates The stream restoration cost was based on previous stream restoration projects of the same type completed in the past 3 years in the NYC Watershed area. Based on previous projects of a similar nature completed by the GCSWCD since 1989, it is estimated that the stream restoration component of the project will cost $175.00 per linear foot, or a total of $540,050. The cost per linear foot was increased to account for site conditions related to clay exposures. 9.0 Project Implementation 9.1 Installation Procedure - Dewatering and earthmoving equipment was mobilized to the site. The dewatering equipment consisted of two high density polypropylene 12” pipelines approximately 1,100 feet in length and two large electric pumps designed to pump up to 20 cfs. Stream flow was collected in a large sump hole and diverted through this pipeline to provide a dry working environment for restoration activities. The design channel was then established on the ground by traditional survey stakeout methods and grade stakes. Contractors then graded the existing topography to match the design grade with various types of earth moving equipment including excavators, bulldozers, and off-road articulated dump trucks. Once the initial grading was complete, the rock structures were installed. The structures’ edges were established by the stakeout team and the contractor dug large trenches that matched their dimensions. Large angular boulders were stacked in the trench until the design elevation and slope were met. After the installation of the rock structures, the contractor spread a topsoil and gravel mixture over the above bankfull channel to facilitate vegetative establishment and improve the bioengineering component of the restoration.

9
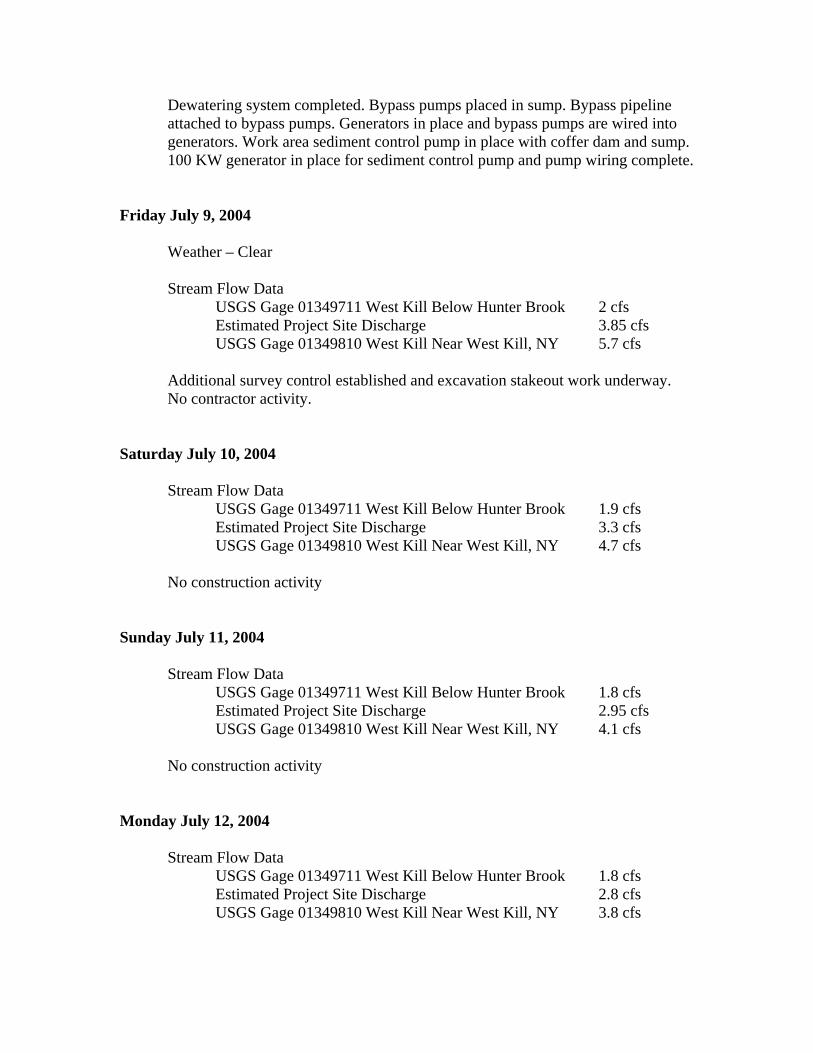
The topsoil mixture was salvaged from a large stockpile of excavated material with the use of a power screen. 9.2 Construction Schedule - Construction activities were initiated in the beginning of July 2003. While work progressed fairly smoothly through July of 2003, above average rainfall and an associated high stream flows overwhelmed the dewatering equipment for much of the construction season after the end of July. After repeated week or longer shutdowns due to the inability to either dewater the work area or handle sediment control , the project was closed down for the season in mid-September 2003. Similar problems were experienced during the summer of 2004, however approximately 75% of the project was completed. Figure 3 below shows a hydrograph for the West Kill that was typical of the 2003 and 2004 construction seasons. Please see Appendix D for a sample of the available documentation for the above average stream flow during the 2004 construction season. A late spring storm in 2005 caused excessive runoff and damaged a portion of the work completed during the 2004 construction season which added repair work on to the 2005 construction season’s schedule. Please see Appendix E for a description of the repair work.
Figure 3: Hydrograph from lower West Kill stream shows the impact of repeated stormevents in the watershed.

10
10.0 Current Status
10.1 Earthwork - As of September 2005, all earthmoving activity has been completed at this site. Actual cut/fill volumes did not substantially differ from the design cut/fill volumes. A total on 11,600 yards3 of clay were over excavated from the stream channel and stored at an upland location. This stockpile was graded and seeded to acceptable standards.
10.2 Rock structures - The total amount of large rock installed on the stream project totaled 7,222.82 tons. It was deemed necessary to add more rock than initially estimated to each rock structure to further stabilize them in the clay that exists below the design grade of the constructed channel and to construct larger keyways than originally designed. Keyways provide extra grade control across the floodplain during above bankfull flow and the constructed keyways may help the project retain its integrity following catastrophic flow events. An extra rock cross vane was also added to the project to provide extra grade control and mitigate near bank shear stress. A total of ten rock cross vanes and nine rock vanes were constructed on the project site.
10.3 Vegetation - Bioengineering has been installed over the majority of the project. This component of the project included planting willow fascines along the bankfull benches and inter-planting potted woody stock among the willow fascines and the existing upland vegetation. The bankfull benches along the top three meanders of the project remain to be vegetated and are expected to be completed in the early spring of 2006. This vegetation effort was accomplished by Greene County Soil and Water staff, NYC DEP staff and a large number of volunteers including: Americorps, Trout Unlimited, local landowners and others that were interested in natural channel design.
10.4 Costs - To date, a total of $657,065.57 has been paid to the project contractor for work performed. This number remains to be edited with further costs related to vegetation establishment and staff and equipment time.
10.5 Monitoring - An as built survey was performed to document the stream work and it will serve as a datum for future project monitoring. Twelve permanent cross-sections were also established and surveyed to current monitoring protocols to provide for continuity with future monitoring data that will be collected. The stream thalweg was sampled during the asbuilt survey and will serve as the asbuilt profile and as a datum for future thalweg measurements.

11
11.0 Summary The demonstration project implemented in the Westkill Valley near the Shoemaker Road Bridge has been completed. Some vegetation establishment work will continue during the early spring of 2006 and monitoring work will continue for an undetermined length of time. The project has withstood several bankfull flows since construction activity ceased in August and no substantial damage has been noted. As the vegetation establishes itself, this stream project should strengthen and provide further protection for county route 6 and the Shoemaker Road Bridge as well as improve overall water quality in the New York City Watershed.

Appendix Appendix A Design Calculations Appendix B Procedures and examples of entrainment computations Appendix C Photographs Appendix D Example documentation of above average stream flow during the
2004 construction Season Appendix E 2005 Damage Repair Work

Appendix A Summary of Design Calculations

Discharge calculations
1. From Bankfull Discharge vs. drainage Area curve in The Reference Reach Field Book using the Southeast Pennsylvania data (Rosgen 1998).
Drainage Area (15.6 mi2)⇒ Bankfull Q =550 cfs Drainage Area (16.8 mi2)⇒ Bankfull Q =575 cfs 2. From Provisional Regional curve Data for Hydrologic Region 4.
(provided by NYCDEP- May 1, 2001) Drainage Area (15.6 mi2)⇒ Bankfull Q =878 cfs Drainage Area (16.8 mi2)⇒ Bankfull Q =934 cfs 3. From Provisional Regional curve Data, Stratified by Mean Annual
Runoff (MAR> 2.3). (provided by NYCDEP- May 1, 2001) Drainage Area (15.6 mi2)⇒ Bankfull Q =1259 cfs Drainage Area (16.8 mi2)⇒ Bankfull Q =1320 cfs 4. From USGS (90-4197, Lumia) Full Regression Equation for 2
year storm event Drainage Area (15.6 mi2)⇒ Q2 = 998.24 cfs Drainage Area (16.8 mi2)⇒ Q2 = 1067.73 cfs
Performed flow calculation for a 2 year storm event using (USGS 90-4179, Lumia) full equation for hydrologic region 4
5. From USGS (90-4197, Lumia) Short Regression Equation for 2
year storm event Drainage Area (15.6 mi2)⇒ Q2 = 841.27 cfs Drainage Area (16.8 mi2)⇒ Q2 = 900.23 cfs
Performed flow calculation for a 2 year storm event using (USGS 90-4179, Lumia) drainage area only equation for hydrologic region 4

Channel dimensions
1. From Bankfull Channel Dimensions vs. Drainage Area in The Reference Reach Field Book using Eastern US curve (Rosgen 1998).
Bankfull Area Drainage Area (15.6 mi2)⇒ Abkf = 140 ft2
Drainage Area (16.8 mi2)⇒ Abkf = 155 ft2
Bankfull Width Drainage Area (15.6 mi2)⇒ Wbkf = 41 ft Drainage Area (16.8 mi2)⇒ Wbkf = 44 ft Bankfull Mean Depth
Drainage Area (15.6 mi2)⇒ dbkf = 3.5 ft Drainage Area (16.8 mi2)⇒ dbkf = 3.6 ft 2. From Bankfull Channel Dimensions vs. Drainage Area curve, Stratified by Mean Annual Runoff (MAR> 2.3), in Provisional Regional Curve Data. (provided by NYCDEP- May 1, 2001)
Bankfull Area Drainage Area (15.6 mi2)⇒ Abkf = 172.44 ft2
Drainage Area (16.8 mi2)⇒ Abkf = 182.16 ft2
Bankfull Width Drainage Area (15.6 mi2)⇒ Wbkf = 63.02 ft Drainage Area (16.8 mi2)⇒ Wbkf = 64.96 ft Bankfull Mean Depth
Drainage Area (15.6 mi2)⇒ dbkf = 2.67 ft Drainage Area (16.8 mi2)⇒ dbkf = 2.74 ft 3. From Bankfull Cross Sectional Area vs. Drainage Area curve, Stratified by Stream Type (B), in Provisional Regional curve Data. (provided by NYCDEP- May 1, 2001)
Bankfull Area Drainage Area (15.6 mi2)⇒ Abkf = 133.89 ft2
Drainage Area (16.8 mi2)⇒ Abkf = 142.90 ft2
Sinuosity Sinuosity = thalweg length / valley distance Sinuosity = 3073.51 / 2643.92 = 1.2

Appendix B: Procedures and examples of entrainment computations

Entrainment
1. Critical Dimensionless Shear Stress is determined through a function of the ratio between the pavement and sub-pavement materials. The following is the procedure for this analysis:
a. Collect and measure 4-5 of the largest particles resting on the lower third (tailout) of the point bar at an elevation half way between the point of maximum depth (thalweg) and bankfull. Calculate the average size (in feet) of the B-axis (median axis) of the particles collected.
b. Collect a sediment sample from the point bar in the same location by pushing a two gallon bottomless bucket into the bar. Remove the bar material within the bucket to a depth twice the average size of the largest particles found in step “a.” Process this sample through sieve analysis and determine the particle size distribution (i.e., D15, D35, D50, etc.) of the bar material by weight.
c. Conduct a Wolman Pebble Count (100 particles) and determine
the particle size distribution (i.e., D15, D35, D50, etc.) of the material on the bed of a narrow, stable riffle.
2. Using the following equations, determine the critical dimensionless shear
stress.
a. Determine ratio di / d50
Where: di = bed material D50 of riffle d50 = subpavement D50 of bar sample
b. If ratio = 3.0 – 7.0 then determine Critical Dimensionless Shear
Stress using: Tci = .0834 (di / d50)-0.872
c. If ratio = 1.3 – 3.0 then determine Critical Dimensionless Shear Stress using: Tci = .0384 (di / d50)-0.887

3. Once Critical Dimensionless Shear Stress is determined, the minimum mean bankfull depth required to move the largest particles from the lower third of the bar is calculated using:
d = Tci (Ss)(Di) / s Where: d = minimum bankfull mean depth (ft) Ss = sediment density (1.65) Di = largest particle on lower third of point bar
s = proposed average bankfull slope

Value Variable103.11 di (mm)60.25 d50 (mm)0.024 tci
Value Variable0.024 tci
1.25 Di (ft)0.0160 Se (ft/ft)
3.1 dr (ft)3.9 de (ft)1.3 de/dr
Value Variable0.024 tci
1.25 Di (ft)3.9 de (ft)
0.0126 Sr (ft/ft)1.3 Se/Sr
3813.8
3.79 Bankfull Shear Stress tc=gRS (lb/ft2) g = 62.4 R=Hydraulic Radius S=SlopeMoveable particle size (mm) at bankfull shear stress (predicted by the Shields Diagram: Blue field book: p238, Red field book: p190)Predicted shear stress required to initiate movement of Di (mm) (see Shields Diagram: Blue field book: p238, Red field book: p190)
650
1.7
Check one:
Bankfull Water Surface Slope Required
Sediment Transport ValidationLargest Particle in Bar Sample Di (mm)
Existing Bankfull Mean Depth (from riffle cross section)
Ratio of Existing Slope to Required Slope
1.65 = submerged specific weight of sediment
DefinitionCritical Dimensionless Shear StressLargest particle from bar sample
Check one:
Ratio of Existing Mean Depth to Required Mean Depth
Bankfull Water Surface Slope Required for Entrainment of Largest Particle in Bar Sample:Sr = (tci*1.65*Di)/de
Existing Bankfull Water Surface Slope
1.65 = submerged specific weight of sediment
Bankfull Mean Depth RequiredExisting Bankfull Mean Depth (from riffle cross section)
dr = (tci*1.65*Di)/Se
DefinitionCritical Dimensionless Shear StressLargest particle from bar sample
Bar Sample D50 or Sub-pavement D50
Critical Dimensionless Shear Stress
Bankfull Mean Depth Required for Entrainment of Largest Particle in Bar Sample:
Hydraulic Radius (ft)
Entrainment Calculation Form - Sample #1Stream: Westkill Reach: Near Phase I ProjectDate: 10/29/01 Observers: AD, JD
Critical Dimensionless Shear Stresstci = 0.0384(di/d50)-0.887
DefinitionD50 Bed Material (D50 from riffle pebble count)
Stable (de/dr = 1) Aggrading (de/dr < 1) Degrading (de/dr > 1)
Stable (Se/Sr = 1) Aggrading (Se/Sr < 1) Degrading (Se/Sr > 1)

Value Variable94.67 di (mm)21.76 d50 (mm)0.023 tci
Value Variable0.023 tci
1.25 Di (ft)0.0160 Se (ft/ft)
3.0 dr (ft)3.9 de (ft)1.3 de/dr
Value Variable0.023 tci
1.25 Di (ft)3.9 de (ft)
0.0122 Sr (ft/ft)1.3 Se/Sr
3813.8
3.79 Bankfull Shear Stress tc=gRS (lb/ft2) g = 62.4 R=Hydraulic Radius S=SlopeMoveable particle size (mm) at bankfull shear stress (predicted by the Shields Diagram: Blue field book: p238, Red field book: p190)Predicted shear stress required to initiate movement of Di (mm) (see Shields Diagram: Blue field book: p238, Red field book: p190)
650
1.7
Check one:
Bankfull Water Surface Slope Required
Sediment Transport ValidationLargest Particle in Bar Sample Di (mm)
Existing Bankfull Mean Depth (from riffle cross section)
Ratio of Existing Slope to Required Slope
1.65 = submerged specific weight of sediment
DefinitionCritical Dimensionless Shear StressLargest particle from bar sample
Check one:
Ratio of Existing Mean Depth to Required Mean Depth
Bankfull Water Surface Slope Required for Entrainment of Largest Particle in Bar Sample:Sr = (tci*1.65*Di)/de
Existing Bankfull Water Surface Slope
1.65 = submerged specific weight of sediment
Bankfull Mean Depth RequiredExisting Bankfull Mean Depth (from riffle cross section)
dr = (tci*1.65*Di)/Se
DefinitionCritical Dimensionless Shear StressLargest particle from bar sample
Bar Sample D50 or Sub-pavement D50
Critical Dimensionless Shear Stress
Bankfull Mean Depth Required for Entrainment of Largest Particle in Bar Sample:
Hydraulic Radius (ft)
Entrainment Calculation Form - Sample #2Stream: Westkill Reach: Near Phase I ProjectDate: 10/29/01 Observers: AD, JD
Critical Dimensionless Shear Stresstci = 0.0834(di/d50)-0.872
DefinitionD50 Bed Material (D50 from riffle pebble count)
Stable (de/dr = 1) Aggrading (de/dr < 1) Degrading (de/dr > 1)
Stable (Se/Sr = 1) Aggrading (Se/Sr < 1) Degrading (Se/Sr > 1)

Value Variable114.02 di (mm)72.23 d50 (mm)0.026 tci
Value Variable0.026 tci
1.25 Di (ft)0.0160 Se (ft/ft)
3.3 dr (ft)3.9 de (ft)1.2 de/dr
Value Variable0.026 tci
1.25 Di (ft)3.9 de (ft)
0.0135 Sr (ft/ft)1.2 Se/Sr
3813.8
3.79Hydraulic Radius (ft)
Entrainment Calculation Form - Sample #3Stream: Westkill Reach: Near Phase I ProjectDate: 10/29/01 Observers: AD, JD
Critical Dimensionless Shear Stresstci = 0.0384(di/d50)-0.887
DefinitionD50 Bed Material (D50 from riffle pebble count)Bar Sample D50 or Sub-pavement D50
Critical Dimensionless Shear Stress
Bankfull Mean Depth Required for Entrainment of Largest Particle in Bar Sample:dr = (tci*1.65*Di)/Se
DefinitionCritical Dimensionless Shear StressLargest particle from bar sampleExisting Bankfull Water Surface Slope
1.65 = submerged specific weight of sediment
Bankfull Mean Depth RequiredExisting Bankfull Mean Depth (from riffle cross section)
Check one:
Ratio of Existing Mean Depth to Required Mean Depth
Bankfull Water Surface Slope Required for Entrainment of Largest Particle in Bar Sample:Sr = (tci*1.65*Di)/de
Existing Bankfull Mean Depth (from riffle cross section)
Ratio of Existing Slope to Required Slope
1.65 = submerged specific weight of sediment
DefinitionCritical Dimensionless Shear StressLargest particle from bar sample
Check one:
Bankfull Water Surface Slope Required
Sediment Transport ValidationLargest Particle in Bar Sample Di (mm)
Bankfull Shear Stress tc=gRS (lb/ft2) g = 62.4 R=Hydraulic Radius S=SlopeMoveable particle size (mm) at bankfull shear stress (predicted by the Shields Diagram: Blue field book: p238, Red field book: p190)Predicted shear stress required to initiate movement of Di (mm) (see Shields Diagram: Blue field book: p238, Red field book: p190)
650
1.7
Stable (de/dr = 1) Aggrading (de/dr < 1) Degrading (de/dr > 1)
Stable (Se/Sr = 1) Aggrading (Se/Sr < 1) Degrading (Se/Sr > 1)

Appendix C: Photographs

Figure 1: Preconstruction channel Figure 2: Preconstruction channel
Figure 3: Sump hole for dewatering equipment
Figure 4: Pipeline used for dewatering
Figure 5: Clearing and grubbing the design channel
Figure 6: Clearing and grubbing the design channel

Figure 10: Excavating excess clay from the channel bottom
Figure 11: Excavating the design channel Figure 12: Cross-vane construction
Figure 7: Measuring a vane arm slope Figure 8: Establishing the design channel
Figure 9: Establishing the design channel

Figure 16: The asbuilt channel after partial bioengineering installation
Figure 17: Asbuilt channel after partial bioengineering installation
Figure 18: Asbuilt channel after partial bioengineering installation
Figure 13: Gravel screen setup Figure 14: Gravel screen in use
Figure 15: Product of gravel screen

Figure 19: Volunteers tying fascines Figure 20: Fascine construction
Figure 21: Fascine installation Figure 22: Installation of potted material
Figure 23: Volunteers installing potted material
Figure 24: The finished product

Appendix D: Documentation of stream flow related construction delays
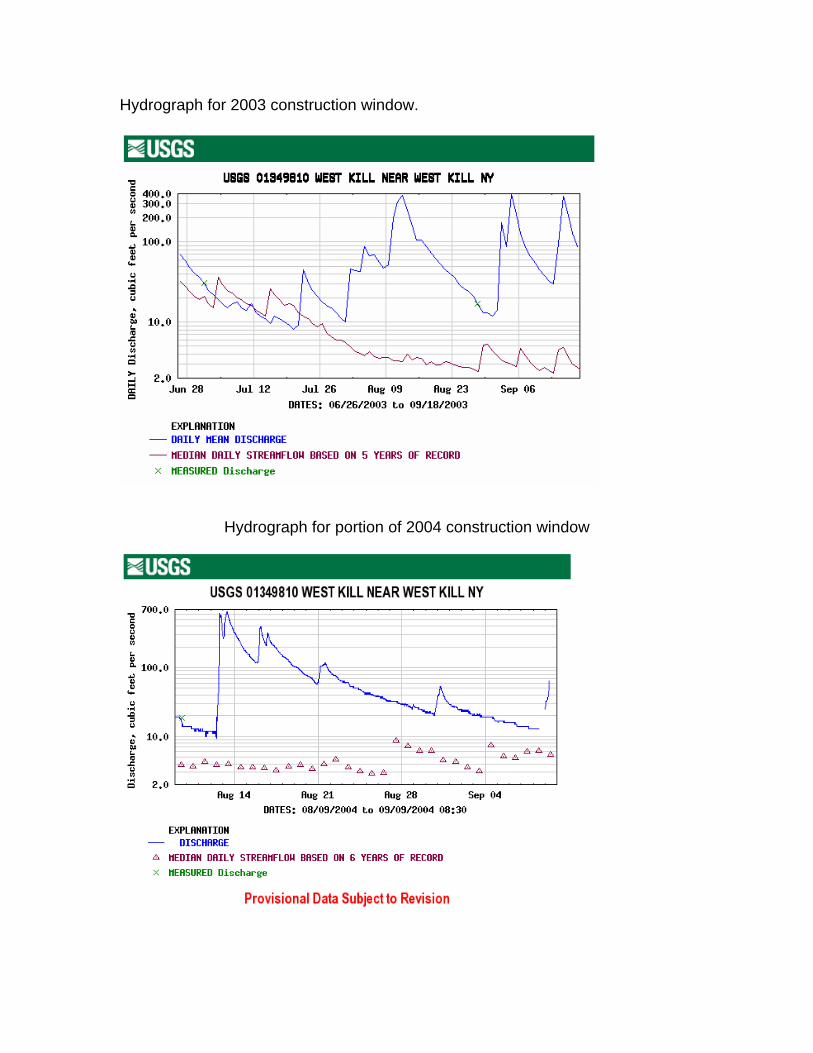
Hydrograph for 2003 construction window.
Hydrograph for portion of 2004 construction window

West Kill Flood Hazard Mitigation Project
Construction Log 2004
Tuesday July 6, 2004
Weather – Partly cloudy Stream Flow Data USGS Gage 01349711 West Kill Below Hunter Brook 8.9 cfs Estimated Project Site Discharge 7.4 cfs USGS Gage 01349810 West Kill Near West Kill, NY 11 cfs
Bypass pipeline welding in progress. 3 pieces spliced into existing bypass line. Remaining pipe to be welded into a second bypass line. Bypass pumping sump constructed and coffer dam built.
Hitachi 550 excavator delivered to site. 220 KW and 300 KW generators on site at start of day.
Wednesday July 7, 2004 Weather – Clear Stream Flow Data USGS Gage 01349711 West Kill Below Hunter Brook 3.5 cfs Estimated Project Site Discharge 4.8 cfs USGS Gage 01349810 West Kill Near West Kill, NY 6.1 cfs Pipeline assembly completed.
Small crack noted on steel flange adaptor, cracked upon delivery. Leakage from crack is negligible.
Thursday July 8, 2004 Weather – Clear Stream Flow Data USGS Gage 01349711 West Kill Below Hunter Brook 2.9 cfs Estimated Project Site Discharge 5.5 cfs USGS Gage 01349810 West Kill Near West Kill, NY 8.1 cfs
Dewatering system completed. Bypass pumps placed in sump. Bypass pipeline attached to bypass pumps. Generators in place and bypass pumps are wired into generators. Work area sediment control pump in place with coffer dam and sump. 100 KW generator in place for sediment control pump and pump wiring complete.
Friday July 9, 2004 Weather – Clear Stream Flow Data USGS Gage 01349711 West Kill Below Hunter Brook 2 cfs Estimated Project Site Discharge 3.85 cfs USGS Gage 01349810 West Kill Near West Kill, NY 5.7 cfs Additional survey control established and excavation stakeout work underway. No contractor activity. Saturday July 10, 2004 Stream Flow Data USGS Gage 01349711 West Kill Below Hunter Brook 1.9 cfs Estimated Project Site Discharge 3.3 cfs USGS Gage 01349810 West Kill Near West Kill, NY 4.7 cfs No construction activity Sunday July 11, 2004 Stream Flow Data USGS Gage 01349711 West Kill Below Hunter Brook 1.8 cfs Estimated Project Site Discharge 2.95 cfs USGS Gage 01349810 West Kill Near West Kill, NY 4.1 cfs No construction activity Monday July 12, 2004 Stream Flow Data USGS Gage 01349711 West Kill Below Hunter Brook 1.8 cfs Estimated Project Site Discharge 2.8 cfs USGS Gage 01349810 West Kill Near West Kill, NY 3.8 cfs

No construction activity. Unexpected delay in deliver of off road dump trucks, as well as delays in assembly of Hitachi 550 excavator. Mechanics on site completing excavator assembly.
Tuesday July 13, 2004 Stream Flow Data USGS Gage 01349711 West Kill Below Hunter Brook 1.8 cfs Estimated Project Site Discharge 3.6 cfs USGS Gage 01349810 West Kill Near West Kill, NY 5.4 cfs
No construction activity. Unexpected delay in deliver of off road dump trucks, as well as delays in assembly of Hitachi 550 excavator. Mechanics on site completing excavator assembly.
Wednesday July 14, 2004 Weather – Partly cloudy, rain expected over night Stream Flow Data (Note: Lag in Peak Flow) USGS Gage 01349711 West Kill Below Hunter Brook 17 cfs Estimated Project Site Discharge 12.3 cfs USGS Gage 01349810 West Kill Near West Kill, NY 7.6 cfs
Site well dewatered. Single bypass pump adequate to divert surface flow around work area. Six inch sediment control pump adequate to deliver sediment laden water from work area to turbidity settling area. Sediment control pump appears to have far more capacity than is necessary for today’s site conditions. Grading work commenced in station 22+00 – 25+00. Rough grading of channel as well as clay over excavation and replacement with native alluvium.
Thursday July 15, 2004 Weather – Partly Cloudy Stream Flow Data USGS Gage 01349711 West Kill Below Hunter Brook 11 cfs Estimated Project Site Discharge 18 cfs USGS Gage 01349810 West Kill Near West Kill, NY 25 cfs
Rains over night have inundated bypass pumps, exceeding there capacity.

7:00 a.m. - Bypass pumps began to overcome the surface flow. Dual bypass pumps required to dewater work area. 8:00 am - Sediment control pump moved upstream of auxiliary bypass pipeline discharge. Several hours expected to regain adequate work area dewatering to continue work in accordance with the project’s Storm Water Pollution Prevention Plan. Rain in afternoon. Unable to commence work.
Friday July 16, 2004 Weather – Partly cloudy, rain overnight Stream Flow Data USGS Gage 01349711 West Kill Below Hunter Brook 6.9 cfs Estimated Project Site Discharge 11 cfs USGS Gage 01349810 West Kill Near West Kill, NY 15 cfs
Dual bypass pumps in operation. Bypass pumping capacity adequate to dewater work area. Six inch sediment control pump adequate to deliver sediment laden water from work area to turbidity settling area. Channel excavation work in stations 19+50 – 21+50. 9:00 a.m. – Turbidity settling area capacity exceeded. Turbid water discharge at downstream end of work area. Low levee constructed to increase capacity of turbidity settling area. Capacity increase effective to stop turbid water discharge, but significantly increased ground water influx to work area. Work area has become more saturated, but turbid discharge has been eliminated.
Saturday July 17, 2004 Weather – Partly Cloudy Stream Flow Data USGS Gage 01349711 West Kill Below Hunter Brook 27 cfs Estimated Project Site Discharge 65.6 cfs USGS Gage 01349810 West Kill Near West Kill, NY 104 cfs Channel excavation work in stations 16+50 – 19+50.

8:00 am – Discharge from turbidity settling area escapes work area. Small breech noted in turbidity settling area levee upon inspection. Breech repaired, and sediment control recovered. 11:30 am – Simultaneous circuit breaker failure on both bypass pumps. Stream flow into work area overcomes sediment control pump. Some turbid discharge from sediment control sump out of work area. Bypass pumps are reactivated and sediment control is recovered. 4:00 pm – Heavy thunder showers at end of workday.
Sunday July 18, 2004 Stream Flow Data USGS Gage 01349711 West Kill Below Hunter Brook 14 cfs Estimated Project Site Discharge 32.5 cfs USGS Gage 01349810 West Kill Near West Kill, NY 51 cfs
No construction activity. Monday July 19, 2004 Weather – Cloudy Stream Flow Data USGS Gage 01349711 West Kill Below Hunter Brook 13 cfs Estimated Project Site Discharge 23.5 cfs USGS Gage 01349810 West Kill Near West Kill, NY 34 cfs
Heavy rain over night (~0.9 inches) increases stream flow beyond bypass pumping capacity. Unable to control work area sediment. No construction activities.
Tuesday July 20, 2004
Weather - Cloudy Stream Flow Data USGS Gage 01349711 West Kill Below Hunter Brook 11 cfs Estimated Project Site Discharge 20.5 cfs USGS Gage 01349810 West Kill Near West Kill, NY 30 cfs

Rains over night maintain stream flow at levels that exceed bypass pumping capacity. Unable to control work area sediment. No construction activities.
Wednesday July 21, 2004 Weather – Hazy Stream Flow Data USGS Gage 01349711 West Kill Below Hunter Brook 8.9 cfs Estimated Project Site Discharge 17 cfs USGS Gage 01349810 West Kill Near West Kill, NY 25 cfs
4:00 am – Bypass pumps activated. Stream flow exceeds bypass pumping capacity resulting in surface flow into work area. 7:00 a.m. – Work started in hopes that sediment control pump and turbidity settling area capacity will be adequate to treat both emergent groundwater and surface flow in work area. 9:00 am – Capacity of sediment control pump as well as turbidity settling area exceeded. Unable to control sediment discharge from work area. Construction activities stopped in response to inability to comply with the project’s Storm Water Pollution Prevention Plan. Pumps to be tested in the evening to determine possibility of work on 7/22/04.
Thursday July 22, 2004 Weather – Hazy Stream Flow Data USGS Gage 01349711 West Kill Below Hunter Brook 7.7 cfs Estimated Project Site Discharge 12.4 cfs USGS Gage 01349810 West Kill Near West Kill, NY 17 cfs
7:00 am – Dual bypass pumps adequate to divert stream flow around work area. Sediment control working well. Channel excavation work in stations 14+50 – 17+00 (rip rapped reach). 1:00 pm – Sediment laden water from work area exceeds sediment control pump capacity. Turbid discharge from work area. Construction activities stopped in response to inability to comply with the project’s Storm Water Pollution Prevention Plan. Clean water flow noted in the area near the bypass pumps

appears to be flowing through the gravel coffer dam into the work area. Slightly lower stream flow would allow the bypass pumps to lower the water surface elevation in the bypass sump, minimizing clean water percolation into the work area.
Friday July 23, 2004 Weather – Rain Stream Flow Data USGS Gage 01349711 West Kill Below Hunter Brook 36 cfs Estimated Project Site Discharge 91 cfs USGS Gage 01349810 West Kill Near West Kill, NY 146 cfs
7:00 a.m. – Clear skies in morning, rain expected. Dual bypass pumps adequate to divert stream flow around work area. Sediment control system effective. 11:00 a.m. – Heavy rains have begun. Bypass pumping capacity is exceeded. As a result, sediment control pump capacity is exceeded by surface flow into work area. Construction activities stopped in response to inability to comply with the project’s Storm Water Pollution Prevention Plan. Channel grading work in stations 13+00 – 14+50.
Saturday July 24, 2004 Stream Flow Data USGS Gage 01349711 West Kill Below Hunter Brook 25 cfs Estimated Project Site Discharge 46 cfs USGS Gage 01349810 West Kill Near West Kill, NY 67 cfs
No construction activities due to inability to comply with the project’s Storm Water Pollution Prevention Plan.
Sunday July 25, 2004 Stream Flow Data USGS Gage 01349711 West Kill Below Hunter Brook 19 cfs Estimated Project Site Discharge 30 cfs USGS Gage 01349810 West Kill Near West Kill, NY 41 cfs No construction activity

Monday July 26, 2004 Weather – Partly cloudy Stream Flow Data USGS Gage 01349711 West Kill Below Hunter Brook 14 cfs Estimated Project Site Discharge 23 cfs USGS Gage 01349810 West Kill Near West Kill, NY 32 cfs
Rains over weekend result in stream flow that exceeds bypass pumping capacity. No construction activities due to inability to comply with the project’s Storm Water Pollution Prevention Plan.
Tuesday July 27, 2004 Weather – Rain (~1.25 inches) Stream Flow Data USGS Gage 01349711 West Kill Below Hunter Brook 27 cfs Estimated Project Site Discharge 58 cfs USGS Gage 01349810 West Kill Near West Kill, NY 89 cfs
Rain over night and into work day. Stream flow exceeds bypass pumping capacity. Channel Excavation work in stations 13+25 – 14+00. 9:15 a.m. - Construction activities stopped in response to inability to comply with the project’s Storm Water Pollution Prevention Plan.
Wednesday July 28, 2004 Weather – Partly cloudy / rain (~1.0 inches)
Stream Flow Data USGS Gage 01349711 West Kill Below Hunter Brook 25 cfs Estimated Project Site Discharge 55 cfs USGS Gage 01349810 West Kill Near West Kill, NY 85 cfs
No construction activities due to inability to comply with the project’s Storm Water Pollution Prevention Plan.

Thursday July 29, 2004 Weather – Partly cloudy
Stream Flow Data USGS Gage 01349711 West Kill Below Hunter Brook 25 cfs Estimated Project Site Discharge 51 cfs USGS Gage 01349810 West Kill Near West Kill, NY 77 cfs
No construction activities due to inability to comply with the project’s Storm Water Pollution Prevention Plan.
Friday July 30, 2004 Weather – Partly Cloudy
Stream Flow Data USGS Gage 01349711 West Kill Below Hunter Brook 20 cfs Estimated Project Site Discharge 35.5 cfs USGS Gage 01349810 West Kill Near West Kill, NY 51 cfs
No construction activities due to inability to comply with the project’s Storm Water Pollution Prevention Plan.
Saturday July 31, 2004 Weather – Partly Cloudy, Rain
Stream Flow Data USGS Gage 01349711 West Kill Below Hunter Brook 20 cfs Estimated Project Site Discharge 40.5 cfs USGS Gage 01349810 West Kill Near West Kill, NY 61 cfs
No construction activities due to inability to comply with the project’s Storm Water Pollution Prevention Plan.
Sunday August 1, 2004 Stream Flow Data USGS Gage 01349711 West Kill Below Hunter Brook 16 cfs Estimated Project Site Discharge 36 cfs USGS Gage 01349810 West Kill Near West Kill, NY 56 cfs

No construction activity Monday August 2, 2004 Weather – Partly cloudy Stream Flow Data USGS Gage 01349711 West Kill Below Hunter Brook 13 cfs Estimated Project Site Discharge 26 cfs USGS Gage 01349810 West Kill Near West Kill, NY 39 cfs
Rains over weekend result in stream flow that exceeds bypass pumping capacity. No construction activities due to inability to comply with the project’s Storm Water Pollution Prevention Plan.
Tuesday August 3, 2004 Weather – Partly cloudy Stream Flow Data USGS Gage 01349711 West Kill Below Hunter Brook 11 cfs Estimated Project Site Discharge 21.5 cfs USGS Gage 01349810 West Kill Near West Kill, NY 32 cfs
Rains over weekend result in stream flow that exceeds bypass pumping capacity. No construction activities due to inability to comply with the project’s Storm Water Pollution Prevention Plan.
Wednesday August 4, 2004 Weather – Partly Cloudy Stream Flow Data USGS Gage 01349711 West Kill Below Hunter Brook 9.3 cfs Estimated Project Site Discharge 19.7 cfs USGS Gage 01349810 West Kill Near West Kill, NY 30 cfs
7:00 a.m. – Stream flows exceed bypass pumping capacity. Bypass sump overflowing into work area. Sediment control pump capacity also exceeded by surface flow into the work area. Turbid discharge from work area at sediment control sump. Work commences in anticipation of receding stream flow as the day progresses.

12:00 p.m. – Stream flow continues to exceed bypass pump capacity. Sustained surface flow into work area forces the stop of construction activity due to inability to comply with the project’s Storm Water Pollution Prevention Plan.
Thursday August 5, 2004 Weather – Cloudy, Rain Stream Flow Data USGS Gage 01349711 West Kill Below Hunter Brook 10 cfs Estimated Project Site Discharge 23 cfs USGS Gage 01349810 West Kill Near West Kill, NY 36 cfs
0.6 inches of rainfall at work site overnight. 7:00 a.m. – Stream flows exceed bypass pumping capacity. No channel grading due to inability to comply with the project’s Storm Water Pollution Prevention Plan. Rock deliveries received throughout the day.
Friday August 6, 2004 Weather – Partly Cloudy Stream Flow Data USGS Gage 01349711 West Kill Below Hunter Brook 8 cfs Estimated Project Site Discharge 19 cfs USGS Gage 01349810 West Kill Near West Kill, NY 30 cfs
7:00 a.m. – Stream flows exceed bypass pumping capacity. Turbid discharge from sediment control sump. Work stopped in morning due to inability to comply with the project’s Storm Water Pollution Prevention Plan. Rock deliveries received throughout the day. One Caterpillar Off-Road Dump Truck removed from site. One truck remains on site.
Saturday August 7, 2004

Stream Flow Data USGS Gage 01349711 West Kill Below Hunter Brook 7.1 cfs Estimated Project Site Discharge 15 cfs USGS Gage 01349810 West Kill Near West Kill, NY 23 cfs No construction activity Sunday August 8, 2004 Stream Flow Data USGS Gage 01349711 West Kill Below Hunter Brook 6.6 cfs Estimated Project Site Discharge 16 cfs USGS Gage 01349810 West Kill Near West Kill, NY 25 cfs No construction activity Monday August 9, 2004 Weather – Sunny Stream Flow Data USGS Gage 01349711 West Kill Below Hunter Brook 5.9 cfs Estimated Project Site Discharge 12 cfs USGS Gage 01349810 West Kill Near West Kill, NY 19 cfs Cross vane located near station 19+00 partially completed.
Bypass pump and sediment control pump capacity adequate to handle surface flow and ground water influx conditions on site. Caterpillar 330 excavator delivered to site.
Tuesday August 10, 2004 Weather – Clear Stream Flow Data USGS Gage 01349711 West Kill Below Hunter Brook 5.2 cfs Estimated Project Site Discharge 9.6 cfs USGS Gage 01349810 West Kill Near West Kill, NY 14 cfs Site well dewatered. Rock structure installation in stations 19+50 – 22+00.

Wednesday August 11, 2004 Weather – Cloudy Stream Flow Data USGS Gage 01349711 West Kill Below Hunter Brook 5.0 cfs Estimated Project Site Discharge 9.0 cfs USGS Gage 01349810 West Kill Near West Kill, NY 13 cfs
7:00 a.m. – Site well dewatered. 1:00 p.m. – Turbid discharge forces stop of construction activity due to inability to comply with the project’s Storm Water Pollution Prevention Plan. Discharge resulted from contractor’s decision to shutdown the auxiliary bypass pump in order to install the rock vane at station 23+00. Surface flow exceeded single bypass pump capacity, allowing surface flow into the work area. Sediment control sump became inundated and some turbid discharge resulted. Work stopped for remainder of work day.
Thursday August 12, 2004 Weather – Partly Cloudy, Rain Stream Flow Data USGS Gage 01349711 West Kill Below Hunter Brook 52 cfs Estimated Project Site Discharge 315 cfs USGS Gage 01349810 West Kill Near West Kill, NY 577 cfs
7:00 a.m. – Site well dewatered. 12:00 p.m. – Clean water from bypass discharge pipe infiltrates sediment control sump. Volume overloads sediment control system resulting in turbid discharge. Seperation dam repaired, but work temporarily stopped due to inability to comply with the project’s Storm Water Pollution Prevention Plan. 1:30 p.m. – Work area sediment control regained. In channel work procedes. 2:30 p.m. – Heavy rains have begun. Work continues. 3:30 p.m. – Surface flow increases from rain event have exceeded bypass pumping capacity, allowing surface flow into work area. Work continues in order to stabilize site for heavy rains and stream flows expected over night and on te weekend. No visible contrast noted.

5:30 p.m. – Work stopped due to flow conditions. Rock structure installation completed in stations 13+00 – 16+50. Rock vane at station 17+25 partially completed. Rock deliveries received throughout the day. 1.8 inches of rainfall at work site by end of day.
Friday August 13, 2004 Weather –Cloudy, Rain Stream Flow Data USGS Gage 01349711 West Kill Below Hunter Brook 104 cfs Estimated Project Site Discharge 376 cfs USGS Gage 01349810 West Kill Near West Kill, NY 647 cfs
Rains overnight result in stream flow that exceeds bypass pumping capacity. No construction activities due to inability to comply with the project’s Storm Water Pollution Prevention Plan.
Saturday August 14, 2004 Stream Flow Data USGS Gage 01349711 West Kill Below Hunter Brook 51 cfs Estimated Project Site Discharge 186 cfs USGS Gage 01349810 West Kill Near West Kill, NY 321 cfs No construction activity Sunday August 15, 2004 Stream Flow Data USGS Gage 01349711 West Kill Below Hunter Brook 36 cfs Estimated Project Site Discharge 102 cfs USGS Gage 01349810 West Kill Near West Kill, NY 167 cfs No construction activity Monday August 16, 2004 Weather – Partly cloudy, Rain

Stream Flow Data USGS Gage 01349711 West Kill Below Hunter Brook 154 cfs Estimated Project Site Discharge 274 cfs USGS Gage 01349810 West Kill Near West Kill, NY 394 cfs
Rains over weekend result in stream flow that exceeds bypass pumping capacity. No construction activities due to inability to comply with the project’s Storm Water Pollution Prevention Plan.
Tuesday August 17, 2004 Weather – Partly cloudy, Rain Stream Flow Data USGS Gage 01349711 West Kill Below Hunter Brook 55 cfs Estimated Project Site Discharge 147 cfs USGS Gage 01349810 West Kill Near West Kill, NY 238 cfs
Rains result in stream flow that exceeds bypass pumping capacity. No construction activities due to inability to comply with the project’s Storm Water Pollution Prevention Plan. 2.1 inches of rain measured since end of work on Thursday August 12, 2004
Wednesday August 18, 2004 Weather – Partly cloudy Stream Flow Data USGS Gage 01349711 West Kill Below Hunter Brook 35 cfs Estimated Project Site Discharge 94 cfs USGS Gage 01349810 West Kill Near West Kill, NY 152 cfs
Stream flow exceeds bypass pumping capacity. No construction activities due to inability to comply with the project’s Storm Water Pollution Prevention Plan.
Thursday August 19, 2004 Weather – Partly cloudy Stream Flow Data USGS Gage 01349711 West Kill Below Hunter Brook 26 cfs

Estimated Project Site Discharge 65 cfs USGS Gage 01349810 West Kill Near West Kill, NY 104 cfs
Stream flow exceeds bypass pumping capacity. No construction activities due to inability to comply with the project’s Storm Water Pollution Prevention Plan.
Friday August 20, 2004 Weather – Partly cloudy Stream Flow Data USGS Gage 01349711 West Kill Below Hunter Brook 20 cfs Estimated Project Site Discharge 49 cfs USGS Gage 01349810 West Kill Near West Kill, NY 77 cfs
Stream flow exceeds bypass pumping capacity. No construction activities due to inability to comply with the project’s Storm Water Pollution Prevention Plan.

Appendix E: 2005 Damage Repair Work

West Kill Stream Restoration Demonstration Project
2005 Damage Repairs Post Construction Report
Prepared By: Joel DuBois, CPESC For: Greene County Soil & Water
Conservation District October, 2005

Background The West Kill Stream Restoration Project has undertaken a stream restoration demonstration project located in the Hamlet of Spruceton in the Town of Lexington. The project construction was initiated in the summer of 2003. Construction continued, but was not completed in the summer of 2004. Completion of the project was scheduled for the summer of 2005. Out of bank flood flows occurred April 2, 2005, in the West Kill Watershed, resulting in damage to work completed during the 2003 and 2004 construction seasons. Some of the damages resulted in conditions that made natural recovery of the design channel unlikely without intervention. This document is intended to summarize the damages sustained by the project and describe the measures installed to mitigate those damages. Repair Strategy As the project construction was incomplete at the time of the flooding, and a contractor was already scheduled to return to the site, it was determined that the contractor would be engaged, on a time and materials basis, to restore the damaged portions of the project to design grades and specifications. As portions of the project dewatering system were already in place in the reaches completed during the 2003 and 2004 construction seasons, it was determined that the repair work would be completed prior to commencing with the new work to be completed in 2005. In order to improve the resistance of the new construction to erosive flood flows, a power screen was employed to process the material stock pile into three separate products. The screen produced a coarse product (> 4 inches) which was used to increase the erosion resistance of critical channel areas. A medium sized product (1/2 inches – 4 inches) included significant amounts of soil that were unable to pass through the 1/2 inch screen at the rate that the machine was being loaded. The soil content of the product was capitalized upon, and the gravel soil mixture that resulted was used to cover the benches and flood plains to a depth of approximately 6 inches. The application of the gravel soil mixture is expected to improve the rate of establishment of the bioengineering treatments installed on the project. The third product was a fine (< ½ inches) soil product. This product was applied in spot treatments at the time of the

bioengineering and plant installation. The soil was used in the immediate area of the vegetative treatments to improve the local soil conditions and promote vigorous growth of the vegetative treatments. Rocks deemed to large to be processed by the power screen were set aside. These large rocks were used to armor extreme high stress portions of the channel and in the bank full benches to improve the stability of the channel plan, dimension and profile. Due to dewatering limitations, the project repairs were completed in two phases. Phase 1 of the dewatering allowed work between stations 9+00 and 23+00. Pumps were installed at station 12+00 and flows were diverted in a closed pipeline to station 23+00. A passive diversion channel was excavated from station 9+00 to 12+00 to allow for work on the upper portions of the channel and floodplain. Phase 2 of the dewatering allowed work between stations 0+00 and 13+00. This phase was accomplished solely with the pump and pipeline method. Phase 1 (9+00 – 23+00) To facilitate discussion of the damages sustained in the phase 1 reach, and the measures taken to repair the damages, the reach will be broken into station ranges. 9+00 – 12+00
This portion of the project experienced significant aggradation within the limits of the bankfull channel. The aggradation was first noted after flooding in 2003 when the project was only partially completed. A channel constriction occurred where the completed design channel tied into undisturbed existing channel scheduled for completion in 2004. The channel constriction appeared to cause a backwater condition in the upstream reach, resulting in excess sediment deposition. The deposition, while not completely filling the bankfull channel, left the channel with a high width/depth ratio and reduced sediment transport capacity. April 2005 flooding exacerbated the aggradation and resulted in lateral channel migration and flanking of a rock vane keyway. The channel in this reach was excavated to reestablish the design channel grades and restore the bankfull bench at channel right. As a component of the bankfull bench repairs, boulders salvaged from the material stock pile, were installed longitudinally along the leading edge of the bench. Fills behind the boulders were made using cobble/boulder materials screened from the material stockpile. General fill material was then placed over and in front of the boulders to ensure a more natural appearance of the bank. The boulders were intended to provide additional scour protection in the event of erosive flood flows prior to the establishment of bioengineering treatments. Upon completion of the channel and bench grading, the keyway of the rock vane at station 10+00 was repaired and elongated to prevent future structure flanking, and lateral migration of the channel.

All bankfull benches, in this reach, that sustained damage or which were unvegetated were treated with approximately 6 inches of soil/gravel mixture screened from the material stockpile. 12+00 – 15+00 A cross vane right keyway at station 12+75 experienced minor flanking as a result of the April flood. While low flow was maintained in the design channel, the flanking allowed for bankfull and larger flows to flow outside of the structural control provided by the cross vane. This condition would have likely become worse with successive flows. The keyway was repaired and elongated to prevent future flanking, and the bankfull bench in the immediate area was restored to design grades. The repairs to the structure and surrounding floodplain were intended to restore the channel pattern and sediment transport capacity. The April flood exposed a large clay deposit in the left bankfull bench between stations 13+25 and 15+00. Rocks displaced from the left arm of the cross vane at station 14+75 left a large gap in the structure. The gap concentrated flow near the left bankfull bench, resulting in the exposure of the clay deposit. Clay materials from the deposit were removed to a suitable depth (2-3 feet) and replaced with appropriate materials recovered from the material stockpile. As a component of the bankfull bench repairs, boulders salvaged from the material stock pile, were installed longitudinally along the leading edge of the bench. Fills behind the boulders were made using cobble/boulder materials screened from the material stockpile. General fill material was then placed over and in front of the boulders to ensure a more natural appearance of the bank. The boulders were intended to provide additional scour protection in the event of erosive flood flows prior to the establishment of bioengineering treatments. Upon completion of the channel and bankfull bench grading upstream of the cross vane and repair of a scour hole immediately downstream of the left keyway, the left arm of the cross vane was repaired using large quarry stone. All bankfull benches, in this reach, that sustained damage or which were unvegetated were treated with approximately 6 inches of soil/gravel mixture screened from the material stockpile. 15+00 – 19+00 Point bar scour between stations 15+75 and 17+50 at channel left resulted in exposure of a clay deposit beneath the design grades. Clay materials from the deposit were excavated to an appropriate depth (2-3 feet) and replaced with cobble/boulder materials screened from the material stockpile. Keyway scour and general bankfull bench scour at channel right between stations 17+75 and 19+00 were documented following the April flooding. Design grades

were restored in the area using cobble/boulder materials screened from the material stockpile. All bankfull benches, in this reach, that sustained damage or which were unvegetated were treated with approximately 6 inches of soil/gravel mixture screened from the material stockpile. 19+00 – 22+00 Erosion which occurred during the April flood event left clay deposits exposed in the right bankfull bench between stations 19+75 and 22+00. Clay materials from the deposit were removed to a suitable depth (2-3 feet) and replaced with appropriate materials recovered from the material stockpile. As a component of the bankfull bench repairs, boulders salvaged from the material stock pile, were installed longitudinally along the leading edge of the bench. Fills behind the boulders were made using cobble/boulder materials screened from the material stockpile. General fill material was then placed over and in front of the boulders to ensure a more natural appearance of the bank. The boulders were intended to provide additional scour protection in the event of erosive flood flows prior to the establishment of bioengineering treatments. All bankfull benches, in this reach, that sustained damage or which were unvegetated were treated with approximately 6 inches of soil/gravel mixture screened from the material stockpile. 22+00 – 23+00 Excess deposition occurred during the April flood between stations 22+00 and 23+00 as a result of large rock materials stockpiled on the bankfull bench just downstream of the deposition. The stockpiled rock was removed, and the excess deposition was excavated to design grades. All bankfull benches, in this reach, that sustained damage or which were unvegetated were treated with approximately 6 inches of soil/gravel mixture screened from the material stockpile.
Phase 2 (0+00 – 12+00) To facilitate discussion of the damages sustained in the phase 2 reach, and the measures taken to repair the damages, the reach will be broken into station ranges.
0+00 – 2+50
April flooding resulted in damage to the first cross vane at the upstream most extents of the project area. Approximately 5 rocks were dislodged from the left vane arm and keyway. Damage to the left vane arm and keyway allowed out of

bank flows to erode the left bankfull bench. While base flows remained confined to the design channel, the compromised condition of the cross vane allowed flows near bankfull to evade the width and grade control provided by the structure. Without intervention, the condition of the structure was likely to degrade with successive bed mobilizing flows. In order to restore the function of the structure and avoid future flanking of the structure, the dislodged rocks were replaced in the arm and keyway, and the length of the keyway was extended to tie back further into the flood terrace. Though the right arm of the structure remained in tact following the April flood event, modifications were made to the structure. Cobble/boulder materials screened from the material stockpile were used to achieve design grades in the area surrounding the repaired left vane arm. All bankfull benches, in this reach, that sustained damage or which were unvegetated were treated with approximately 6 inches of soil/gravel mixture screened from the material stockpile. 2+50 – 4+00 Channel incision in this station range left the bankfull channel excessively confined. Bankfull bench erosion at the right bank exposed a significant clay deposit in the channel bed and banks. Clay materials from the deposit were removed to a suitable depth (2-3 feet) and replaced with angular rock material acquired from a blasting site in the Town of Hunter. The angular rock materials were also used to restore the thalweg elevations in the reach. The repairs made in this reach will restore the sediment transport function of the design channel, while limiting the contact of surface flow with lacusterine clay deposits. All bankfull benches, in this reach, that sustained damage or which were unvegetated were treated with approximately 6 inches of soil/gravel mixture screened from the material stockpile. 5+75 – 7+50 A cutoff channel had begun to form in this reach along the back of the right point bar, within the bankfull channel. The channel formed as a result of both scour and deposition on the point bar, and required minor grading of the existing materials to restore the designed point bar grades. Bankfull bench erosion on the left bank left a significant clay deposit exposed to surface flow. Clay materials from the deposit were removed to a suitable depth (2-3 feet) and replaced with angular rock material acquired from a blasting site in the Town of Hunter. Though the rock vane at station 5+75 remained in tact following the April flood event, modifications were made to the structure to adjust the overall slope of the vane arm as well as the uniformity of the slope longitudinally along the structure.
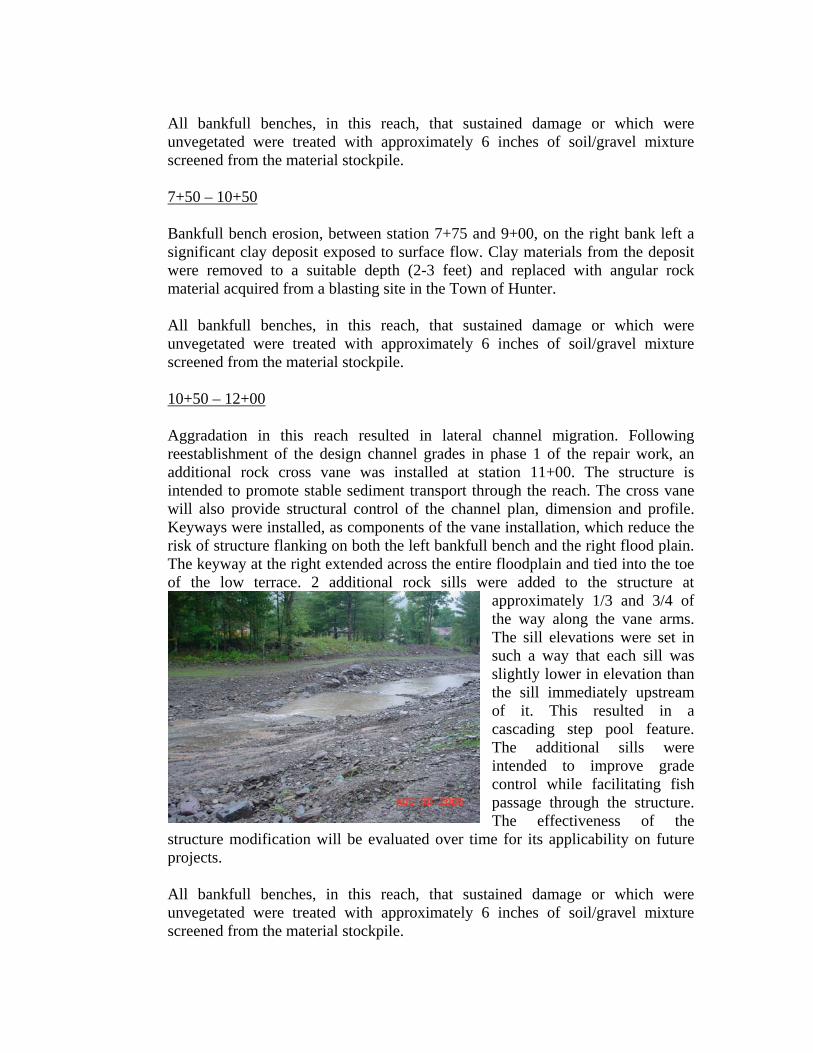
All bankfull benches, in this reach, that sustained damage or which were unvegetated were treated with approximately 6 inches of soil/gravel mixture screened from the material stockpile. 7+50 – 10+50 Bankfull bench erosion, between station 7+75 and 9+00, on the right bank left a significant clay deposit exposed to surface flow. Clay materials from the deposit were removed to a suitable depth (2-3 feet) and replaced with angular rock material acquired from a blasting site in the Town of Hunter. All bankfull benches, in this reach, that sustained damage or which were unvegetated were treated with approximately 6 inches of soil/gravel mixture screened from the material stockpile. 10+50 – 12+00 Aggradation in this reach resulted in lateral channel migration. Following reestablishment of the design channel grades in phase 1 of the repair work, an additional rock cross vane was installed at station 11+00. The structure is intended to promote stable sediment transport through the reach. The cross vane will also provide structural control of the channel plan, dimension and profile. Keyways were installed, as components of the vane installation, which reduce the risk of structure flanking on both the left bankfull bench and the right flood plain. The keyway at the right extended across the entire floodplain and tied into the toe of the low terrace. 2 additional rock sills were added to the structure at
approximately 1/3 and 3/4 of the way along the vane arms. The sill elevations were set in such a way that each sill was slightly lower in elevation than the sill immediately upstream of it. This resulted in a cascading step pool feature. The additional sills were intended to improve grade control while facilitating fish passage through the structure. The effectiveness of the
structure modification will be evaluated over time for its applicability on future projects. All bankfull benches, in this reach, that sustained damage or which were unvegetated were treated with approximately 6 inches of soil/gravel mixture screened from the material stockpile.