west oxfordshire district summary 2020
TRANSCRIPT

West
Oxfo
rdsh
ire D
istr
ict
Sum
mary
West Oxfordshire
District Summary
2020
Published July 2020

Cherw
ell D
istr
ict
Sum
mary
Introduction to the District Summary for West Oxfordshire
2
EMAIL: [email protected]:insight.oxfordshire.gov.uk/jsna
This is a summary report for Vale of White Horse District and includes the following
key areas highlighted in the JSNA 2020 Oxfordshire report:
Historical and projected population change
Public Health England 2020 health summary
Key health and wellbeing facts and figures 2020
A district inequalities summary (tartan rug)
Indices of Multiple Deprivation 2019
Other resources include:
JSNA 2020 Oxfordshire report
Public Health Dashboards
Health Needs Assessments
Community Health and Wellbeing Profiles
JSNA Bitesize
Cherw
ell D
istr
ict
Sum
mary
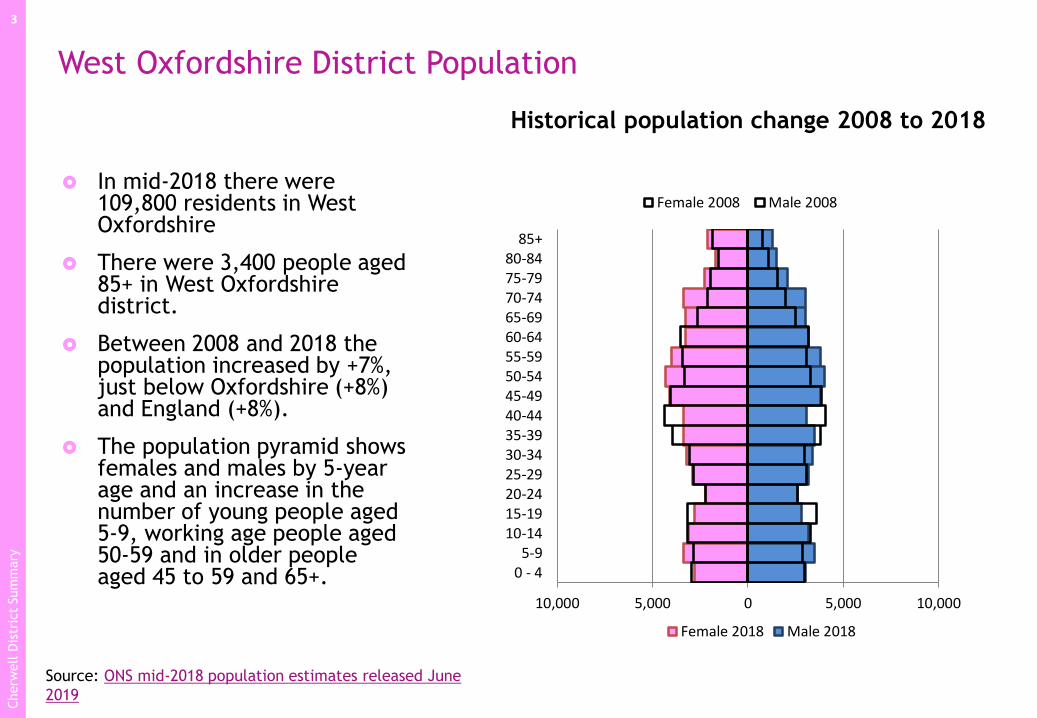
West Oxfordshire District Population
In mid-2018 there were 109,800 residents in West Oxfordshire
There were 3,400 people aged 85+ in West Oxfordshire district.
Between 2008 and 2018 the population increased by +7%,just below Oxfordshire (+8%) and England (+8%).
The population pyramid shows females and males by 5-year age and an increase in the number of young people aged 5-9, working age people aged 50-59 and in older people aged 45 to 59 and 65+.
3
Historical population change 2008 to 2018
10,000 5,000 0 5,000 10,000
0 - 45-9
10-1415-1920-2425-2930-3435-3940-4445-4950-5455-5960-6465-6970-7475-7980-84
85+
Female 2018 Male 2018
Female 2008 Male 2008
Source: ONS mid-2018 population estimates released June
2019

Cherw
ell D
istr
ict
Sum
mary
Population Forecast
The housing-led forecasts show the
population of West Oxfordshire
increasing from 109,300 in 2017 to
132,400 by 2027 (+23,100, +21%).
Growth is expected across all areas
of West Oxfordshire.
The population of Witney and the
surrounding area is expected to
grow from 28,800 to 33,800 (+18%).
Carterton’s population is expected
to grow from 16,500 to 23,700
(+43%).
Chipping Norton is expected to grow
from 6,600 to 9,400 (+42%).
4
- 20,000 40,000 60,000 80,000
100,000 120,000 140,000
West Oxfordshire by broad age
age 65+
age 18-64
age 0-17
-
20,000
40,000
60,000
80,000
West Oxfordshire - settlements
other areas
Witney
Carterton
ChippingNorton

Cherw
ell D
istr
ict
Sum
mary
Health Summary for
West Oxfordshire
The Public Health England local health profile for West Oxfordshire shows that, for the majority of indicators, West Oxfordshire is better than or similar to the national average
Indicators that are worse than average are killed and seriously injured on roads, estimated diabetes diagnosis rate, and alcohol-specific hospital stays in under 18s
5
Source: PHE, Local
Health – Public
Health England

Cherw
ell D
istr
ict
Sum
mary
6
Not in education, employment or
training
Homeless households in priority need
Adults overweight
or obese
Deaths from drug misuse
(3 years)
New Sexually Transmitted Infections
Mothers smoking at birth
Babies born
West Oxonpopulation
Year 6 children overweight or obese
Apprentice-ships started
Reception children overweight or obese
Under 18 conceptions
Average female salary
Average male salary
Adults are physically
active
Adults have chronic obstructive pulmonary
disease
Adults diagnosed with
depression
Adults with coronary heart
disease
Adults with long-term illness or
disability
Deaths from cancer
Deaths from suicide (3 years)
Occurrences of domestic
abuse
Households in fuel poverty
Adults with diabetes
Average female life expectancy
Adults with dementia
People had a stroke
Hospital admissions due
to falls
Unpaid carers
Average male life
expectancy
Under 18s hospital admissions for
alcohol (3 years)
Average house price
%PRE-BIRTH BIRTHEARLY YEARS
OLDER PEOPLE
END OF LIFE
WORKING AGE
SECONDARY SCHOOL
PRIMARY SCHOOL
Adults smoke
Children living in low income families
Adults are unemployed
Killed or seriously injured on roads
http://insight.oxfordshire.gov.uk/cms/joint-strategic-needs-assessment Updated June 2020Icons designed by Freepik from Flaticon
Died at home
7.5%
West Oxfordshire District health & wellbeing facts and figures 2020
1,060 109,800 7.9%
2263241725135
1,009 £391,811 £29,336 £36,917 1,300 61
459,32160.6%1,81769.2%9,6793,283
20
215
28 858 15,149 6 332 1,704 3,381 5,204
10,35849581.984.663.3% 2,3891,242
15-24s diagnosed with Chlamydia
Alcohol hospital admissions aged 40-64

Cherw
ell D
istr
ict
Sum
mary
West Oxfordshire inequalities summary
In West Oxfordshire,
fourteen out of twenty-
seven wards have no
indicators worse than
average
Wards with the most
indicators worse than
average are Chipping
Norton and Witney
Central. These two
wards also have the
fewest indicators
significantly better
than average
7Tartan Rug
0 0 2 2 0 2 2 2 0 2 3 1 2 2 2 1 2 0 2 2 0 2 2 2 2 2 2
0 2 2 2 1 3 2 2 0 1 3 2 2 2 2 1 2 0 2 2 2 2 2 2 1 2 2
0 0 2 0 0 2 2 2 0 2 3 1 2 1 2 2 0 0 2 2 0 3 2 2 2 1 1
0 1 2 0 0 3 3 2 0 1 2 2 2 1 2 2 1 0 2 1 2 3 2 2 2 1 1
0 0 2 0 0 2 2 2 0 2 3 2 2 1 2 2 0 0 0 2 0 2 2 2 2 1 1
0 1 2 0 0 3 3 2 0 2 2 2 2 1 0 0 1 0 0 1 2 3 2 2 2 1 2
1 1 2 2 2 1 1 1 2 2 2 1 2 1 1 1 1 1 1 1 1 3 1 2 3 1 1
1 1 2 1 1 1 1 1 3 1 3 1 2 1 1 1 1 1 1 1 1 3 2 1 3 1 1
2 2 2 2 2 2 2 2 2 2 2 2 2 2 2 1 2 2 2 1 2 2 2 2 2 2 1
2 2 2 2 2 2 2 2 2 2 2 2 2 2 1 2 2 2 2 2 2 2 2 2 2 2 2
2 3 2 2 2 2 2 2 3 2 3 2 2 2 1 3 3 2 2 2 2 2 1 1 2 2 2
2 0 2 2 2 2 2 2 0 0 2 2 2 2 2 2 0 0 2 2 2 2 2 2 2 2 2
2 2 2 2 2 2 2 2 2 2 2 2 2 2 2 2 2 2 2 2 2 2 2 2 2 2 2
2 2 2 2 2 2 2 2 2 2 2 2 2 2 1 2 2 2 2 2 2 2 2 2 2 2 2
3 2 2 3 3 2 2 1 2 2 2 2 2 2 2 2 2 2 2 2 2 3 2 2 3 2 2
2 2 2 2 2 1 2 2 2 2 2 2 2 2 2 1 2 2 2 1 2 3 2 2 3 2 1
1 1 1 1 1 1 1 1 1 1 1 1 1 1 1 1 1 1 1 1 1 1 1 1 1 1 1
1 1 1 1 1 1 1 1 1 1 2 1 1 1 1 1 1 1 1 1 1 1 1 1 1 1 1
2 1 1 2 2 2 2 2 1 1 2 2 2 2 1 1 1 1 1 2 2 1 1 1 1 2 2
2 2 2 2 2 2 2 2 2 2 2 2 1 2 2 1 2 2 2 1 2 2 2 2 1 2 1
2 2 1 2 2 2 2 2 2 1 2 2 2 2 2 2 2 2 1 2 2 2 2 2 2 2 2
2 2 2 2 2 2 2 2 2 2 2 2 2 2 2 2 2 2 2 2 2 2 2 2 2 2 2
2 2 2 2 2 2 2 2 2 2 3 2 2 2 2 2 2 2 2 2 2 2 2 2 2 2 2
2 2 2 2 1 2 2 2 2 2 2 2 2 2 2 2 2 2 2 2 2 2 2 2 2 2 1
2 2 1 1 1 2 2 2 2 2 2 1 2 1 2 1 2 2 2 1 2 2 2 1 2 2 2
2 1 1 1 2 1 1 2 1 2 3 1 1 1 1 2 1 1 1 2 1 2 1 1 2 2 1
2 3 2 2 1 2 2 2 2 2 3 1 2 3 2 1 1 2 2 2 2 2 2 1 2 2 2
2 2 1 1 1 2 2 1 2 1 2 2 2 1 1 1 2 2 2 2 2 2 1 2 2 1 2
Emergency hospital admissions for heart attack (MI)
Emergency hospital admissions for hip fracture, over 65s
All cancer incidence (new cases of cancer)
Deaths from all cancers, age under 75 years
Deaths from circulatory disease, age under 75 years
Hospital admissions for injury, ages 0-14 years
Hospital admissions for injury, ages 15-24 years
Deaths from respiratory diseases
Deaths from stroke
Preventable mortality
Hospital admissions for self-harm
Hospital admissions for alcohol-attributable conditions
Emergency hospital admissions for COPD
Emergency hospital admissions for CHD
Emergency hospital admissions for Stroke
Alv
esc
ot
and F
ilkin
s
Asc
ott
and S
hip
ton
Bam
pto
n a
nd C
lanfi
eld
Chadli
ngto
n a
nd C
hurc
hil
l
Bri
ze N
ort
on a
nd S
hil
ton
Burf
ord
Cart
ert
on N
ort
h E
ast
Cart
ert
on N
ort
h W
est
Sta
ndla
ke,
Ast
on a
nd S
tanto
n H
arc
ourt
Fre
ela
nd a
nd H
anboro
ugh
Life expectancy at birth (Males)
Wit
ney E
ast
Woodst
ock a
nd B
ladon
Mil
ton-U
nder-
Wychw
ood
Nort
h L
eig
h
Sto
nesf
ield
and T
ackle
y
The B
art
ons
Wit
ney N
ort
h
Wit
ney S
outh
Wit
ney W
est
Wit
ney C
entr
al
Kin
gham
, R
oll
right
and E
nst
one
Charl
bury
and F
inst
ock
Hail
ey,
Min
ster
Lovell
and L
eafi
eld
Healthy life expectancy at birth (Females)
Cart
ert
on S
outh
Hospital admissions for injury, ages 0-4 years
Duckli
ngto
n
Eynsh
am
and C
ass
ingto
n
Chip
pin
g N
ort
on
Disability-free life expectancy at birth (Males)
Disability-free life expectancy at birth (Females)
Income deprivation affecting children
Income deprivation
Child development at age 5 years
Emergency hospital admissions, ages 0-4 years
Obesity: Reception year
Obesity: Year 6
Life expectancy at birth (Females)
Healthy life expectancy at birth (Males)
For more information, see the Inequalities Indicators Excel Pack
Data are shown at ward level for ward boundaries in place in 2016. Health state life expectancy indicators use ward boundaries in place prior to 2016 which may be different from current boundaries and cause discrepancies in the tartan rug. These indicators are shown in a paler colour scheme.
Significantly worse than
Oxfordshire or England
Statistically similar to
Oxfordshire or England
Significantly better than
Oxfordshire or England

Cherw
ell D
istr
ict
Sum
mary
Index of Multiple Deprivation 2019 at national level
The map shows that most LSOAs (Lower Layer Super Output Areas) in West Oxfordshire are relatively more deprived.
According to the IMD rank of average summary measure West Oxfordshire ranked 301 out of 317 in 2019 compared to 307 out of 326 in 2015.
The most deprived areas in West Oxfordshire are in parts of Chipping Norton, Witney East and Witney South all in the 40% most deprived areas nationally.
8
Source: Indices of Multiple Deprivation 2019
Mapped by District Data Analysis service
The decile bar above shows LSOAs grouped according to how deprived they are , where 1 is most deprived and 10 is least deprived.
EXPLORE the data for districts and small areas with our interactive deprivation dashboard

Cherw
ell D
istr
ict
Sum
mary
IMD Ranking within West Oxfordshire
This map shows how all the LSOAs within West Oxfordshire compare to each other.
Areas in the 10% most deprived within West Oxfordshire are in parts of Chipping Norton, Eynsham & Cassington, Witney Central, Witney East, Witney North and Witney South.
Parts of Alvescot & Filkins, Carterton North West, Chadlington & Churchill, Eynsham & Cassington, and Kingham, Rollright & Enstoneare within the 20% most deprived areas in the district.
9
Source: Indices of Multiple Deprivation 2019
Mapped by District Data Analysis service
The decile bar above shows LSOAs grouped according to how deprived they are , where 1 is most deprived and 10 is least deprived.
EXPLORE the data for districts and small areas with our interactive deprivation dashboard
Cherw
ell D
istr
ict
Sum
mary
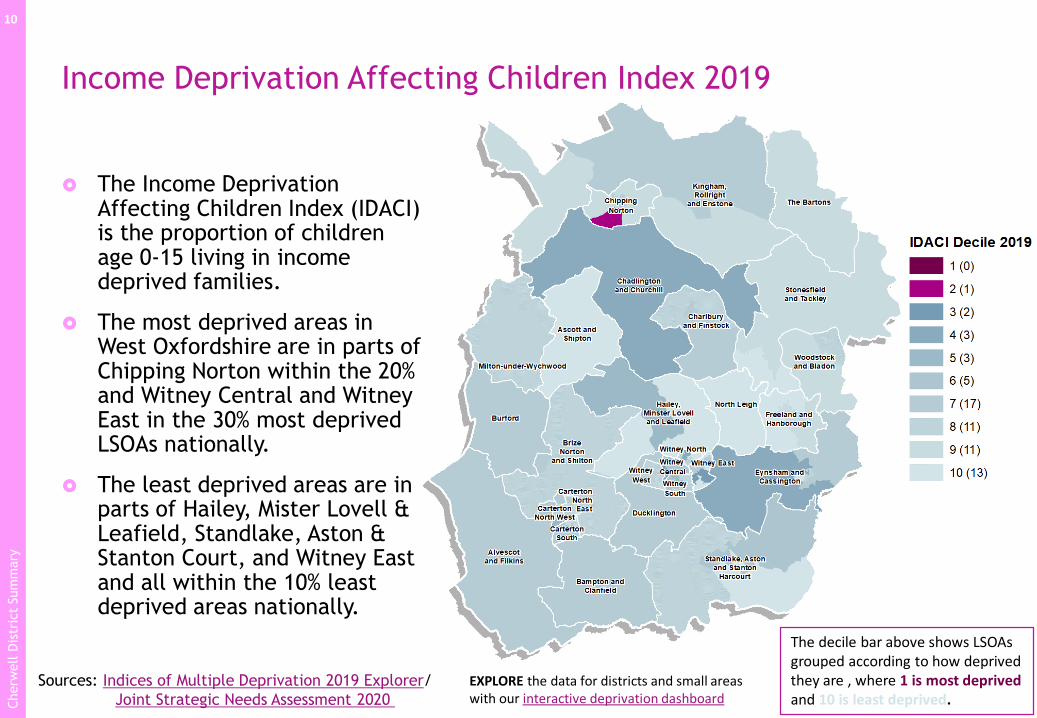
Income Deprivation Affecting Children Index 2019
The Income Deprivation Affecting Children Index (IDACI) is the proportion of children age 0-15 living in income deprived families.
The most deprived areas in West Oxfordshire are in parts of Chipping Norton within the 20% and Witney Central and Witney East in the 30% most deprived LSOAs nationally.
The least deprived areas are in parts of Hailey, Mister Lovell & Leafield, Standlake, Aston & Stanton Court, and Witney East and all within the 10% least deprived areas nationally.
10
Sources: Indices of Multiple Deprivation 2019 Explorer/
Joint Strategic Needs Assessment 2020
The decile bar above shows LSOAs grouped according to how deprived they are , where 1 is most deprived and 10 is least deprived.
EXPLORE the data for districts and small areas with our interactive deprivation dashboard

Cherw
ell D
istr
ict
Sum
mary
Income Deprivation Affecting Older People Index 2019
The Income Deprivation Affecting Older People Index (IDAOPI) is the proportion of those age 60 or over who experience income deprivation.
The most deprived areas on the IDAOPI in West Oxfordshire are in parts of Witney East within the 30%, Eynsham & Cassington, and Witney North within the 40% most deprived LSOAs nationally.
The least deprived areas are in parts of Freeland and Hanborough, Witney North and Witney South all within the 10% least deprived areas nationally.
11
Sources: Indices of Multiple Deprivation 2019 Explorer/
Joint Strategic Needs Assessment 2020
The decile bar above shows LSOAs grouped according to how deprived they are , where 1 is most deprived and 10 is least deprived.
EXPLORE the data for districts and small areas with our interactive deprivation dashboard

Cherw
ell D
istr
ict
Sum
mary
Finding out more12
The latest JSNA giving health and wellbeing facts and figures for Oxfordshire is
available on Oxfordshire Insight
Oxfordshire 2020 JSNA report
ANNEX: Inequalities indicators ward level data
Ward inequalities indicators excel pack including OCCG and District summaries
Public Health Dashboards
Health Needs Assessments
Community Health and Wellbeing Profiles
Public Health England provides a wide range of health indicators and profiles on
Fingertips
ONS population estimates and population projections for county and districts,
benefits claimants and the annual population survey are available from
www.nomisweb.co.uk
Oxfordshire County Council population forecasts are published on Oxfordshire Insight
(select “future population change”)
http://insight.oxfordshire.gov.uk/cms/population-0