west virginia division of highwaystransportation.wv.gov/highways/mcst/documents/aggreg… · ·...
TRANSCRIPT

Aggregate
Sampling Inspector
Programmed Instruction
Manual
West Virginia
Division of Highways

Contents
Chapter 1 General Information ....................................................................................... 1
Introduction .................................................................................................................. 1
Definitions .................................................................................................................... 2
Sampling Techniques .................................................................................................. 7
General Sampling Information ................................................................................... 13
Questions ................................................................................................................... 16
Answers ..................................................................................................................... 18
Chapter 2 Sampling Methods and Equipment ............................................................... 19
Introduction ................................................................................................................ 19
Sampling Procedures ................................................................................................. 19
The Importance of Randomization .......................................................................... 20
Aggregate Sampling Procedure - MP 700.00.06 .................................................... 22
Terminology ........................................................................................................ 22
Roadway Sampling ............................................................................................. 26
Conveyor Belt Sampling ..................................................................................... 31
Flowing Aggregate Stream Sampling ................................................................. 34
Stockpile Sampling ............................................................................................. 37
Spreader Box Sampling ...................................................................................... 40
Sample Weights Required ......................................................................................... 41
Transporting Samples ................................................................................................ 42
Planning Your Sampling Program .............................................................................. 42
General Information ................................................................................................... 43
Sample Questions ...................................................................................................... 46
Answers: ................................................................................................................. 51
Appendix I – WV DOH Construction Manual.............................................................. 52
Appendix II – Material Procedure 700.00.06 .............................................................. 63

Appendix III - AASHTO Table 703.4 .......................................................................... 74
Appendix IV – Table 704.6.2 – Bases ........................................................................ 76
Appendix V – West Virginia Division of Highways – Form T100 ................................ 78
Appendix VI – Rounding Procedures ......................................................................... 80

Instructions
This manual has been prepared to assist you in learning the basic theories
associated with aggregate sampling techniques, and to present acceptable aggregate
sampling methods supported by West Virginia Division of Highways’ policies and
procedures. The information contained herein is intended to prepare you for the written
examination for certification as an Aggregate Sampling Inspector.
When using this book you should not attempt to read the pages in consecutive
order as you would a conventional book. The booklet has been prepared similarly to
what is sometimes called ‘programmed instruction’ and as a result you will be guided by
instructions found throughout the text which will tell you what page or document to go to
next. In some cases you will be given questions or problems with several answers and
asked to make a choice. Associated with these choices will be instructions on which
page or section you should refer to check your choice. Additional instructions will then
be provided on that page, and so forth.
Finally, the information contained in the booklet is intended to be used in
conjunction with Materials Procedure (MP) 700.00.06: Aggregate Sampling
Procedures. With few exceptions, this MP reflects the sampling procedures and
general intent contained in AASHTO T2: Sampling of Aggregates. A copy of MP
700.00.06 is provided in the Appendix. Other applicable support documents are also
contained in the Appendix. These documents will be referenced throughout this
manual.

1
Chapter 1
General Information
Introduction
As in any course of study, there are topics that relate to, or at least help clarify,
our understanding of the subject in question. Since this manual is about taking
aggregate samples it seems necessary to discuss just what an aggregate is and
why we want to take samples in the first place; and at what frequency, how much
do we need, etc. Taking an aggregate sample seems easy enough. With a
shovel, dig up some rocks and then put them in a bag but, as usual, there is
more to it than that. And it is always well to remember that no matter how trying
the sampling chore seems somebody somewhere has a lot invested in that
sample and what it represents. That is probably one of the most important things
to remember when sampling. THE BAG OF ROCKS MAY ONLY WEIGH
ABOUT 50 POUNDS, BUT WHAT IT REPRESENTS COULD WEIGH 300
TONS. When you talk about quantities like that, things begin to get serious. In
most cases the Sampling Inspector will be taking samples to determine the
aggregate’s grading characteristics. On occasion the inspector may be called
upon to take a sample to determine its quality characteristics, like liquid limit or
crush count. Whatever the case may be, the sampling methods offered for study
in this manual have proven to be reliable and consistent with the Division’s
acceptance criteria.
This chapter is intended to familiarize the inspector with many of the terms and
even the philosophy behind some of the sampling procedures. It is absolutely
imperative that the inspector acknowledge his/her importance in the total process
of project activities. Sampling is equally important as testing. On occasion

2
throughout this book there will be some discussion about another book called the
Construction Manual. The Construction Manual, among many other things, is a
manual that provides guidance for establishing uniform procedures for
supervision, inspection, and documentation of projects under construction.
Although it is not necessary to have a complete copy of the Construction Manual
in the context of this study, a copy of the sampling frequencies that are given in
the manual are contained in Appendix I (page 52). Sampling frequencies and
Appendix I will be further discussed on page 7 and 8. It is, however, necessary
to have a complete copy of Materials Procedure (MP) 700.00.06 titled
AGGREGATE SAMPLING PROCEUDURE. This MP has been included as
Appendix II (page 63). During the course of this study it will be necessary for you
to review and understand the MP since it lists the sampling procedures which will
be studied. The MP will be discussed throughout Chapter Two. The following
definitions are of some of the terms a Sampling Inspector should be familiar.
These terms will be further defined and used in Chapter Two.
Definitions
Quality Control Sample – For the most part these are samples taken and tested
by the contractor or his/her representative to control the product. Quality control
samples are taken at the minimum frequencies given in the Construction Manual
and other support documents for applicable items. These samples have also
been referred to as process control samples. The frequency table in the
Construction Manual will be discussed further on pages 7 and 8.
Verification (Acceptance) Samples – Verification samples are taken and tested
by the Division of Highways to validate the quality of the product. As a general
rule, for applicable aggregate items, verification samples are taken at a
frequency of approximately 10 percent of the contractor’s quality control samples.
There are some aggregate items, however, where the Division of Highways takes
3
all the samples at the required frequency. These samples are still, of course,
referred to as verification samples.
Aggregates – Aggregates are a collection of inert mineral matter (particles),
either crushed or uncrushed, which have been properly sized for the use
intended. Aggregates are usually referred to as coarse aggregates or fine
aggregates. For the most part an aggregate that is predominantly retained on
the No. 4 sieve is called a coarse aggregate. An aggregate that predominantly
passes the No. 4 sieve is referred to as a fine aggregate. In most cases, when a
sample is taken in the field it is thought of as a coarse aggregate (like a base
course) or a fine aggregate (like a silica or limestone sand). A coarse aggregate,
however, can have two parts; a coarse part and a fine part. To get a good
sample both parts must be properly represented.
Graded (or sized) Aggregate – An aggregate that has been specifically sized or
blended during the production process to satisfy a construction item specification.
An aggregate producer, during the crushing and screening operation, goes to a
lot of trouble and expense to produce a product that upon leaving the production
site meets the desired grading specification. The last thing the producer,
contractor, or Division of Highways needs is someone that does not know how to
take a sample. An example of a graded (or sized) aggregate would be an
American Association of State Highway and Transportation Officials (AASHTO)
No. 57 being incorporated in a concrete mix, or an AAASHTO No. 8 being used
in an asphalt mix. The AASHTO sizes are listed in Table 703.4 of the West
Virginia Department of Highway’s Standard Specifications. A copy of this table is
attached as Appendix III. Turn now to Appendix III (page 74) and review the
table then continue to the next paragraph for an explanation on how to use the
table.
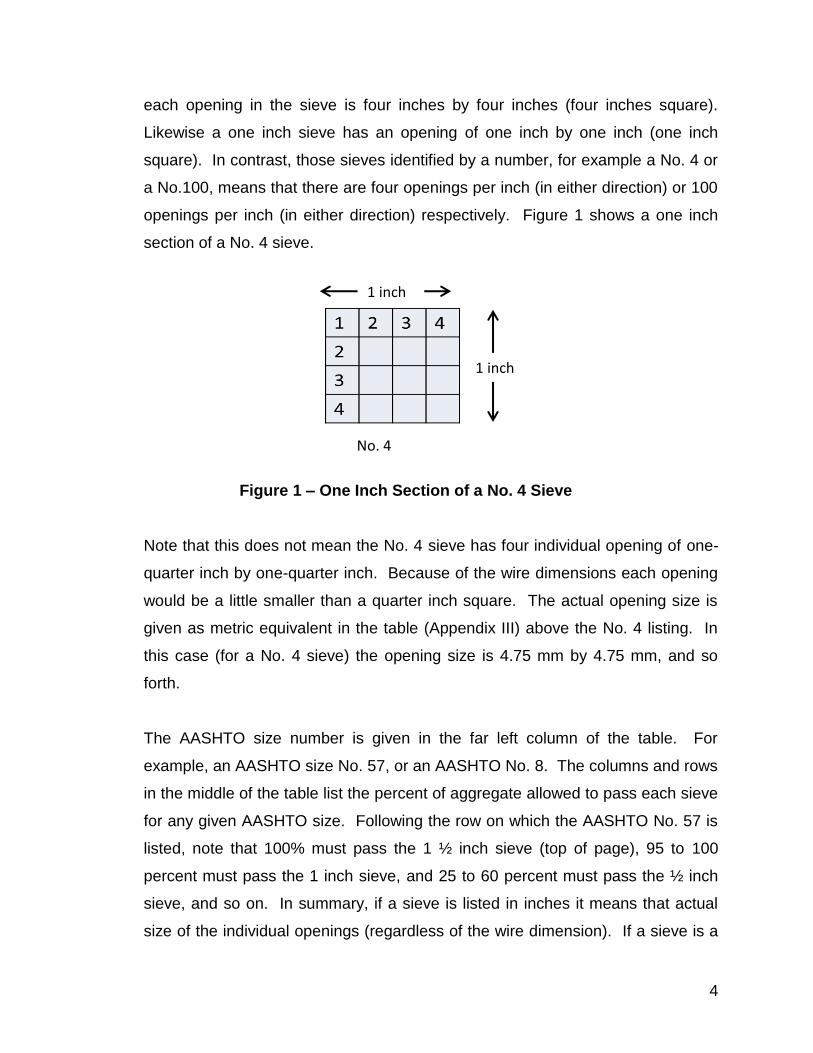
In the table, sieve sizes are listed across the top with the largest size being four
inches and the smallest size being a No. 100 sieve. A four inch sieve means
4
each opening in the sieve is four inches by four inches (four inches square).
Likewise a one inch sieve has an opening of one inch by one inch (one inch
square). In contrast, those sieves identified by a number, for example a No. 4 or
a No.100, means that there are four openings per inch (in either direction) or 100
openings per inch (in either direction) respectively. Figure 1 shows a one inch
section of a No. 4 sieve.
Figure 1 – One Inch Section of a No. 4 Sieve
Note that this does not mean the No. 4 sieve has four individual opening of one-
quarter inch by one-quarter inch. Because of the wire dimensions each opening
would be a little smaller than a quarter inch square. The actual opening size is
given as metric equivalent in the table (Appendix III) above the No. 4 listing. In
this case (for a No. 4 sieve) the opening size is 4.75 mm by 4.75 mm, and so
forth.
The AASHTO size number is given in the far left column of the table. For
example, an AASHTO size No. 57, or an AASHTO No. 8. The columns and rows
in the middle of the table list the percent of aggregate allowed to pass each sieve
for any given AASHTO size. Following the row on which the AASHTO No. 57 is
listed, note that 100% must pass the 1 ½ inch sieve (top of page), 95 to 100
percent must pass the 1 inch sieve, and 25 to 60 percent must pass the ½ inch
sieve, and so on. In summary, if a sieve is listed in inches it means that actual
size of the individual openings (regardless of the wire dimension). If a sieve is a
1 inch
No. 4
Sieve
1 inch

5
numbered sieve, like a No. 16, it means the number of openings per inch (in
either direction), sixteen in this case. And AASHTO sizes define specific
gradations for specific uses. So, after the aggregate producer crushes and
screens aggregate to meet one of the AASHTO sizes, it is the responsibility of
the sampler to best represent the producer’s efforts. More will be said about
some of the other terms listed on the table later. In addition to AASHTO sizes,
the Division of Highways has other sizes categorized as ‘Classes’. Table 704.6.2
(Appendix IV, page 76) lists the gradation and quality requirements of the various
classes of aggregate sizes. This table is read essentially the same as the
AASHTO table.
Gradation - Gradation is the particle size distribution of aggregates determined
by using sieves with square openings. The percentage of materials allowed to
pass each sieve is usually referred to in the specification for the intended item.
For instance, the specifications may call for an AASHTO No. 57. The gradation,
after sampling, is tested and checked for conformance in accordance with the
AASHTO table mentioned above. We say that an aggregate is uniform, or well
graded, when the various sizes represented produce a dense mixture as each
smaller size fills the voids in the next larger size. However, when a well graded
aggregate is moved, stockpiled, etc., there is a tendency for the particle sizes to
separate into layers with the larger pieces at the bottom and the finer pieces at
the top (especially when stockpiling). This separation is known as segregation.
Because there is, and always will be, some segregation occurring when handling
aggregates, the specifications give a range of percentages that may pass any
given sieve. If, when the aggregate is graded, the percentage passing each
sieve falls within the specified range we say that the aggregate meets the
specifications.
Sometimes, though, handling (stockpiling, hauling, etc.) of the aggregate
produces what is referred to as a poorly grade aggregate. In this case, as
already mentioned, the various particle sizes separate to the extent that no

6
matter how a sample is taken it will not reflect its original processed gradation,
unless, of course, the whole stockpile is graded (tested). A poorly graded
aggregate will contain an excess of one or more particle sizes and not enough of
an intermediate size. The intermediate size may be concentrated somewhere
else not being sampled. Sometimes this is referred to as being gap graded and
most likely will fail to meet the specification requirements when tested. The
sampling methods developed in Chapter 2 and MP 700.00.06 attempt to
overcome some of these problems by taking incremental samples from different
areas of the material being represented.
Sample – A representative part or a single item from a larger whole or group
especially when presented for inspection or shown as evidence of quality. This
definition was taken from Webster’s Collegiate Dictionary but serves our purpose
very well. Taking some liberties with Webster’s definition, another way to say
this is: a representative part (sample) taken to show evidence of the quality of the
whole (sublot). This ties in with what was stated earlier about 50 pounds of rock
representing 300 tons. The part about being representative is equally important.
It does little good to take a sample from an area that looks better, or worse, than
another area. The goal when sampling is to take a sample completely without
bias or in other words, as random as possible.
Random Sample – A sample that is taken from a point whose location depends
entirely on chance. When a sample is taken at random the notion of bias is
removed. If a sample is taken from a point (as mentioned above) because the
material at that point looks good, or bad, or even average, the sample is said to
be biased. This simply means that the sampler may (unwittingly) influence the
outcome of the test results. By taking a random sample, representation is
assured to the satisfaction of all parties.

7
Sampling Techniques
There are many complex statistical methods that have been developed to
describe sampling techniques. These methods all have one thing in common,
and that is to best represent the material in question. The best way to find out
what the gradation is of 300 linear feet of in-place base course is to remove the
entire 300 feet of aggregate in some giant bag, dump it into a giant shaker, and
then run the sieve analysis. This method would certainly tell you what the
gradation is (or was) but it would be of little use since there would be no material
left on the roadway. This would be like eating the whole pot of soup just to see if
it was good enough to serve. So, sampling methods have been developed to
best represent the material but leaving as much of it in-place as possible. The
actual sampling methods that the Division of Highways uses are described in
Chapter 2 and MP 700.00.06, but for now look at some of the elements that have
to be considered when developing a good sampling plan:
1. Sampling frequency - This is usually determined based on some quantity
of material or time frame. An example would be the Division’s
requirement to take a base coarse sample each on-half day of placement.
In this case the frequency is based on a time frame and not necessarily
tied to any quantity. Some sampling frequencies for quality, like fractured
particles, are based on quantities. In this case, we take one sample per
each 10,000 tons used.
2. Sampling site – Depending upon the specific item, all samples should be
taken from the same site. For instance, base course samples should be
taken from the roadway prior to compaction.
3. Sampling method – Obviously a uniform procedure is needed to obtain
the samples. Depending upon the item, each sample taken must be taken
in the same way. Methods have been developed which provide for
consistent sampling techniques and these are described in Chapter 2 and
MP 700.00.06.

8
4. Sample quantity – the sample must be of a sufficient size to make sure
there is enough material to conduct the test.
5. Random sample – As already mentioned above, the actual point of
sampling from the roadway, conveyor belt, etc. must be determined in a
random manner. Random sampling, no matter what the item, is the
foundation upon which everything else is built.
The first of the sampling elements listed above was sampling frequency. Recall
that it was mentioned earlier that the Construction Manual contains tables that
give the various sampling frequencies established for most of the material (items)
used in highway construction. Table 700.3 of the Construction Manual contains
this materials list and their corresponding sampling frequencies necessary for
acceptance. For example, go to Appendix I (page 52), which contains the list of
materials and frequencies. Under the heading of AGGREGATES (GRADATION
CHECK), Base Course and Subbases (page 53), note that the minimum
frequency is given as each one-half day of operation or as established by the
Contractor’s quality control program. What this means is that under normal
circumstances when base course is being placed the Division needs at least one
sample for each one-half day of placement in order to represent the material.
For Portland Cement Concrete (see list on page 53) the sampling frequency for
gradation is one sample for each day of operation, and so forth. Notice that the
frequencies are not necessarily tied to quantities. Because of start-up times,
down times, etc., quantities produced or placed in a half day (or whole day as the
case may be) may be different. For this reason each sample, even taken at the
same frequency, will usually end up representing different quantities of material.
And this is all right. It is the contractor’s responsibility under the specifications,
and in accordance with his approved Quality Control Plan, to sample at the
required frequency for applicable items. It is absolutely essential that the
Sampling Inspector be aware of the frequency for all items to be sampled.

9
In addition to the Construction Manual, frequencies may also be obtained from
the contractor’s Quality Control Plan which should be available at the project
office or at the plant, whichever the case may be. Briefly, with regard to the
contractor’s Quality Control Plan, the contractor is required to submit to the
Division of Highways a plan detailing how he/she will control specific items. The
plan, normally submitted prior to construction at the Pre-Construction
Conference, lists where material will be sampled (roadway, bin, etc.), the
frequency, who will be doing the sampling, and any other pertinent information
required. After approval by the Division of Highways, the Quality Control Plan
becomes a part of the contract procedures to which the contactor is required to
follow.
The second sampling plan element previously mentioned is the sampling site.
Since the Division is mostly interested in the gradation of the item just prior to its
incorporation into the final product, the sampling location is normally at the last
practical point where the sample can be taken. Note here that for
AGGREGATES (GRADATION Check) Base Course and Subbases, under the
heading ‘REMARK’ in the Construction Manual (Appendix I, page 53), that the
material shall normally be sampled from the roadway prior to compaction. Also
note, under the ‘REMARK’ heading, there is reference to an ‘ML-26’. This
designation, which stands for ‘Material letter – 26’, has since been revised to the
new designation MP 700.00.06 (Appendix II, page 63). In the case of Portland
Cement Concrete, no sampling point is given but could be from the conveyer belt
or some other practical point prior to mixing as per MP 700.00.06. The sampling
location should also be listed in the contractor’s approve Quality Control Plan.
The third element mentioned was the sampling method. Sampling methods have
been devised to best represent the material being sampled. It is the Division’s
intent that every sampler takes his/her sample the same way. This exercise
guarantees that no matter who takes a sample (either the contractor or the
Division of Highways) the material will be represented consistently and in

10
accordance with proven standards. This also eliminates the argument that the
failing sample was taken improperly.
The sample quantity (fourth element listed on page 8) may be thought of in two
different ways. First is the quantity (size or weight) of the field sample. The
second is the sample size of the test portion. The field sample size is what the
Sampling Inspector must be concerned about. The test portion size is what the
technician at the laboratory is concerned about. The laboratory technician must
have enough material available to adequately split the sample down to the proper
test portion size. The laboratory technician has his/her own set of guidelines that
must be followed. Obviously if the Sampling Inspector does not provide enough
material to the laboratory, then a meaningful test cannot be conducted. This is
important to remember. The Sampling Inspector is the initiator of all the
subsequent steps necessary to accept some quantity of material. But how does
the Sampling Inspector know what size sample is required for the field sample?
Field sample sizes are determined by the nominal maximum size of the
aggregate being sampled. In other words, the nominal maximum size of the
aggregate determines how ‘big’ the sample has to be to send to the laboratory.
Nominal maximum size is defined in MP 700.00.06 (Table I) along with the list of
minimum weights required for the field sample. Go to Table 1 (Appendix II, page
71) and study the definition of nominal maximum size, and then return here.
Now, what this definition means is, when sampling a Class 2 base course, the
sampler has to know the gradation of a Class 2 aggregate and then from that
determine its nominal maximum size. ‘Class’ sizes were briefly discussed on
page five (5). Table 704.6.2 of the West Virginia Division of Highways Standard
Specifications (see Appendix IV, page 76) lists the gradation for a Class 2 as
follows:

11
Sieve = 1 ½ inch ¾ inch No.4 No.40 No. 200
% Passing = 100% 80 – 100% 35 – 75 % 10 – 30% 0 – 10%
The definition tells us that the nominal maximum size is the largest sieve size
listed in the applicable specification upon which any material is permitted to be
retained. In other words, some material may or may not be retained. For a
Class 2 aggregate the largest sieve listed in the 1 ½ inch sieve, but the
specification directs that 100 percent must pass this sieve. No material is
permitted to be retained on this sieve so it does not fit the definition. The second
largest sieve size listed in the specification is the ¾ inch sieve. The
specifications direct that from 80 to 100 percent of the material may pass this
sieve. This means that up to 20 percent of the sample is permitted to be retained
on this sieve. If only 80 percent passes, obviously 20 percent is retained. So,
the second sieve listed, that being ¾ inch, would be considered the nominal
maximum size. Go to Table I in MP 700.00.06 (page 71) to determine the field
sample size required. Locating the ¾ inch sieve in the left column marked ‘Sieve
Size’ look at the corresponding sample size in the right column. Note that a
minimum of 55 pounds (25,000 grams) is required for the field sample weight.
The sample weights offered in the table are such that no matter what test, or
tests, may be conducted on the sample, sufficient material should be available.
Look at the following example:
Example 1 – AASHTO No. 57 Limestone
Sieve = 1 ½ inch 1 inch ½ inch No. 4 No. 8
% Passing = 100% 95 – 100% 25 – 60 % 0 – 10 % 0 – 5%
In this case what would be the nominal maximum size? This example is no
different than the Class 2 we looked at before. According to the gradation
specification 100 percent must pass the 1 ½ inch sieve. No material at all is
permitted to be retained on this sieve. On the second sieve some material may

12
be retained, as long as it is not more than 5 percent since the range for passing
material is 95 to 100 percent. Nothing has to be retained on this sieve since 100
percent may pass but up to 5 percent is permitted to retain which would leave 95
percent of the sample going through the sieve. So the second sieve, the 1 inch
sieve, would be considered the nominal maximum size. Once the nominal
maximum size is determined, the next step is to determine what size sample is
needed. This is done by referring to Table I in MP 700.00.06 as before.
Although this seems rather straightforward, there is an exception. Recall, the
definition for nominal maximum size goes on to state that where the specified
gradation has no sieve with a range of X% to 100% passing, then the next
smallest standard sieve, as listed in Table 1 (of MP 700.0.06), below which 100
percent must pass will be considered the nominal maximum size. Most gradation
specifications referenced by the Division of Highways list the largest sieve as 100
percent passing.
In most cases the second largest sieve listed, is X% to 100% (for instance 95%
to 100% for the No. 57 in the previous example). There are a few gradation
specifications, however, like Class 1 base course, whose gradation specification
is as follows:
Example 2 – Class 1 Base Course
Sieve = 1 ½ inch ¾ inch No. 4 No. 40 No. 200
%Passing = 100% 50 – 90% 20 – 50% 5 – 20% 0 – 7%
In this case there is no sieve size that has a range from X% to 100%. For
instance, nothing is permitted to be retained on the first sieve (the 1 ½ inch); all
material must pass. On the second sieve the requirement is that some material
must be retained.
13
To solve this problem the definition of nominal maximum size says to consider
the next smallest size listed in Table I (page 71 in the MP), below which 100
percent must pass to be considered the nominal maximum size. So, 100 percent
must pass the 1 ½ inch sieve, and the next smallest sieve listed in Table 1 after
the 1 ½ inch sieve is the 1 inch sieve. The nominal maximum size for a Class 1
aggregate is therefore 1 inch even though the 1 inch sieve is not listed in the
Class 1 specifications. In most cases, all that is needed to remember is that if a
gradation specification has a sieve with a range of X% to 100% passing, then
that particular sieve is considered the nominal maximum size. If it does not have
such a sieve, then the nominal maximum size is the next smaller sieve, as listed
in Table 1, below the sieve which 100 percent must pass. Note that all the
AASHTO sizes in Table 703.4 (Appendix III, page 74) have the second sieve
listed with a range of some value X% to 100 percent passing.
Finally, the fifth element (page 8) in any good sampling plan is random sampling.
Everything stressed so far is of utmost importance when taking samples.
However, the randomization of sample selection, as already mentioned, is
fundamental to the whole process. Each sample must be taken from a point
whose location depends entirely on chance. Another way to say this is that every
point (location) of the material to be represented must have an equal chance of
being selected. Methods of random sampling are described in Chapter 2.
General Sampling Information
Under the West Virginia Division of Highways Standard Specifications the
contractor is responsible for quality control tests. The Division of Highways is
responsible for verification (acceptance) tests. This was mentioned in the
definitions on page two (2). So, the tests the contractor or his/her representative
performs are referred to as a quality control tests. The contractor does not take
verification tests, and the Division of Highways does not take quality control tests.
The identity of these two types of tests should be kept clear. It is important for

14
the Sampling Inspector to be aware of the sampling frequencies of quality control
samples for the applicable items listed in the contractor’s Quality Control Plan.
This is true whether the samples to be taken are for gradation analysis or for
some quality characteristic. All samples, either quality control or verification,
must be taken because the item’s acceptance is usually based on consecutive
samples taken at the required frequency. If a quality control sample is missing,
for whatever reason, the associated sublot quantity is left without gradation or
quality representation.
One other thing should not be overlooked, and that is sample identification.
What good does it do if the sample is taken perfectly but not properly identified?
The Division of Highways provides a form called the T100 Form, a copy of which
is attached in Appendix V (page 78). The Sampling Inspector should become
familiar with this form and include it, or something similar, with each sample
taken before it is sent to the laboratory. It does not matter whether the
contractor’s inspector or the Division of Highways’ inspector takes the sample;
the sample’s identification must be included. All pertinent data, such as the
laboratory number, project, date sampled, sampler’s name, and so on, should be
included. The technician at the laboratory needs to know the type (Class 1, No.
57, etc.) to first determine the test portion size and second, after completing the
test he/she will be able to evaluate the sample with respect to the item’s
specification. The form with all identifying data must accompany the sample to
the laboratory. It is also necessary to mark on the outside of the sample bag (or
other suitable container) the assigned sample number (if one is available) and
any other pertinent information, like project number date sampled, field sample
number, etc. This information helps identify the sample when there is more than
one sample coming to the laboratory at the same time. Division of Highways
personnel will assign laboratory numbers to all samples taken at the project site
by either the contractor or the Division.

15
Everything that the Sampling Inspector does, or doesn’t do, can affect the final
outcome of the sample results. As was stated before, sampling is equally as
important as testing. The Sampling Inspector is the first person in a sequence of
persons who are involved in the material’s acceptance procedures. If the
Sampling Inspector errs, what good is the test? Chapter 2 describes the actual
sampling methods and equipment needed to take a representative sample. But
first, look at the questions on pages 16 -17 and see how you do. The answers
are given on page 18.

16
Questions
1. Why is it necessary for the Sampling Inspector to know the nominal
maximum size of the aggregate he/she is sampling?
a. The nominal maximum size is needed to determine the field sample
size.
b. The nominal maximum size is needed to determine what test to
conduct.
2. Where can you look to determine the sampling frequency of an item?
a. In the Construction Manual
b. In the contractor’s Quality Control Plan
c. Both of the above
3. What does it mean to say a particular sieve is permitted to retain material?
a. It means that particular sieve size is supposed to retain some
fraction of the total sample material.
b. It means that particular sieve size may or may not retain some
fraction of the total sample material
4. Where is the best location to take a sample?
a. From an area that is the most convenient.
b. From the last practical point prior to incorporation into the project or
mix.
5. What is meant by a biased sample?
a. It means the sample selection has been influenced in some way to
such an extent that the sample test result will not be true to the
material being represented.
b. It means the sample was taken correctly and the sample test result
will adequately represent the material.
6. Taking a sample is almost as important as testing the sample
a. True b. False

17
7. What would be the field sample size needed for the AASHTO No. 57 given
in Example 1 on page 12?
a. 100 pounds (50,000 grams)
b. 165 pounds (76,000 grams)
8. By taking a random sample the Sampling Inspector:
a. Assures that the material being represented has not been biased
by the sample selection.
b. Is able to select the material that looks representative.

18
Answers
1. A
2. C
3. B
4. B
5. A
6. B
7. A
8. A
GO TO CHAPTER 2

19
Chapter 2
Sampling Methods and Equipment
Introduction
In this chapter the applicant will study the West Virginia Division of Highways’
approved sampling methods. Materials Procedure (MP) 700.00.06, which is
contained in Appendix II, page 63, will be used throughout this chapter. At this
point the MP should be taken out of this manual for easy reference.
Obtaining a representative sample is the primary function of the Sampling
Inspector. Knowing when and where to take the sample and how to properly
identify it makes the Sampling Inspector an essential part of the project activities.
Chapter 1 discussed how improper sampling techniques would render all
subsequent activities, like testing and material evaluation, as meaningless . . . at
least to the extent that the final test results would not truly reflect the quantity of
material being represented. In this chapter, MP 700.00.06 will be studied in its
entirety in order to learn the basic steps to proper sampling.
Sampling Procedures
Standard procedures that describe the best ways of sampling have, for the most
part, been worked out through experience. Since the procedures used when
taking a sample have a significant effect on the test results, all samplers are
expected to follow these prescribed procedures. We shall depend most heavily
on MP 700.00.06 throughout the remainder of the discussion of sampling
methods.

20
The Importance of Randomization
Chapter 1 discussed taking samples without bias. Recall that this means that the
place at which a sample is taken must not be chosen because of any reason or
notion on the part of the sampler. One could throw a stone in the air blindly, and
take a sample at the exact point at which the stone lands. This method would
have some degree of randomness to it but, even here, the sampler has the
option of which direction to throw the stone, or how far to throw it. The best way
to locate a sampling point is by using random numbers. Random numbers can
be used whether the sampler is taking one sample or several.
Typical pairs of random numbers are given in MP 700.00.06. Go to Attachment I
in the MP (page 73) and observe the arrangement of the numbers. Note that all
of the numbers are less than one (1). This allows the sampler to take any
measure of material, like length, area, mass, volume, time, etc., and multiply the
unit by the random number to locate a specific sampling point. Also notice that
there are five columns of numbers, each of which contains a series of ‘paired’
numbers. When using the random number table it is best to stay within one ‘pair’
of numbers if more than one number is needed. For example, on Attachment I of
the MP, if random number 0.551 (fourth column, top of left series) was the first
random number chosen and another number was needed for an offset number,
the corresponding number of the pair would be used. In this case the number
would be 0.711 (see Attachment I of the MP), or if 0.711 was the first number
chosen then 0.551 would be the second number used, and so on. More will be
said about this in the next few paragraphs.
To use the random number table, first select a random number to start with. One
way to do this is to place the table of random numbers on a flat surface and
careless toss a pencil on the numbers. The pencil point will point to a specific
number. Suppose the sampler wanted to locate a random point on the centerline
of a section of roadway 300 feet long by starting at the lower station number
(0+00) going toward the higher station number (3+00). We toss the pencil and it

21
indicates the first number in the second column: 0.886. Since the roadway is 300
feet long, we multiply 300 by 0.886. The multiplication results in the number
265.8, or 266 feet after rounding. In this case then, the sampling point would be
266 feet from the lowest station number along the centerline toward the higher
station number, or at station number 2+66. Appendix VI, page 80, contains a
copy of the rounding procedure used by the Division of Highways. The Sampling
Inspector should become totally familiar with the rounding procedure.
Now suppose the sampler wanted to establish a point for offset in the lane
adjacent to the centerline. This lane is 18 feet wide. Note from the random
number table the paired number to 0.886 is 0.125. Multiply the 18 feet by 0.125
results in 2.25 feet, or 2 feet after rounding. So the actual sampling point is 2
feet offset from the centerline and 266 feet from the lower station number (our
original problem).
Before proceeding, station numbering must be explained. Generally projects are
measured off in, what are called, station numbers. If a project were 1,500 feet in
length, the station numbers would run from 0 (start of project) to 1,500 feet (end
of project) and would be written as 0+00 to 15+00. If, say guardrail were to be
placed within the project from 1,280 feet to 1,390 feet, this distance would be
referred to as from statin 12+80 to 13+90, or a distance of 110 feet. In the same
way, when sampling, usually only a portion of the project needs represented.
Suppose the distance to be represented by the sample (sublot) was from station
4+00 to 12+50, the length between 850 feet, or simply 1,250 feet minus 400 feet.
To determine distance between station numbers just drop the ‘+’ sign and
subtract the smallest number from the largest.
When using the random number table, it does not matter which column is first
chosen, but when another random number is needed, like for offset, it is best to
use the companion number of the pair.

22
Random numbers will be covered again and again throughout the remainder of
this chapter.
It is clear, even at this stage, that by using random numbers the inspector
removes himself/herself from the actual selection process. All the material that is
to be represented has an equal chance of being selected by using random
numbers. In the example given in the above question, any part of the nine hours
of production had an equal chance of being sampled; it all depended upon the
random number. In a situation like this, no one could say that the inspector was
bias, at least with regard to when he/she took the sample.
Aggregate Sampling Procedure - MP 700.00.06
Section 1 through 3 – MP 700.00.06 will now be studied in detail. Turn to the MP
and carefully read Sections 1 through 3. Come back here when you are done.
Notice that most of the subject matter in these sections has already been
discussed. Section 1 describes the purpose of the MP, and that is to provide
uniform procedure so everybody taking a sample will take it the same way.
Section 2 describes the type of samples applicable to this procedure. Item (d) in
Section 2.1, however, is not applicable since the Division of Highways no longer
takes record samples. Section 3 provides some general information that has
been covered.
Section 4 – Turn now to Section 4 of the MP and study the definitions. Pay
particular attention to the diagrams and note their relationship to each other.
After reviewing this section return here.
Terminology
Section 4 describes the basic terminology used when sampling. The term ‘Lot’
is more commonly used by the evaluator of the test result data than the Sampling
Inspector. The MP 300.00.51 reference in the ‘Lot’ definition describes the
control charting procedure where sample data is plotted, averaged, and

23
evaluated. This MP will not be part of this study. Note that the term ‘sublot’ was
used previously to describe the 300 foot section of roadway being represented
with the random number selection.
The term ‘sublot’ is used to describe the material represented by one sample.
Remember that the sampling frequency for a base course is one sample per
each half-day of operation (placement). This means the sublot for base course
will be considered the quantity of material placed for this item in a half-day. This
quantity should be a part of the records, or identification, with the sample. Other
items have different sampling frequencies and will therefore have different
defined sublots. For example, when sampling an item whose sample frequency
is one sample a day, then the sublot would be the quantity of material used (or
represented) during that one day, and so forth. The second part of the sublot
definition is also more for the evaluator. Some jobs are small enough that one
sample is all that is needed on the whole job, therefore the lot and sublot mean
essentially the same thing, in other words, one sample represents all material
used on the entire project. The Sampling Inspector should nevertheless be
aware of this situation.
The term ‘sampling unit’ defines the quantity of material from which the sample
will be located. Previously, when random numbers were discussed, it was
necessary to first determine the random time or place to procure the sample. For
example, an inspector is going to take a sample during one full day of production
(from 8:00 a.m. to 5:00 p.m.) from the conveyor belt using random number 0.371,
at what time would the sample be taken? In this example, the sample will be
taken from the conveyor belt at 11:20 a.m. to represent the one-day production
sublot. The material contained on the stopped conveyor belt is the sampling unit.
This quantity does not have to be determined as far as the inspector’s records
are concerned. It is just the material that will be available to sample at the
predetermined random time.

24
The term ‘increment’ means the portion of the sampling unit (material contained
on the conveyor in the previous example) that will be removed as part of the
sample. The diagram in Section 4 of the MP shows five increments are removed
from each sampling unit. When sampling from a conveyor the location of each of
these increments along the length of the belt is also determined by random
numbers. Figure 2 identifies the sampling unit and increments as they would
look when sampling from a conveyor. Note that the length of the belt is identified
as the sampling unit and the random locations along the belt that will be sampled
are identified as the increments.
Figure 2 - Random Increment Locations
The ‘field sample’ is just the composite of all the increments. The field sample,
which was discussed in Chapter 1, is what the Sampling Inspector must have
enough of to turn in to the laboratory for test. The laboratory technician will then
split (reduce) the field sample down to the ‘test portion’ size. Each of the
increments taken from the conveyor belt (Figure 2) would be combined to make
the field sample. It would be better to have too much material in the field sample
than not enough material. There may be occasion, for whatever reason, the
inspector determines that the five increments yield less material than what is

25
actually needed for the field sample weight. In this case just select another
random site on the belt to complete the sample.
In the previous example, the sublot is the amount of material represented by the
one sample taken at a frequency of one sample per each day of operation. The
sampling unit is the amount of material represented on the conveyor belt. The
increment is one portion of the material on the conveyor belt that is removed
(sampled). And the field sample is the amount of material represented by all of
the increments. Remember, this example had to do with sampling from a
conveyor belt. These terms will also be used in other sampling techniques as
well, for example, sampling from the roadway or from a stockpile. These will be
covered in Section 6 of MP 700.00.06.
The ‘test portion’ is, of course, the amount of material actually used for testing.
Both the field sample size and the test portion size are determined by the
nominal maximum size of the aggregate, especially when determining gradation.
‘Random location’ has been discussed previously and will be discussed further
in the remaining sections.
Section 5 – Turn now and read Section 5 in the MP, after which return here.
Section 5 briefly discusses the contractor’s responsibility with regard to sampling
and testing his/her product. It is in everyone’s interest that samples are taken
properly and with the right tools.
As mentioned in the MP, the specifications require the contractor to provide any
special equipment that may be needed at his/her facility to facilitate sampling the
aggregate and to allow access to the facility at all times during the production
process. In this case special equipment might be an apparatus for sampling from
a flowing bin discharge, templates for conveyor belt or roadway sampling, etc.

26
Section 6 – This is the section that actually defines the required procedure to be
followed in securing a sample. Make sure at this point that you are comfortable
with the definitions given in Section 4. If you are not, go back now and review.
No matter where, or what, is being sampled, the steps to follow go something like
this: 1) Determine the sampling frequency and quantity of the sublot being
represented. 2) Determine the random location of the sampling unit within the
sublot. 3) Determine the random location of the increments to be removed from
the sampling unit. 4) Make sure all increments are combined together to form an
adequate size field sample. If common sampling bags are used it usually takes
at least a couple of full bags, and 5) make sure the sample is properly identified.
Go to the MP and read Section 6.1. Do not go to Section 6.1.1 at this time.
Note that Section 6.1 lists the areas that are most common to procure a sample.
It was mentioned in Chapter 1 that base courses are normally taken from the
roadway prior to compaction. Although it is more difficult to sample compacted
material, the act of compaction may tend to break up some of the material which
in turn will cause gradation to change somewhat. Concrete aggregates would
normally be taken from a conveyor belt prior to mixing. In some cases samples
have to be taken from a flowing stream of aggregate. This usually happens
when aggregate is being discharged from a hopper or other aggregate storage
bin, or even from, or over, the end of a conveyor belt. Lastly, and in certain
circumstances, the need arises to take a sample from a stockpile. Because of
the inevitable segregation that occurs in a stockpile, this location is the most
difficult to obtain a representative sample and should always be considered the
last place to take a gradation sample.
Roadway Sampling
Earlier in this chapter we discussed locating a random sample point from a 300
foot long roadway (sublot). The random number was selected and used to
determine a point on the centerline, after which another random number was

27
selected to determine a point offset from the centerline in the lane to be sampled.
We can now take this example a couple of steps forward. Remember the
definition of sublot, sampling unit and increment? In the example the sublot has
been identified (a 300 foot section of roadway) and we know where the sampling
unit will be (266 feet up station, offset 2 feet). The sampling unit will start at the
offset point. This point will define either the center or any corner of the sampling
unit depending upon where it happens to fall within the sublot being sampled.
When sampling from the roadway the sampling unit is defined as an area of 12
feet by 12 feet, or approximately 144 square feet. Since in this example the
offset point is only 2 feet from the center line it may be well to use this point as
the lower right corner (going up station) of the sampling unit (see Figure 3).
Figure 3 - Roadway Sampling
Notice that ‘X’ marks the spot of the chosen random location. The 12 foot by 12
foot sampling unit is identified from this point. Remember that the sampling unit
when sampling from a conveyor belt was the length of the belt. In this case,
when sampling from the roadway, the sampling unit is a 12 foot by 12 foot area
within the sublot (or 144 square feet). The next step is to locate the five random
increments inside the sampling unit. These locations are selected the same way
the sampling unit was selected. Go to the random number table and use the
next five pairs of numbers following the pair of numbers used for the initial
calculations for length and offset. The example given in Figure 3 used 0.886 for
the length determination and 0.125 (the other number of the pair) for offset.
These numbers are located in the second column (top of paired series) of the

28
random number table (page 73). Note from the random number table that the
next five numbers down from 0.885 are 0.242, 0.835, 0.739, 0.215, and 0.623.
These numbers will be used for the length along the sampling unit. The next five
numbers down from the offset (0.125) are 0.316, 0.636, 0.002, 0.358, and 0.855.
These numbers will be used for the offset of the sampling unit. Thus the
numbers chosen for the increment location are:
Since the sampling unit is 12 feet on each side, the increment location is determined by multiplying each number by 12, or:
The first increment location is 3 feet up station from the sampling unit corner and
offset 4 feet, the second increment is 10 feet up station from the sampling unit
corner and offset 8 feet and so on. Note, however, that the fourth set of numbers
(above) also resulted in a length of 3 feet, and an offset of 4 feet, which is the
Length Offset
0.242 0.316
0.835 0.636
0.739 0.002
0.215 0.358
0.623 0.855
Length Offset
0.242 x 12’ = 3’ 0.316 x 12’ = 4’
0.835 x 12’ = 10’ 0.636 x 12’ = 8’
0.739 x 12’ = 9’ 0.002 x 12’ = 0’
0.215 x 12’ = 3’ 0.358 x 12’ = 4’
0.623 x 12’ = 7’ 0.855 x 12’ = 10’
Round each number to the nearest foot.

29
same as the first increment location. In this case go back to the random number
table and use the net pair of numbers down in the column, which would be 0.757
and 0.308. Substitute these numbers for the fourth increment location. Thus the
fourth increment location would now be:
The example shows one of the difficulties that may be encountered when using
the random number table. And that is all right. The point here is to use the table
in such a way as to avoid sampling bias. This is accomplished by following
guidelines consistent with the sampling intent. Figure 4 shows the increment
locations within the sampling unit. Notice from Figure 4 that the increment
locations are indicated to be on the corner of a one-foot square. The same
philosophy is used in the location of the increments that was used in the location
of the sampling unit. The sampling point could have been in the middle of the
one-foot square as well. Sometimes circumstances on the project or how the
increment numbers develop will dictate this choice.
Figure 4 - Sampling Unit with Increment Location
Go to Section 6.1.1 of the MP and review the example carefully. Notice in this
case the station numbers for the sublot are given. To get the sublot length, just
Length Offset
0.757 x 12’ = 9’ 0.308 x 12’ = 4’

30
subtract the low station number from the high station number. Another thing that
was brought up was the sampling unit’s area, which is approximately 144 square
feet in all cases. Figure 5 is an illustration of the example given in the MP. In
this case, instead of using the corner to define the sampling unit, ‘X’ marks the
middle of the sampling unit. Everything that was discussed is shown in the
illustration. Study this example until you are completely familiar with station
numbers. Notice in this illustration the centerline is at the ‘top’ of the roadway.
Figure 5 - Example from MP
The example shown in Figure 5, and given in Section 6.1.1 of the MP,
emphasizes the use and manipulation of station numbers to define the sampling
unit. Once the sampling unit is located, it will be considered a 12 foot by 12 foot
square, or again, 144 square feet. The next step would be to randomly locate
the five increments within the sampling unit. If the width of the roadway is less
than 12 feet, say 8 feet, divide 144 square foot area needed by 8. This equals 18
feet. Hence, the dimensions of the sampling unit would be 8 feet wide by 18 feet
long for a total area of 144 square feet. In this case, when the roadway width is
12 feet or less, no offset number is needed. The first calculated value along the
centerline would be considered a corner of the sampling unit.
Obviously this whole exercise of locating the increments culminates by taking the
sample. Section 6.1.1 describes how the full depth of the material should be
removed using care that material from the subgrade does not contaminate the

31
sample. Also mentioned was how a metal template may be used to aid in the
sample removal. The template (Figure 6) is place upon the uncompacted
material at the increment location. Material is removed from within the template
with a scoop. As material is removed the template is shoved further into the hole
preventing the sides of the hole from falling in. This is continued for the full depth
of the material being sampled. Take care not to dig down into the compacted
material below. The template is usually a foot square and about eight to ten
inches high with the bottom edges tapered. Being tapered allows the template to
be shoved into the material easier. After removing the material from the five
selected areas, they are combined to make up the field sample.
Figure 6- Roadway Sampling Template
Conveyor Belt Sampling
While reviewing the terms sampling unit and increments, we briefly discussed
conveyor belt sampling (pages 23 – 25). Recall that the sublot was the material
represented through a period in time (in the example the time was from 8:00 a.m.
to 5:00 p.m., or nine hours). The length of production time was multiplied by the
random number (0.371) to get the time the conveyor would be stopped to take
the sample. The sampling unit was the quantity of material represented on the
stopped conveyor at the selected time and Figure 2 showed the location of five
random increments throughout the belt, but in this case no location values for the
increments were given. The next step then is to determine what the random
distance are ‘going up the belt’ from where the increments will be taken. These
distances are, again, determined by using the random number table in MP

32
700.00.06. Recall that the length of the conveyor belt was 40 feet long. The
object is to randomly select five points on the belt where the increments will be
taken.
In the random number table the number 0.371 is in the third column (eight
numbers down from the top in the right series of paired numbers). This is the
number used to determine the time to stop the belt, which was 11:20 a.m. Since
we need five more numbers to determine where the increments will be, use the
next five numbers down the series from the 0.371. These numbers are 0.057,
0.654, 0.989, 0.512, and 0.500. In this case no offset numbers are needed.
Because the conveyor belt is 40 feet long, multiply each random number by 40:
Length Round to nearest whole foot
40’ x 0.057 = 2’
40’ x 0.654 = 26’
40’ x 0.989 = 40’
40’ x 0.512 = 20’
40’ x 0.500 = 20’
Putting these numbers in order, our sampling points on the belt are 2’, 20’, 20’
26’ and 40’. Once again two increments were the same (20’). The next number
down in the column is 0.503. This also results in 20’. The next number is 0.646.
Using this number results in an increment location of 26 feet. Not that this
increment location has also already been determined. The next number down in
the column, 0.738, results in an increment location of 30 feet. This one may be
used; hence the sampling points along the forty foot conveyor belt are now 2’,
20’, 26’, 30’ and 40’. Figure 7 (page 33) shows the conveyor with the increment
locations. The first increment was located 2 feet from the lower end of the belt,
the second 20 feet from the lower end of the belt and so on. After the increment
locations have been identified, it is easier to start sampling at the top (high end)

33
of the belt and then working down. By doing this the bag containing aggregate
may be carried down the conveyor instead of up the conveyor.
Figure 7 - Conveyor Belt with 5 Random Increment Locations
Now go to Section 6.1.2 in the MP and review thoroughly, then return here and
continue on to the next paragraph.
There are a couple of points to go over here. Section 6.1.2 mentioned the use of
a template when sampling from a conveyor belt. The template may be inserted
into the selected spot, effectively cutting off the material above and below it for
easy retrieval of the material that lies between the two sides of the template (see
Figure 8, page 34). It is important to remove all material from the belt including
the fines. As the MP states, the fines may be removed using a brush and some
type of dust pan. Normally taking fine increments like this will yield enough
material for the field sample. If, in fact, the flow on the belt is such that you
determine another increment is needed just randomly select another spot on the
belt to sample. The random number you use can be the next number in the
series from the five you already used.

34
Figure 8 - Conveyor Belt Template
Flowing Aggregate Stream Sampling
On occasion it becomes necessary to take a sample from a flowing stream of
aggregate such as a bin or belt discharge. The material being sampled has a
sampling frequency that will define the sublot. The sampling frequency may be
one sample per each day of production, or one sample per each half day of
stockpiling, etc. Regardless, this sampling frequency defines the sublot. After
the sublot and sampling frequency are determined, the sampling unit must be
determined. For roadway sampling the sampling unit was determined from the
length of the sublot, e.g., 300 feet. When sampling from a conveyor belt the
sampling unit was determined by the sublot time, e.g., 8:00 a.m. to 5:00 p.m.
Locating the sampling unit for a bin or belt discharge is the same as the latter
that is from some period of flow. In this case, however, once the time to take the
sample is determined, the sampling unit is considered to be the amount of
material flowing through an approximate five-minute period. From this five-
minute period, five random increments are taken to make up the field sample.
The steps taken to sample a bin or belt discharge are much the same as those
taken to sample a stopped conveyor belt. First, the sublot is determined (based
upon the sample frequency). If the frequency is one sample per each day of
operation then the normal time of the operation period must be determined. In
this case we will say that the operation starts at 7:00 a.m. and goes to 2:00 p.m.

35
Thus the sublot represents seven hours of production (operation). At this point
the time to take the sample must be randomly determined. Select a random
number from the random number table as was previously discussed and multiply
this number by the production period: 7 hours. If random number 0.337 is
selected, then 0.337 multiplied by 7 hours equals 2 hours and 22 minutes. The
sample would be taken 2 hours and 22 minutes after 7:00 a.m., or at 9:22 a.m.
This 9:22 a.m., by the way, identifies when our sample unit begins. If you would
happen to be sampling from a bin discharge and there was no truck being filled
at the time, obviously you would have to wait until the next truck came in,
regardless of the time. The next truckload would start your sampling period.
Taking the five increment samples may take several truck loads. The five
minutes of flow time means just that, five minutes of actual aggregate flow. And
in this case everything is approximate. Probably the most important thing to
remember is the intent of these procedures, and that is to be as random as the
circumstances allow. Each production facility has its own controlling factors to
which the Sampling Inspector must adjust, and this is all right.
As was mentioned above, the sampling unit is considered to be a five minute flow
period. In the example the sampling unit would then be identified as starting at
9:22 a.m. and proceeding on through some five minutes of operation. In actual
time this may take longer than five minutes as already discussed. The intent is to
take five randomly space increments in as close to five minutes as possible.
These increment times may be determined using random numbers as we have
done before or by some other method conducive to the circumstances.
When taking the sample from a flowing discharge, the entire cross section of the
flow must be retrieved. To do this, especially when sampling from a bin
discharge, it is necessary to use a special device constructed to facilitate a given
plant. This is usually an apparatus consisting of a pan that can be pulled through
the discharge stream. A simplified illustration of this can be seen in Figure 9.

36
Figure 9 - Pan for Increment Sampling
The actual construction of such a device depends upon the conditions at the
plant, like available clearance, working space, etc. The pan must be of sufficient
size to intercept the entire flow of the discharge stream. If, in fact, the pan fills to
overflowing it should be struck level, leaving only the material in the pan as the
increment for the sample. The five increments should be combined to represent
one field sample, properly documented and identified, and then shipped to the
laboratory for test. Now review Section 6.1.3 of the MP before proceeding to the
next paragraph.
All the procedures discussed so far are meant to provide basic guidelines for
sampling aggregate in different settings. Most of the time, these procedures can
be followed directly without too much difficulty. There will arise, on occasion,
situations that require some thought because of peculiarities existing on certain
projects of at specific plants. It is impossible to give examples of all situations
that may occur. The best the Sampling Inspector can do is to attempt to adapt
these sampling principles to existing conditions. It’s surprising how easy it is
when the inspector keeps in mind what he/she is trying to achieve . . . and that is
the best material representation possible under changing project circumstances.

37
Stockpile Sampling
Although stockpile sampling for gradation should be done only as a last resort,
primarily because segregation can easily occur within the pile, sometimes it does
become necessary. Segregation, if you recall, is the separation of the coarse
particles from the fine particles. When stockpiling, especially from a conveyor
belt, the coarse particles tend to roll down the sides toward the bottom of the pile
while the finer particles, being lighter, gather at higher levels (Figure 10).
Figure 10 - Stockpiling by Conveyor Belt
The plant may be producing material that is well graded but once it leaved the
conveyor belt, falls several feet, and then bounces, and rolls about, segregation
happens. The task of the Sampling Inspector when confronted with stockpile
sampling is to represent the sublot of material being shipped to the project, which
is not always an easy task. If a sample is taken from the lower portion of the pile
mostly coarse particles will be represented. A sample taken from only the upper
portion may contain more fine material than coarse material. The ideal way
would be to use heavy equipment and cut the stockpile in half, sampling as you
go through. In most cases, however, this is very time consuming and therefore
not really practical.
In order to obtain a sample of stockpiled material, all levels of the pile must be
represented. Consider using heavy equipment like a front-end loader if one is
available. A separate small sampling pile composed of different levels and

38
depths can be constructed, mixed, and then smoothed somewhat by drawing
back the bucket of the front-end loader over the top. This pile may then be
sampled from around the sides and top until sufficient material is obtained. If this
separate pile is not too big it can also be quartered, taking one complete quarter
by reducing it through a sample splitter to reach field sample size. In this case
care should be taken to place the separate pile on a clean base so all the fines
can be retrieved. If power equipment is not available, hand sampling may be
employed. At least three levels of the pile should be sampled, each layer
representing one increment of the field sample. If the entire perimeter of the
stockpile is being sampled, pace around the pile keeping track of how many
steps it takes to complete one revolution. Go to the random number table and
select a number. Multiply this number by the number of steps taken. This will
determine the sampling point.
For example, the quantity of material in the pile will be considered the sublot and
you want to determine the location of the sampling unit. The perimeter took 52
steps to go around. Random number 0.797 was arbitrarily selected. Multiply 52
steps by 0.797 yields 41 steps. Thus from the starting point to the sampling point
(sampling unit) is 41 steps. This same method of locating the sampling unit
should be used even if there is power equipment available. In some cases the
entire stockpile is not accessible. Maybe the back of the pile is against a rock
ledge, in this instance, pace the area of the pile that is accessible and then
determines the random sampling point. Once the sampling point is determined,
and you are hand sampling, consider the stockpile as being made up of at least
three levels as shown in Figure 10 (page 37).
Determine the size of the field sample needed by noting the nominal maximum
size of the aggregate and going to Table I in MP 700.00.06. Once the field
sample size has been determined, and you have decided to take three
increments, you can judge how much material should be included in each
increment. Begin sampling by scraping away the top few inches of the sampling

39
area with a shovel. The first sampling point (increment) should be two to three
feet up from the base of the pile. Once the outside surface is scraped away take
your increment sample. Move up the side of the pile to approximately the middle,
scrap away the surface material, and take another increment. Proceed on the
upper portion of the pile to complete the field sample. It may be easier to start at
the top portion of the pile and work down. Either way is acceptable. Note that in
this example, only three increments were taken (Figure 10 – page 37). Three
increments are the least number that should be taken. The Sampling Inspector
may wish to take more than this to obtain the field sample size. When sampling
by hand and using a shovel, a square end shovel with raised sides should be
used to prevent as much ‘spill-over’ as possible.
Stockpiles come in all shapes and sizes. On many occasions material is being
hauled to a particular project from one end of a rather large stockpile. There is
no chance that most of the material in the pile will go to the project. In this case
the sample must be taken from the ‘working end’ of the pile to represent the
material going to the project, that is, from the end or area where the material is
being removed. Essentially the same method may be used here as in the above
example when stockpile sampling. Pace off the extent of the exposed material
(face of the stockpile) and determine by a random number where the sample
should be taken. Once this is determined take the sample using power
equipment, or by hand, using a square end shovel with raised sides. The
quantity of material represented will be considered the amount supplied to the
project for that sublot.
Review Section 6.1.4 of the MP and then continue to the next paragraph.
Peculiarities that can exist between different production facilities, projects, etc.
were mentioned on page 36. This is especially true when sampling from different
stockpiles. Although they are not supposed to be, some stockpiles are up
against another pile or terminated on one side because of a wall or other

40
obstruction. The Sampling Inspector has to think about the situation and make a
judgment on the best possible way to sample the pile to obtain a representative
sample. In most cases, however, material will be sampled from the working end
of the pile as material is being shipped to a specific project.
Spreader Box Sampling
Although not mentioned in the MP, sometimes it becomes necessary to take a
sample from the spreader box. This usually occurs when the area to be sampled
is such that a meaningful sample cannot be taken (like from a narrow shoulder),
or in other words, it is not practical to take the sample at that location. Recall that
the Construction Manual says that a base course should normally be sampled
from the roadway. In those cases where it is not practical to do so, like on some
thin lift or narrow shoulders, the next practical place would be from the spreader
box. Just as there are a variety of stockpiling situations there are a variety of
different types of spreader boxes. The type of spreader and material accessibility
must be determined first. Maybe material can be sampled from the spreader
conveyor, or maybe it would be best to take the sample from the hopper after the
truck fills it. The Sampling Inspector must make the decision based upon his/her
knowledge of the overall sampling procedures and sampling intent, and that is
the best represent the material being placed.
A random time needs to be determined for each one-half day of placement for
shoulder material. This random time is determined the same way as the time
was determined when sampling a conveyor belt (pages 24 - 25). When
spreading shoulder material, normally the material is tailgated into the hopper as
the spreader pushes the truck down the roadway.
When empty the truck pulls away making room for another full truck. When
taking the sample it is best to retrieve material sometimes during the middle of
the truckload. To do this, in most cases, the truck must be pulled away from the
spreader to expose the hopper. Once the hopper is exposed, the Sampler, using

41
a shovel, can take the sample by removing material from the full lateral extent of
the hopper. This just means from one side of the hopper to the other, removing
enough material to complete the field sample (Figure 11). When the sampling a
spreader box in this manner, there will be no defined increments as in the other
sampling cases. Enough material should be taken from the hopper to satisfy the
field sample weight.
Figure 11 - Spreader Box Sampling Area in Hopper
Sample Weights Required
Nominal maximum size and its relationship to the field sample size were
discussed in Chapter 1. The field sample size, taken from Table 1 of the MP,
should be large enough such that any and all required tests may be performed.
In most cases the Sampling Inspector will be called upon to take samples for
gradation. In some instances, however, the sampler may have to take a sample
to determine the aggregate’s quality characteristics, like liquid and plasticity
index, percent face fracture, etc. These additional quality requirements are listed
in Note 3 of the Construction Manual (page 61 of Appendix I) and should also be
a part of the contractor’s Quality Control Plan. The sizes given in Table I of MP
700.00.06 are sufficient for this as well. Go to Section 7.0 of the MP and read
7.1 and 7.2 then continue with Transporting Samples.

42
Transporting Samples
Obviously, when taking a sample, the Sampler needs a container to put the
material in. If the sample is to be tested in a field laboratory, close to the point of
sampling, any suitable container may be used as long as it is clean. If, however,
the sample is to be shipped to another testing site sample sacks (bags) should
be used. These sacks should also be clean and contain a plastic liner to prevent
loss of fine material. A clean container assures the sampler that there are no
additional fines left in the bag that may influence the gradation, or other quality
characteristic, of the sample. Each bag should be properly marked or tagged
and secured tightly for transit. It is also important to get the sample to the testing
facility in a timely manner. Go to Section 8.0 of the MP and read 8.1 and 8.2
then continue with Planning Your Sampling Program.
Planning Your Sampling Program
The following is a quick review and checklist of points to remember before the
sample is taken:
Sampling: Before taking the sample the Sampling Inspector should as
himself/herself these questions:
1. Are you sure that your plan for taking the sample is complete?
2. Have you identified the sublot and do you know the quantity of material to
be represented?
3. Have you determined the sampling unit and know the increment
locations?
4. Do you know what size sample is required for the field sample?
5. Do you have the proper equipment to take the sample?
6. Do you have clean containers for the sample?

43
Records: After the sample is taken the Sampling Inspector should ask
himself/herself these questions:
1. Are you sure the sample really represents the material?
2. Is the sample completely identified (even on the outside of the bag)?
3. Does your records show the material item, its source, intended use, field
sample number, when, where and how the sample was taken; who took
the sample, and the quantity of material the sample represents?
4. Is the sample container securely sealed to prevent loss of material?
5. Have you made arrangements to get the sample to the testing facility in a
timely manner?
General Information
The sampling procedures described in this manual have, over time, been proven
to be very satisfactory. There are certainly other procedures used by other
agencies that are satisfactory as well. It is our intent, however, to establish
consistent methods that are followed by all Samplers on West Virginia projects
no matter who takes the sample. Many of the Division’s acceptance procedures
require the verification samples to be compared to the contractor’s quality control
samples. This comparison is only valid if all the samples are taken basically the
same way and from the same general area, like from the roadway, conveyor belt,
etc. The importance of proper sampling cannot be over emphasized. It is a
serious business. The Standard Specifications contain price reduction formulas
that are designed to reduce payment to the contractor for non-specification
material. For this reason the material should not pass or fail due to improper
sampling. The single objective of the Aggregate Sampling Inspector is to best
represent the material being placed. This has been stressed in this manual over
and over again.
We have mentioned during each of the different sampling procedures the need to
adjust to peculiar situations. For example, there may be some conveyors that
44
have a catwalk on the side, which would prevent sampling throughout their
extent. There may be some with only a small opening available for sampling. In
these cases the need for good sample is not any less. The area that is available
may be used as best you can to take the least one of the increments. After
which the conveyor may be started and stopped at random times to get the
remaining increments. Whatever the case may be, plan your sampling strategy,
and use the techniques learned to best fit the situation.
We also discussed how to take a roadway sample when the sublot was a
specified length (say 300 feet). It may happen instead that you want to take the
sample during some random time of placement. In those situations where the
sublot represents a half-day of placement, the time to take the sample may be
determined by multiplying the anticipated placement period by the random
number. This is done the same way the sampling tie was determined when
sampling from a conveyor. In this way we are not using the station numbers to
determine the location of the sampling unit but we are using a random time
instead, although the station number from where the sample was taken should
be document. Everything else would be the same, such as locating the offset (if
needed) and the increment.
On several occasions during this study the contractor’s Quality Control Plan was
discussed. This plan should contain all the information needed by the Aggregate
Sampling Inspector. This plan establishes the intended sampling frequencies of
the item being placed and the location from which the sample will be taken. A
copy of the plan should be available at the project (or plant) and the District
Office. By knowing what is in the plan for any given project, the Inspector can
sample at the approved frequency and take the samples in the approved
location. It does little good for the contractor to take quality control samples from
the stockpile while the Division of Highways takes verification samples from the
roadway. This negates the comparison procedure.

45
On several occasions, we have mentioned the term acceptance procedure.
There are probably many ways this can be defined but essentially it refers to the
collection of all procedural and data input from a project and other sources that
ultimately allows the Division of Highways to pay for the work. Gradation
analysis and the subsequent comparison procedures are two of the acceptance
procedures used to ‘pay for’ placed aggregate. Other items, like hot-mix asphalt,
steel products, etc., have their own acceptance procedures. Acceptance
procedures work properly only if all of the required tests and other data are
available. Placement dates, quantities, laboratory numbers, etc. are among the
information needed for acceptance along with the test results.
This manual contains several attachments that relate to the Sampling Inspector’s
activities. The material in these attachments should be reviewed as part of this
course of study even though only touched upon in the text.
And finally, it is not the intent of these procedures to impede the progress of the
contractor. Knowing what to do and how to do it allows for the swift procurement
of the sample with as little project delay as possible.

46
Sample Questions
The following is a list of sample questions for your review and study. These
questions include information learned in both Chapter I and Chapter II. When
working with sublot lengths, random number increments, etc., it is always helpful
to sketch a picture of the sampling plan. This way it is easier to see where you
are and what you are doing. Answers are given on page 51.
1. Your assignment is to take a sample of AASHTO #8 aggregate being used in an asphalt wearing mix. What is the field sample size needed? a. 25 pounds (10,000 grams)
b. 35 pounds (15,000 grams)
c. 55 pounds (25,000 grams)
2. Suppose you want to sample a Class 1 aggregate base course for
gradation during placement on a rather large project. What would be the normal sampling frequency in this case? a. One sample per each full day of placement.
b. One sample per each on-half day of placement.
c. One sample per each 10,000 tons used.
3. If you were sampling from an accessible conveyor belt, and the belt was
35 feet long, using random numbers 0.109, 0.669, 0.397, 0.898, and 0.293 where along the belt would you locate the increments measuring from the lowest end of the belt to the high end? a. At 4’, 10’, 14’, 23’, and 31’ along the belt.
b. At 3’, 10’, 14’, 24’, and 32’ along the belt.

47
4. When sampling from a bin discharge, your pan overflows as you pull it through the discharge stream. What should you do?
a. Consider all of the material in the pan as your sample increment.
b. Discard the entire increment and try again.
c. Strike off the heaped-up material and keep only the material below the top of the pan.
5. You want to sample a roadway placement whose sublot starts at Station 12+40 and ends at Station 16+90. The lane being sampled is 8 feet wide. Using random number 0.293 locate a point along the centerline from the low station number to the high station number from which the offset will be determined. a. Station 13 + 72
b. Station 15 + 58
c. Station 17 + 04
6. Using the same information in Question 5, and using random number 0.850, determine the offset of the sampling unit. a. 6 feet
b. 7 feet
c. Since the lane is only 8 feet wide, no sampling unit offset is needed.
7. When sampling from a roadway the dimension of the sampling unit should be approximately: a. 64 square feet
b. 100 square feet
c. 144 square feet
8. Using the information in Questions 6 and 7, what would be the length of
the sampling unit? a. 18 feet
b. 21 feet
c. 24 feet

48
9. A sublot is always defined by: a. The amount of material placed in one day.
b. The amount of material contained on the stopped conveyor belt.
c. The amount of material represented by one sample taken at the
required frequency.
10. From which of the following areas would you expect the greatest
segregation? a. Roadway
b. Stockpile
c. Conveyor belt
11. When sampling aggregate from the roadway, it is best to use a :
a. One foot square template
b. Square end shovel
c. Front-end loader

49
12. Suppose you have located the sampling unit within a road way land 18 feet wide. The dimension of the sampling unit is 12 feet by 12 feet. Using the following random numbers determine the increment locations. (Hint, looking up Station, and use the right bottom corner as your starting point).
Length Offset
0.079 0.977
0.337 0.402
0.906 0.367
0.142 0.739
0.569 0.836
a.
b.
Length Offset
1’ By 12’
2’ By 9’
4’ By 5’
7’ By 10’
11’ By 4’
Length Offset
1’ By 12’
2’ By 9’
4’ By 5’
7’ By 7’
10’ By 2’
X

50
13. Suppose a plant was producing concrete from 8:00 in the morning to 5:00
PM and the inspector wanted to take a sample from the conveyer belt at a
random time (starting at 8:00) during the production period. The random
number selected was 0.371. At what time would you take your sample?
a. 11:20 AM
b. 11:34 AM
14. Suppose a particular item had a sampling frequency of one sample per
each 10,000 tons produced. What would be the sublot size?
a. 50,000 tons equal one sublot.
b. 10,000 tons equal one sublot.

51
Answers:
1. A
2. B
3. A
4. C
5. A
6. C
7. C
8. A
9. C
10. B
11. A
12. A
13. A
14. B

52
Appendix I – WV DOH Construction Manual
West Virginia Division of Highways
Construction Manual
Sampling and Testing Frequencies

53
Material Location Minimum Frequency Size Test For Remarks
Aggregates (Quality Check)
Commercial Sources Sample at source by MCS&T Div.
Sampling annually 75–100 lbs. See Note 4 (Tests conducted by MCS&T Div.)
Refer to AASHTO T2 for sample methods
Sample at intermediate or final destination by field personnel
One sample per 10,000 tons or 5,000 cu yd. of material used (for one or more projects)
Refer to ML-26
See Note 3 (Test conducted by field personnel)
Refer to Div. 700 of Construction Manual, the Materials Manual, and ML-26
Local Sources
Sampled at production or storage site by field personnel
One sampler for each 6 days of production
Refer to ML-26
See Note 4 (Tests conducted by MCS&T Div.)
Sample at production or storage site by field personnel
One sample for each 6 days of production
Refer to ML-26
See Note 3 (Test conducted by field personnel)
Aggregates (Gradation Check)
Base Course and Subbases
See Remarks
Once sampler per each ½ day of operation or as established by the Contractor’s quality control program
Refer to ML-26 Gradation See Note 1
Material shall normally be sampled from the roadway prior to compaction. Refer to ML-26. See Note * Below
Portland Cement Concrete
See Remarks One sample per each day of operation Refer to ML-26
Gradation and Total Solids See Note 1
Refer to ML -26 and MP 601.03.51
Miscellaneous Items Stockpile on project One sample per ½ day of stockpile Refer to ML-26
Gradation See Note 1
Note * If deemed expedient, the Engineer may approve sampling at the alternate point, providing the following conditions are met: (1) Material is taken from a
conveyor belt or pug mill and hauled directly to and incorporated into the job with samples taken from the conveyor belt and pug mill discharge (2) Sampling procedure is in accordance with current Department policy as outlined in ML-26, and (3) sufficient data developed to assure that test results of samples from the alternate point do not differ significantly from test results of samples from the roadway.

54
Material Location Minimum Frequency Size Test For Remarks
Aggregates (Density and Thickness Check)
Base Course Subbase
Roadway
Density: 1 per layer* per 2,000 lin ft. (lot size) Thickness: 1 per layer* per 1,200 lin ft. * Each working width
As required by governing test procedures
Conformity with AP-A 80% to specified target % of dry density
A lot shall be divided into 5 approximately equal sized sublots. Randomize location of density and thickness tests. The thickness is to be measured after all fine grading operations are completed
Bituminous Material
Asphalt Cement See Note 2 See Note 5 1 qt. See Note 1
Refer to ASTM D140 or AASHTO T 40 for sampling techniques and procedures. Also refer to IM-16. Use wide-mouth can.
Cutback Asphalts See Note 2 See Note 5 1 qt. See Note 1
Use a can with cork lined screw cap or other suitable container. The lid must provide an airtight seal. Refer to ASTM D 140 and AASHTO T40 for sampling techniques and procedures. Refer to IM-16.
Asphalt Emulsions See Note 2 See Note 5 1 gal. See note 1
Glass or plastic container. Do not use a metal can. Refer to ASTM D 140 or AASHTO T 40 for sampling techniques and procedures. Refer to IM-16.
Tars See Note 2 See Note 5 1qt. See Note 1
Use small-mouth can with cork lined screw cap. Refer to ASTM D 140 or AASHTO T 40 for sampling techniques and procedures. Refer to IM-16.
Bituminous-Aggregate Mixtures
Plant, Truck or Roadway
MP 401.02.23
Sufficient sample to comply with nominal aggregate size. See Remarks
Bitumen content and aggregate grading See Note 1.
Refer to AASHTO T168 for sampling techniques and procedures. Dry batch gradings may also be used.
Roadway
1 per layer per 1,000 lin ft. (lot size)
Density: 85% conformity to that
Testing for total compacted thickness exceeding 1 ½ in.

55
Material Location Minimum Frequency Size Test For Remarks determined in accordance with MP 401.03.20 Determination of number of passes for maximum density in accordance with MP 401.03.20
Testing for total compacted thickness of 1 ½ in. or less.
Brick See Note 2 Each shipment 10 bricks See Note 1 Measure depth, width and length. Also refer to AASHTO T 32
Calcium Chloride Ice Control
See Note 2 Each shipment 3 lbs. See Note 1
Refer to AASHTO T143 for sampling techniques and procedures. Also refer to AASHTO M 144, Sealed Glass Container.
Dust Palliative See Remarks See Remarks See Remarks See Remarks Refer to MP 715.01.20
Sodium Chloride See Note 2 Each shipment 3 lbs. See Note 1 Refer to ASTM D 632
Concrete Curing Materials
Liquid White Membrane
See Note 2 1 sample per lot or batch
1 qt. with manufacturer’s certification of conformity
See Note 1 Refer to AASHTO M 148, Cans
White Polyethylene Sheeting
See Note 2 Each shipment 1 piece, full width, 4 ft. long
See Note 1 Refer to AASHTO M 171
Waterproof Paper See Note 2 Each shipment 1 piece, full width, 4 ft. long
See Note 1 Refer to AASHTO M 171
Burlap See Note 2 Each shipment 1 piece, full width, 4 ft. long
See Note 1 Refer to AASHTO M 182

56
Material Location Minimum Frequency Size Test For Remarks
Plastic-Burlap Bonded See Note 2 Each shipment 1 piece, full width, 4 ft. long
See Note 1 See Note 1. Refer to AASHTO M 171
Concrete Deck Protective surface Treatment See Note*
See Note 2 Each shipment
1 qt. with manufacturer’s certification of conformity
See Note 1 Plastic or glass container. Original container requires sufficient agitation to insure homogenous mixture
Portland Cement Concrete Pavement See Note 6
1. Cores Job site See Note ** See Note ** Compressive Strength & Pavement Thickness See Note **
2. Cylinders Job site See Note *** See Note *** Compressive Strength (for opening to traffic) See Note ***
3. Mixture Job site 1 per 500 cu yd.; Min 2 per day
Consistency See Note 1
Job site 1 per 500 cu yd.; Min 2 per day
Air See Note 1
Job site; as appropriate
5 days of operation after first 5 days of operation
Yield See Note 1
NOTE * - (50% of boiled linseed oil and 50% petroleum spirits (natural spirits) by volume NOTE ** - Requirements for sampling and testing are set forth in 501.4.5 and 501.21 of the Standard Specifications and applicable Special Provisions. NOTE *** - Requirements for sampling and testing are set forth in 501.4.4.
Structural Concrete See Note 6 and Note 8
1. Concrete Cylinders
Job site
For each class concrete delivered and placed on a calendar day from a single supplier, one set for each 100 cu yd. or fraction thereof
Compressive Strength (See Remarks)
See Note *
NOTE * All cylinders shall be made, cured and shipped to the Laboratory as set forth in MP 711.03.28. When structural concrete is supplied to a project on a particular day by more than one supplier, the minimum frequency shall apply to the total quantity of a specified class of concrete supplied by each single supplier.

57
Material Location Minimum Frequency Size Test For Remarks A strength test performed by the laboratory shall be the result of testing the three cylinders in a set received from the field. The test result shall be the average of the three test values, except that if one cylinder in a set shows manifest evidence of improper sampling, molding, curing or testing it shall be discarded and the test result shall be the average of the remaining two test values. Should more than one cylinder in a set show manifest evidence of improper sampling, molding, curing or testing, the set of cylinders shall be discarded and not test result shall be reported. Additional cylinders may be made to control the removal of forms and falsework. The making and treatment of these cylinders is described in the governing Specifications and IM-9.
2. Mixture Job site
Br. Super. Conc. 1 for 1st
batch, & 1 for every 5 batches thereafter. Other structural concrete 1 per 100 cu yd., Min. of 1 per ½ day of operation.
Consistency
3. Mixture Job Sit
BR. Super. Conc. 1 per batch. Other Structural Concrete 1 per 100 cu yd., Min. of 1 per ½ day of operation.
Air
4. Mixture Plant or Job site, as appropriate
One for each ten sets of cylinders after the first ten.
Yield
Fencing Material
Post and Fittings See Note 2 Each shipment One post and fittings See Note 1
Chain Links See Note 2 Each shipment 1 piece 5 ft. long full height
See Note 1
Farm-Field Type See Note 2 Each shipment 1 piece 5 ft. long full height
See Note 1
Woven Wire Farm Fence
See Note 2 Each shipment 1 piece 5 ft. long full height
See Note 1
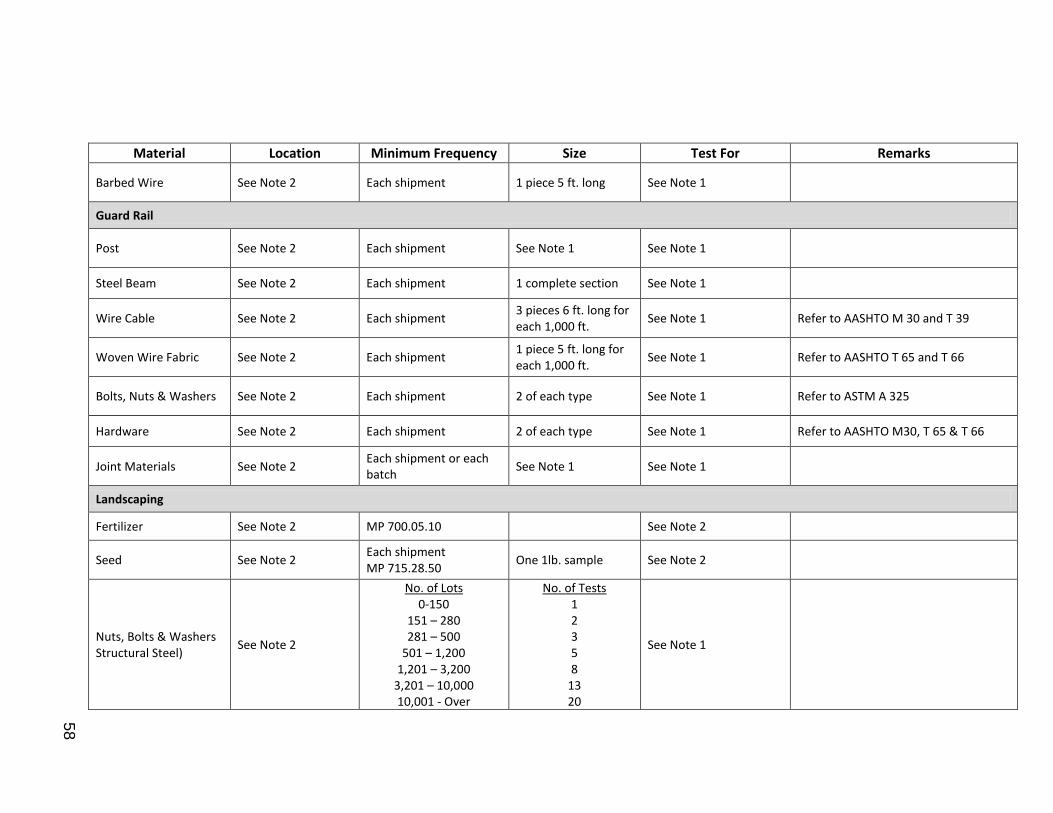
58
Material Location Minimum Frequency Size Test For Remarks
Barbed Wire See Note 2 Each shipment 1 piece 5 ft. long See Note 1
Guard Rail
Post See Note 2 Each shipment See Note 1 See Note 1
Steel Beam See Note 2 Each shipment 1 complete section See Note 1
Wire Cable See Note 2 Each shipment 3 pieces 6 ft. long for each 1,000 ft.
See Note 1 Refer to AASHTO M 30 and T 39
Woven Wire Fabric See Note 2 Each shipment 1 piece 5 ft. long for each 1,000 ft.
See Note 1 Refer to AASHTO T 65 and T 66
Bolts, Nuts & Washers See Note 2 Each shipment 2 of each type See Note 1 Refer to ASTM A 325
Hardware See Note 2 Each shipment 2 of each type See Note 1 Refer to AASHTO M30, T 65 & T 66
Joint Materials See Note 2 Each shipment or each batch
See Note 1 See Note 1
Landscaping
Fertilizer See Note 2 MP 700.05.10 See Note 2
Seed See Note 2 Each shipment MP 715.28.50
One 1lb. sample See Note 2
Nuts, Bolts & Washers Structural Steel)
See Note 2
No. of Lots 0-150
151 – 280 281 – 500
501 – 1,200 1,201 – 3,200
3,201 – 10,000 10,001 - Over
No. of Tests 1 2 3 5 8
13 20
See Note 1

59
Material Location Minimum Frequency Size Test For Remarks
Paint See Note 2 Each batch 1 unopened container
See Note 1
Pipe
Cast iron See Note 2 Each shipment Each diameter
See Note 1 Strength See Note 1
Project Engineer should make visual inspection of each type & size
Clay See Note 2 Each shipment Each diameter. 2 full length pieces
See Note 1 See Note 1 Project Engineer should make visual inspection of each type & size
Concrete See Note 2 Each shipment Each diameter
See Note 1 See Note 1 Project Engineer should make visual inspection of each type & size. Refer to IM -14.
Corrugated metal & Sectional Plates Coated or Uncoated
See Note 2 See Note 1 See Note 1 See Note 1 Project Engineer should make visual inspection of each type, size and gage.
Steel Bearing Pile, Sheet Pile, Caisson Pipe
Job Site See Remarks See Remarks See Remarks Refer to MP 616.14.50
Portland Cement See Note 2 See Remarks See Remarks See Note 1 Refer to AASHTO T127 for sampling techniques and procedures
Reinforcing Steel Bars See Note 2 Each shipment & each sized and each heat number
One 5 ft. length See Note 1 See Remarks
For bar sizes No. 3 to 11, inclusive, one tension test and one bend test shall be made of the largest size rolled from each heat. If, however, material from one heat differs by three or more designation numbers, one tension and one bend test shall be made from both the highest and lowest designation number of the deformed bars rolled. In the case of Nos. 14 and 18 bars, one tension test shall be made of each size rolled from each heat. See AASHTO M 31.
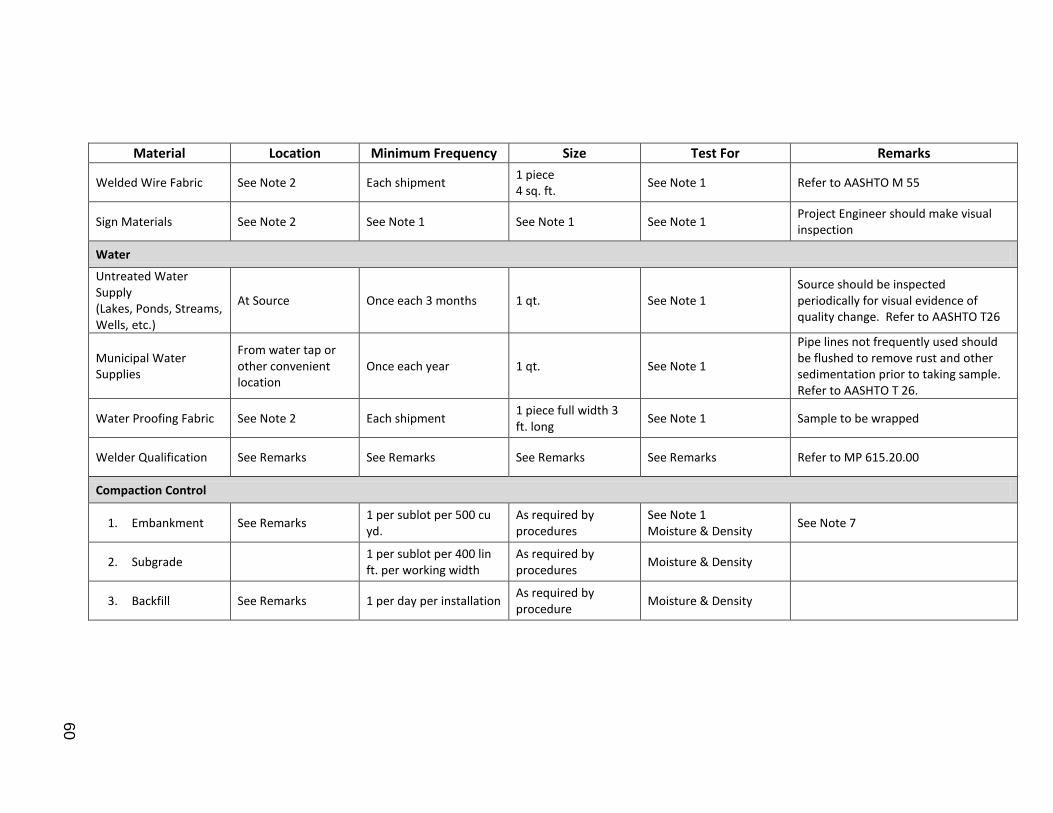
60
Material Location Minimum Frequency Size Test For Remarks
Welded Wire Fabric See Note 2 Each shipment 1 piece 4 sq. ft.
See Note 1 Refer to AASHTO M 55
Sign Materials See Note 2 See Note 1 See Note 1 See Note 1 Project Engineer should make visual inspection
Water
Untreated Water Supply (Lakes, Ponds, Streams, Wells, etc.)
At Source Once each 3 months 1 qt. See Note 1 Source should be inspected periodically for visual evidence of quality change. Refer to AASHTO T26
Municipal Water Supplies
From water tap or other convenient location
Once each year 1 qt. See Note 1
Pipe lines not frequently used should be flushed to remove rust and other sedimentation prior to taking sample. Refer to AASHTO T 26.
Water Proofing Fabric See Note 2 Each shipment 1 piece full width 3 ft. long
See Note 1 Sample to be wrapped
Welder Qualification See Remarks See Remarks See Remarks See Remarks Refer to MP 615.20.00
Compaction Control
1. Embankment See Remarks 1 per sublot per 500 cu yd.
As required by procedures
See Note 1 Moisture & Density
See Note 7
2. Subgrade 1 per sublot per 400 lin ft. per working width
As required by procedures
Moisture & Density
3. Backfill See Remarks 1 per day per installation As required by procedure
Moisture & Density

61
NOTES:
1. Refer to governing section of contract documents.
2. Materials that have not been pre-sampled or pre-tested by Materials Control, Soil and Testing Division will require sampling at point of delivery. Certain sources have shown by analysis of past test results that they are able to deliver consistent products. These sources are listed periodically as certified mills, terminals, sources, etc., and are acceptable for us on the project site. No further testing of these materials is required, provided sufficient documentation is supplied to the Inspector from the Contractor to establish the source of material. The project office shall maintain an up-to-date list of these sources.
3. All tests required by contract documents except Los Angeles abrasion (L.A.) soundness, mortar strength, organic impurities and deleterious substances (analysis optional). These tests may include, but shall not be limited to the following: Atterberg limits (plastic limit, liquid limit and plasticity index) percent face fracture (single face and multi-face face fracture), unit weight, etc.
4. Test by Materials Control, Soil and Testing Division for the following: Los Angeles abrasion (L.A.), soundness, deleterious substances, mortar strength and organic impurities.
5. For certified or pre-tested materials, samples should be taken at the point of delivery as follows: Frequency: Average – One sample each 50,000 gal; Minimum – One sample each 100,000 gal. These frequencies may include record samples obtained by Central Laboratory personnel. For shipments that are not certified or per-tested, sampling frequency at the point of deliver shall be one sample per shipment. Certified materials are those included in the current list of certified bituminous suppliers. Pretested shipment will either be sealed with a CT tag, or the shipping documents will list a laboratory number from which test coverage may be obtained.
6. All quantities or Portland cement concrete from A1 plants and quantities of miscellaneous concrete (as defined by IM-18) from A2 plants must be treated in the following manner: A minimum of ten samples per month will be randomly selected from plant production and tested by the Department for compressive strength, air content, and

62
consistency. Yield will be checked on one of the above samples. A minimum of four of the ten samples outlined above will include observation of the batching operation at the plant of the concrete to be sampled to check operational control and obtain aggregate samples for gradation testing. In the event that production is estimated to be insufficient to fulfill the above requirements, a minimum of one sample per two days of operation will be tested by the Department for compressive strength, air content and consistency. One yield test will be conducted peer ten samples. A minimum of 40 percent of the above samples will include observation of the batching operation at the plant of the concrete to be sampled to check operational control and obtain aggregate samples for gradation testing, except that not more than four such checks will be required in one month. For testing in either A1 or A2 plants, project personnel may substitute observation of the Contractor’s quality control tests in lieu of the testing normally required by Table 700.3, except that occasional testing may be done on the project to monitor the Contractor’s program. In the event that the Contractor’s quality control testing does not provide sufficient data to meet the requirements of Table 700.3, additional testing will be done by the Department to complete the minimum frequency required.
7. Acceptance: Need to refer to acceptance on a lot to lot basis 106.3.1 AP-A Acceptance Plan.
8. The sampling frequency and tests for structural concrete also apply to Portland cement concrete pavement where coring is considered impractical, and to all structural items constructed with pavement concrete (i.e. approach slabs) when authorized in the Specifications.

63
Appendix II – Material Procedure 700.00.06
Material Procedure 700.00.06
Aggregate Sampling Procedure

64
MP 700.00.06 REPLACES: ML-26 ORIGINAL ISSUANCE: MARCH 1968 REVISED: DECEMBER 1988 REISSUED: JANUARY 1995 AMENDED FOR MANUAL 10/04 PAGE 1 OF 7
WEST VIRGINIA DEPARTMENT OF TRANSPORTATION DIVISION OF HIGHWAYS
MATERIALS CONTROL, SOILS AND TESTING DIVISION
MATERIALS PROCEDURE
AGGREGATE SAMPLING PROCEDURES
1.0 PURPOSE 1.1 To provide a uniform procedure for obtaining aggregate samples. 2.0 SCOPE 2.1 This procedure shall apply to the following:
(a) Process Control sampling by the Contractor.
(b) Acceptance Sampling by the Division.
(c) Independent Assurance Sampling by the Division.
(d) Record Sampling by the Division. 3.0 GENERAL 3.1 Taking a good sample is just as important as conducting a good test. The
sampler must use every precaution to obtain samples that will show the true nature and condition of the material they represent.
3.2 Most aggregates are mixtures of various particle sizes, which tend to separate,
or segregate, during transporting or stockpiling. For this reason aggregate samples should be obtained at the last practical point before the material is incorporated into the finished product or before compaction.
3.3 Frequency of sampling will be in accordance with the applicable directives for
the type sample being procured.
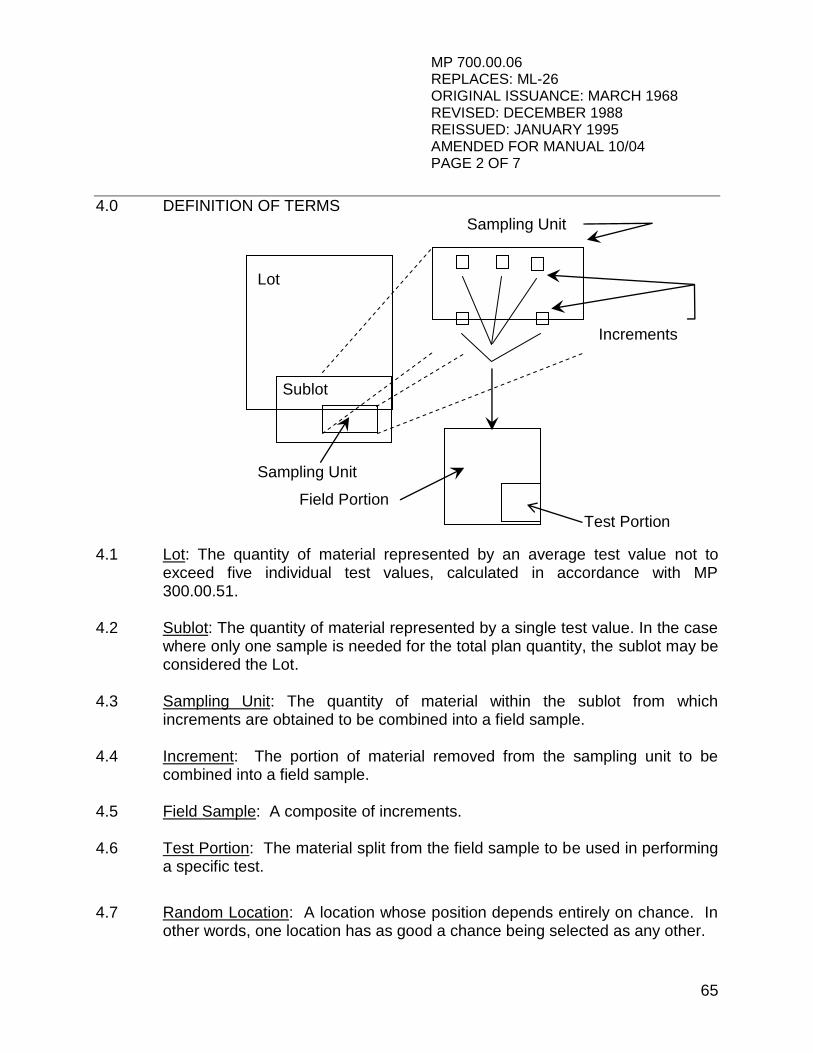
65
MP 700.00.06 REPLACES: ML-26 ORIGINAL ISSUANCE: MARCH 1968 REVISED: DECEMBER 1988 REISSUED: JANUARY 1995 AMENDED FOR MANUAL 10/04 PAGE 2 OF 7
4.0 DEFINITION OF TERMS Sampling Unit
Lot
Increments
Sublot
Sampling Unit
Field Portion
4.1 Lot: The quantity of material represented by an average test value not to exceed five individual test values, calculated in accordance with MP 300.00.51.
4.2 Sublot: The quantity of material represented by a single test value. In the case
where only one sample is needed for the total plan quantity, the sublot may be considered the Lot.
4.3 Sampling Unit: The quantity of material within the sublot from which
increments are obtained to be combined into a field sample. 4.4 Increment: The portion of material removed from the sampling unit to be
combined into a field sample. 4.5 Field Sample: A composite of increments. 4.6 Test Portion: The material split from the field sample to be used in performing
a specific test.
4.7 Random Location: A location whose position depends entirely on chance. In other words, one location has as good a chance being selected as any other.
Test Portion

66
MP 700.00.06 REPLACES: ML-26 ORIGINAL ISSUANCE: MARCH 1968 REVISED: DECEMBER 1988 REISSUED: JANUARY 1995 AMENDED FOR MANUAL 10/04 PAGE 3 OF 7
5.0 CONTRACTOR RESPONSIBILITY 5.1 The Contractor shall provide suitable equipment needed for proper inspection
and sampling, including required access and any special equipment necessary to comply with the appropriate sampling techniques outlined herein. (See Section 105.5 (5th Paragraph) and Section 105.11 (1st Paragraph) of the 2000 Standard Specifications for Roads and Bridges.)
6.0 SAMPLING PROCEDURES 6.1 There are four general areas from which aggregate samples are usually
obtained. These include (1) Sampling from the roadway after the aggregate has been placed, but prior to compaction, (2) Sampling from a conveyor belt, (3) Sampling from a flowing stream of aggregate, and (4) Sampling from stockpiles.
6.1.1 Sampling from the roadway (e.g., bases and subbases). The first step in
obtaining a roadway sample is to locate the sublot. This is usually the quantity of material that will be represented by the one sample and is defined as a section of roadway of given width and length. The next step is to randomly locate a sampling unit within the sublot. A sampling unit is defined as an area having dimensions of approximately12 feet by 12 feet, or an area of approximately 144 feet2 in locations having any dimension less than 12 feet. Locating the sampling unit is accomplished by use of random numbers contained in Attachment I. Any pair of numbers (decimals) may be used to locate a sampling unit within the sublot. To locate the sampling unit in a sublot defined by area, the length of the area, in feet, is multiplied by one decimal of the pair, and width is multiplied by the other decimal. The resulting distances are to be measured from one end and one side of the area. For example, a sublot of material consists of base course aggregate 26 feet wide from Station 956+00 to 965+00. The total length in feet is thus 96500 minus 95600, or 900 feet. A pencil tossed on Attachment I points to the pair of decimals 0.115 and 0.447. To locate the sampling unit, the first decimal is multiplied by the length of the sublot, and the companion decimal is multiplied by the width.

67
MP 700.00.06 REPLACES: ML-26 ORIGINAL ISSUANCE: MARCH 1968 REVISED: DECEMBER 1988 REISSUED: JANUARY 1995 AMENDED FOR MANUAL 10/04 PAGE 4 OF 7
The length value will be measured from Station 956+00 and the width value from the left-hand edge of the base. Thus, 900 times 0.115 equals 104, and 26 times 0.447 equals 12, so the sampling unit would be located at Station 956+00 plus 1+04, or 957+04 at 12 feet from the left edge. This point could define the center or any corner of the sampling unit. If we use the center, a 12 foot by 12 foot sampling unit would fall between Stations 956+98 and 957+l0 with longitudinal boundaries 6 feet and 18 feet from the left edge of the base. Five approximately equal increments are then located within the sampling unit. This is also best accomplished by means of the random numbers in Attachment 1. Procedures to follow are essentially the same as those set forth for locating the sample unit. The five increments are taken from the sampling unit and combined to form a field sample whose weight equals or exceeds the minimum recommended in Table 1. All increments shall be taken from the roadway for the full depth of the material being sampled, care being taken to exclude any foreign material which may have been incorporated during the normal construction process. The specific areas from which each increment is to be removed shall be clearly marked; a metal template placed over the area is a definite aid in securing approximately equal increment weights.
6.1.2 Sampling from a Conveyor Belt. The first step in obtaining a sample from the
conveyor belt is to define the sublot. This is generally defined as a unit of time, i.e., a half-day or a day's production. The next step is to randomly locate a sampling unit within the sublot. A sampling unit in this case is generally considered to be the material contained within the length of the conveyor. Locating the sampling unit is accomplished by use of the random numbers contained in Attachment I. Any number may be used to locate a sampling unit within the sublot. To locate the sampling unit in a sublot defined by time, the length of time, usually in minutes, is multiplied by the random decimal obtained from Attachment I. For example, a sublot of material consists of concrete aggregate used in a half-day's production estimated to be between 8:00 a.m. and 12:00 noon. A pencil tossed on Attachment I points to decimal 0.279. Thus, the sampling unit would be located somewhere within the four hour period (8:00 a.m. to 12:00 noon). Four (hours) times 60 (minutes per hour) times 0.279 equals 67 minutes. The sampling unit would be located 67 minutes after the 8:00 a.m. startup; or at 9:07 a.m. (or as soon thereafter as practical). Five randomly located, approximately equal increments are obtained from the sampling unit and

68
MP 700.00.06 REPLACES: ML-26 ORIGINAL ISSUANCE: March 1968 REVISED: December 1988 REISSUED: JANUARY 1995 AMENDED FOR MANUAL 10/04 PAGE 5 OF 7
combined to form a field sample whose weight equals or exceeds the minimum recommended in Table 1. The location of the five increments is determined by multiplying the length of the belt by five random numbers. The conveyor belt is stopped while the increments are being obtained. Two templates, conforming to the shape of the belt and spaced such that the material contained between them will yield an increment of the required size, are inserted into the aggregate stream on the belt. All material between the templates is carefully scooped into a suitable container, including all fines on the belt collected with a brush and dustpan.
6.1.3 Sampling from a Flowing Aggregate Stream (bin or belt discharge). Definition
of the sublot and location of the sampling unit is generally identical with sampling from a conveyor belt, with the exception that the sampling unit in this case is defined as that material which will flow during a five minute period. Once the sampling unit is located, five approximately equal increments, randomly spaced, are obtained and combined to form a field sample whose weight equals or exceeds the minimum recommended in Table 1. Each increment is taken from the entire cross-section of the material as it is being discharged. It is usually necessary to have a special device constructed for use at each particular plant. This device will consist of a pan of sufficient size to intercept the entire cross-section of the discharge stream and hold the required quantity of material. A set of rails may be necessary to support the pan as it is passed under the discharge stream. If the sampling pan overflows, it should be struck level so that only material that is within the pan is retained.
6.1.4 Sampling from a Stockpile. If possible, stockpile sampling should be avoided
when sampling to determine the gradation of an aggregate. However, circumstances sometimes make it necessary, and when this occurs, a sampling plan and the number of samples to be taken must be considered for each specific case. Stockpiled aggregates tend to segregate with the coarser particles rolling to the outside base of the pile, which makes gradation representation difficult. Because of this, every effort should be made to enlist the services of power equipment (such as a front-end loader) to develop a separate small sampling pile composed of material taken from various levels and depths in the main pile. Increments from this pile may be combined, thoroughly mixed, and reduced by quartering and/or sample

69
MP 700.00.06 REPLACES: ML-26 ORIGINAL ISSUANCE: MARCH 1968 REVISED: DECEMBER 1988 REISSUED: JANUARY 1995 AMENDED FOR MANUAL 10/04 PAGE 6 OF 7
splitter to obtain the field sample. Methods for quartering and splitting samples are given in AASHTO T248. If power equipment is not available, hand sampling may be employed to obtain at least three increments per sample: One increment taken from the top one third of the pile, one from the middle and one from the bottom third. When hand sampling, the outer layer of the pile should be removed (scraped away with the shovel) at the point prior to sampling.
7.0 WEIGHTS REQUIRED 7.1 Field Sample Weights
Field sample weights as listed in Table I are minimum values. Actual weights required must be predicated on the type and number of tests to which the material is to be subjected. Generally speaking, the amounts specified in Table I will provide adequate material for routine gradation and quality analysis.
7.2 Test Portion Weight
The weight of the test portion to be obtained from the field sample for a particular test will be defined in the Standard Procedures of the test involved. Reduction of the field sample into test portions is done with a sample splitter. The weight of test portion recommended for gradation testing is given in Table II.
8.0 TRANSPORTING SAMPLES 8.1 Testing at Site of Sampling
Samples taken for testing In the field may be placed in any suitable clean container of appropriate size which is secure enough to prevent loss of material when transporting the sample to the testing location.

70
MP 700.00.06 REPLACES: ML-26 ORIGINAL ISSUANCE: MARCH 1968 REVISED: DECEMBER 1988 AMENDED FOR MANUAL 10/04 REISSUED: JANUARY 1995 PAGE 7 OF 7
8.2 Samples to be Shipped from Site of Sampling
Samples to be shipped should be placed in standard sampling sacks. If the sample contains an appreciable quantity of fine material, a plastic liner should be put in the sack to prevent loss of the fines. Each sack must be securely tied to prevent loss of material in transit. It is also essential that sample identification be maintained from the field to the testing site. Each sack must have appropriate indelible identification attached and enclosed so that field reporting, laboratory logging, and test reporting may be facilitated.
Gary L. Robson, Director Materials Control, Soils and Testing Division
GLR:w Attachments

71
MP 700.00.06 REPLACES: ML-26 ORIGINAL ISSUANCE: MARCH 1968 REVISED: DECEMBER 1988 REISSUED: JANUARY 1995 ATTACHMENT NUMBER: 1 AMENDED FOR MANUAL 10/04 PAGE 1 OF 3
TABLE I
WEIGHT OF SAMPLES
Normal Maximum Size of Particles Minimum Weight of Field Samples
Sieve Size Kilo lb
No. 8 10 25
No. 4 10 25
3/8 in. 10 25
1/2 in. 15 35
3/4 in. 25 55
1 in. 50 110
1 1/2 in. 75 165
2 in. 100 220
2 ½ in. 125 275
3 in. 150 330
3 1/2 in. 175 385
*The nominal maximum size of particles is defined as the largest sieve size listed in the applicable specifications upon which any material is permitted to be retained. Exception: If the specification tolerances are such that no sieve listed has a range of X-100 percent passing, then the next smallest standard sieve, as listed in Table I, and below that sieve which 100 percent must past will be considered the nominal maximum size.

72
MP 700.00.06 REPLACES: ML-26 ORIGINAL ISSUANCE: MARCH 1968 REVISED: DECEMBER 1988 REISSUED: JANUARY 1995 ATTACHMENT NUMBER: 1 AMENDED FOR MANUAL 10/04 PAGE 2 OF 3
TABLE II
TEST PORTION FOR GRADATION
Normal Maximum Size of Particles Minimum Weight of Test Portion
Sieve Size kg lb.
No. 8 0.3 0.7
No. 4 0.3 0.7
3/8 in. 1.0 2.0
1/2 in. 2.0 4.0
3/4 in. 5.0 11.0
1 in. 10.0 22.0
1 1/2in. 15.0 33.0
2 in. 20.0 44.0
2 ½ in 35.0 77.0
3 in. 60.0 130.0
3 ½ in 100.0 220.0

73
MP 700.00.06 REPLACES: ML-26 ORIGINAL ISSUANCE: MARCH 1968 REVISED: DECEMBER 1988 REISSUED: JANUARY 1995 ATTACHMENT NUMBER: 1 AMENDED FOR MANUAL 10/04 PAGE 3 OF 3
ATTACHMENT I
RANDOM NUMBERS
.858 .082 .886 .125 .263 .176 .551 .711 .355 .698 .576 .417 .242 .316 .960 .879 .444 .323 .331 .179 .587 .288 .835 .636 .596 .174 .866 .685 .066 .170 .068 .391 .139 .002 .159 .423 .629 .631 .979 .399 .140 .324 .215 .358 .663 .193 .215 .667 .627 .595 .574 .601 .623 .855 .339 .486 .065 .627 .458 .137 .966 .589 .751 .308 .025 .836 .200 .055 .510 .656 .608 .910 .944 .281 .539 .371 .217 .882 .324 .284 .215 .355 .645 .450 .719 .057 .287 .146 .135 .903 .761 .883 .711 .388 .928 .654 .815 .570 .539 .600 .869 .222 .115 .447 .658 .989 .921 .924 .560 .447 .562 .036 .302 .673 .911 .512 .972 .576 .838 .014 .481 .791 .454 .731 .770 .500 .980 .183 .385 .012 .599 .966 .356 .183 .797 .503 .180 .657 .077 .165 .464 .747 .299 .530 .675 .646 .385 .109 .780 .699 .675 .654 .221 .777 .172 .738 .324 .669 .079 .587 .269 .707 .372 .486 .340 .680 .928 .397 .337 .564 .338 .917 .942 .985 .838 .805 .278 .898 .906 .939 .130 .575 .195 .887 .142 .488 .316 .935 .403 .629 .011 .283 .762 .988 .102 .068 .902 .850 .569 .977 .683 .441 .572 .486 .732 .721 .275 .023 .088 .402 .493 .155 .530 .125 .841 .171 .794 .850 .797 .367 .059 .502 .963 .055 .128 .655 .043 .293 .792 .739 .996 .729 .370 .139 .306 .858 .183 .464 .457 .863 .240 .972 .495 .696 .350 .642 .188 .135 .470 .765

74
Appendix III - AASHTO Table 703.4
Table 703.4
Standard Sizes of Coarse Aggregate
AASHTO M 43
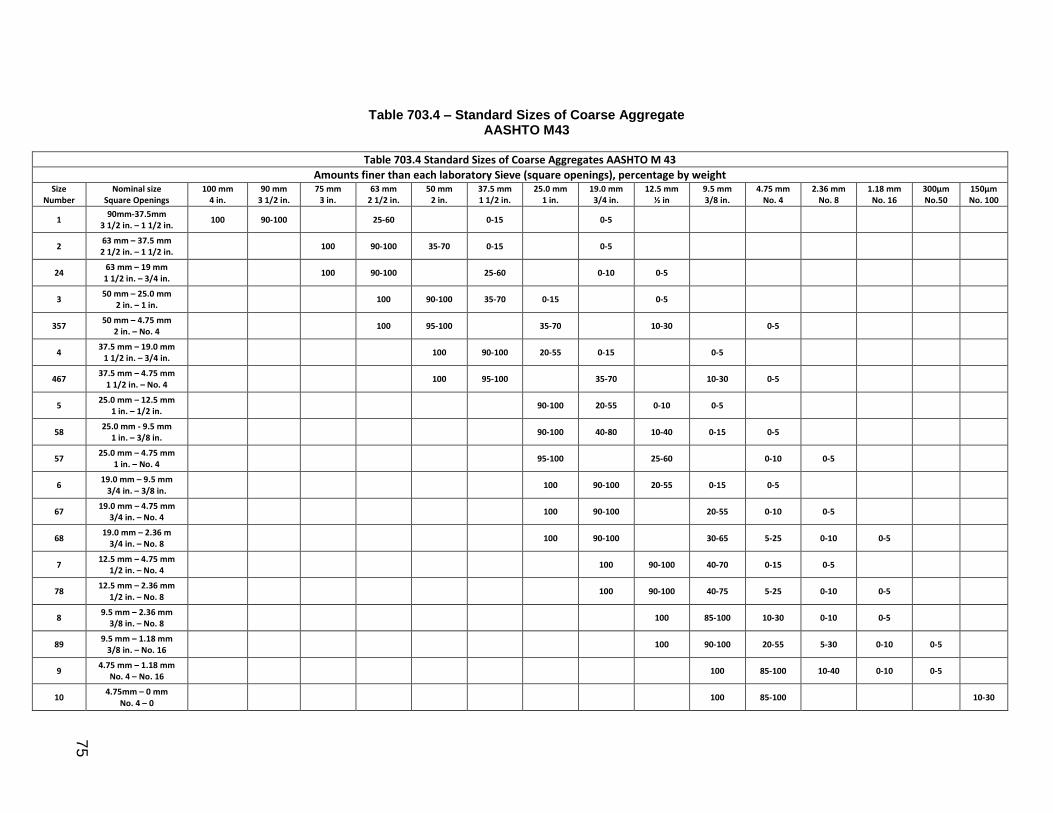
75
Table 703.4 – Standard Sizes of Coarse Aggregate AASHTO M43
Table 703.4 Standard Sizes of Coarse Aggregates AASHTO M 43
Amounts finer than each laboratory Sieve (square openings), percentage by weight Size
Number Nominal size
Square Openings 100 mm
4 in. 90 mm
3 1/2 in. 75 mm
3 in. 63 mm
2 1/2 in. 50 mm
2 in. 37.5 mm 1 1/2 in.
25.0 mm 1 in.
19.0 mm 3/4 in.
12.5 mm ½ in
9.5 mm 3/8 in.
4.75 mm No. 4
2.36 mm No. 8
1.18 mm No. 16
300µm No.50
150µm No. 100
1 90mm-37.5mm
3 1/2 in. – 1 1/2 in. 100 90-100 25-60 0-15 0-5
2 63 mm – 37.5 mm 2 1/2 in. – 1 1/2 in.
100 90-100 35-70 0-15 0-5
24 63 mm – 19 mm 1 1/2 in. – 3/4 in.
100 90-100 25-60 0-10 0-5
3 50 mm – 25.0 mm
2 in. – 1 in. 100 90-100 35-70 0-15 0-5
357 50 mm – 4.75 mm
2 in. – No. 4 100 95-100 35-70 10-30 0-5
4 37.5 mm – 19.0 mm
1 1/2 in. – 3/4 in. 100 90-100 20-55 0-15 0-5
467 37.5 mm – 4.75 mm
1 1/2 in. – No. 4 100 95-100 35-70 10-30 0-5
5 25.0 mm – 12.5 mm
1 in. – 1/2 in. 90-100 20-55 0-10 0-5
58 25.0 mm - 9.5 mm
1 in. – 3/8 in. 90-100 40-80 10-40 0-15 0-5
57 25.0 mm – 4.75 mm
1 in. – No. 4 95-100 25-60 0-10 0-5
6 19.0 mm – 9.5 mm
3/4 in. – 3/8 in. 100 90-100 20-55 0-15 0-5
67 19.0 mm – 4.75 mm
3/4 in. – No. 4 100 90-100 20-55 0-10 0-5
68 19.0 mm – 2.36 m
3/4 in. – No. 8 100 90-100 30-65 5-25 0-10 0-5
7 12.5 mm – 4.75 mm
1/2 in. – No. 4 100 90-100 40-70 0-15 0-5
78 12.5 mm – 2.36 mm
1/2 in. – No. 8 100 90-100 40-75 5-25 0-10 0-5
8 9.5 mm – 2.36 mm
3/8 in. – No. 8 100 85-100 10-30 0-10 0-5
89 9.5 mm – 1.18 mm
3/8 in. – No. 16 100 90-100 20-55 5-30 0-10 0-5
9 4.75 mm – 1.18 mm
No. 4 – No. 16 100 85-100 10-40 0-10 0-5
10 4.75mm – 0 mm
No. 4 – 0 100 85-100 10-30

76
Appendix IV – Table 704.6.2 – Bases
Gradation and Quality Requirements
Bases

77
Table 704.6.2 – Gradation and Quality Requirements
Note 1: The Los Angeles Abrasion value of aggregate comprising the base course shall be treated in the manner hereinafter
set forth to determine the specification requirement for the item:
LA≤50 None 50<LA≤65 Top 4 inches 65<LA≤80 Top 6 inches 80<LA Top 8 Inches Stabilization shall be accomplished with bituminous material or Portland cement in accordance with the applicable section of these specifications. When the depth indicated above exceeds the Plan depth for the item, the depth to be stabilized shall be the Plan depth. In the event the Contractor elects to stabilize the material, no separate payment will be made for the cost of such stabilization. If aggregates are blended to produce the base course material, the Los Angeles Abrasion Value used to determine the stabilization requirements shall be the highest value obtained from testing the individual component of the blend.
Sieve Size
Gradation Amounts Finer Than Each Laboratory Sieve (Square Openings), Percentage by Weight Los Angeles
Abrasion, Percent
Sodium Sulphate
Soundness, Percent
Liquid Limit
Plasticity Index
Deleterious Material Percent
3” 2 ½” 2” 1 1/2” 3/4” #4 #40 #100 #200 Max. Max. Max. Max. Max.
Class 1 100 50-90 20-50 5-20 0-7 50 12 25 6 5
Class 2 100 80-100 35-75 10-30 0-10 50 12 25 6 5
Class 4 100 50-95 20-60 5-35 Note 1 25 6 5
Class 5 100 30-90 0-25 25 6 5
Class 6 100 50-100 25-70 10-45 3-28 25 6 5
Class 7 90-100 0-5 With intermediate sizes between 6” & 4” represented 30
10 (by visual
observation)
Class 8 100 80-100 35-75 10-40 4-14 50 12 25 6 5
Class 9 100 80-95 50-70 20-40 0-8 50 12 25 6 5
Los Angeles Abrasion Value Assigned to the Base Course Aggregate
Stabilization Requirements

78
Appendix V – West Virginia Division of Highways – Form T100

79
T100
REV. 1-97
WEST VIRGINIA DIVISION OF HIGHWAYS
TEST SAMPLE DATA
Laboratory Number
Material Description Source Code
Materials Code Source
Date Received Item No. 1
Project ALP Item No. 2
Project Nu/Auth. Quantity
Date Sampled Unit
Sampled By Station
Field Sample Number Elevation
Bridge Number Offset
Test Required CS Tag Number
Other Identification
REMARKS

80
Appendix VI – Rounding Procedures
West Virginia Division of Highways Rounding Procedures
In order to remain consistent between all persons performing and recording
calculations, an acceptable system of rounding is essential. The following
rounding ‘rules’ are those used by the West Virginia Division of Highways. These
rules should be applied whenever numbers need to be rounded to the acceptable
degree of accuracy noted in specifications, support documents, etc.
Rounding procedures have been adopted from the standard method taught in
schools, and may be described as follows:
If the number following the last number to be retained is less than 5, the last
number to be retained is left unchanged and the number(s) following the last
number to be retained is/are discarded.
If the number following the last number to be retained is 5 or larger , increase the
last number to be retained by 1 and discard the number(s) following the last
number to be retained.