western balkans 12 - world...
TRANSCRIPT
FALL 2017
Job Creation Picks up
12W E S T E R N B A L K A N S
Pub
lic D
iscl
osur
e A
utho
rized
Pub
lic D
iscl
osur
e A
utho
rized
Pub
lic D
iscl
osur
e A
utho
rized
Pub
lic D
iscl
osur
e A
utho
rized
Highlights of the Western Balkans Regular Economic Report No. 12
y Economies in the Western Balkans continue to grow, with real GDP growth in the region expected to expand by 2.6 percent in 2017. Growth was stronger and investment-led in Albania, Kosovo, and Montenegro, and stable in Bosnia and Herzegovina, driven by consumption. The political crisis earlier this year subdued growth in FYR Macedonia, as a formidably cold winter did in Serbia.
y Despite staggeringly high unemployment, about 230,000 jobs were created in the region in the 12 months through June 2017 (a 3.8 percent increase); more than half were in the private sector. As a result, employment returned to pre-2008 levels in all Western Balkan countries except Bosnia and Herzegovina.
y Ensuring fiscal sustainability continues to be a priority for the Western Balkans, given still high public debt levels. In all countries except Serbia fiscal deficits are projected to be higher in 2017 than in 2016. Although revenues went up, budgets continue to be overburdened by nonproductive recurrent spending, which limits the scope for growth-enhancing policies.
y The medium-term economic outlook for the region is positive: growth is projected to reach 3.6 percent by 2019, driven by domestic demand supported by private consumption and investment. Exports are also expected to go up as growth in the Euro Area gains momentum.
y The economic outlook is, however, vulnerable to the risks of policy uncertainty and policy reversals that would negatively impact investment and growth. Strong growth in Europe would give the region a tail wind. Yet, as global interest rates normalize, countries in the Western Balkans will see their borrowing costs rise. To sustain growth, it will be necessary that they reduce fiscal and external imbalances and undertake bold structural reforms to make progress on the EU accession agenda.
Western Balkans Regular Economic Report No.12
Job Creation Picks Up
Fall 2017
Acknowledgements
This Regular Economic Report (RER) covers economic developments, prospects, and economic policies in the Western Balkans: Albania, Bosnia and Herzegovina, Kosovo, FYR Macedonia, Montenegro, and Serbia. The Western Balkans RER succeeds the South East Europe RER.
The report is produced twice a year by World Bank economists working on the Western Balkan countries. The authors are Ekaterina Vostroknutova and Marco Hernandez, task team leaders, Jeff Chelsky, Maria Davalos, Agim Demukaj, Sandra Hlivnjak, Johanna Jaeger, Suzana Jukic, Alena Kantarovich, Maryam Ali-Lothrop, Edith Kikoni, Sanja Madžarević-Šujster, Darjan Milutinovic, Trang Nguyen, Monica Robayo, Asli Senkal, Lazar Šestović, Hilda Shijaku, Bojan Shimbov, and Cevdet Cagdas Unal. Anne Grant provided assistance in editing, and Budy Wirasmo and Artem Kolesnikov assistance in designing. Valentina Martinovic, Nejme Kotere, Samra Bajramovic, Ivana Bojic, Enkelejda Karaj, Hermina Vukovic Tasic, Jasminka Sopova, Boba Vukoslavovic, Dragana Varezić, Mismake Galatis, and Leah Laboy assisted the team.
The dissemination of the report and external and media relations are managed by an External Communications team comprised of Lundrim Aliu, Anita Božinovska, Paul A. Clare, Ana Gjokutaj, Jasmina Hadžić, Carl P. Hanlon, Artem Kolesnikov, Vesna Kostić, John Mackedon, Mirjana Popović, Kym Louise Smithies, and Sanja Tanić.
The team is grateful to Linda Van Gelder (Regional Director for the Western Balkans); John Panzer (Director, Macroeconomics and Fiscal Management Global Practice); Gallina A. Vincelette (Practice Manager, Macroeconomics and Fiscal Management Global Practice); and the Western Balkans Country Management team for their guidance in preparation of this report. The team is also thankful for comments on earlier drafts of this report received from the Ministries of Finance and Central Banks in Western Balkans countries.
This Western Balkans RER and previous issues may be found at: www.worldbank.org/eca/wbrer/
© 2017 International Bank for Reconstruction and Development / The World Bank 1818 H Street NW Washington DC 20433 Telephone: 202-473-1000 Internet: www.worldbank.org
This work is a product of the staff of The World Bank with external contributions. The findings, interpretations, and conclusions expressed in this work do not necessarily reflect the views of The World Bank, its Board of Executive Directors, or the governments they represent.
The World Bank does not guarantee the accuracy of the data included in this work. The boundaries, colors, denominations, and other information shown on any map in this work do not imply any judgment on the part of The World Bank concerning the legal status of any territory or the endorsement or acceptance of such boundaries.
Rights and Permissions The material in this work is subject to copyright. Because The World Bank encourages dissemination of its knowledge, this work may be reproduced, in whole or in part, for noncommercial purposes as long as full attribution to this work is given. Any queries on rights and licenses, including subsidiary rights, should be addressed to World Bank Publications, The World Bank Group, 1818 H Street NW, Washington, DC 20433, USA; fax: 202-522-2625; e-mail: [email protected]
Contents
1. Overview 1
2. Growth dynamics expose vulnerabilities 4
3. Employment returns to pre-crisis levels and reduces poverty, helped by low inflation 6
4. Exports grow, but external vulnerabilities remain 11
5. Fiscal deficits increase, and fiscal space to support growth is limited 13
6. Credit recovers, driven by lending to households 17
7. A positive outlook, with a broad reform agenda ahead 20
Country Notes 27Albania 29Bosnia and Herzegovina 34Kosovo 39FYR Macedonia 44Montenegro 49Serbia 54
Key Economic Indicators 59
WESTERN BALKANS REGULAR ECONOMIC REPORT NO.12
vI | CONTENTs
List of Figures
Figure 2.1. Stronger growth in Albania, Kosovo, and Montenegro, and weaker growth in FYR Macedonia and Serbia 4
Figure 2.2. Except in FYR Macedonia, investment supported growth in 2017 5Figure 3.1. In all Western Balkan countries except Bosnia and Herzegovina,
employment reached pre-2008-crisis levels in 2017 7Figure 3.2. Although unemployment declined across the region, it remains high by
international standards 7Figure 3.3. Labor force participation rates remain low, especially for women 7Figure 3.4. More people seem to be joining the labor force and finding jobs 7Figure 3.5. Youth unemployment has fallen 9Figure 3.6. Public wages are higher than private ones 9Figure 4.1. By yearend-2017, the current account deficit is expected to widen slightly
in all countries in the region 11Figure 4.2. The widening of the CAD is mainly driven by goods imports 11Figure 4.3. FDI in the region has been relatively stable 12Figure 4.4. Portfolio inflows trended up indicating that sovereign debt was repaid 12Figure 5.1. Except in Serbia, deficits edged up in 2017 13Figure 5.2. Revenue gains helped finance higher capital spending in most of the region 13Figure 5.3. Greater capital investment largely drove the regional increase in spending 14Figure 5.4. Spending on public wages and social programs is high 14Figure 5.5. Public debt-to-GDP ratios fell in Serbia, Albania, and Bosnia and Herzegovina 15Figure 5.6. External PPG debt declined in countries that pursued fiscal consolidations 15Figure 6.1. Expanding credit supported economic growth 17Figure 6.2. Credit to households grew faster than credit to firms in most of the region 17Figure 6.3. Nonperforming loans are declining 18Figure 6.4. Banks are adequately capitalized 18
CONTENTs | vII
JOB CREATION PICKS UP
List of Tables
Table 1.1. The medium-term growth outlook for the Western Balkans is positive 1Table 7.1. A positive medium-term growth outlook 20
List of Boxes
Box 3.1. Unemployment: A Major Concern for Citizens throughout the Western Balkans. 8Box 7.1. How EU prospects may affect the economic outlook for the Western Balkans 21Box 7.2. Addressing structural issues in Kosovo’s labor market 23Box 7.3. Western Balkan progress on the EU accession agenda: Collaboration rather
than competition is essential 24
WESTERN BALKANS REGULAR ECONOMIC REPORT NO.12
vIII | CONTENTs
In 2017 economies in the Western Balkans have continued expanding by an estimated 2.6 percent. The region’s projected growth is less optimistic than the 3.2 percent expected when the Spring issue of this report was published and also lower than the 2.9 percent achieved in 2016, for several reasons. Albania, Kosovo, and Montenegro should grow faster in 2017 than in 2016, thanks to large projects financed by foreign direct investment (FDI) and a recovery in private consumption, as well as higher exports in the case of Kosovo. Bosnia and Herzegovina is projected to grow steadily at a similar rate as in the last two years. In FYR Macedonia and Serbia, however, growth is expected to weaken. In FYR Macedonia, political turmoil significantly affected investment. In Serbia, the region’s largest economy, a cold winter significantly depressed agricultural output and construction activity.
Table 1.1. The medium-term growth outlook for the Western Balkans is positive
Real GDP growth, percent
2016 2017f 2018f 2019f
Albania 3.4 3.8 3.6 3.5
Bosnia and Herzegovina 3.1 3.0 3.2 3.4
Kosovo 3.4 4.4 4.8 4.8
Macedonia, FYR 2.4 1.5 3.2 3.9
Montenegro 2.9 4.2 2.8 2.5
Serbia 2.8 2.0 3.0 3.5
WB6 2.9 2.6 3.3 3.6
Source: Central banks and national statistics offices; World Bank staff estimates and projections.
Almost a decade after the global financial crisis, employment has recovered to pre-2008 levels in all Western Balkan countries
except Bosnia and Herzegovina. About 230,000 jobs were created in the region in the 12 months ending in June 2017. More than half of these were in the private sector, mainly in services, both formal and informal. Kosovo recorded the highest employment growth for the 12-month period (8.5 percent). Although unemployment fell across the region, it is still high, ranging from 11.8 percent in Serbia to 30.6 percent in Kosovo. In particular, a disproportionate number of the unemployed have been without a job for a considerable time. Youth unemployment is also a concern: more than half of the youth are unemployed in Kosovo, with Albania having the lowest rate in June of 26.4 percent.
Growth, jobs, and relatively low inflation helped to reduce poverty in the Western Balkans. The combination of economic growth and job creation contributed to a decline estimated at 1 percentage point in the region’s poverty rate, which is projected to be 23.6 percent for 2017.1 This implies that about 124,000 people in the region have been lifted out of poverty since 2016.2 Household budgets were supported by still-subdued inflation and growth in real wages as private sector wages gained slightly on wages in the public sector.
While exports continued to rise, their contribution to growth was offset by rising imports of consumption goods, energy
1 The regional average excludes Bosnia and Herzegovina and Kosovo due to the difficulty in calculating PPP welfare aggregates.
2 These poverty figures reflect the middle-income country standardized benchmark of living on less than US$5.5 per day in 2011 purchasing-power-parity terms.
1. Overview
1. OvERvIEW | 1
JOB CREATION PICKS UP
imports due to bad weather, and project-related capital imports. On average, external positions in 2017 were relatively unchanged from 2016. Thanks to buoyant services exports, Albania’s external deficit narrowed by 1.3 percent of GDP. Because of rising imports of intermediate goods, energy, and consumption goods, Serbia’s external deficit widened by 1.5 percent of GDP. Montenegro’s already vulnerable external position deteriorated, with external deficit projected to be 18.6 percent in 2017, mostly due to the high import content of the Bar-Boljare highway construction. The highway was also responsible for a steep 5.7 percent increase in 2017 in Montenegro’s external public and publicly-guaranteed (PPG) debt, pushing it up to 58.6 percent of GDP.
Ensuring fiscal sustainability remains a priority for all Western Balkan countries. Fiscal deficits are projected to be higher in 2017 than in 2016 in all countries except Serbia, but the dynamics vary. After several years of fiscal consolidation, Serbia is expected to record a 2017 fiscal surplus of 0.3 percent of GDP. Albania kept its deficit quite stable, despite the subsidies to the energy sector necessitated by a summer drought. Highway construction pushed up Montenegro’s deficit and PPG debt, but in 2017 the country launched ambitious reforms to reduce the deficit and adopted a strategy to stabilize its debt by 2019. Higher deficits are projected in FYR Macedonia due to increases in social benefits and, as in Bosnia and Herzegovina and Kosovo, increases in public investment. Notably, the fiscal consolidation efforts of Serbia, Albania, and Bosnia and Herzegovina in recent years have reduced their public debt.
Gradual improvement in asset quality is supporting a recovery in credit to the private
sector; yet nonperforming loan (NPL) levels remain high. At just above 15 percent of total loans, Albania has the highest NPLs in the region, although NPLs have steadily declined from over 20 percent after the global financial crisis. NPLs also fell in other Western Balkan countries, thanks to targeted reforms and write-offs. Some countries are working to build up financial sector supervision in order to avoid future accumulation of NPLs. This year Albania and the Bosnia and Herzegovina’s Republika Srpska passed new insolvency laws, and Montenegro has adopted a law on voluntary financial restructuring. Meanwhile, Kosovo introduced a new system to enforce recovery on collateral. Overall, NPLs in the region are concentrated in a small number of domestic banks. Thus, more forceful political commitment may be required to reduce them further. Doing so is important because high stocks of NPLs deter credit growth. Further measures including deepening the financial sector so that it gives stronger support to economic growth; diversifying bank funding sources; and building up the nonbank financial sector would help reduce NPLs.
The medium-term economic outlook for the Western Balkans is positive: Growth is projected to rise from 2.6 percent in 2017 to 3.3 percent in 2018 and 3.6 percent in 2019. Private consumption is likely to continue to drive growth, with support from investment and heightened exports. In particular, upgraded growth in the Euro Area would drive up demand for Western Balkan exports. Albania’s growth rate is expected to moderate with the completion of two large FDI projects. Growth in Bosnia and Herzegovina is expected to pick up, supported primarily by domestic demand. An expected expansion in public investment and broad-based exports and production
WESTERN BALKANS REGULAR ECONOMIC REPORT NO.12
2 | 1. OvERvIEW
growth should push up growth in Kosovo. In FYR Macedonia, growth is likely to recover as confidence improves with the resolution of the political crisis. In Montenegro, growth is projected to slow significantly in 2018–19 as the planned fiscal consolidation suppresses consumption and as construction of the Bar-Boljare highway is completed. In Serbia, over the medium term higher consumption and investment and a recovery in agricultural production should drive growth.
The risks to the outlook stem mostly from domestic sources, although there are also risks related to the global outlook. Domestically, the main risk is policy uncertainty or policy reversals that could affect investment and growth. But with risk comes opportunity: advancing structural reforms and the EU accession agenda will enhance the growth prospects of Western Balkan countries. Externally, stronger growth in the EU and still-favorable global liquidity conditions provide a tail wind for the Western Balkans. However, stronger EU growth is likely to be accompanied by an unwinding of the European Central Bank’s quantitative easing program, which will push up global interest rates and thus Western Balkan borrowing costs. In this scenario, countries like Serbia and Montenegro, with relatively high US dollar-denominated debt, could face additional pressures.
Sustaining the reform momentum is vital for improving living standards and creating opportunities for all residents of the Western Balkans. For countries undergoing fiscal consolidation, it is particularly important to sustain reform momentum. Albania, Bosnia and Herzegovina, Montenegro, and Serbia are improving their fiscal positions, thus reducing risks and improving medium-term
growth prospects. And just as important as not overspending is spending better. To this end, all Western Balkans countries can improve the quality of their fiscal policy by reallocating spending from a multitude of untargeted social benefits to productivity-enhancing investment. This would support growth and, during difficult times, help safeguard gains already achieved. To bring in more revenue, broadening the tax base, reducing tax exemptions, and collecting taxes more efficiently would generate additional resources to finance growth-enhancing policies. It is important to note that at current growth rates, it would take about six decades for average per capita Western Balkan income to converge to the average for EU residents. With faster growth of 5 to 6 percent, convergence could be achieved in just two decades. That will require a bold and sustained implementation of structural reforms and steady progress in EU accession processes.
1. OvERvIEW | 3
JOB CREATION PICKS UP
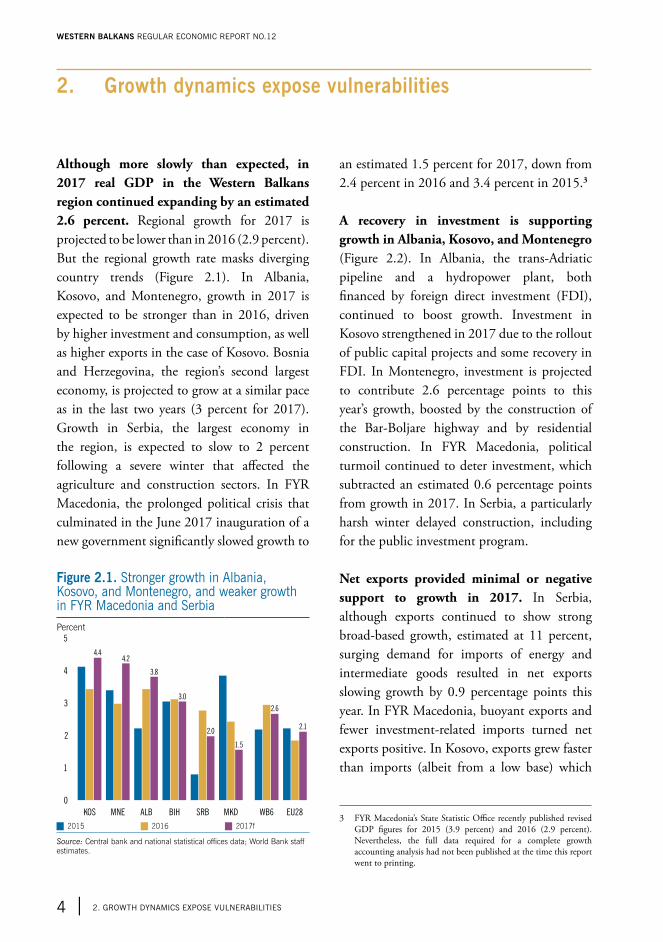
Although more slowly than expected, in 2017 real GDP in the Western Balkans region continued expanding by an estimated 2.6 percent. Regional growth for 2017 is projected to be lower than in 2016 (2.9 percent). But the regional growth rate masks diverging country trends (Figure 2.1). In Albania, Kosovo, and Montenegro, growth in 2017 is expected to be stronger than in 2016, driven by higher investment and consumption, as well as higher exports in the case of Kosovo. Bosnia and Herzegovina, the region’s second largest economy, is projected to grow at a similar pace as in the last two years (3 percent for 2017). Growth in Serbia, the largest economy in the region, is expected to slow to 2 percent following a severe winter that affected the agriculture and construction sectors. In FYR Macedonia, the prolonged political crisis that culminated in the June 2017 inauguration of a new government significantly slowed growth to
an estimated 1.5 percent for 2017, down from 2.4 percent in 2016 and 3.4 percent in 2015.3
A recovery in investment is supporting growth in Albania, Kosovo, and Montenegro (Figure 2.2). In Albania, the trans-Adriatic pipeline and a hydropower plant, both financed by foreign direct investment (FDI), continued to boost growth. Investment in Kosovo strengthened in 2017 due to the rollout of public capital projects and some recovery in FDI. In Montenegro, investment is projected to contribute 2.6 percentage points to this year’s growth, boosted by the construction of the Bar-Boljare highway and by residential construction. In FYR Macedonia, political turmoil continued to deter investment, which subtracted an estimated 0.6 percentage points from growth in 2017. In Serbia, a particularly harsh winter delayed construction, including for the public investment program.
Net exports provided minimal or negative support to growth in 2017. In Serbia, although exports continued to show strong broad-based growth, estimated at 11 percent, surging demand for imports of energy and intermediate goods resulted in net exports slowing growth by 0.9 percentage points this year. In FYR Macedonia, buoyant exports and fewer investment-related imports turned net exports positive. In Kosovo, exports grew faster than imports (albeit from a low base) which
3 FYR Macedonia’s State Statistic Office recently published revised GDP figures for 2015 (3.9 percent) and 2016 (2.9 percent). Nevertheless, the full data required for a complete growth accounting analysis had not been published at the time this report went to printing.
2. Growth dynamics expose vulnerabilities
Figure 2.1. stronger growth in Albania, Kosovo, and Montenegro, and weaker growth in FYR Macedonia and serbiaPercent
5
4
3
2
1
0
KOS ALB BIH
3.8
SRB
3.0
MNE
2.0
WB6
2.6
EU28
2.1
MKD
1.5
4.24.4
J 2015 J 2016 J 2017f
Source: Central bank and national statistical offices data; World Bank staff estimates.
WESTERN BALKANS REGULAR ECONOMIC REPORT NO.12
4 | 2. GROWTh dYNAMICs ExPOsE vULNERABILITIEs
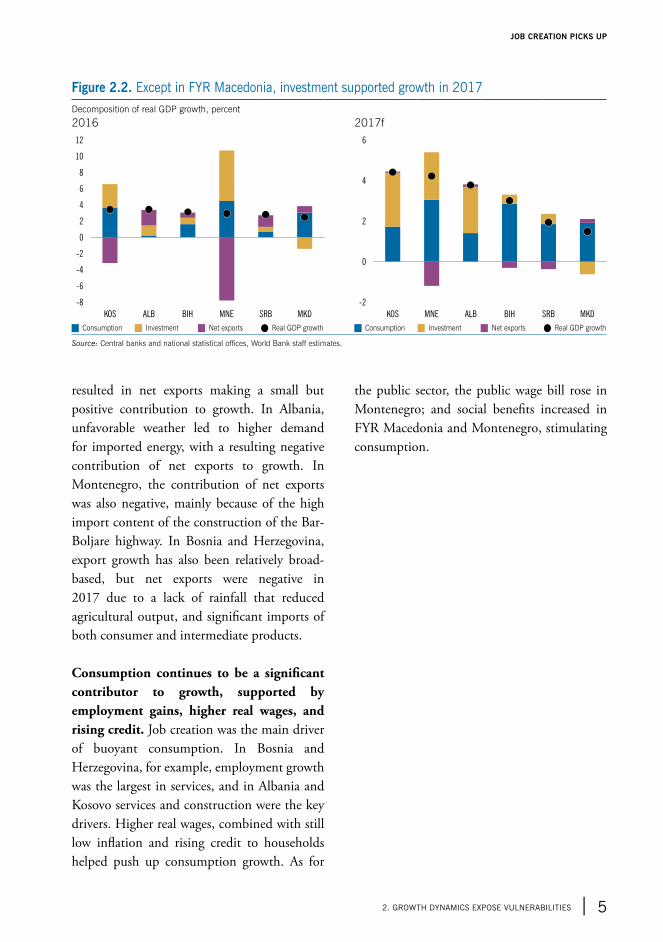
resulted in net exports making a small but positive contribution to growth. In Albania, unfavorable weather led to higher demand for imported energy, with a resulting negative contribution of net exports to growth. In Montenegro, the contribution of net exports was also negative, mainly because of the high import content of the construction of the Bar-Boljare highway. In Bosnia and Herzegovina, export growth has also been relatively broad-based, but net exports were negative in 2017 due to a lack of rainfall that reduced agricultural output, and significant imports of both consumer and intermediate products.
Consumption continues to be a significant contributor to growth, supported by employment gains, higher real wages, and rising credit. Job creation was the main driver of buoyant consumption. In Bosnia and Herzegovina, for example, employment growth was the largest in services, and in Albania and Kosovo services and construction were the key drivers. Higher real wages, combined with still low inflation and rising credit to households helped push up consumption growth. As for
the public sector, the public wage bill rose in Montenegro; and social benefits increased in FYR Macedonia and Montenegro, stimulating consumption.
Figure 2.2. Except in FYR Macedonia, investment supported growth in 2017Decomposition of real GDP growth, percent
2016 2017f
KOS ALB BIH MNE SRB MKD
-8
-6
12
10
8
6
4
2
0
-4
-2
BIHKOS SRBALBMNE MKD
-2
6
4
2
0
J Consumption J Investment J Net exports Q Real GDP growth J Consumption J Investment J Net exports Q Real GDP growth
Source: Central banks and national statistical offices, World Bank staff estimates.
2. GROWTh dYNAMICs ExPOsE vULNERABILITIEs | 5
JOB CREATION PICKS UP
In 2017, employment in most countries finally returned to the rates preceding the global financial crisis. In the Western Balkans, about 230,000 new jobs were created in the 12 months through June, with employment growth averaging 3.8 percent.4 Jobs grew fastest in Kosovo, where employment went up by 8.5 percent year-on-year,5 supported by economic growth and a speeded-up public investment program; job creation was broad-based, reaching construction, manufacturing, retail and wholesale trade, accommodation, and agriculture. In Serbia, despite a poor agricultural season and slowing growth generally, employment went up by 4.3 percent. In Montenegro, job creation of 3.5 percent was driven by a strong tourism season and accelerated construction projects. In Albania, the 3.4 percent increase in employment was led by services and industry, as well as by self-employed entrepreneurs. Employment gains in FYR Macedonia (2.7 percent) came largely from wholesale and retail trade, supported by private consumption, followed by transport and storage, and manufacturing. The gains in manufacturing were largely linked to the activities of companies supported by FDI, which benefit from government support, such as tax exemptions. In Bosnia and Herzegovina, after losses in employment in 2016, recent labor-market reforms facilitated a 1.8 percent rise in employment. Still, Bosnia and Herzegovina is the only Western Balkans
4 Throughout this section, y-o-y June 2017 comparisons are used.5 Since only six quarters of data were available for Kosovo, this result
might be subject to change as collection of quarterly data becomes more consistent.
country where employment is yet to recover to its pre-crisis level; there the employment rate is about 8 percent lower than in 2008 (Figure 3.1).
Private firms, especially in the services sector, generated more than half of all new jobs in the region. In several countries, the recovery in services has driven up private sector employment, which became the main driver of general employment growth. Net services job creation in Albania, driven by the tourism industry, was 8.6 percent in the first half of 2017, contributing to a fall in unemployment. In FYR Macedonia, where consumption has been the main driver of growth in 2017, most of the new jobs were in services, led by wholesale and retail trade. In Montenegro, dynamic tourism has offset employment losses from the mother’s benefit introduced last year, leading to a 3.6 percent year-on-year increase in the official employment numbers by August.
Labor force participation increased in several countries, although it remains exceptionally low, especially for women (Figure 3.3). The regional participation rate increased by 1.1 percentage points year-on-year in June 2017, to 53.2 percent. All countries except Bosnia and Herzegovina saw higher labor participation rates. In Bosnia and Herzegovina, however, the rate fell to 42.6 percent, the lowest in the region. In Montenegro, gains in labor force participation are expected now that the lifetime benefit to mothers with three or more children has been abolished—this benefit had been responsible for a significant decline in female labor force participation since 2016.
3. Employment returns to pre-crisis levels and reduces poverty, helped by low inflation
WESTERN BALKANS REGULAR ECONOMIC REPORT NO.12
6 | 3. EMPLOYMENT RETURNs TO PRE-CRIsIs LEvELs ANd REdUCEs POvERTY, hELPEd BY LOW INFLATION
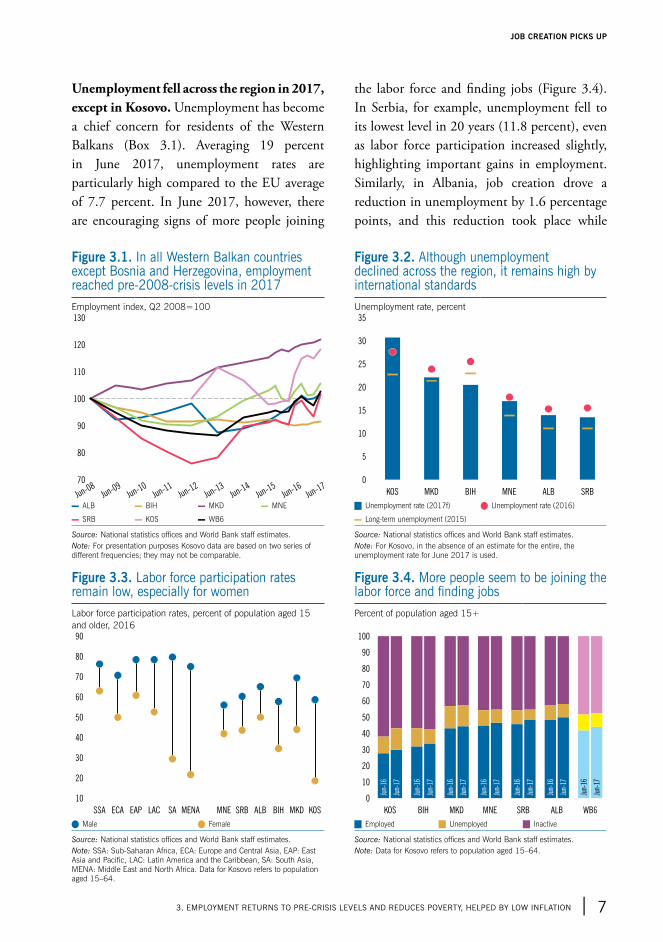
Unemployment fell across the region in 2017, except in Kosovo. Unemployment has become a chief concern for residents of the Western Balkans (Box 3.1). Averaging 19 percent in June 2017, unemployment rates are particularly high compared to the EU average of 7.7 percent. In June 2017, however, there are encouraging signs of more people joining
the labor force and finding jobs (Figure 3.4). In Serbia, for example, unemployment fell to its lowest level in 20 years (11.8 percent), even as labor force participation increased slightly, highlighting important gains in employment. Similarly, in Albania, job creation drove a reduction in unemployment by 1.6 percentage points, and this reduction took place while
Figure 3.1. In all Western Balkan countries except Bosnia and herzegovina, employment reached pre-2008-crisis levels in 2017
Figure 3.2. Although unemployment declined across the region, it remains high by international standards
Employment index, Q2 2008=100 Unemployment rate, percent
70
80
90
110
120
130
100
Jun-08
Jun-09
Jun-10
Jun-11
Jun-12
Jun-13
Jun-14
Jun-15
Jun-16
Jun-17
MNE ALBKOS MKD SRBBIH
0
35
30
25
20
15
10
5
▬ ALB ▬ BIH ▬ MKD ▬ MNE J Unemployment rate (2017f) Q Unemployment rate (2016)
▬ SRB ▬ KOS ▬ WB6 ▬ Long-term unemployment (2015)
Source: National statistics offices and World Bank staff estimates.Note: For presentation purposes Kosovo data are based on two series of different frequencies; they may not be comparable.
Source: National statistics offices and World Bank staff estimates.Note: For Kosovo, in the absence of an estimate for the entire, the unemployment rate for June 2017 is used.
Figure 3.3. Labor force participation rates remain low, especially for women
Figure 3.4. More people seem to be joining the labor force and finding jobs
Labor force participation rates, percent of population aged 15 and older, 2016
Percent of population aged 15+
10
90
80
70
60
50
40
30
20
SSA ECA EAP LAC SA MENA MNE SRB ALB BIH MKD KOS
0
10
100
90
80
70
60
50
40
20
30
KOS BIH MKD SRBMNE WB6ALB
Jun-
16
Jun-
17
Jun-
16
Jun-
17
Jun-
16
Jun-
17
Jun-
16
Jun-
17
Jun-
16
Jun-
17
Jun-
16
Jun-
17
Jun-
16
Jun-
17
Q Male Q Female J Employed J Unemployed J Inactive
Source: National statistics offices and World Bank staff estimates.Note: SSA: Sub-Saharan Africa, ECA: Europe and Central Asia, EAP: East Asia and Pacific, LAC: Latin America and the Caribbean, SA: South Asia, MENA: Middle East and North Africa. Data for Kosovo refers to population aged 15–64.
Source: National statistics offices and World Bank staff estimates.Note: Data for Kosovo refers to population aged 15–64.
3. EMPLOYMENT RETURNs TO PRE-CRIsIs LEvELs ANd REdUCEs POvERTY, hELPEd BY LOW INFLATION | 7
JOB CREATION PICKS UP
labor force participation increased. In FYR Macedonia, unemployment fell to a record low of 22.6 percent, and it dropped 15.1 percent in Montenegro, driven by a robust tourism season. Bosnia and Herzegovina recorded the largest unemployment drop in the region, falling by 4.9 percentage points to 20.5 percent, its lowest level since 2007. But, unlike in neighboring countries, the decline was driven by a combination of higher employment and lower labor force participation. Thus, for Bosnia and Herzegovina, emigration may have contributed to the unemployment decline. Kosovo was the only country where unemployment went up, to 30.6 percent, as employment took time to catch up with a surge in labor force participation. Youth unemployment also
decreased throughout the Western Balkans but is still staggeringly high by international standards, ranging from 26.4 percent in Albania to 50.9 percent in Kosovo (Figure 3.5).
Among the region’s unemployed workers, about 70 percent have been jobless for over 12 months. This figure reaches 80 percent in FYR Macedonia and Montenegro. Long-term unemployment is especially a problem for women: More than 80 percent of unemployed women have been jobless for over 12 months. Long-term unemployment may be leading workers to exit the labor force or emigrate to find jobs.
Box 3.1. Unemployment: A Major Concern for Citizens throughout the Western Balkans.
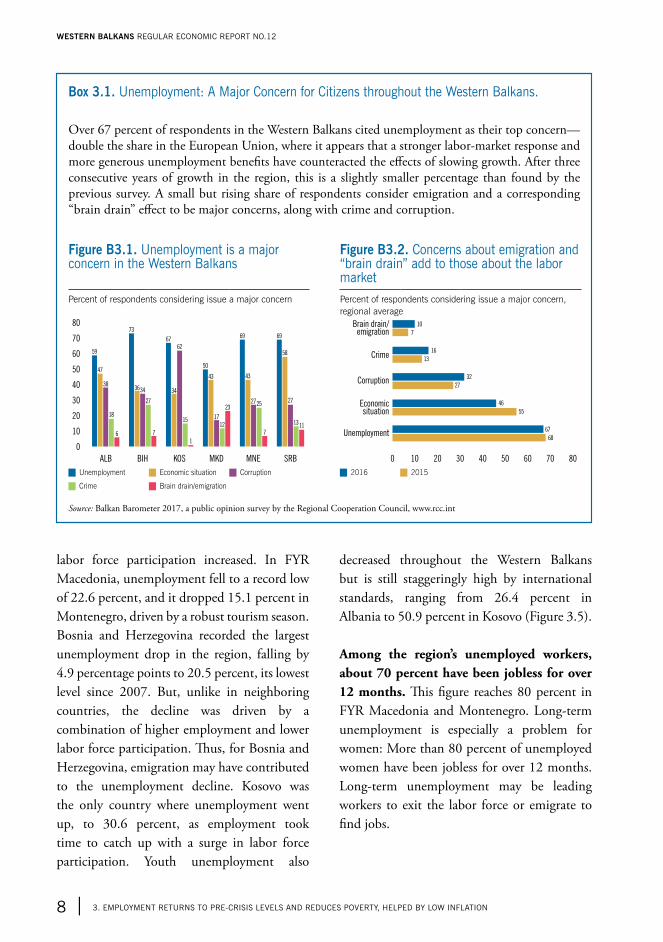
Over 67 percent of respondents in the Western Balkans cited unemployment as their top concern—double the share in the European Union, where it appears that a stronger labor-market response and more generous unemployment benefits have counteracted the effects of slowing growth. After three consecutive years of growth in the region, this is a slightly smaller percentage than found by the previous survey. A small but rising share of respondents consider emigration and a corresponding “brain drain” effect to be major concerns, along with crime and corruption.
Figure B3.1. Unemployment is a major concern in the Western Balkans
Figure B3.2. Concerns about emigration and “brain drain” add to those about the labor market
Percent of respondents considering issue a major concern Percent of respondents considering issue a major concern, regional average
0
80
70
60
50
40
30
20
10
KOS MKDALB BIH MNE SRB
59
47
38
18
6
73
3634
27
7
67
34
62
15
1
50
43
17
12
23
69
43
2725
7
69
58
27
1311
0 10 20 30 40 50 60 70 80
Brain drain/emigration
Crime
Corruption
Economicsituation
Unemployment
10
7
16
13
32
27
46
55
67
68
J Unemployment J Economic situation J Corruption J 2016 J 2015
J Crime J Brain drain/emigration
Source: Balkan Barometer 2017, a public opinion survey by the Regional Cooperation Council, www.rcc.int
WESTERN BALKANS REGULAR ECONOMIC REPORT NO.12
8 | 3. EMPLOYMENT RETURNs TO PRE-CRIsIs LEvELs ANd REdUCEs POvERTY, hELPEd BY LOW INFLATION
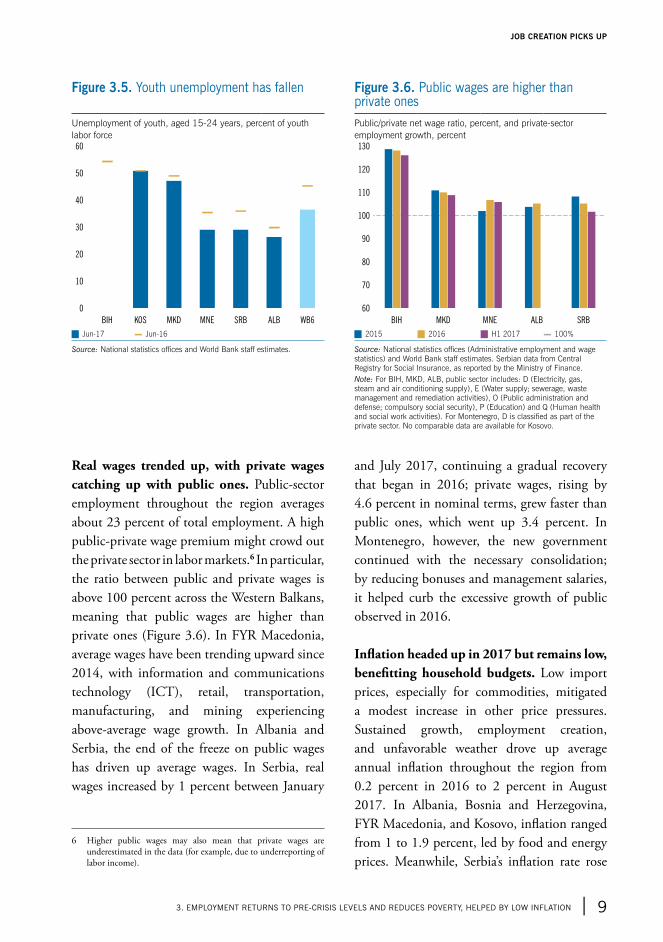
Real wages trended up, with private wages catching up with public ones. Public-sector employment throughout the region averages about 23 percent of total employment. A high public-private wage premium might crowd out the private sector in labor markets.6 In particular, the ratio between public and private wages is above 100 percent across the Western Balkans, meaning that public wages are higher than private ones (Figure 3.6). In FYR Macedonia, average wages have been trending upward since 2014, with information and communications technology (ICT), retail, transportation, manufacturing, and mining experiencing above-average wage growth. In Albania and Serbia, the end of the freeze on public wages has driven up average wages. In Serbia, real wages increased by 1 percent between January
6 Higher public wages may also mean that private wages are underestimated in the data (for example, due to underreporting of labor income).
and July 2017, continuing a gradual recovery that began in 2016; private wages, rising by 4.6 percent in nominal terms, grew faster than public ones, which went up 3.4 percent. In Montenegro, however, the new government continued with the necessary consolidation; by reducing bonuses and management salaries, it helped curb the excessive growth of public observed in 2016.
Inflation headed up in 2017 but remains low, benefitting household budgets. Low import prices, especially for commodities, mitigated a modest increase in other price pressures. Sustained growth, employment creation, and unfavorable weather drove up average annual inflation throughout the region from 0.2 percent in 2016 to 2 percent in August 2017. In Albania, Bosnia and Herzegovina, FYR Macedonia, and Kosovo, inflation ranged from 1 to 1.9 percent, led by food and energy prices. Meanwhile, Serbia’s inflation rate rose
Figure 3.5. Youth unemployment has fallen Figure 3.6. Public wages are higher than private ones
Unemployment of youth, aged 15-24 years, percent of youth labor force
Public/private net wage ratio, percent, and private-sector employment growth, percent
0
10
60
50
40
20
30
MNE ALBSRBKOS MKD WB6BIH MNE ALBMKD SRBBIH
60
130
120
110
100
90
80
70
J Jun-17 ▬ Jun-16 J 2015 J 2016 J H1 2017 ▬ 100%
Source: National statistics offices and World Bank staff estimates. Source: National statistics offices (Administrative employment and wage statistics) and World Bank staff estimates. Serbian data from Central Registry for Social Insurance, as reported by the Ministry of Finance.Note: For BIH, MKD, ALB, public sector includes: D (Electricity, gas, steam and air conditioning supply), E (Water supply; sewerage, waste management and remediation activities), O (Public administration and defense; compulsory social security), P (Education) and Q (Human health and social work activities). For Montenegro, D is classified as part of the private sector. No comparable data are available for Kosovo.
3. EMPLOYMENT RETURNs TO PRE-CRIsIs LEvELs ANd REdUCEs POvERTY, hELPEd BY LOW INFLATION | 9
JOB CREATION PICKS UP
to 2.5 percent in August 2017 as food prices surged after the harsh winter, although core inflation was at 1.5 percent. Montenegro had the highest inflation rate in the region; in August it reached 2.8 percent, driven by rises in both excises for oil, tobacco and alcohol, and prices for tourism and catering services.
Growth, jobs, and relatively low inflation lifted many people out of poverty. In 2017, the average poverty rate for Albania, FYR Macedonia, Montenegro, and Serbia dropped by an estimated 1 percentage point compared to a year earlier, to a projected poverty rate of 23.6 percent.7 This implies that in these countries about 124,000 people were no longer in poverty.8 To sustain recent welfare improvements, countries across the region will need to continue generating employment opportunities and boost labor earnings to reduce reliance on social transfers.
7 Regional average excludes Bosnia and Herzegovina and Kosovo due to issues in calculating PPP welfare aggregates.
8 These poverty figures reflect the regional standardized benchmark of living on less than US$5.5 per day in 2011 purchasing-power-parity terms.
WESTERN BALKANS REGULAR ECONOMIC REPORT NO.12
10 | 3. EMPLOYMENT RETURNs TO PRE-CRIsIs LEvELs ANd REdUCEs POvERTY, hELPEd BY LOW INFLATION
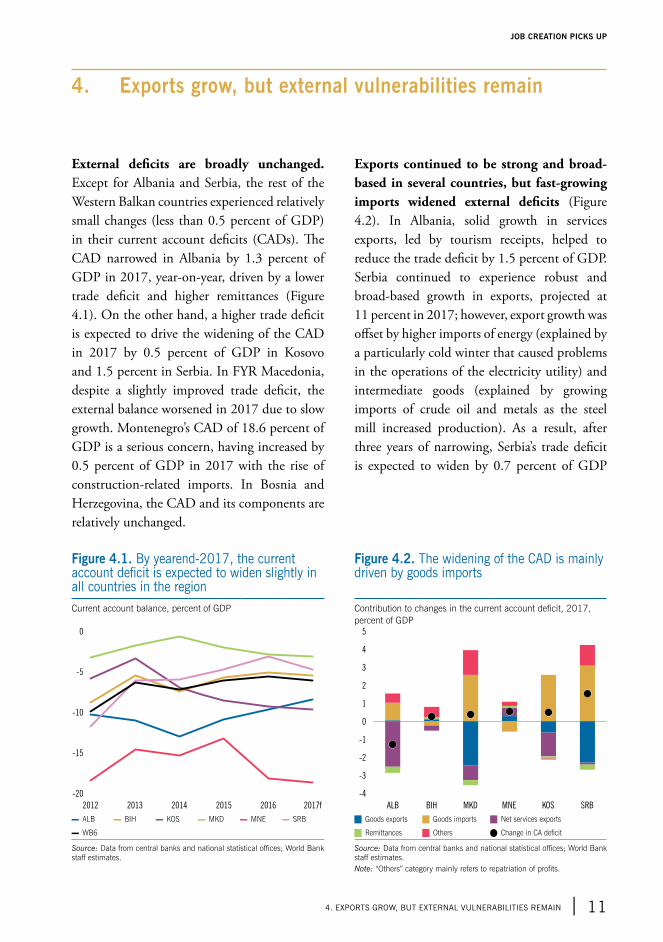
External deficits are broadly unchanged. Except for Albania and Serbia, the rest of the Western Balkan countries experienced relatively small changes (less than 0.5 percent of GDP) in their current account deficits (CADs). The CAD narrowed in Albania by 1.3 percent of GDP in 2017, year-on-year, driven by a lower trade deficit and higher remittances (Figure 4.1). On the other hand, a higher trade deficit is expected to drive the widening of the CAD in 2017 by 0.5 percent of GDP in Kosovo and 1.5 percent in Serbia. In FYR Macedonia, despite a slightly improved trade deficit, the external balance worsened in 2017 due to slow growth. Montenegro’s CAD of 18.6 percent of GDP is a serious concern, having increased by 0.5 percent of GDP in 2017 with the rise of construction-related imports. In Bosnia and Herzegovina, the CAD and its components are relatively unchanged.
Exports continued to be strong and broad-based in several countries, but fast-growing imports widened external deficits (Figure 4.2). In Albania, solid growth in services exports, led by tourism receipts, helped to reduce the trade deficit by 1.5 percent of GDP. Serbia continued to experience robust and broad-based growth in exports, projected at 11 percent in 2017; however, export growth was offset by higher imports of energy (explained by a particularly cold winter that caused problems in the operations of the electricity utility) and intermediate goods (explained by growing imports of crude oil and metals as the steel mill increased production). As a result, after three years of narrowing, Serbia’s trade deficit is expected to widen by 0.7 percent of GDP
4. Exports grow, but external vulnerabilities remain
Figure 4.1. By yearend-2017, the current account deficit is expected to widen slightly in all countries in the region
Figure 4.2. The widening of the CAd is mainly driven by goods imports
Current account balance, percent of GDP Contribution to changes in the current account deficit, 2017, percent of GDP
-20
0
-10
-5
-15
20132012 2014 2015 2017f2016 MNEBIHALB KOS SRBMKD
-4
-3
5
4
1
0
-1
-2
3
2
▬ ALB ▬ BIH ▬ KOS ▬ MKD ▬ MNE ▬ SRB J Goods exports J Goods imports J Net services exports
▬ WB6 J Remittances J Others Q Change in CA deficit
Source: Data from central banks and national statistical offices; World Bank staff estimates.
Source: Data from central banks and national statistical offices; World Bank staff estimates. Note: “Others” category mainly refers to repatriation of profits.
4. ExPORTs GROW, BUT ExTERNAL vULNERABILITIEs REMAIN | 11
JOB CREATION PICKS UP
in 2017.9 In FYR Macedonia, faster growth in goods exports than imports is expected to slightly lower the trade deficit in 2017. In Montenegro, despite a favorable tourism season, exports remain low while strong consumption growth and intermediate goods used for the construction of the Bar-Boljare highway continue to stimulate imports. The trade deficit also widened in Kosovo as dynamic imports (much larger as a share of GDP) offset the impact of the fast growth in exports, and remittances were relatively stable as a percent of GDP. In Bosnia and Herzegovina, trade dynamics were generally unchanged in 2017, with faster export growth driving a slight narrowing of the trade deficit, by 0.3 percent of GDP.
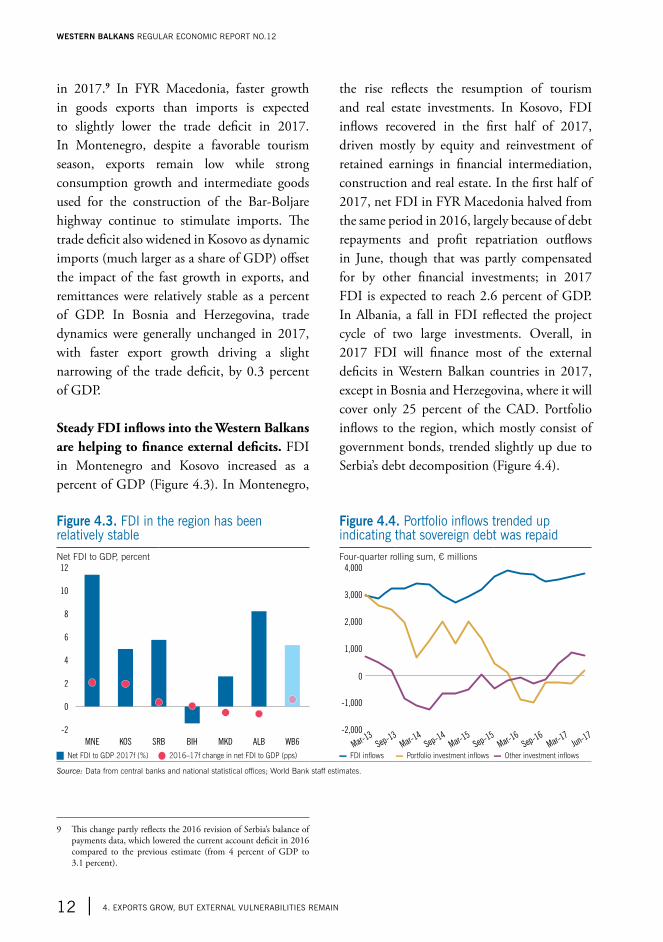
Steady FDI inflows into the Western Balkans are helping to finance external deficits. FDI in Montenegro and Kosovo increased as a percent of GDP (Figure 4.3). In Montenegro,
9 This change partly reflects the 2016 revision of Serbia’s balance of payments data, which lowered the current account deficit in 2016 compared to the previous estimate (from 4 percent of GDP to 3.1 percent).
the rise reflects the resumption of tourism and real estate investments. In Kosovo, FDI inflows recovered in the first half of 2017, driven mostly by equity and reinvestment of retained earnings in financial intermediation, construction and real estate. In the first half of 2017, net FDI in FYR Macedonia halved from the same period in 2016, largely because of debt repayments and profit repatriation outflows in June, though that was partly compensated for by other financial investments; in 2017 FDI is expected to reach 2.6 percent of GDP. In Albania, a fall in FDI reflected the project cycle of two large investments. Overall, in 2017 FDI will finance most of the external deficits in Western Balkan countries in 2017, except in Bosnia and Herzegovina, where it will cover only 25 percent of the CAD. Portfolio inflows to the region, which mostly consist of government bonds, trended slightly up due to Serbia’s debt decomposition (Figure 4.4).
Figure 4.3. FdI in the region has been relatively stable
Figure 4.4. Portfolio inflows trended up indicating that sovereign debt was repaid
Net FDI to GDP, percent Four-quarter rolling sum, € millions
MNE KOS SRB MKDBIH WB6ALB
-2
12
10
8
6
4
2
0
-2,000
4,000
2,000
1,000
0
-1,000
Mar-13
Mar-15
Sep-14
Sep-15
3,000
Sep-16
Sep-13
Mar-14
Mar-16
Mar-17
Jun-17
J Net FDI to GDP 2017f (%) Q 2016–17f change in net FDI to GDP (pps) ▬ FDI inflows ▬ Portfolio investment inflows ▬ Other investment inflows
Source: Data from central banks and national statistical offices; World Bank staff estimates.
WESTERN BALKANS REGULAR ECONOMIC REPORT NO.12
12 | 4. ExPORTs GROW, BUT ExTERNAL vULNERABILITIEs REMAIN
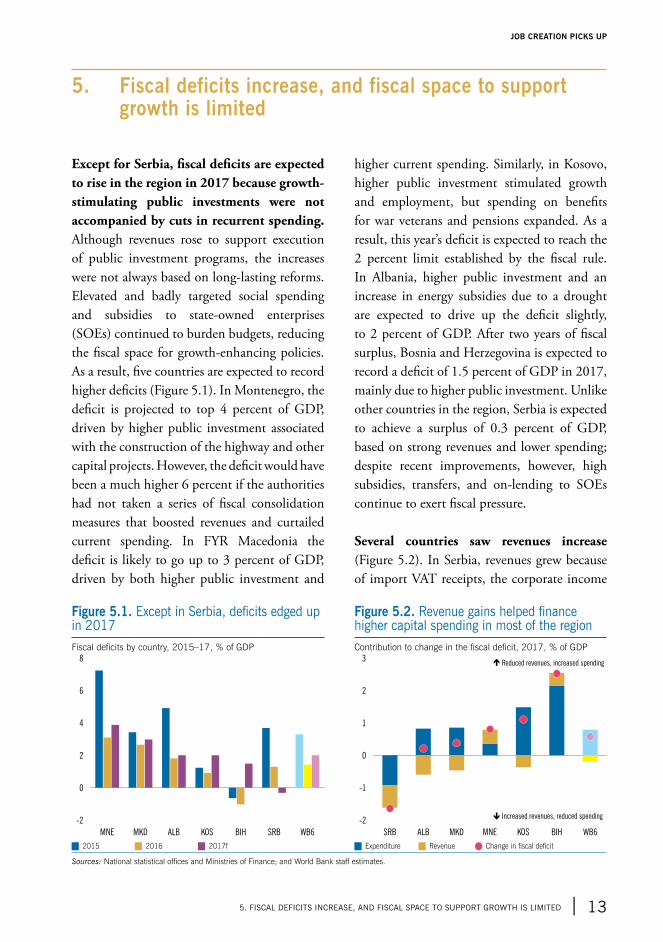
Except for Serbia, fiscal deficits are expected to rise in the region in 2017 because growth-stimulating public investments were not accompanied by cuts in recurrent spending. Although revenues rose to support execution of public investment programs, the increases were not always based on long-lasting reforms. Elevated and badly targeted social spending and subsidies to state-owned enterprises (SOEs) continued to burden budgets, reducing the fiscal space for growth-enhancing policies. As a result, five countries are expected to record higher deficits (Figure 5.1). In Montenegro, the deficit is projected to top 4 percent of GDP, driven by higher public investment associated with the construction of the highway and other capital projects. However, the deficit would have been a much higher 6 percent if the authorities had not taken a series of fiscal consolidation measures that boosted revenues and curtailed current spending. In FYR Macedonia the deficit is likely to go up to 3 percent of GDP, driven by both higher public investment and
higher current spending. Similarly, in Kosovo, higher public investment stimulated growth and employment, but spending on benefits for war veterans and pensions expanded. As a result, this year’s deficit is expected to reach the 2 percent limit established by the fiscal rule. In Albania, higher public investment and an increase in energy subsidies due to a drought are expected to drive up the deficit slightly, to 2 percent of GDP. After two years of fiscal surplus, Bosnia and Herzegovina is expected to record a deficit of 1.5 percent of GDP in 2017, mainly due to higher public investment. Unlike other countries in the region, Serbia is expected to achieve a surplus of 0.3 percent of GDP, based on strong revenues and lower spending; despite recent improvements, however, high subsidies, transfers, and on-lending to SOEs continue to exert fiscal pressure.
Several countries saw revenues increase (Figure 5.2). In Serbia, revenues grew because of import VAT receipts, the corporate income
5. Fiscal deficits increase, and fiscal space to support growth is limited
Figure 5.1. Except in Serbia, deficits edged up in 2017
Figure 5.2. Revenue gains helped finance higher capital spending in most of the region
Fiscal deficits by country, 2015–17, % of GDP Contribution to change in the fiscal deficit, 2017, % of GDP
-2
8
6
4
0
2
KOS SRBBIHMKD ALB WB6MNE
-2
-1
3
2
1
0
MNEALBSRB KOSMKD WB6BIH
� Reduced revenues, increased spending
� Increased revenues, reduced spending
J 2015 J 2016 J 2017f J Expenditure J Revenue Q Change in fiscal deficit
Sources: National statistical offices and Ministries of Finance; and World Bank staff estimates.
5. FIsCAL dEFICITs INCREAsE, ANd FIsCAL sPACE TO sUPPORT GROWTh Is LIMITEd | 13
JOB CREATION PICKS UP
tax, and higher social security contributions. Reforms resulted in higher revenues from the personal income tax (PIT) and the solid performance of VAT and social security contributions for FYR Macedonia, and more efficient PIT administration helped to push up revenues in Kosovo. In Albania, VAT-refund arrears brought in more revenue. The Montenegrin government adopted a fiscal strategy to stabilize public debt levels by 2019, with ambitious reforms that increased excise taxes on tobacco, sugary drinks, alcohol, and coal; reduced VAT exemptions; and increased the standard VAT rate. Still, this year Montenegro’s revenues are expected to be lower, reflecting a base effect caused by collection in 2016 of a concession fee for 4G rights. In Bosnia and Herzegovina, the decline in revenues is explained by a decrease in collection of direct tax revenue.10 Overall in the region, although there have been improvements, there is considerable scope to mobilize revenues. In particular, countries in the region can bolster revenues by improving the efficiency of tax
10 Bosnia and Herzegovina’s Fiscal Council, Global Fiscal Framework 2018–2020.
collection systems and reducing widespread tax concessions and exemptions.
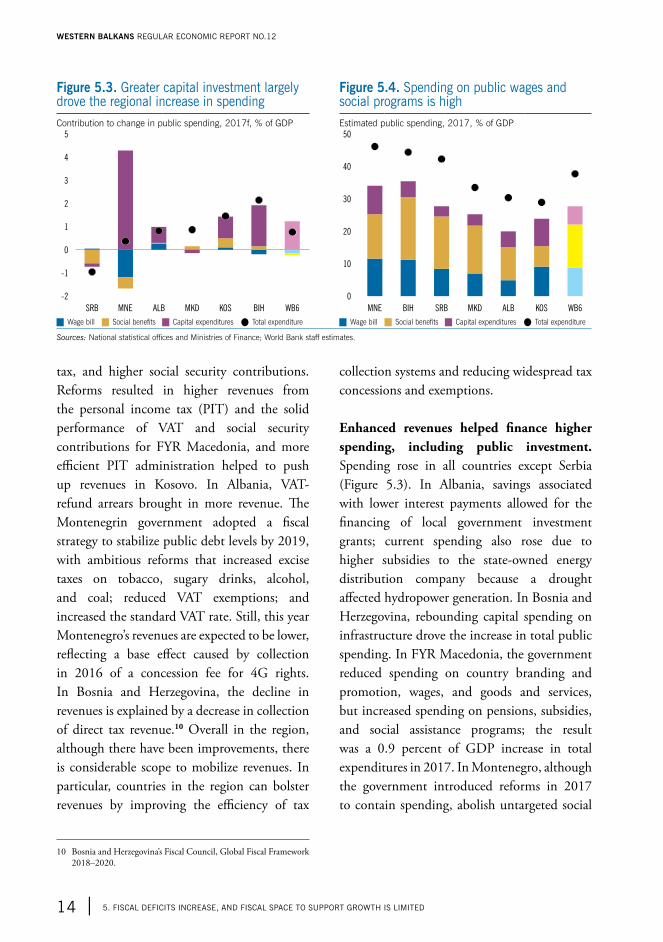
Enhanced revenues helped finance higher spending, including public investment. Spending rose in all countries except Serbia (Figure 5.3). In Albania, savings associated with lower interest payments allowed for the financing of local government investment grants; current spending also rose due to higher subsidies to the state-owned energy distribution company because a drought affected hydropower generation. In Bosnia and Herzegovina, rebounding capital spending on infrastructure drove the increase in total public spending. In FYR Macedonia, the government reduced spending on country branding and promotion, wages, and goods and services, but increased spending on pensions, subsidies, and social assistance programs; the result was a 0.9 percent of GDP increase in total expenditures in 2017. In Montenegro, although the government introduced reforms in 2017 to contain spending, abolish untargeted social
Figure 5.3. Greater capital investment largely drove the regional increase in spending
Figure 5.4. spending on public wages and social programs is high
Contribution to change in public spending, 2017f, % of GDP Estimated public spending, 2017, % of GDP
-2
5
4
3
2
1
0
-1
MNE ALBSRB KOSMKD WB6BIH
0
50
40
30
20
10
MNE ALBSRB KOSMKD WB6BIH
J Wage bill J Social benefits J Capital expenditures Q Total expenditure J Wage bill J Social benefits J Capital expenditures Q Total expenditure
Sources: National statistical offices and Ministries of Finance; World Bank staff estimates.
WESTERN BALKANS REGULAR ECONOMIC REPORT NO.12
14 | 5. FIsCAL dEFICITs INCREAsE, ANd FIsCAL sPACE TO sUPPORT GROWTh Is LIMITEd
benefits11, and reduced spending on public-sector wages, total expenditures are still expected to increase due to the construction of the Bar-Boljare highway. In Kosovo, the increase in total spending was driven mostly by rising public investment, including the Route 6 motorway, and higher spending on pensions and benefits to war veterans. Reassured by a sizable fiscal surplus of 1.8 percent of GDP over the first eight months of 2017 and a fall in total spending by an estimated 0.9 percentage points of GDP, in October 2017 the Serbian government announced an increase in public-sector wages (in the range of 5 to 10 percent) and pensions (5 percent). These measures will partially offset the expenditure consolidation that took place in Serbia over the last three years and are likely to add to fiscal pressures in future years as public investment spending picks up and the lack of one-off revenues begins to take effect.
11 The Montenegrin parliament abolished the “lifetime” benefit for mothers of three or more children, which had led many women to withdraw from the labor market and also doubled the social benefit budget.
If growth is to accelerate, a better balance is needed between capital and current spending. At 23.2 percent of GDP on average, spending in the region on public wages and social benefits significantly exceeds average capital spending of 5.5 percent of GDP (Figure 5.4). This leaves little space for growth-enhancing public investment. Improved targeting of social benefits and tighter control over the wage bill would free up resources to invest in priority infrastructure, enhance the quality of public services, build human capital, expand labor-market opportunities for targeted groups, and help protect poor and vulnerable households from the impacts of fiscal consolidation. Although capital spending rose in much of the region this year, most countries continued to under-execute their capital budgets, suggesting inadequacies in the planning and management of public investment projects.
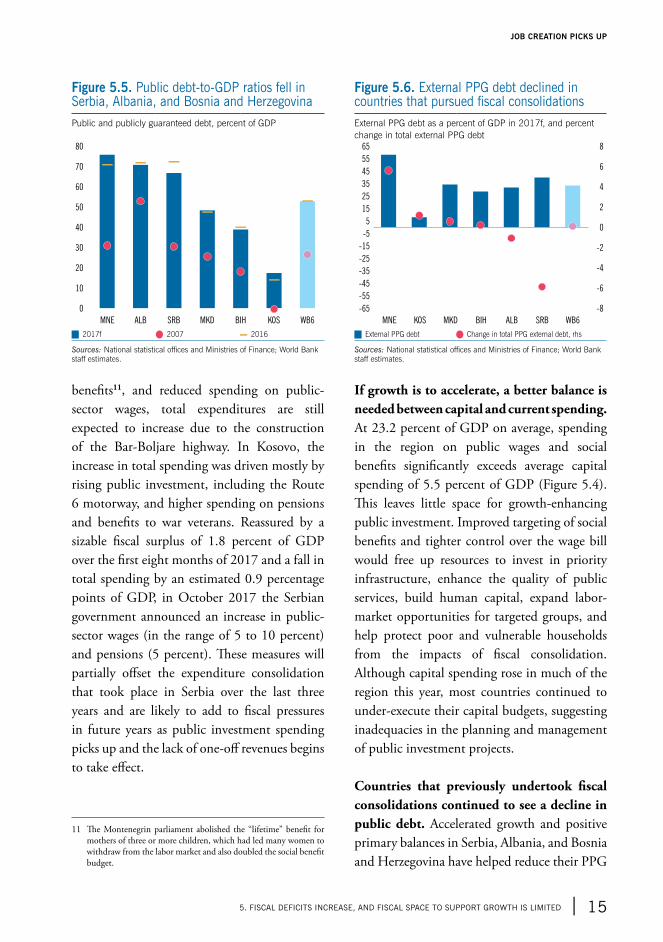
Countries that previously undertook fiscal consolidations continued to see a decline in public debt. Accelerated growth and positive primary balances in Serbia, Albania, and Bosnia and Herzegovina have helped reduce their PPG
Figure 5.5. Public debt-to-GdP ratios fell in serbia, Albania, and Bosnia and herzegovina
Figure 5.6. External PPG debt declined in countries that pursued fiscal consolidations
Public and publicly guaranteed debt, percent of GDP External PPG debt as a percent of GDP in 2017f, and percent change in total external PPG debt
MNE ALB SRB KOSMKD WB6BIH
0
80
70
60
50
40
30
20
10
MKD SRBKOSMNE ALB WB6BIH
-65
65
55
35
25
5
-5
-25
-35
-45
-55
-8
8
6
4
2
0
-2
-4
-6
45
15
-15
J 2017f Q 2007 ▬ 2016 J External PPG debt Q Change in total PPG external debt, rhs
Sources: National statistical offices and Ministries of Finance; World Bank staff estimates.
Sources: National statistical offices and Ministries of Finance; World Bank staff estimates.
5. FIsCAL dEFICITs INCREAsE, ANd FIsCAL sPACE TO sUPPORT GROWTh Is LIMITEd | 15
JOB CREATION PICKS UP
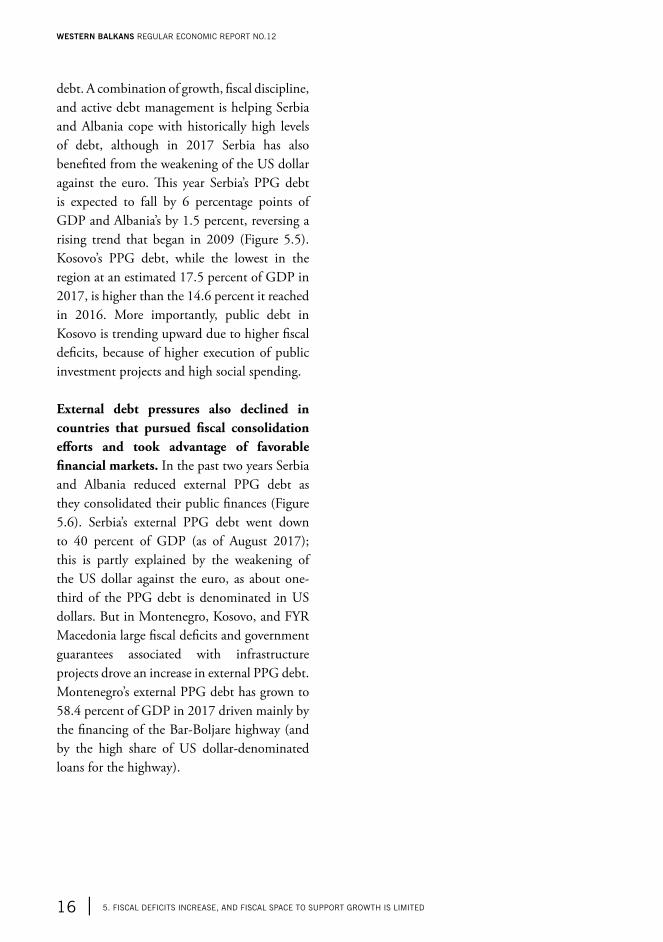
debt. A combination of growth, fiscal discipline, and active debt management is helping Serbia and Albania cope with historically high levels of debt, although in 2017 Serbia has also benefited from the weakening of the US dollar against the euro. This year Serbia’s PPG debt is expected to fall by 6 percentage points of GDP and Albania’s by 1.5 percent, reversing a rising trend that began in 2009 (Figure 5.5). Kosovo’s PPG debt, while the lowest in the region at an estimated 17.5 percent of GDP in 2017, is higher than the 14.6 percent it reached in 2016. More importantly, public debt in Kosovo is trending upward due to higher fiscal deficits, because of higher execution of public investment projects and high social spending.
External debt pressures also declined in countries that pursued fiscal consolidation efforts and took advantage of favorable financial markets. In the past two years Serbia and Albania reduced external PPG debt as they consolidated their public finances (Figure 5.6). Serbia’s external PPG debt went down to 40 percent of GDP (as of August 2017); this is partly explained by the weakening of the US dollar against the euro, as about one-third of the PPG debt is denominated in US dollars. But in Montenegro, Kosovo, and FYR Macedonia large fiscal deficits and government guarantees associated with infrastructure projects drove an increase in external PPG debt. Montenegro’s external PPG debt has grown to 58.4 percent of GDP in 2017 driven mainly by the financing of the Bar-Boljare highway (and by the high share of US dollar-denominated loans for the highway).
WESTERN BALKANS REGULAR ECONOMIC REPORT NO.12
16 | 5. FIsCAL dEFICITs INCREAsE, ANd FIsCAL sPACE TO sUPPORT GROWTh Is LIMITEd
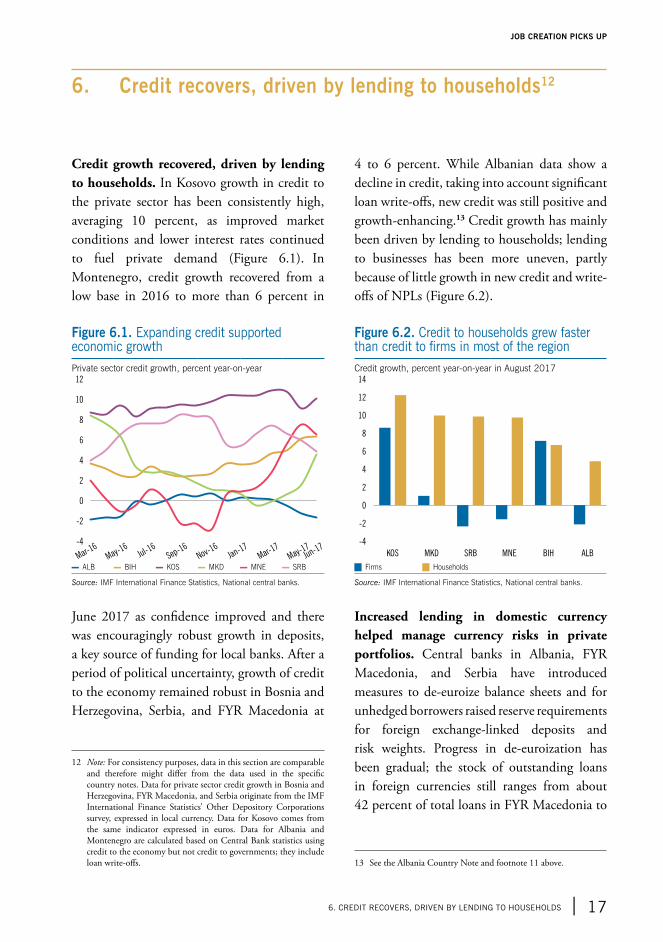
Credit growth recovered, driven by lending to households. In Kosovo growth in credit to the private sector has been consistently high, averaging 10 percent, as improved market conditions and lower interest rates continued to fuel private demand (Figure 6.1). In Montenegro, credit growth recovered from a low base in 2016 to more than 6 percent in
June 2017 as confidence improved and there was encouragingly robust growth in deposits, a key source of funding for local banks. After a period of political uncertainty, growth of credit to the economy remained robust in Bosnia and Herzegovina, Serbia, and FYR Macedonia at
12 Note: For consistency purposes, data in this section are comparable and therefore might differ from the data used in the specific country notes. Data for private sector credit growth in Bosnia and Herzegovina, FYR Macedonia, and Serbia originate from the IMF International Finance Statistics’ Other Depository Corporations survey, expressed in local currency. Data for Kosovo comes from the same indicator expressed in euros. Data for Albania and Montenegro are calculated based on Central Bank statistics using credit to the economy but not credit to governments; they include loan write-offs.
4 to 6 percent. While Albanian data show a decline in credit, taking into account significant loan write-offs, new credit was still positive and growth-enhancing.13 Credit growth has mainly been driven by lending to households; lending to businesses has been more uneven, partly because of little growth in new credit and write-offs of NPLs (Figure 6.2).
Increased lending in domestic currency helped manage currency risks in private portfolios. Central banks in Albania, FYR Macedonia, and Serbia have introduced measures to de-euroize balance sheets and for unhedged borrowers raised reserve requirements for foreign exchange-linked deposits and risk weights. Progress in de-euroization has been gradual; the stock of outstanding loans in foreign currencies still ranges from about 42 percent of total loans in FYR Macedonia to
13 See the Albania Country Note and footnote 11 above.
6. Credit recovers, driven by lending to households12
Figure 6.1. Expanding credit supported economic growth
Figure 6.2. Credit to households grew faster than credit to firms in most of the region
Private sector credit growth, percent year-on-year Credit growth, percent year-on-year in August 2017
Mar-16
-4
12
10
8
6
4
2
0
-2
May-16
Jul-16
Sep-16
Nov-16
Jan-17
Mar-17
May-17Jun-1
7-4
14
12
10
8
6
4
2
0
-2
ALBSRB BIHMNEMKDKOS
▬ ALB ▬ BIH ▬ KOS ▬ MKD ▬ MNE ▬ SRB J Firms J Households
Source: IMF International Finance Statistics, National central banks. Source: IMF International Finance Statistics, National central banks.
6. CREdIT RECOvERs, dRIvEN BY LENdING TO hOUsEhOLds | 17
JOB CREATION PICKS UP
about 70 percent in Serbia. In Albania, the share of foreign currency lending had fallen slightly from 60 percent in mid-2016 to 57 percent in mid-2017; also Serbia saw a decrease from 70.2 to 67.7 percent.
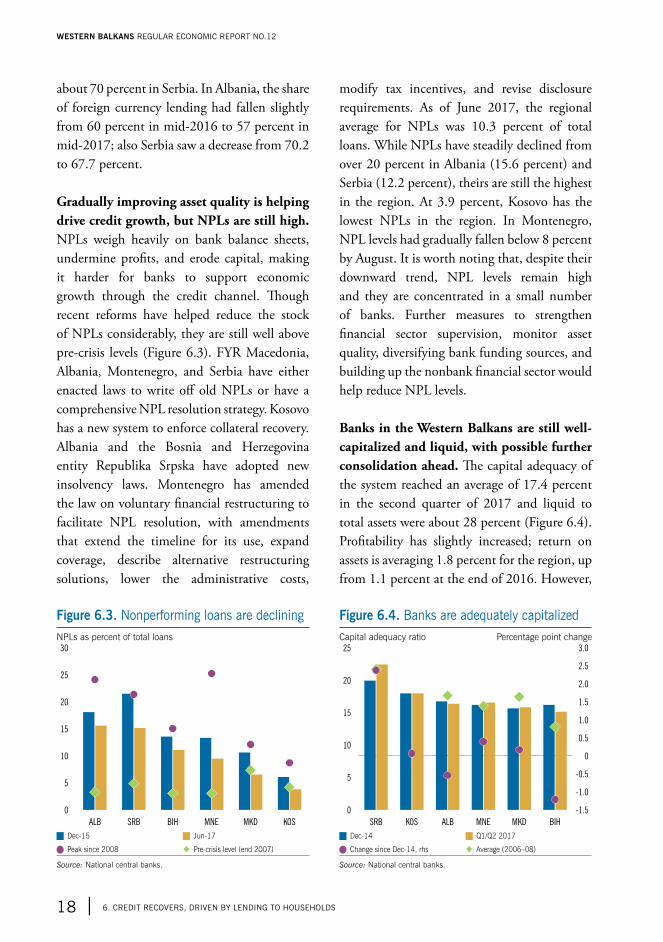
Gradually improving asset quality is helping drive credit growth, but NPLs are still high. NPLs weigh heavily on bank balance sheets, undermine profits, and erode capital, making it harder for banks to support economic growth through the credit channel. Though recent reforms have helped reduce the stock of NPLs considerably, they are still well above pre-crisis levels (Figure 6.3). FYR Macedonia, Albania, Montenegro, and Serbia have either enacted laws to write off old NPLs or have a comprehensive NPL resolution strategy. Kosovo has a new system to enforce collateral recovery. Albania and the Bosnia and Herzegovina entity Republika Srpska have adopted new insolvency laws. Montenegro has amended the law on voluntary financial restructuring to facilitate NPL resolution, with amendments that extend the timeline for its use, expand coverage, describe alternative restructuring solutions, lower the administrative costs,
modify tax incentives, and revise disclosure requirements. As of June 2017, the regional average for NPLs was 10.3 percent of total loans. While NPLs have steadily declined from over 20 percent in Albania (15.6 percent) and Serbia (12.2 percent), theirs are still the highest in the region. At 3.9 percent, Kosovo has the lowest NPLs in the region. In Montenegro, NPL levels had gradually fallen below 8 percent by August. It is worth noting that, despite their downward trend, NPL levels remain high and they are concentrated in a small number of banks. Further measures to strengthen financial sector supervision, monitor asset quality, diversifying bank funding sources, and building up the nonbank financial sector would help reduce NPL levels.
Banks in the Western Balkans are still well-capitalized and liquid, with possible further consolidation ahead. The capital adequacy of the system reached an average of 17.4 percent in the second quarter of 2017 and liquid to total assets were about 28 percent (Figure 6.4). Profitability has slightly increased; return on assets is averaging 1.8 percent for the region, up from 1.1 percent at the end of 2016. However,
Figure 6.3. Nonperforming loans are declining Figure 6.4. Banks are adequately capitalizedNPLs as percent of total loans Capital adequacy ratio Percentage point change
0
30
25
20
15
10
5
KOSMKDALB BIH MNESRB
0
25
20
15
10
5
-1.5
-1.0
3.0
2.5
2.0
1.5
1.0
0.5
0
-0.5
MKDSRB MNE BIHALBKOS
J Dec-15 J Jun-17 J Dec-14 J Q1/Q2 2017
Q Peak since 2008 � Pre-crisis level (end 2007) Q Change since Dec-14, rhs � Average (2006–08)
Source: National central banks. Source: National central banks.
WESTERN BALKANS REGULAR ECONOMIC REPORT NO.12
18 | 6. CREdIT RECOvERs, dRIvEN BY LENdING TO hOUsEhOLds
vulnerabilities in domestic banks have renewed concerns about asset quality and the health of specific banks, in particular in Bosnia and Herzegovina and in Montenegro. Further structural changes are likely from the planned sale of some foreign-owned subsidiaries as parent banks realign their external exposures and smaller domestic institutions in Bosnia and Herzegovina merge. The deleveraging of foreign banks has driven up domestic deposits and reduced the average loan-to-deposit ratio from 119 percent in 2008 to about 88 percent in mid-2017.
In the Western Balkans, financial intermediation is minimal and improvements have been slow. The depth of the financial sector measured by private sector credit to GDP averaged 45 percent in 2016, but was particularly low in Kosovo at 39 percent of GDP and Albania at 35 percent, compared to about 93 percent in the euro area. This compares poorly to other countries in Central and South East Europe. Since 2008 there has been a slight decline of 3 percent of GDP in financial sector deepening. As banks shift their funding models toward mobilizing more deposits, diversification of funding sources and evolution of the shallow nonbank financial sector will be central to providing term financing to foster investments and ultimately economic growth. In particular, building capital markets could help mitigate potential difficulties in diversifying the required funding.
6. CREdIT RECOvERs, dRIvEN BY LENdING TO hOUsEhOLds | 19
JOB CREATION PICKS UP
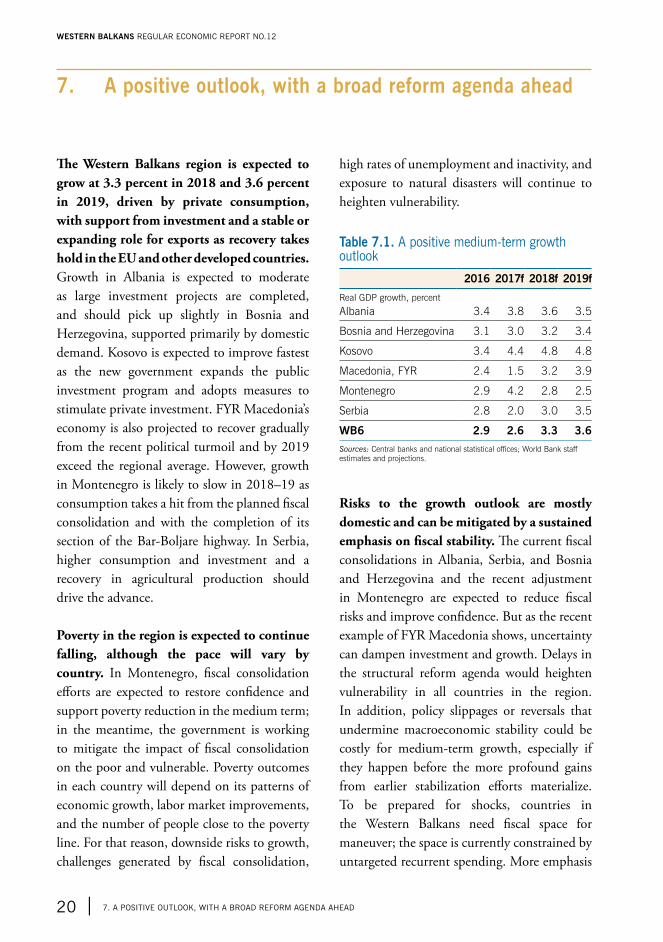
The Western Balkans region is expected to grow at 3.3 percent in 2018 and 3.6 percent in 2019, driven by private consumption, with support from investment and a stable or expanding role for exports as recovery takes hold in the EU and other developed countries. Growth in Albania is expected to moderate as large investment projects are completed, and should pick up slightly in Bosnia and Herzegovina, supported primarily by domestic demand. Kosovo is expected to improve fastest as the new government expands the public investment program and adopts measures to stimulate private investment. FYR Macedonia’s economy is also projected to recover gradually from the recent political turmoil and by 2019 exceed the regional average. However, growth in Montenegro is likely to slow in 2018–19 as consumption takes a hit from the planned fiscal consolidation and with the completion of its section of the Bar-Boljare highway. In Serbia, higher consumption and investment and a recovery in agricultural production should drive the advance.
Poverty in the region is expected to continue falling, although the pace will vary by country. In Montenegro, fiscal consolidation efforts are expected to restore confidence and support poverty reduction in the medium term; in the meantime, the government is working to mitigate the impact of fiscal consolidation on the poor and vulnerable. Poverty outcomes in each country will depend on its patterns of economic growth, labor market improvements, and the number of people close to the poverty line. For that reason, downside risks to growth, challenges generated by fiscal consolidation,
high rates of unemployment and inactivity, and exposure to natural disasters will continue to heighten vulnerability.
Table 7.1. A positive medium-term growth outlook
2016 2017f 2018f 2019f
Real GDP growth, percent
Albania 3.4 3.8 3.6 3.5
Bosnia and Herzegovina 3.1 3.0 3.2 3.4
Kosovo 3.4 4.4 4.8 4.8
Macedonia, FYR 2.4 1.5 3.2 3.9
Montenegro 2.9 4.2 2.8 2.5
Serbia 2.8 2.0 3.0 3.5
WB6 2.9 2.6 3.3 3.6
Sources: Central banks and national statistical offices; World Bank staff estimates and projections.
Risks to the growth outlook are mostly domestic and can be mitigated by a sustained emphasis on fiscal stability. The current fiscal consolidations in Albania, Serbia, and Bosnia and Herzegovina and the recent adjustment in Montenegro are expected to reduce fiscal risks and improve confidence. But as the recent example of FYR Macedonia shows, uncertainty can dampen investment and growth. Delays in the structural reform agenda would heighten vulnerability in all countries in the region. In addition, policy slippages or reversals that undermine macroeconomic stability could be costly for medium-term growth, especially if they happen before the more profound gains from earlier stabilization efforts materialize. To be prepared for shocks, countries in the Western Balkans need fiscal space for maneuver; the space is currently constrained by untargeted recurrent spending. More emphasis
7. A positive outlook, with a broad reform agenda ahead
WESTERN BALKANS REGULAR ECONOMIC REPORT NO.12
20 | 7. A POsITIvE OUTLOOK, WITh A BROAd REFORM AGENdA AhEAd
Box 7.1. how EU prospects may affect the economic outlook for the Western Balkans
The European Union is a “convergence machine”: between 1970 and 2009 living standards converged faster in Europe than in East Asia or Latin America. The catch-up was remarkable, especially for early accession countries Greece, Portugal, and Spain, followed by Hungary and Poland, with rapid increases in living standards and incomes. These countries managed to tap into regional value chains as simpler tasks were offshored outside of Europe as EU accessors moved to more sophisticated products with higher productivity.
While together Western Balkan countries doubled their share of the EU market between 2004 and 2015, faster growth in exports could be achieved by more intense trade integration, at a minimum catching up with countries of similar size. Exports of goods and services as a share of GDP average a low 30 percent or so in the Western Balkans, far below the 80 percent averaged by similar-sized transition economies now in the EU.
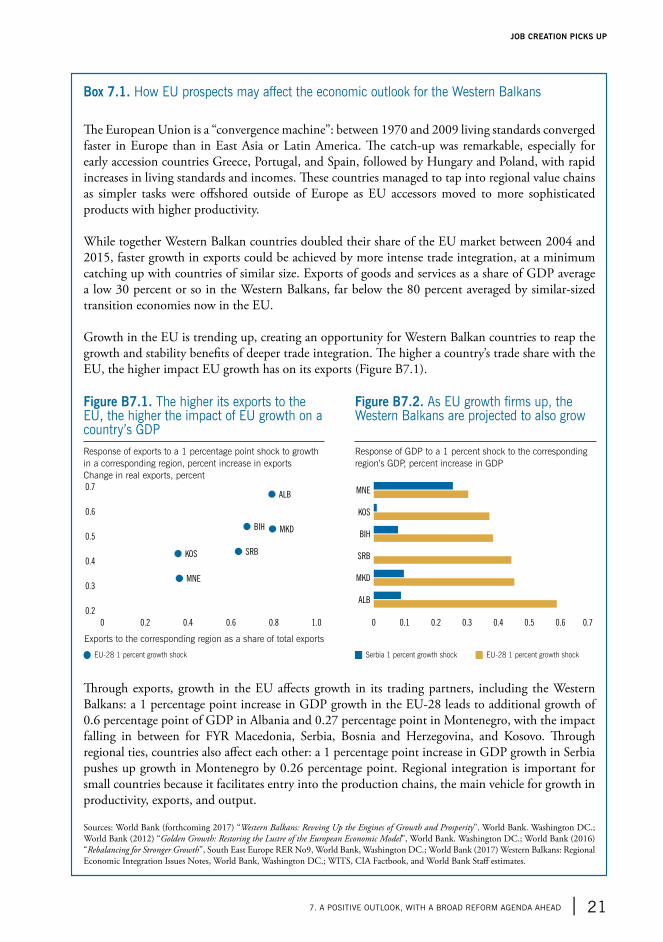
Growth in the EU is trending up, creating an opportunity for Western Balkan countries to reap the growth and stability benefits of deeper trade integration. The higher a country’s trade share with the EU, the higher impact EU growth has on its exports (Figure B7.1).
Figure B7.1. The higher its exports to the EU, the higher the impact of EU growth on a country’s GdP
Figure B7.2. As EU growth firms up, the Western Balkans are projected to also grow
Response of exports to a 1 percentage point shock to growth in a corresponding region, percent increase in exportsChange in real exports, percent
Response of GDP to a 1 percent shock to the corresponding region’s GDP, percent increase in GDP
0.2
0.7
0.6
0.5
0.4
0.3
0 0.2 0.4 0.6 0.8 1.0
MNE
KOS SRB
BIH MKD
ALB
0 0.1 0.2 0.3 0.4 0.5 0.6 0.7
ALB
MNE
KOS
BIH
SRB
MKD
Exports to the corresponding region as a share of total exports
Q EU-28 1 percent growth shock J Serbia 1 percent growth shock J EU-28 1 percent growth shock
Through exports, growth in the EU affects growth in its trading partners, including the Western Balkans: a 1 percentage point increase in GDP growth in the EU-28 leads to additional growth of 0.6 percentage point of GDP in Albania and 0.27 percentage point in Montenegro, with the impact falling in between for FYR Macedonia, Serbia, Bosnia and Herzegovina, and Kosovo. Through regional ties, countries also affect each other: a 1 percentage point increase in GDP growth in Serbia pushes up growth in Montenegro by 0.26 percentage point. Regional integration is important for small countries because it facilitates entry into the production chains, the main vehicle for growth in productivity, exports, and output.
Sources: World Bank (forthcoming 2017) “Western Balkans: Revving Up the Engines of Growth and Prosperity”. World Bank. Washington DC.; World Bank (2012) “Golden Growth: Restoring the Lustre of the European Economic Model”, World Bank. Washington DC.; World Bank (2016) “Rebalancing for Stronger Growth”, South East Europe RER No9, World Bank, Washington DC.; World Bank (2017) Western Balkans: Regional Economic Integration Issues Notes, World Bank, Washington DC.; WITS, CIA Factbook, and World Bank Staff estimates.
7. A POsITIvE OUTLOOK, WITh A BROAd REFORM AGENdA AhEAd | 21
JOB CREATION PICKS UP
on rationalizing spending is needed, especially as several countries in the region prepare for election cycles. As shown by Serbia’s recent volatile growth, weather-related vulnerability is also high and continues to weight on the growth outlook.
Developments in the EU will have a significant effect on the region’s outlook, as will global liquidity and financial conditions. Stronger-than-projected growth in the EU, with global liquidity conditions still loose, is a potential tail wind for the Western Balkans (see Box 7.1). Nonetheless, the higher and more resilient EU growth is, the more likely and imminent will be the “downsizing” of the European Central Bank’s quantitative easing program. A resulting stronger US dollar could be a risk for countries like Serbia and Montenegro where balance sheets have a relatively high share of US dollar exposure. More important, any monetary tightening in the EU would imply less favorable borrowing conditions, especially for countries with fiscal risks and unfinished reform agendas. The end of favorable global liquidity conditions could destabilize financial markets in some emerging economies that had been riding the tide of elevated credit, with potential repercussions for the Western Balkans.
While external conditions remain favorable, it is important to seize the moment to advance reforms. As demand for Western Balkan exports improves and borrowing costs remain favorable, countries would benefit from rebuilding their fiscal buffers to increase resilience to shocks. At the same time, it will be important to accelerate the pace of structural reforms to boost medium-term growth. In Montenegro, a credible fiscal adjustment with measures to mitigate social impacts is
essential to correct both internal and external imbalances. The growth outlook in Bosnia and Herzegovina depends on resolution of structural rigidities in spending that risk rendering ineffective the earlier fiscal consolidation. New governments in Albania, Kosovo, FYR Macedonia, and Serbia have the opportunity to advance structural reforms. Albania needs to diversify its sources of growth beyond the two large FDI projects that have supported growth in recent years; it can do so by ensuring macroeconomic sustainability, improving the investment climate (e.g., with more effective courts and public investment programs), and reforming the energy and education sectors. FYR Macedonia could reduce fiscal risks by building up tax collection, tightening spending controls, making social spending more efficient, and generally acting to enhance management of the public finances. Kosovo can strengthen its capacity to manage public investments and remove current barriers to growth in its nascent private economy, especially for exporters. Serbia can use the fiscal space created by consolidation to complete its transition to a market economy by rightsizing state-owned enterprises and drafting a new growth strategy to capitalize on its manufacturing sector and highly educated workforce. In Bosnia and Herzegovina, although its deficits are relatively moderate, the high tax burden combined with inefficient patterns of spending creates unnecessary fiscal pressure; if structural rigidities on spending are not addressed (such as the large public wage bill and sizable and poorly targeted social assistance) it will be difficult to generate robust growth in the medium term. In all countries, addressing high structural unemployment and low labor force participation would bring significant growth benefits (see Box 7.2). Finally, deeper regional integration among Western Balkan countries has the potential to create economies
WESTERN BALKANS REGULAR ECONOMIC REPORT NO.12
22 | 7. A POsITIvE OUTLOOK, WITh A BROAd REFORM AGENdA AhEAd
of scale, increase competitiveness, create positive spillovers, and lead to faster convergence to the EU, the main trading partner for all of them.
Maintaining momentum for progress on EU accession agendas would help shift risks to the upside. Serbia and Montenegro are negotiating chapters of EU acquis, with a view to membership in 2025. After adoption
Box 7.2. Addressing structural issues in Kosovo’s labor market
Kosovo is confronted by four major employment challenges: low rates of job creation, very high rates of inactivity and structural unemployment, high informality, and lack of growth in productivity. Economic growth in Kosovo has not translated into robust job creation. Despite annualized GDP growth of 3.4 percent for 2008–15, only about 63,000 formal jobs were created from 2005 to 2014; in fact, job destruction tended to outpace job creation. One reason is the difficulty of starting firms, and because those that do enter the market often have fewer than 10 employees, they tend to be less dynamic and less innovative, with minimal growth prospects and low survival rates.
Inactivity and persistent unemployment are pervasive, particularly among women and youth. In 2016, female participation in the labor market was 18.6 percent, the lowest rate in the Western Balkans and among the lowest in the world. Moreover, in 2016, 30.1 percent of eligible youth was neither employed nor in education or training (NEET), and at about 62.4 percent, youth unemployment was almost twice as high as adult rates. Not surprisingly, the employment-to-population ratio is also low: less than 30 percent of working-age adults are employed, compared to 50 percent for the region. An estimated 30 percent of workers have informal jobs, and rates are higher in areas like construction and agriculture that rely heavily on unskilled labor.
Stimulating job creation and firm growth depends not only on Kosovo improving its investment climate, but also on removing barriers to employment. For instance, more education will lead to higher employment only if it provides the skills that employers demand. Three policy priorities are therefore vital:
• An improved investment climate, less informal competition, and adequate access to finance for small and medium enterprises. The regulatory burdens on firms in Kosovo are high, mainly because the inspection system is inefficient and expensive. Also, about 60 percent of firms report being severely affected by informal competitors. Smaller firms have the additional disadvantage of finding it harder to access credit.
• Affordable child- and elder-care, flexible work arrangements, and adequate maternity leave regulations. In Kosovo the supply of formal child care is extremely low relative to countries at a similar development stage, and there is a severe shortage of flexible work arrangements. Finally, family leave laws, with maternity leave largely charged to employees, are a disincentive to formally hiring women.
• Matching skills with market needs, with special attention to disadvantaged groups. Youth find it hard to acquire skills, even though firms consider skills shortages to be a serious problem, and larger firms distrust Kosovo’s education and training systems.
Sources: World Bank (2017) “Kosovo Jobs Diagnostic”. World Bank. Washington DC.; PISA 2015.
7. A POsITIvE OUTLOOK, WITh A BROAd REFORM AGENdA AhEAd | 23
JOB CREATION PICKS UP
of the Reform Agenda Document and stable direction of anticipated reforms, Bosnia and Herzegovina has been asked to complete a detailed questionnaire to assess its readiness for EU candidacy and expects confirmation of candidate status in 2018. Albania and FYR Macedonia expect to start accession negotiations in 2018. Kosovo’s priorities are visa liberalization and advancing on implementing the Stabilization and Association Agreement (SAA). EU accession is a formidable tool for
achieving stable and meaningful growth, but it will not be easy. Montenegro has opened 28 of the 33 negotiated acquis chapters and Serbia has opened 10. For Serbia to enter in 2025, in the next five years it will have to open 23 and close 33 chapters—thus hitting a major milestone almost monthly. Opening chapters is an exceptionally demanding process. Box 7.3 summarizes what has been done and what is still to be done to support EU membership for Western Balkan countries.
Box 7.3. Western Balkan progress on the EU accession agenda: Collaboration rather than competition is essential
On May 23, 2017, the European Union, the Western Balkans, and Turkey jointly adopted conclusions that include country-specific policy guidance based on each country’s Economic Reform Programme (ERP). This followed the annual economic policy dialogue meeting of Representatives of the Western Balkans and Turkey with EU Member States, the European Commission (EC), and the European Central Bank (ECB).
Economic governance has become a pillar of EU enlargement policy, mirroring developments within the EU to strengthen economic policy coordination as part of the European Semester. Pre-accession economic surveillance by the EC and the EU has been gradually strengthened in recent years to help potential enlargement partners achieve and sustain macroeconomic stability, boost growth, and meet the economic accession criteria. As of 2015, all candidate and potential candidate countries must submit their medium-term policy plans in the form of annual ERPs. The ERP process and the ensuing dialogue on economic governance is also meant to enhance the Western Balkan institutional and analytical capacity to adopt coherent medium-term policy frameworks and to prepare these countries for participation in the EU economic policy coordination.
The ERPs spell out medium-term macroeconomic and fiscal frameworks for the next three years and priorities for structural reforms. The agenda includes reforms to boost competitiveness and improve conditions for growth and job creation. In 2017, all enlargement countries submitted their third annual ERPs, covering 2017-19, and Joint Conclusions with country-specific policy guidance were adopted by all enlargement partners and the EU at the ministerial level.
The Joint Conclusions between the Western Balkans and EU documented the macroeconomic and fiscal challenges and structural obstacles to growth and competitiveness for countries in the region and the progress made. Among the structural obstacles were social benefits that were not well-targeted (Montenegro); skills mismatches (Montenegro, Albania, Bosnia and Herzegovina, FYR Macedonia); low enrollment in pre-school education (Montenegro, Serbia, Bosnia and Herzegovina); sizable or persistent nonperforming loans (Montenegro, FYR Macedonia, Bosnia and Herzegovina, Serbia, Albania); broadband coverage below the EU average (Serbia); a low labor market participation or
WESTERN BALKANS REGULAR ECONOMIC REPORT NO.12
24 | 7. A POsITIvE OUTLOOK, WITh A BROAd REFORM AGENdA AhEAd
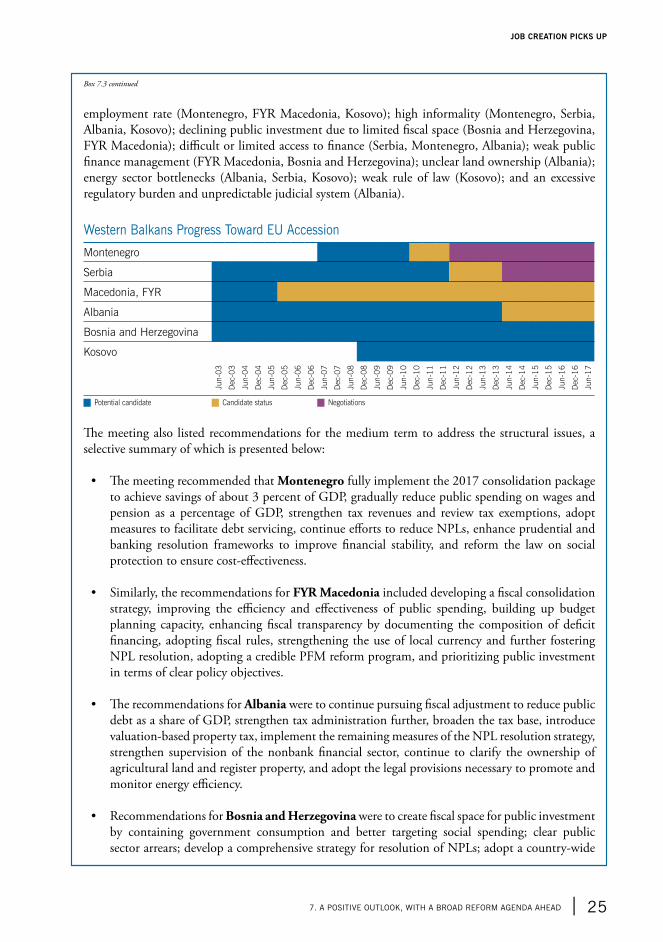
employment rate (Montenegro, FYR Macedonia, Kosovo); high informality (Montenegro, Serbia, Albania, Kosovo); declining public investment due to limited fiscal space (Bosnia and Herzegovina, FYR Macedonia); difficult or limited access to finance (Serbia, Montenegro, Albania); weak public finance management (FYR Macedonia, Bosnia and Herzegovina); unclear land ownership (Albania); energy sector bottlenecks (Albania, Serbia, Kosovo); weak rule of law (Kosovo); and an excessive regulatory burden and unpredictable judicial system (Albania).
Western Balkans Progress Toward EU Accession
Montenegro
Serbia
Macedonia, FYR
Albania
Bosnia and Herzegovina
Kosovo
Jun-
03
Dec
-03
Jun-
04
Dec
-04
Jun-
05
Dec
-05
Jun-
06
Dec
-06
Jun-
07
Dec
-07
Jun-
08
Dec
-08
Jun-
09
Dec
-09
Jun-
10
Dec
-10
Jun-
11
Dec
-11
Jun-
12
Dec
-12
Jun-
13
Dec
-13
Jun-
14
Dec
-14
Jun-
15
Dec
-15
Jun-
16
Dec
-16
Jun-
17
J Potential candidate J Candidate status J Negotiations
The meeting also listed recommendations for the medium term to address the structural issues, a selective summary of which is presented below:
• The meeting recommended that Montenegro fully implement the 2017 consolidation package to achieve savings of about 3 percent of GDP, gradually reduce public spending on wages and pension as a percentage of GDP, strengthen tax revenues and review tax exemptions, adopt measures to facilitate debt servicing, continue efforts to reduce NPLs, enhance prudential and banking resolution frameworks to improve financial stability, and reform the law on social protection to ensure cost-effectiveness.
• Similarly, the recommendations for FYR Macedonia included developing a fiscal consolidation strategy, improving the efficiency and effectiveness of public spending, building up budget planning capacity, enhancing fiscal transparency by documenting the composition of deficit financing, adopting fiscal rules, strengthening the use of local currency and further fostering NPL resolution, adopting a credible PFM reform program, and prioritizing public investment in terms of clear policy objectives.
• The recommendations for Albania were to continue pursuing fiscal adjustment to reduce public debt as a share of GDP, strengthen tax administration further, broaden the tax base, introduce valuation-based property tax, implement the remaining measures of the NPL resolution strategy, strengthen supervision of the nonbank financial sector, continue to clarify the ownership of agricultural land and register property, and adopt the legal provisions necessary to promote and monitor energy efficiency.
• Recommendations for Bosnia and Herzegovina were to create fiscal space for public investment by containing government consumption and better targeting social spending; clear public sector arrears; develop a comprehensive strategy for resolution of NPLs; adopt a country-wide
Box 7.3 continued
7. A POsITIvE OUTLOOK, WITh A BROAd REFORM AGENdA AhEAd | 25
JOB CREATION PICKS UP
energy sector reform strategy and a legal framework; simplify, harmonize, and ensure mutual recognition of business registration procedures between entities; introduce e-payment tax services; strengthen employment services to better assist job seekers; and reduce the tax wedge.
• The recommendations for Kosovo were to improve the capacities of the Ministry of Finance and local governments to improve macro-fiscal planning, forecasting, and fiscal assessments; strengthen central and local government capacities to manage public procurement and public investment; take steps to introduce targeting and means testing of war veteran programs; remove legal and institutional barriers to the access of businesses to finance; develop a liquidation and bank resolution framework to strengthen the resilience of the banking sector; adopt a mechanism to support energy efficiency measures; and complete the regulation of energy prices.
• The recommendations for Serbia were to reduce the budget deficit in 2017 and over the medium term, increase capital spending through additional fiscal savings, reduce public spending on wages and pensions as a share of GDP, revive reforms of SOEs and tax administration, implement the rest of the NPL resolution strategy, finalize the reform and privatization of two large state-owned banks, adjust electricity tariffs to reflect actual costs, improve payment collection and avoid future accumulation of arrears in the energy sector, develop the framework for regulating new financial instruments to improve access to finance, put in place a risk management system to improve the functioning of the tax administration, increase labor market participation, and reduce the high non-wage labor cost of jobs at the lower end of the wage distribution in a fiscally neutral way.
Source: Council of the European Union (2017) A Summary of Joint Conclusions of the Economic and Financial Dialogue Between the EU and the Western Balkans and Turkey, Brussels, 23 May 2017. (OR. en) 9655/17 ECOFIN 460 UEM 177 COWEB 64 ELARG 42; National authorities and World Bank staff.Note: While the conclusions described were adopted jointly by the EU, the Western Balkans, and Turkey, this box focuses only on conclusions related to the Western Balkans.
Box 7.3 continued
WESTERN BALKANS REGULAR ECONOMIC REPORT NO.12
26 | 7. A POsITIvE OUTLOOK, WITh A BROAd REFORM AGENdA AhEAd

Country Notes

Recent Economic Developments
Albania’s economic growth is expected to accelerate to 3.8 percent in 2017, supported by robust domestic demand. Having reached 3.4 percent in 2016, growth continued upward in 2017, supported by private investment and consumption, which together are expected to account for 3.7 pp growth for 2017. Investment dynamics are linked to progress on two large FDI-financed energy projects (the Trans Adriatic Pipeline and the Devoll hydropower plant), and private consumption is supported by job creation and the easing of credit conditions. Public consumption has plateaued due to fiscal consolidation efforts. Net exports contributed positively in the first half of 2017, helped by tourism and a recovering commodity market. However, in the second half net exports are being weakened by the higher energy imports, as domestic production was affected by a drought. As a result, in 2017 net exports are expected to add only 0.1 percentage points to growth. Meanwhile, the main drivers of growth are construction and services; declines in energy production are weighing on industry.
Growth stimulated job creation in 2016 and the first half of 2017. Employment grew by 2.5 percentage points (pp) in 2016 and 1.7 pp in the first half of 2017. Net job creation was higher in services (8.6 percent year-on-year) and industry (2.7 percent). Labor force participation reached 57.7 percent, 0.5 pp higher than in the same period in 2016. The official unemployment rate declined by 2 pp to an average of 14 percent, but more than half is still long-term. Average nominal wages, which had been declining since 2013, began to grow again in 2017 when the freeze in public wages ended.
Prudent fiscal policy has been supporting a reduction in public debt, though the pace of consolidation slowed in 2017. Despite parliamentary elections, the 2017 fiscal deficit is projected at 2 percent of GDP, only slightly above the 1.8 percent deficit in 2016. Through June revenues and expenditures remained within budget, consistent with the revised fiscal rules in the Organic Budget Law adopted in July 2016. The primary balance is expected to remain positive at 0.4 percent of
Albania
y Economic growth in Albania is projected to rise to 3.8 percent in 2017, supported by private investment, including FDI-financed energy projects, and recovering household consumption.
y Growth is expected to moderate to an average of 3.6 percent for 2018–19 as private consumption accelerates.
y The economic expansion has created jobs.
y Prudent fiscal policy, continuing during the electoral year, has reduced public debt.
y To foster confidence and accelerate growth, it will be critical for Albania to speed up reforms to consolidate public finances, improve the efficiency of spending, reduce risks from the energy and financial sectors, and build up the legal system.
ALBANIA | 29
JOB CREATION PICKS UP
GDP, supporting a decline in the public debt-to-GDP ratio from 72.4 percent in 2016 to 70.9 percent in 2017. Fiscal consolidation was slowed by an increase in subsidies to the state-owned energy distribution company; its financial performance was undermined by the dry season. This situation illuminates the vulnerabilities associated with unfinished reforms in the energy sector. Savings from lower interest payments helped finance an increase in investment grants to local governments for local infrastructure projects and the rehabilitation of city centers.
This year inflation is expected to gradually converge to the Bank of Albania’s target band of 3 ± 1 percent. Higher food prices are likely to push up average annual inflation from 0.9 percent in 2016 to 2.2 percent. The rise in inflation follows steady economic growth and recovery in the utilization of production capacity.
The Bank of Albania’s policy stance continues to be accommodative. The policy rate is still the minimum of 1.25 percent set in April 2016. The policy change was transmitted to the credit market with the average rate on domestic currency loans falling to 6.8 percent in the first half of 2017 from 7.3 percent a year earlier. The exchange rate appreciated due to stronger inflows of foreign currency. In the second quarter of 2017 the real effective exchange rate appreciated by 4.4 percent, driven by a nominal appreciation of the Albanian lek of 4.6 percent and a wider inflation differential with trading partners.
Credit to households recovered in the first half of 2017, but slow resolution of nonperforming loans (NPLs) continues to deter lending to corporations. The banking
sector is profitable, and the capital adequacy ratio of 16.3 percent in mid-2017 was well above the regulatory minimum of 12 percent. Lower interest rates stimulated an expansion of 9.3 percent (y-o-y) in domestic currency loans. Restructuring the NPLs of large borrowers and mandatory write-offs led the NPL ratio to drop from above 18 percent in January to 15.3 percent of total loans in July 2017. However, slow recovery continues to suppress credit growth, particularly in business lending, as banks remain risk-averse: lending to corporations increased by only 4 percent, though that is up from 2.1 percent in the same period in 2016.1 Resolving NPLS will require accelerated application of the Bankruptcy Law adopted early in 2017 and such complementary measures as write-offs of old loans.
The current account deficit (CAD) is projected to narrow from 9.6 percent in 2016 to 8.3 percent in 2017 as tourism-related exports surge. Remittances are expected to remain robust even though growth is weak in such source countries as Greece and Italy. Strong services exports, led by tourism, have helped reduce the trade deficit despite stagnant goods exports and higher energy-related imports. On the financing side, FDI fell by 7 percent as activities related to two large energy projects, which reached a peak in 2016, start to decline. (Imports associated with these projects followed a similar dynamic.) By July 2017 the stock of foreign exchange reserves was €2.8 billion, which covered 6.6 months of imports of goods and services.
1 Without taking into account the effect of the write-offs, which leads to a decline in the credit stock.
WESTERN BALKANS REGULAR ECONOMIC REPORT NO.12
30 | ALBANIA
Outlook and Risks
The near-term economic outlook for Albania is positive, although growth is projected to moderate to an average of 3.6 percent for 2018–19 with completion of the two large energy projects and no other large projects planned. In the medium term, growth will rely on private consumption, supported by labor market improvements and export growth in response to greater demand in the EU. The CAD is expected to be narrowed by growing services exports and slower FDI-related imports, with the CAD fully financed by FDI. Sustained fiscal consolidation efforts and structural reforms should gradually reduce the fiscal deficit to 1.5 percent of GDP by 2019 and the debt-to-GDP ratio to 60 percent of GDP by 2022. Poverty (US$5.5/day, 2011 PPP) is projected to decline from 32.8 percent in 2017 to 30.9 percent by 2019.
These economic prospects are not without risks, however. Lower than expected growth in trading partners could reduce Albania’s exports and FDI inflows, which would translate into lower tax revenues and public investment and thus slower output growth. Higher global interest rates would pressure the budget by tightening financing conditions for the government. Enhancing growth depends on macroeconomic stability and on improvements in the business climate to enhance the efficiency of the courts, public investment management, labor skills, and energy reform. The post-election period will offer an opportunity to advance these agendas, which should be informed by efforts to ensure that poverty reduction continues
ALBANIA | 31
JOB CREATION PICKS UP
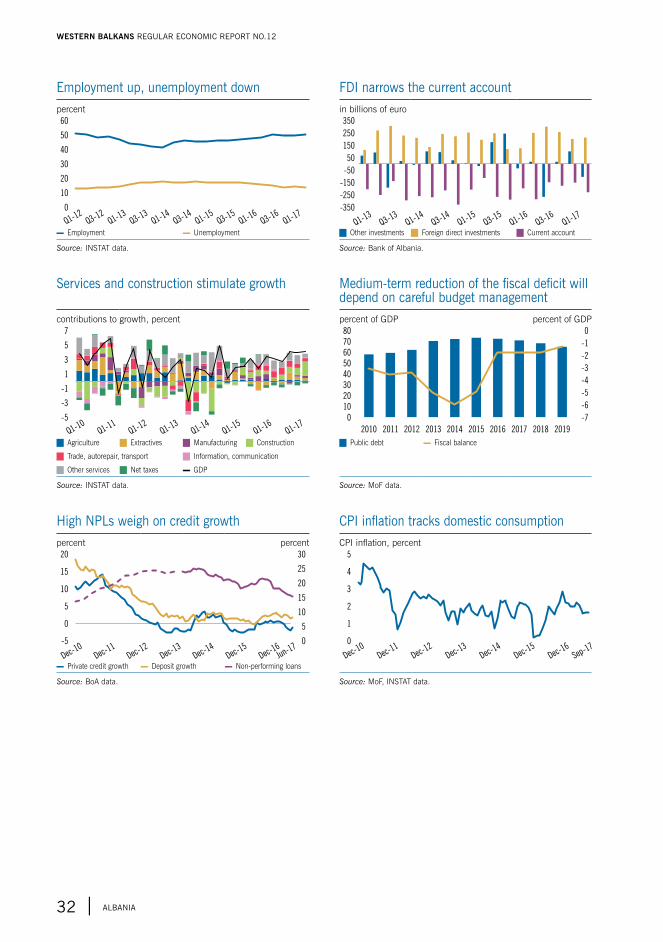
Employment up, unemployment downpercent
0
60
50
40
30
20
10
Q1-12
Q1-13
Q1-14
Q1-15
Q3-12
Q3-13
Q3-14
Q3-15
Q1-16
Q3-16
Q1-17
▬ Employment ▬ Unemployment
Source: INSTAT data.
FdI narrows the current accountin billions of euro
-350
350
250
150
50
-50
-150
-250
Q1-13
Q1-14
Q3-13
Q3-14
Q1-15
Q3-15
Q1-16
Q3-16
Q1-17
J Other investments J Foreign direct investments J Current account
Source: Bank of Albania.
services and construction stimulate growth
contributions to growth, percent
-5
7
5
3
1
-1
-3
Q1-10
Q1-11
Q1-12
Q1-13
Q1-14
Q1-15
Q1-16
Q1-17
J Agriculture J Extractives J Manufacturing J Construction
J Trade, autorepair, transport J Information, communication
J Other services J Net taxes ▬ GDP
Source: INSTAT data.
Medium-term reduction of the fiscal deficit will depend on careful budget managementpercent of GDP percent of GDP
0 -7
10 -6
80
70
0
60
-1
50-2
40-3
30-4
20 -5
2010 2011 2012 2013 2014 2015 2016 2017 2018 2019
J Public debt ▬ Fiscal balance
Source: MoF data.
high NPLs weigh on credit growthpercent percent
-5
20
15
10
5
0
Dec-10
0
30
25
20
15
10
5
Dec-11
Dec-12
Dec-13
Dec-14
Dec-15
Dec-16Jun-1
7
▬ Private credit growth ▬ Deposit growth ▬ Non-performing loans
Source: BoA data.
CPI inflation tracks domestic consumptionCPI inflation, percent
0
5
4
3
2
1
Dec-10
Dec-11
Dec-12
Dec-13
Dec-14
Dec-15
Dec-16
Sep-17
Source: MoF, INSTAT data.
WESTERN BALKANS REGULAR ECONOMIC REPORT NO.12
32 | ALBANIA
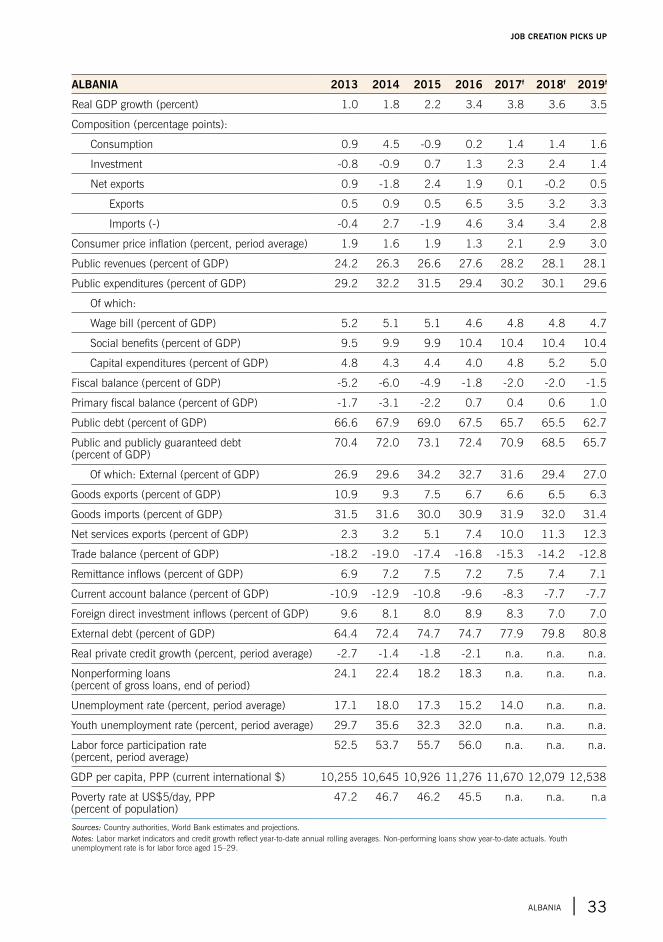
ALBANIA 2013 2014 2015 2016 2017f 2018f 2019f
Real GDP growth (percent) 1.0 1.8 2.2 3.4 3.8 3.6 3.5
Composition (percentage points):
Consumption 0.9 4.5 -0.9 0.2 1.4 1.4 1.6
Investment -0.8 -0.9 0.7 1.3 2.3 2.4 1.4
Net exports 0.9 -1.8 2.4 1.9 0.1 -0.2 0.5
Exports 0.5 0.9 0.5 6.5 3.5 3.2 3.3
Imports (-) -0.4 2.7 -1.9 4.6 3.4 3.4 2.8
Consumer price inflation (percent, period average) 1.9 1.6 1.9 1.3 2.1 2.9 3.0
Public revenues (percent of GDP) 24.2 26.3 26.6 27.6 28.2 28.1 28.1
Public expenditures (percent of GDP) 29.2 32.2 31.5 29.4 30.2 30.1 29.6
Of which:
Wage bill (percent of GDP) 5.2 5.1 5.1 4.6 4.8 4.8 4.7
Social benefits (percent of GDP) 9.5 9.9 9.9 10.4 10.4 10.4 10.4
Capital expenditures (percent of GDP) 4.8 4.3 4.4 4.0 4.8 5.2 5.0
Fiscal balance (percent of GDP) -5.2 -6.0 -4.9 -1.8 -2.0 -2.0 -1.5
Primary fiscal balance (percent of GDP) -1.7 -3.1 -2.2 0.7 0.4 0.6 1.0
Public debt (percent of GDP) 66.6 67.9 69.0 67.5 65.7 65.5 62.7
Public and publicly guaranteed debt (percent of GDP)
70.4 72.0 73.1 72.4 70.9 68.5 65.7
Of which: External (percent of GDP) 26.9 29.6 34.2 32.7 31.6 29.4 27.0
Goods exports (percent of GDP) 10.9 9.3 7.5 6.7 6.6 6.5 6.3
Goods imports (percent of GDP) 31.5 31.6 30.0 30.9 31.9 32.0 31.4
Net services exports (percent of GDP) 2.3 3.2 5.1 7.4 10.0 11.3 12.3
Trade balance (percent of GDP) -18.2 -19.0 -17.4 -16.8 -15.3 -14.2 -12.8
Remittance inflows (percent of GDP) 6.9 7.2 7.5 7.2 7.5 7.4 7.1
Current account balance (percent of GDP) -10.9 -12.9 -10.8 -9.6 -8.3 -7.7 -7.7
Foreign direct investment inflows (percent of GDP) 9.6 8.1 8.0 8.9 8.3 7.0 7.0
External debt (percent of GDP) 64.4 72.4 74.7 74.7 77.9 79.8 80.8
Real private credit growth (percent, period average) -2.7 -1.4 -1.8 -2.1 n.a. n.a. n.a.
Nonperforming loans (percent of gross loans, end of period)
24.1 22.4 18.2 18.3 n.a. n.a. n.a.
Unemployment rate (percent, period average) 17.1 18.0 17.3 15.2 14.0 n.a. n.a.
Youth unemployment rate (percent, period average) 29.7 35.6 32.3 32.0 n.a. n.a. n.a.
Labor force participation rate (percent, period average)
52.5 53.7 55.7 56.0 n.a. n.a. n.a.
GDP per capita, PPP (current international $) 10,255 10,645 10,926 11,276 11,670 12,079 12,538
Poverty rate at US$5/day, PPP (percent of population)
47.2 46.7 46.2 45.5 n.a. n.a. n.a
Sources: Country authorities, World Bank estimates and projections.Notes: Labor market indicators and credit growth reflect year-to-date annual rolling averages. Non-performing loans show year-to-date actuals. Youth unemployment rate is for labor force aged 15–29.
ALBANIA | 33
JOB CREATION PICKS UP
Recent Economic Developments
Growth in 2017 is expected to sustain the pace of the last two years. Economic activity is expected to increase by 3 percent in 2017, similar to the pace of expansion in 2014–16. Consumption continues to drive growth and is expected to contribute 2.8 percentage points (pp) in 2017, supported by investment (0.5 pp). Exports growth has been relatively broad-based, but dry season reduced somewhat agricultural output, and imports growth was strong both in consumer and intermediate products, resulting in a negative contribution from net exports (0.6 pp) to growth. As for production, the main contributors to the growth of real value-added in 2016 were services (1.2 pp), manufacturing (1 pp), and agriculture (0.5 pp). The composition of growth is expected to be similar in 2017, except that because of the dry season agriculture is likely to contribute less.
Unemployment has fallen significantly, from 25.4 percent in 2016 to 20.5 percent in 2017, but labor market participation is also falling. The significant reduction in unemployment rate resulted from the fall in activity rate and a slight rise in employment.
Unemployment remains high: 43.1 percent for men and 51.4 percent for women in 2017. It is highest among youth, but that rate did decrease from 54.3 percent in 2016 to 45.8 percent. It is encouraging, however, that those aged 25 to 49 are among the most active in the labor market, with an activity rate of 73.5 percent and employment of 58.1 percent.
Deflation ended in 2017. In July the consumer price index was up 0.9 percent year-on-year (y-o-y), mainly because more luxury goods, such as alcohol and tobacco (up 6.5 percent), were imported. Other categories that registered increases were food (up 0.6 percent), utilities (up 0.9 percent), hospital services (up 4.6 percent) and transport services (up 3.2 percent). By contrast, prices decreased notably on clothing and footwear, followed by out-patient services, furniture, and accommodations. With limited growth in nominal salaries in 2017, higher consumer prices reduced real incomes: the net monthly salary in July 2017 averaged €425, up by 2 percent y-o-y in nominal terms but down by 0.5 percent compared to yearend 2016.
A fiscal deficit of 1.5 percent of GDP is projected for 2017. Gross revenue from
Bosnia and Herzegovina
y Economic growth for 2017 in Bosnia and Herzegovina (BiH) is estimated at 3 percent, continuing the momentum of the past two years.
y Unemployment fell by 5 percentage points but there was also a fall in labor market activity rate. However, at 20.5 percent unemployment is still high and is at 45.8 percent for youth.
y Supported primarily by rising domestic demand, economic growth is projected to move above 3 percent in 2018–19. While the work on EU accession will push reforms forward, slow progress caused by political uncertainty is a recognizable risk.
WESTERN BALKANS REGULAR ECONOMIC REPORT NO.12
34 | BOsNIA ANd hERzEGOvINA
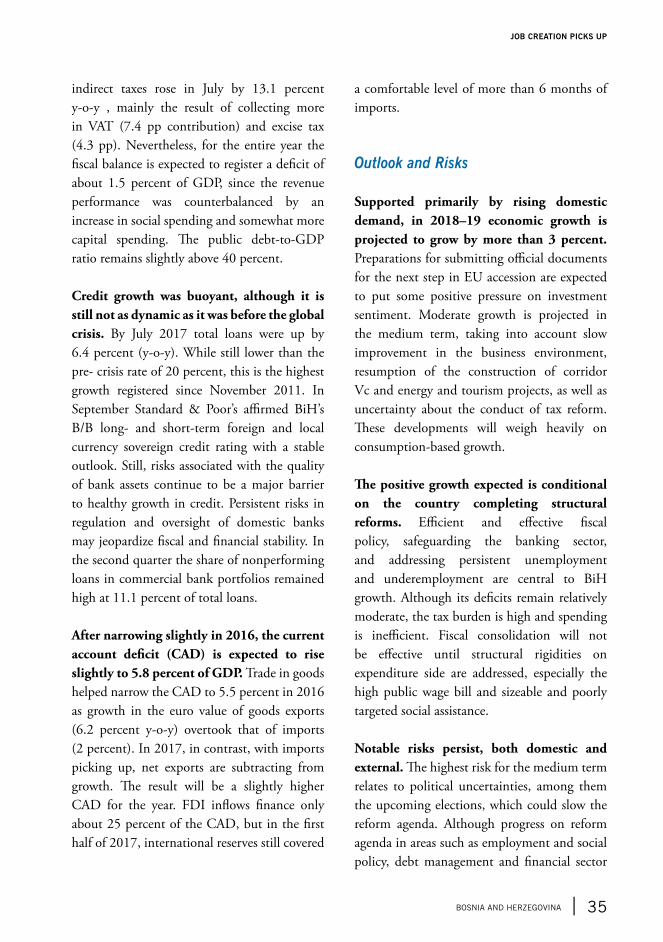
indirect taxes rose in July by 13.1 percent y-o-y , mainly the result of collecting more in VAT (7.4 pp contribution) and excise tax (4.3 pp). Nevertheless, for the entire year the fiscal balance is expected to register a deficit of about 1.5 percent of GDP, since the revenue performance was counterbalanced by an increase in social spending and somewhat more capital spending. The public debt-to-GDP ratio remains slightly above 40 percent.
Credit growth was buoyant, although it is still not as dynamic as it was before the global crisis. By July 2017 total loans were up by 6.4 percent (y-o-y). While still lower than the pre- crisis rate of 20 percent, this is the highest growth registered since November 2011. In September Standard & Poor’s affirmed BiH’s B/B long- and short-term foreign and local currency sovereign credit rating with a stable outlook. Still, risks associated with the quality of bank assets continue to be a major barrier to healthy growth in credit. Persistent risks in regulation and oversight of domestic banks may jeopardize fiscal and financial stability. In the second quarter the share of nonperforming loans in commercial bank portfolios remained high at 11.1 percent of total loans.
After narrowing slightly in 2016, the current account deficit (CAD) is expected to rise slightly to 5.8 percent of GDP. Trade in goods helped narrow the CAD to 5.5 percent in 2016 as growth in the euro value of goods exports (6.2 percent y-o-y) overtook that of imports (2 percent). In 2017, in contrast, with imports picking up, net exports are subtracting from growth. The result will be a slightly higher CAD for the year. FDI inflows finance only about 25 percent of the CAD, but in the first half of 2017, international reserves still covered
a comfortable level of more than 6 months of imports.
Outlook and Risks
Supported primarily by rising domestic demand, in 2018–19 economic growth is projected to grow by more than 3 percent. Preparations for submitting official documents for the next step in EU accession are expected to put some positive pressure on investment sentiment. Moderate growth is projected in the medium term, taking into account slow improvement in the business environment, resumption of the construction of corridor Vc and energy and tourism projects, as well as uncertainty about the conduct of tax reform. These developments will weigh heavily on consumption-based growth.
The positive growth expected is conditional on the country completing structural reforms. Efficient and effective fiscal policy, safeguarding the banking sector, and addressing persistent unemployment and underemployment are central to BiH growth. Although its deficits remain relatively moderate, the tax burden is high and spending is inefficient. Fiscal consolidation will not be effective until structural rigidities on expenditure side are addressed, especially the high public wage bill and sizeable and poorly targeted social assistance.
Notable risks persist, both domestic and external. The highest risk for the medium term relates to political uncertainties, among them the upcoming elections, which could slow the reform agenda. Although progress on reform agenda in areas such as employment and social policy, debt management and financial sector
BOsNIA ANd hERzEGOvINA | 35
JOB CREATION PICKS UP
regulation put it more firmly on the path of EU accession, continued progress on reforms is needed as the country completes the detailed Questionnaire from the European Commission that assesses its readiness for EU candidacy. Externally, the main risk for the BiH economy continues to be slow growth in the EU.
WESTERN BALKANS REGULAR ECONOMIC REPORT NO.12
36 | BOsNIA ANd hERzEGOvINA
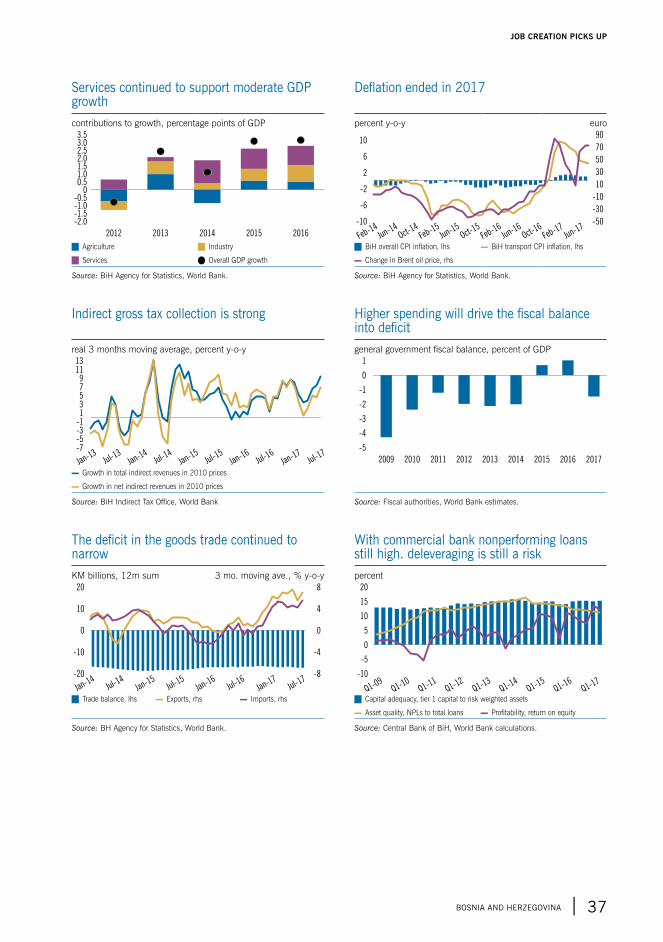
The deficit in the goods trade continued to narrowKM billions, 12m sum 3 mo. moving ave., % y-o-y
-20
20
10
0
-10
-8
8
4
0
-4
Jan-14
Jan-15
Jan-16
Jan-17
Jul-14
Jul-15
Jul-16
Jul-17
J Trade balance, lhs ▬ Exports, rhs ▬ Imports, rhs
Source: BH Agency for Statistics, World Bank.
With commercial bank nonperforming loans still high. deleveraging is still a riskpercent
Q1-09
Q1-10
Q1-11
Q1-12
Q1-13
Q1-14
Q1-15
-10
20
15
10
5
0
-5
Q1-16
Q1-17
J Capital adequacy, tier 1 capital to risk weighted assets
▬ Asset quality, NPLs to total loans ▬ Profitability, return on equity
Source: Central Bank of BiH, World Bank calculations.
services continued to support moderate GdP growthcontributions to growth, percentage points of GDP
2012 2013 2014 2015
-2.0
3.5
2.5
1.5
0.5
-0.5
-1.5
3.0
2.0
1.0
0
-1.0
2016
J Agriculture J Industry
J Services Q Overall GDP growth
Source: BiH Agency for Statistics, World Bank.
Deflation ended in 2017
percent y-o-y euro
-10
10
6
2
-2
-6
-50
90
70
30
-10
-30
50
10
Feb-14
Jun-14
Oct-14
Feb-15
Feb-16
Feb-17
Jun-15
Jun-16
Jun-17
Oct-15
Oct-16
J BiH overall CPI inflation, lhs ▬ BiH transport CPI inflation, lhs
▬ Change in Brent oil price, rhs
Source: BiH Agency for Statistics, World Bank.
Indirect gross tax collection is strong
real 3 months moving average, percent y-o-y
-7
1311
97531
-1-3-5
Jan-13
Jul-13
Jan-14
Jan-15
Jan-16
Jan-17
Jul-14
Jul-15
Jul-16
Jul-17
▬ Growth in total indirect revenues in 2010 prices
▬ Growth in net indirect revenues in 2010 prices
Source: BiH Indirect Tax Office, World Bank
Higher spending will drive the fiscal balance into deficitgeneral government fiscal balance, percent of GDP
-5
1
0
-1
-2
-3
-4
2009 20112010 20132012 2016 201720152014
Source: Fiscal authorities, World Bank estimates.
BOsNIA ANd hERzEGOvINA | 37
JOB CREATION PICKS UP
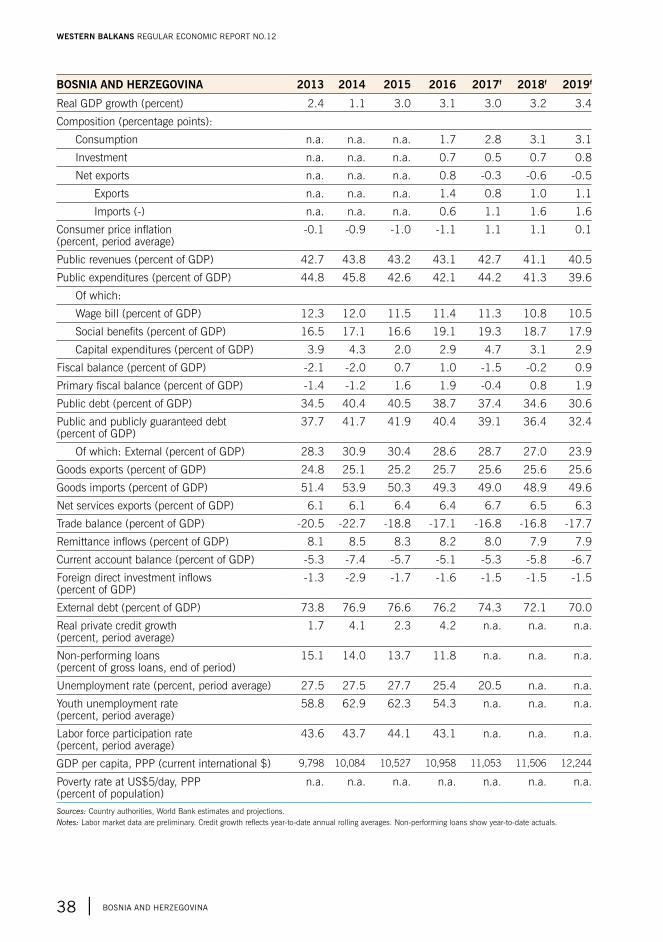
BOSNIA AND HERZEGOVINA 2013 2014 2015 2016 2017f 2018f 2019f
Real GDP growth (percent) 2.4 1.1 3.0 3.1 3.0 3.2 3.4
Composition (percentage points):
Consumption n.a. n.a. n.a. 1.7 2.8 3.1 3.1
Investment n.a. n.a. n.a. 0.7 0.5 0.7 0.8
Net exports n.a. n.a. n.a. 0.8 -0.3 -0.6 -0.5
Exports n.a. n.a. n.a. 1.4 0.8 1.0 1.1
Imports (-) n.a. n.a. n.a. 0.6 1.1 1.6 1.6
Consumer price inflation (percent, period average)
-0.1 -0.9 -1.0 -1.1 1.1 1.1 0.1
Public revenues (percent of GDP) 42.7 43.8 43.2 43.1 42.7 41.1 40.5
Public expenditures (percent of GDP) 44.8 45.8 42.6 42.1 44.2 41.3 39.6
Of which:
Wage bill (percent of GDP) 12.3 12.0 11.5 11.4 11.3 10.8 10.5
Social benefits (percent of GDP) 16.5 17.1 16.6 19.1 19.3 18.7 17.9
Capital expenditures (percent of GDP) 3.9 4.3 2.0 2.9 4.7 3.1 2.9
Fiscal balance (percent of GDP) -2.1 -2.0 0.7 1.0 -1.5 -0.2 0.9
Primary fiscal balance (percent of GDP) -1.4 -1.2 1.6 1.9 -0.4 0.8 1.9
Public debt (percent of GDP) 34.5 40.4 40.5 38.7 37.4 34.6 30.6
Public and publicly guaranteed debt (percent of GDP)
37.7 41.7 41.9 40.4 39.1 36.4 32.4
Of which: External (percent of GDP) 28.3 30.9 30.4 28.6 28.7 27.0 23.9
Goods exports (percent of GDP) 24.8 25.1 25.2 25.7 25.6 25.6 25.6
Goods imports (percent of GDP) 51.4 53.9 50.3 49.3 49.0 48.9 49.6
Net services exports (percent of GDP) 6.1 6.1 6.4 6.4 6.7 6.5 6.3
Trade balance (percent of GDP) -20.5 -22.7 -18.8 -17.1 -16.8 -16.8 -17.7
Remittance inflows (percent of GDP) 8.1 8.5 8.3 8.2 8.0 7.9 7.9
Current account balance (percent of GDP) -5.3 -7.4 -5.7 -5.1 -5.3 -5.8 -6.7
Foreign direct investment inflows (percent of GDP)
-1.3 -2.9 -1.7 -1.6 -1.5 -1.5 -1.5
External debt (percent of GDP) 73.8 76.9 76.6 76.2 74.3 72.1 70.0
Real private credit growth (percent, period average)
1.7 4.1 2.3 4.2 n.a. n.a. n.a.
Non-performing loans (percent of gross loans, end of period)
15.1 14.0 13.7 11.8 n.a. n.a. n.a.
Unemployment rate (percent, period average) 27.5 27.5 27.7 25.4 20.5 n.a. n.a.
Youth unemployment rate (percent, period average)
58.8 62.9 62.3 54.3 n.a. n.a. n.a.
Labor force participation rate (percent, period average)
43.6 43.7 44.1 43.1 n.a. n.a. n.a.
GDP per capita, PPP (current international $) 9,798 10,084 10,527 10,958 11,053 11,506 12,244
Poverty rate at US$5/day, PPP (percent of population)
n.a. n.a. n.a. n.a. n.a. n.a. n.a.
Sources: Country authorities, World Bank estimates and projections.Notes: Labor market data are preliminary. Credit growth reflects year-to-date annual rolling averages. Non-performing loans show year-to-date actuals.
WESTERN BALKANS REGULAR ECONOMIC REPORT NO.12
38 | BOsNIA ANd hERzEGOvINA
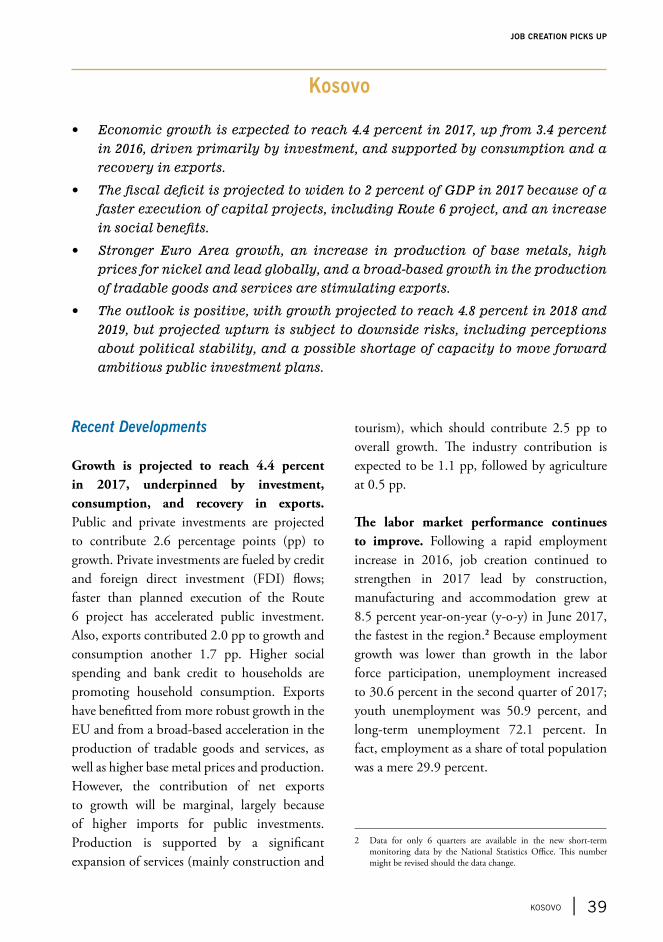
Recent Developments
Growth is projected to reach 4.4 percent in 2017, underpinned by investment, consumption, and recovery in exports. Public and private investments are projected to contribute 2.6 percentage points (pp) to growth. Private investments are fueled by credit and foreign direct investment (FDI) flows; faster than planned execution of the Route 6 project has accelerated public investment. Also, exports contributed 2.0 pp to growth and consumption another 1.7 pp. Higher social spending and bank credit to households are promoting household consumption. Exports have benefitted from more robust growth in the EU and from a broad-based acceleration in the production of tradable goods and services, as well as higher base metal prices and production. However, the contribution of net exports to growth will be marginal, largely because of higher imports for public investments. Production is supported by a significant expansion of services (mainly construction and
tourism), which should contribute 2.5 pp to overall growth. The industry contribution is expected to be 1.1 pp, followed by agriculture at 0.5 pp.
The labor market performance continues to improve. Following a rapid employment increase in 2016, job creation continued to strengthen in 2017 lead by construction, manufacturing and accommodation grew at 8.5 percent year-on-year (y-o-y) in June 2017, the fastest in the region.2 Because employment growth was lower than growth in the labor force participation, unemployment increased to 30.6 percent in the second quarter of 2017; youth unemployment was 50.9 percent, and long-term unemployment 72.1 percent. In fact, employment as a share of total population was a mere 29.9 percent.
2 Data for only 6 quarters are available in the new short-term monitoring data by the National Statistics Office. This number might be revised should the data change.
Kosovo
y Economic growth is expected to reach 4.4 percent in 2017, up from 3.4 percent in 2016, driven primarily by investment, and supported by consumption and a recovery in exports.
y The fiscal deficit is projected to widen to 2 percent of GDP in 2017 because of a faster execution of capital projects, including Route 6 project, and an increase in social benefits.
y Stronger Euro Area growth, an increase in production of base metals, high prices for nickel and lead globally, and a broad-based growth in the production of tradable goods and services are stimulating exports.
y The outlook is positive, with growth projected to reach 4.8 percent in 2018 and 2019, but projected upturn is subject to downside risks, including perceptions about political stability, and a possible shortage of capacity to move forward ambitious public investment plans.
KOsOvO | 39
JOB CREATION PICKS UP
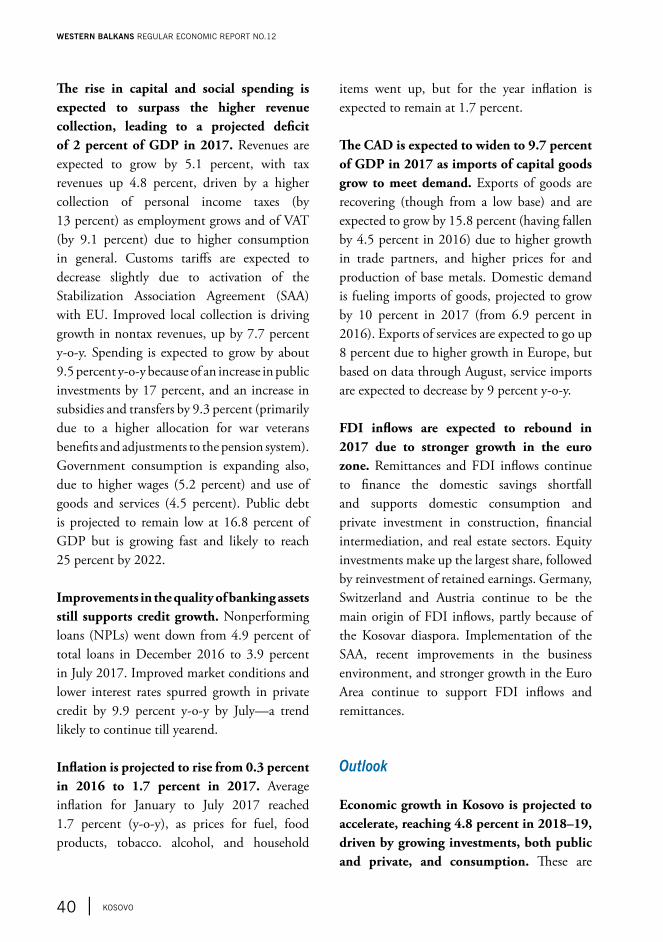
The rise in capital and social spending is expected to surpass the higher revenue collection, leading to a projected deficit of 2 percent of GDP in 2017. Revenues are expected to grow by 5.1 percent, with tax revenues up 4.8 percent, driven by a higher collection of personal income taxes (by 13 percent) as employment grows and of VAT (by 9.1 percent) due to higher consumption in general. Customs tariffs are expected to decrease slightly due to activation of the Stabilization Association Agreement (SAA) with EU. Improved local collection is driving growth in nontax revenues, up by 7.7 percent y-o-y. Spending is expected to grow by about 9.5 percent y-o-y because of an increase in public investments by 17 percent, and an increase in subsidies and transfers by 9.3 percent (primarily due to a higher allocation for war veterans benefits and adjustments to the pension system). Government consumption is expanding also, due to higher wages (5.2 percent) and use of goods and services (4.5 percent). Public debt is projected to remain low at 16.8 percent of GDP but is growing fast and likely to reach 25 percent by 2022.
Improvements in the quality of banking assets still supports credit growth. Nonperforming loans (NPLs) went down from 4.9 percent of total loans in December 2016 to 3.9 percent in July 2017. Improved market conditions and lower interest rates spurred growth in private credit by 9.9 percent y-o-y by July—a trend likely to continue till yearend.
Inflation is projected to rise from 0.3 percent in 2016 to 1.7 percent in 2017. Average inflation for January to July 2017 reached 1.7 percent (y-o-y), as prices for fuel, food products, tobacco. alcohol, and household
items went up, but for the year inflation is expected to remain at 1.7 percent.
The CAD is expected to widen to 9.7 percent of GDP in 2017 as imports of capital goods grow to meet demand. Exports of goods are recovering (though from a low base) and are expected to grow by 15.8 percent (having fallen by 4.5 percent in 2016) due to higher growth in trade partners, and higher prices for and production of base metals. Domestic demand is fueling imports of goods, projected to grow by 10 percent in 2017 (from 6.9 percent in 2016). Exports of services are expected to go up 8 percent due to higher growth in Europe, but based on data through August, service imports are expected to decrease by 9 percent y-o-y.
FDI inflows are expected to rebound in 2017 due to stronger growth in the euro zone. Remittances and FDI inflows continue to finance the domestic savings shortfall and supports domestic consumption and private investment in construction, financial intermediation, and real estate sectors. Equity investments make up the largest share, followed by reinvestment of retained earnings. Germany, Switzerland and Austria continue to be the main origin of FDI inflows, partly because of the Kosovar diaspora. Implementation of the SAA, recent improvements in the business environment, and stronger growth in the Euro Area continue to support FDI inflows and remittances.
Outlook
Economic growth in Kosovo is projected to accelerate, reaching 4.8 percent in 2018–19, driven by growing investments, both public and private, and consumption. These are
WESTERN BALKANS REGULAR ECONOMIC REPORT NO.12
40 | KOsOvO
supported by faster execution of capital projects and the improving business environment. Consumption is expected to contribute 2.5 pp to growth and investments 2.2 pp.
In the near term the CAD is projected to hover around 10 percent of GDP. The increased demand for investment goods will outperform the positive trend in exports of both goods and travel services, leading to increased trade and higher CADs. Net FDI and remittances are expected to finance larger shares of the CAD as growth in the Euro Area continues to firm up.
Kosovo’s outlook is positive, but the projected upturn is vulnerable to weaker growth in Europe and perceptions about political stability. Unwinding political risks could heighten fiscal pressures and delay reforms. The expansion of public investment as a driver of growth in 2018–20 may suffer from capacity constraints in the implementation of the investment program.
To counterbalance the risks, reforms should focus on shifting the sources of growth toward tradable sectors, increasing productivity, engaging and employing youth, addressing corruption, improving environmental sustain- ability, and addressing constraints in the energy sector.
KOsOvO | 41
JOB CREATION PICKS UP
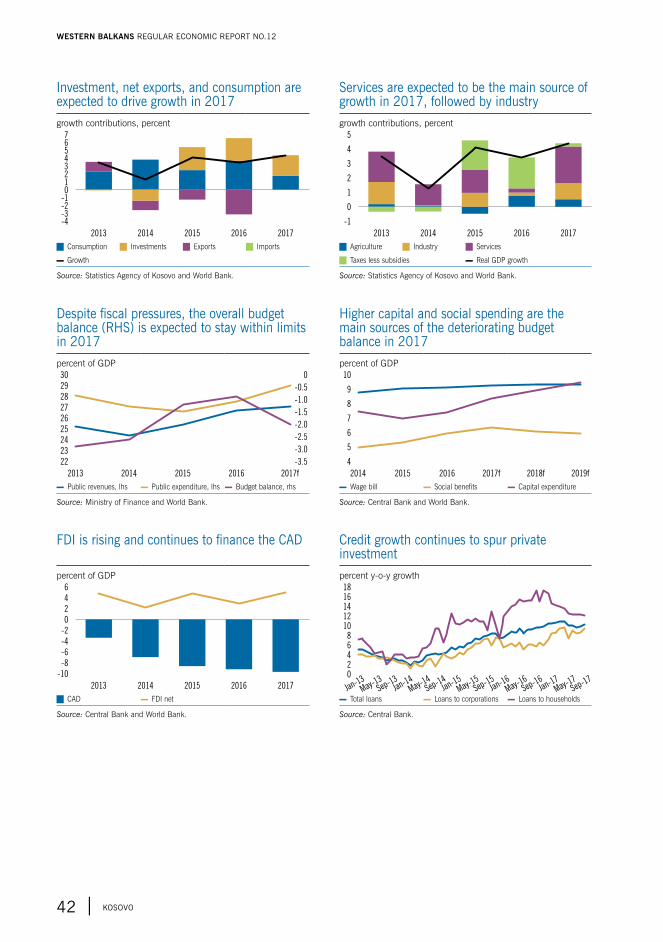
Investment, net exports, and consumption are expected to drive growth in 2017growth contributions, percent
2013 2014 2015 2017
-4
7
5
1
3
-10
-2
6
4
2
-3
2016
J Consumption J Investments J Exports J Imports
▬ Growth
Source: Statistics Agency of Kosovo and World Bank.
services are expected to be the main source of growth in 2017, followed by industrygrowth contributions, percent
-1
5
4
2
3
0
1
2013 2014 2015 20172016
J Agriculture J Industry J Services
J Taxes less subsidies ▬ Real GDP growth
Source: Statistics Agency of Kosovo and World Bank.
Despite fiscal pressures, the overall budget balance (Rhs) is expected to stay within limits in 2017percent of GDP
22 -3.5
23
24
-3.0
30 0
29 -0.5
27-1.5
28 -1.0
25-2.5
26-2.0
2013 20152014 2016 2017f
▬ Public revenues, lhs ▬ Public expenditure, lhs ▬ Budget balance, rhs
Source: Ministry of Finance and World Bank.
higher capital and social spending are the main sources of the deteriorating budget balance in 2017percent of GDP
4
10
9
7
8
5
6
20152014 2016 2017f 2018f 2019f
▬ Wage bill ▬ Social benefits ▬ Capital expenditure
Source: Central Bank and World Bank.
FDI is rising and continues to finance the CAD
percent of GDP
-10
-8
-6
6
4
0
2
-4
-2
2013 2014 2015 20172016
J CAD ▬ FDI net
Source: Central Bank and World Bank.
Credit growth continues to spur private investmentpercent y-o-y growth18
16
14
12
10
8
6
4
2
0
Jan-13
May-13
Sep-13Jan-1
4Jan-1
5Jan-1
6Jan-1
7
May-14
May-15
May-16
May-17
Sep-14
Sep-15
Sep-16
Sep-17
▬ Total loans ▬ Loans to corporations ▬ Loans to households
Source: Central Bank.
WESTERN BALKANS REGULAR ECONOMIC REPORT NO.12
42 | KOsOvO
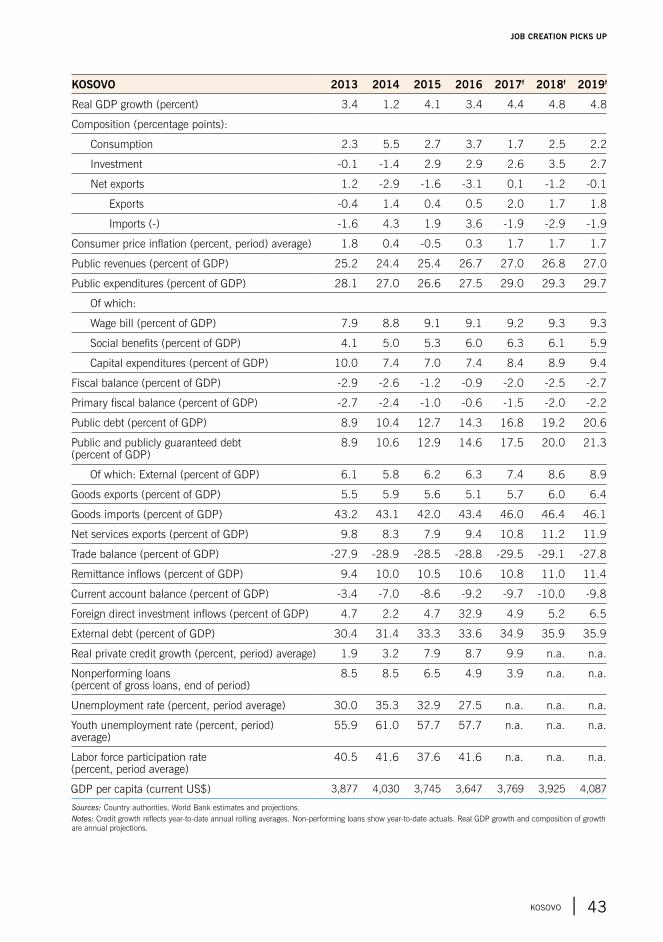
KOSOVO 2013 2014 2015 2016 2017f 2018f 2019f
Real GDP growth (percent) 3.4 1.2 4.1 3.4 4.4 4.8 4.8
Composition (percentage points):
Consumption 2.3 5.5 2.7 3.7 1.7 2.5 2.2
Investment -0.1 -1.4 2.9 2.9 2.6 3.5 2.7
Net exports 1.2 -2.9 -1.6 -3.1 0.1 -1.2 -0.1
Exports -0.4 1.4 0.4 0.5 2.0 1.7 1.8
Imports (-) -1.6 4.3 1.9 3.6 -1.9 -2.9 -1.9
Consumer price inflation (percent, period) average) 1.8 0.4 -0.5 0.3 1.7 1.7 1.7
Public revenues (percent of GDP) 25.2 24.4 25.4 26.7 27.0 26.8 27.0
Public expenditures (percent of GDP) 28.1 27.0 26.6 27.5 29.0 29.3 29.7
Of which:
Wage bill (percent of GDP) 7.9 8.8 9.1 9.1 9.2 9.3 9.3
Social benefits (percent of GDP) 4.1 5.0 5.3 6.0 6.3 6.1 5.9
Capital expenditures (percent of GDP) 10.0 7.4 7.0 7.4 8.4 8.9 9.4
Fiscal balance (percent of GDP) -2.9 -2.6 -1.2 -0.9 -2.0 -2.5 -2.7
Primary fiscal balance (percent of GDP) -2.7 -2.4 -1.0 -0.6 -1.5 -2.0 -2.2
Public debt (percent of GDP) 8.9 10.4 12.7 14.3 16.8 19.2 20.6
Public and publicly guaranteed debt (percent of GDP)
8.9 10.6 12.9 14.6 17.5 20.0 21.3
Of which: External (percent of GDP) 6.1 5.8 6.2 6.3 7.4 8.6 8.9
Goods exports (percent of GDP) 5.5 5.9 5.6 5.1 5.7 6.0 6.4
Goods imports (percent of GDP) 43.2 43.1 42.0 43.4 46.0 46.4 46.1
Net services exports (percent of GDP) 9.8 8.3 7.9 9.4 10.8 11.2 11.9
Trade balance (percent of GDP) -27.9 -28.9 -28.5 -28.8 -29.5 -29.1 -27.8
Remittance inflows (percent of GDP) 9.4 10.0 10.5 10.6 10.8 11.0 11.4
Current account balance (percent of GDP) -3.4 -7.0 -8.6 -9.2 -9.7 -10.0 -9.8
Foreign direct investment inflows (percent of GDP) 4.7 2.2 4.7 32.9 4.9 5.2 6.5
External debt (percent of GDP) 30.4 31.4 33.3 33.6 34.9 35.9 35.9
Real private credit growth (percent, period) average) 1.9 3.2 7.9 8.7 9.9 n.a. n.a.
Nonperforming loans (percent of gross loans, end of period)
8.5 8.5 6.5 4.9 3.9 n.a. n.a.
Unemployment rate (percent, period average) 30.0 35.3 32.9 27.5 n.a. n.a. n.a.
Youth unemployment rate (percent, period) average)
55.9 61.0 57.7 57.7 n.a. n.a. n.a.
Labor force participation rate (percent, period average)
40.5 41.6 37.6 41.6 n.a. n.a. n.a.
GDP per capita (current US$) 3,877 4,030 3,745 3,647 3,769 3,925 4,087
Sources: Country authorities, World Bank estimates and projections.Notes: Credit growth reflects year-to-date annual rolling averages. Non-performing loans show year-to-date actuals. Real GDP growth and composition of growth are annual projections.
KOsOvO | 43
JOB CREATION PICKS UP
Recent Economic Developments
Political turmoil has affected growth. The political crisis that began in 2015 culminated in the inauguration of a new government in June 2017. Throughout, it disrupted economic activity. GDP growth slowed from 3.8 percent in 2015 to 2.4 percent in 2016 and is expected to fall to 1.5 percent for 20173. Investment fell by 4.7 percent y-o-y in 2016 and by 9.6 percent in the first half of 2017, though it is expected to begin recovering by year-end as confidence is restored. For the past two years, private consumption has been a major contributor to growth, supported by higher employment and wages, but in 2017 the turmoil reduced its contribution. Net exports are expected to have a positive, though small, contribution to growth, supported by buoyant exports and fewer investment-related imports.
3 The State Statistic Office recently published revised GDP figures for 2015 and 2016, standing at 3.9 and 2.9 percent, respectively. Nevertheless, given that the published data set did not allow for a complete growth accounting analysis, the older figures were used for this publication.
Construction, the main driver of growth in previous years, stalled in 2017. In the first half of the year its contribution was negative as technical difficulties interrupted the construction of two highways between the Adriatic Sea (Albania) and the Black Sea (Bulgaria). Political uncertainty suppressed growth in most services and manufacturing segments in the first half of the year, but a recovery is expected in the second half as consumers and investors become more confident and the highway project problems are resolved.
Despite slower economic activity, employment continued to grow and unemployment to decline. Employment grew by 2.5 percent y-o-y in 2016 and by 2.7 percent in the first half of 2017, helped in part by fiscal stimulus through which more than 14,000 jobs were created. Most of the jobs created were in wholesale and retail trade as private consumption grew; others were created in transport services and manufacturing—sectors closely linked to FDI-supported companies, which benefit from tax exemptions and other government support. Construction
FYR Macedonia
y After a prolonged political crisis, economic growth in FYR Macedonia is projected to slow to 1.5 percent in 2017, then pick up to average 3.5 percent for 2018-19 as investment and consumption recover.
y Employment programs have helped bring unemployment to a low of 22.8 percent.
y The new government’s supplementary budget for 2017 retains the previous fiscal deficit target but factors in lower growth expectations by lowering both revenues and expenditures.
y Fostering confidence and inclusive growth will require fiscal consolidation and structural reforms to enhance the investment climate, human capital, and public sector efficiency.
WESTERN BALKANS REGULAR ECONOMIC REPORT NO.12
44 | FYR MACEdONIA
jobs declined in line with developments in the sector. The unemployment rate fell to a historic low of 22.8 percent in the first half of 2017, in part because fewer Macedonians participated in the labor force. The decline in participation may be the result of unemployed workers who were discouraged leaving the labor market, some to emigrate to other countries. Despite targeted government programs, youth unemployment is still high at 46 percent, as is long-term unemployment at 81 percent. The average wage continued the upward trend that began in 2014, driven by wage increases in labor-intensive industries.
The fiscal deficit is projected to rise to 3 percent of GDP in 2017. This year’s fiscal performance so far has followed the budget originally approved. In July the new government adopted a supplementary budget that adjusted revenues and expenditures based on more conservative growth projections but retained the deficit target in nominal terms. The new budget rebalanced expenditures: it reduced country branding and promotion, goods and services, wages and capital spending (to match expected execution), and increased spending on pensions, subsidies, social assistance, and health. Revenues from excise taxes are expected to be higher in 2017 and those from VAT slightly lower.
Public and publicly guaranteed (PPG) debt is projected to reach 48.7 percent in 2017. Over the past five years the PPG-to-GDP ratio has gone up by about 10 percentage points. In the first half of 2017 PPG debt remained stable in nominal terms but GDP declined. In the second half it is expected to again rise as guarantees associated with the highway projects increase.
Monetary policy remains accommodative. Since February 2017 the Central Bank has held the basic interest rate to a historic minimum of 3.25 percent. After a brief interruption in the second quarter of 2016 due to speculative transactions on the foreign exchange market, monetary policy normalized in the second half of 2016 and early 2017.
Annual inflation is projected at 0.9 percent; low international prices, combined with lower utility prices, had led to a deflation of 0.2 percent in 2016. A recovery in oil prices and higher prices for beverages, tobacco, and communications are expected to lead to inflation in 2017.
Credit conditions improved in 2017. Strong credit growth of 6.5 percent in 2016 masked a slowdown in corporate lending, from 7.1 percent in 2015 to 3.2 percent at yearend. The slowdown continued in the first half of 2017, but banks expect lower credit requirements and higher demand for credit to businesses in the final quarter of 2017. Household lending has been the main driver of credit growth in 2017. Though nonperforming loans have gone up slightly, reaching 6.6 percent in August, they are still lower than the regional average of about 10 percent. The loan-to-deposit ratio stood at 89 percent in August 2017, which should allow banks to expand lending activities.
The current account deficit (CAD) is projected to hold steady at 3.1 percent of GDP in 2017. The solid increase in exports was partially counterbalanced by higher dividends and profit repatriation, resulting in the CAD falling slightly to 2.1 percent of GDP in the first half of the year. It is expected to widen in the second half as imports associated with FDI and highway projects pick up. In the first
FYR MACEdONIA | 45
JOB CREATION PICKS UP
half, net FDI inflows were half the level of a year earlier, but they are expected to recover to 2.6 percent of GDP by yearend; that would finance 84 percent of the CAD. In August foreign reserves stood at 4.5 months of imports.
Outlook and Risks
The economic outlook is positive, with growth expected to reach 3.2 percent in 2018 and 3.9 percent in 2019. The main driver of growth is likely to be private consumption, fueled by rising employment, and recovering investment, as for the construction of the two highways. The fiscal deficit is expected to gradually decline to 2.2 percent by 2019 as the government launches reforms to build up tax collection, tighten spending controls, and make social spending more efficient. In the baseline scenario of gradual consolidation the PPG-to-GDP ratio is expected to rise to 55 percent by 2019, which underscores the need for strong and frontloaded structural reforms to stabilize debt in the medium term. The CAD is expected to hover around 3 percent of GDP through 2019.
With the political crisis resolved, the main risk now is the fiscal situation, which could threaten macroeconomic stability and undermine growth prospects. Pressures come from the high deficit, driven by low revenues, a growing deficit in the pension system, higher interest payments, and accumulation of arrears. A credible fiscal consolidation program will help to stabilize public debt and rebuild fiscal buffers against shocks. The new government has the opportunity to advance reforms to ensure macroeconomic stability, improve the country’s competitiveness, and promote inclusive economic growth. Among such
reforms are efforts to enhance public financial management, improve the investment climate, build human capital and skills, and expand economic opportunities for all.
WESTERN BALKANS REGULAR ECONOMIC REPORT NO.12
46 | FYR MACEdONIA
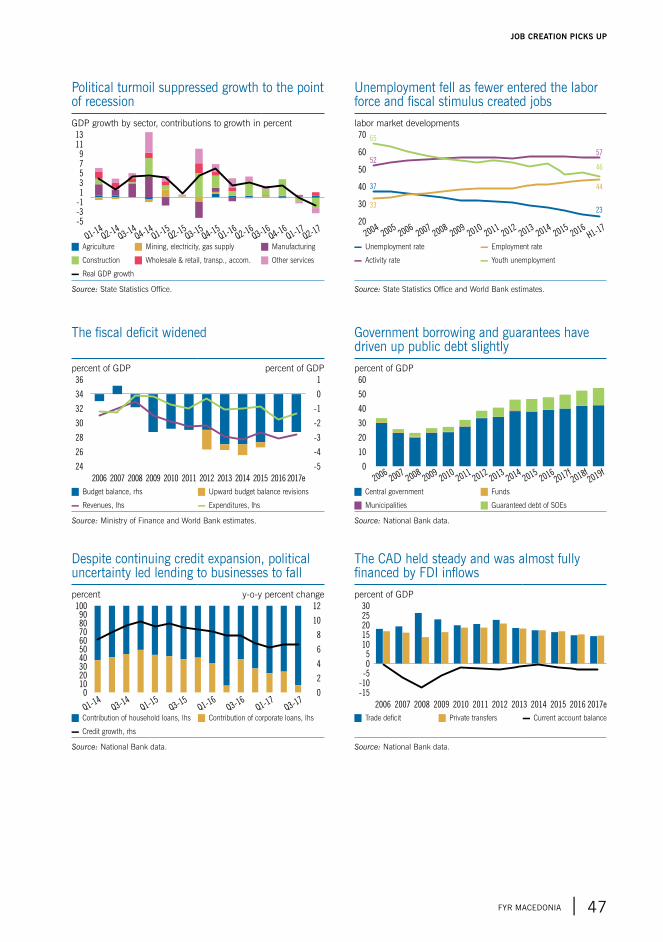
despite continuing credit expansion, political uncertainty led lending to businesses to fallpercent y-o-y percent change
0
10090807060504030
2010
0
8
6
4
2
12
10
Q1-14
Q3-14
Q1-15
Q3-15
Q1-16
Q3-16
Q1-17
Q3-17
J Contribution of household loans, lhs J Contribution of corporate loans, lhs
▬ Credit growth, rhs
Source: National Bank data.
The CAd held steady and was almost fully financed by FDI inflowspercent of GDP
-15
30
20
15
10
5
25
0
-5
-10
2008 2010 2012 20132009 2011 20152006 2007 2014 2017e2016
J Trade deficit J Private transfers ▬ Current account balance
Source: National Bank data.
Political turmoil suppressed growth to the point of recessionGDP growth by sector, contributions to growth in percent
-5
5
13
9
1
3
11
7
-1
Q1-14Q2-1
4Q3-1
4Q4-1
4Q1-1
5Q2-1
5Q3-1
5Q4-1
5Q1-1
6Q2-1
6Q3-1
6Q4-1
6Q1-1
7Q2-1
7
-3
J Agriculture J Mining, electricity, gas supply J Manufacturing
J Construction J Wholesale & retail, transp., accom. J Other services
▬ Real GDP growth
Source: State Statistics Office.
Unemployment fell as fewer entered the labor force and fiscal stimulus created jobslabor market developments
20
70
60
50
40
30
20042005
20062007
20082009
20102011
20122013
2014H1-1
72015
65
52
37
33
57
46
44
23
2016
▬ Unemployment rate ▬ Employment rate
▬ Activity rate ▬ Youth unemployment
Source: State Statistics Office and World Bank estimates.
The fiscal deficit widened
percent of GDP percent of GDP
24
36
34
32
30
28
26
-5
1
0
-1
-2
-3
-4
2008 2010 2012 20132009 20112006 2007 2014 2015 2017e2016
J Budget balance, rhs J Upward budget balance revisions
▬ Revenues, lhs ▬ Expenditures, lhs
Source: Ministry of Finance and World Bank estimates.
Government borrowing and guarantees have driven up public debt slightlypercent of GDP
20062007
20082009
20102011
20122013
20142015
20162017f
2018f2019f
0
60
40
30
20
10
50
J Central government J Funds
J Municipalities J Guaranteed debt of SOEs
Source: National Bank data.
FYR MACEdONIA | 47
JOB CREATION PICKS UP
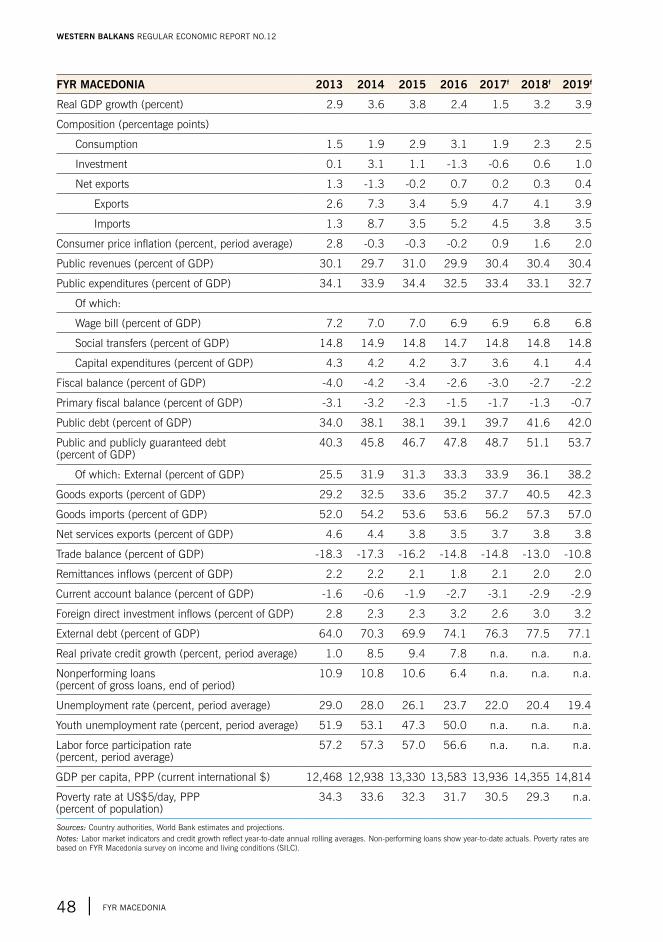
FYR MACEDONIA 2013 2014 2015 2016 2017f 2018f 2019f
Real GDP growth (percent) 2.9 3.6 3.8 2.4 1.5 3.2 3.9
Composition (percentage points)
Consumption 1.5 1.9 2.9 3.1 1.9 2.3 2.5
Investment 0.1 3.1 1.1 -1.3 -0.6 0.6 1.0
Net exports 1.3 -1.3 -0.2 0.7 0.2 0.3 0.4
Exports 2.6 7.3 3.4 5.9 4.7 4.1 3.9
Imports 1.3 8.7 3.5 5.2 4.5 3.8 3.5
Consumer price inflation (percent, period average) 2.8 -0.3 -0.3 -0.2 0.9 1.6 2.0
Public revenues (percent of GDP) 30.1 29.7 31.0 29.9 30.4 30.4 30.4
Public expenditures (percent of GDP) 34.1 33.9 34.4 32.5 33.4 33.1 32.7
Of which:
Wage bill (percent of GDP) 7.2 7.0 7.0 6.9 6.9 6.8 6.8
Social transfers (percent of GDP) 14.8 14.9 14.8 14.7 14.8 14.8 14.8
Capital expenditures (percent of GDP) 4.3 4.2 4.2 3.7 3.6 4.1 4.4
Fiscal balance (percent of GDP) -4.0 -4.2 -3.4 -2.6 -3.0 -2.7 -2.2
Primary fiscal balance (percent of GDP) -3.1 -3.2 -2.3 -1.5 -1.7 -1.3 -0.7
Public debt (percent of GDP) 34.0 38.1 38.1 39.1 39.7 41.6 42.0
Public and publicly guaranteed debt (percent of GDP)
40.3 45.8 46.7 47.8 48.7 51.1 53.7
Of which: External (percent of GDP) 25.5 31.9 31.3 33.3 33.9 36.1 38.2
Goods exports (percent of GDP) 29.2 32.5 33.6 35.2 37.7 40.5 42.3
Goods imports (percent of GDP) 52.0 54.2 53.6 53.6 56.2 57.3 57.0
Net services exports (percent of GDP) 4.6 4.4 3.8 3.5 3.7 3.8 3.8
Trade balance (percent of GDP) -18.3 -17.3 -16.2 -14.8 -14.8 -13.0 -10.8
Remittances inflows (percent of GDP) 2.2 2.2 2.1 1.8 2.1 2.0 2.0
Current account balance (percent of GDP) -1.6 -0.6 -1.9 -2.7 -3.1 -2.9 -2.9
Foreign direct investment inflows (percent of GDP) 2.8 2.3 2.3 3.2 2.6 3.0 3.2
External debt (percent of GDP) 64.0 70.3 69.9 74.1 76.3 77.5 77.1
Real private credit growth (percent, period average) 1.0 8.5 9.4 7.8 n.a. n.a. n.a.
Nonperforming loans (percent of gross loans, end of period)
10.9 10.8 10.6 6.4 n.a. n.a. n.a.
Unemployment rate (percent, period average) 29.0 28.0 26.1 23.7 22.0 20.4 19.4
Youth unemployment rate (percent, period average) 51.9 53.1 47.3 50.0 n.a. n.a. n.a.
Labor force participation rate (percent, period average)
57.2 57.3 57.0 56.6 n.a. n.a. n.a.
GDP per capita, PPP (current international $) 12,468 12,938 13,330 13,583 13,936 14,355 14,814
Poverty rate at US$5/day, PPP (percent of population)
34.3 33.6 32.3 31.7 30.5 29.3 n.a.
Sources: Country authorities, World Bank estimates and projections.Notes: Labor market indicators and credit growth reflect year-to-date annual rolling averages. Non-performing loans show year-to-date actuals. Poverty rates are based on FYR Macedonia survey on income and living conditions (SILC).
WESTERN BALKANS REGULAR ECONOMIC REPORT NO.12
48 | FYR MACEdONIA
Recent Economic Developments
Driven by domestic demand, Montenegro’s economy is projected to grow by 4.2 percent in 2017, up from 2.9 percent in 2016. Growth picked up in the first half of 2017 to 4.2 percent; household consumption, supported by social benefits and wage growth, contributed 5.1 percentage points (pp) of GDP. Investment also grew, contributing another 1.4 pp as residential construction and work on the Bar-Boljare highway brought a 23 percent increase in investment. Government consumption also contributed 0.6 pp to growth, led by a rise in public sector wages. However, changes in inventories subtracted 1.8 pp from GDP growth and net exports subtracted 1.2 pp due to an investment-related rise in imports of equipment and materials for the highway and for windmill projects. Meanwhile, a favorable tourism season built up disposable incomes, driving growth in residential construction and retail. Tourist overnight stays had increased 9 percent by August 2017, while retail trade grew by 5 percent in the first half of the year. But, industrial production continued to contract: growth in the mining sector was not
enough to offset steep declines in energy and manufacturing.
Although growth created jobs, disincentives to labor force participation affected labor market. Participation stagnated in 2016, partly because introduction of lifetime benefits for mothers with three or more children caused a significant number of women to withdraw from employment. However, as tourism improved, the trend reversed, and by August 2017 employment growth had picked up by 3.6 percent (from 1.3 percent in 2016). As of June 2017, the survey-based unemployment rate had declined by 1 pp to 16.7 percent (on a four-quarter basis), and employment rate had grown slightly, to 45.5 percent. Large employment programs helped to bring down youth unemployment, although it remains high at 33.5 percent, and long-term unemployment grew to 77 percent (on a four-quarter basis). These trends are likely to improve, since the mothers’ benefit was abolished in June 2017 by a Constitutional Court finding that the benefit was unconstitutional.
Montenegro
y The Montenegrin economy is expected to grow by 4.2 percent in 2017, supported by robust household consumption, a surge in investment led by construction of the Bar-Boljare highway, and a favorable tourism season.
y Growth created jobs but the labor market improvements were partially offset by a withdrawal of women from the labor force.
y The government adopted an ambitious fiscal consolidation strategy designed to stabilize public debt by 2019.
y Credible fiscal consolidation, mitigation of adverse social impacts, and structural reforms to make the economy more competitive are critical for fostering confidence and growth.
MONTENEGRO | 49
JOB CREATION PICKS UP
Although public finances improved temporarily in 2016, some expansionary measures heightened fiscal pressures in 2017. The general government deficit fell from 7.3 percent of GDP in 2015 to 3.1 percent in 2016, mostly because capital spending for the highway was under-executed. Improved tax collection brought in more revenue, but not enough to compensate for the 10 percent rise in public wages, the mothers’ lifetime benefit, a 3 percent rise in pensions, and a 20-percent rise in minimum pensions ahead of general elections in October.
The government elected in November 2016, has adopted an ambitious fiscal consolidation strategy to rein in fiscal risks. Together with the budget for 2017, in December 2016 the new government adopted fiscal consolidation measures amounting to 3.2 percent of GDP, among them a rise in excise taxes and a reduction in VAT exemptions, collection of tax arrears, a 25 percent reduction of the mothers’ benefit, an 8 percent reduction in the wages of officials, a freeze of seniority bonuses payment until 2019, and selective cuts in capital expenditures. In June 2017, Parliament adopted a new Fiscal Strategy and related legislative changes, which saved another 3 pp of GDP, in part by raising the VAT rate from 19 to 21 percent; increasing excises on tobacco, sugary drinks, alcohol, and coal; and reducing the wages of public officials, along with the abolition of the mother’s benefit. The measures adopted so far are designed to reduce the deficit from 6 percent of GDP (which was expected in the absence of the Fiscal Strategy) to 4 percent by yearend. By July 2017, revenues had increased by 9 percent, led by improved collection of VAT and excises. Spending measures are yet to bring savings; by July overall spending was up 7 percent, mostly due to earlier increases in
wages and capital expenditures related to the highway construction. Public debt (including guarantees) is expected to rise to 76.1 percent of GDP by yearend, driven by the highway-related loan.
Inflationary pressures have risen. Spillovers from international oil and food prices and higher excises on oil and tobacco turned the 2016 deflation into 2.4 percent y-o-y inflation by September 2017. With excises and VAT rates rising starting in 2018, inflationary pressures are likely to be sustained.
Heightened lending activity supported a decline in nonperforming loans (NPLs). Overall credit had grown by 7.7 percent y-o-y in August 2017 as household lending rose nearly 10 percent for the eighth month in a row. The Central Bank reduced the reserve requirement from 9.5 to 7.5 percent in March 2017; this gave banks additional liquidity for lending to the government, which had grown close to 58 percent by August. Deposits, the main bank funding strategy, also grew (10.9 percent y-o-y). Supported by credit growth and resolution efforts, NPLs fell from 10.3 percent at end-2016 to below 8 percent in September 2017. However, that is still above the pre-crisis level and the authorities have again extended the voluntary restructuring act and enabled its effective implementation.
External imbalances remain high. After widening in 2016 to 18.1 percent of GDP, the current account deficit (CAD) improved slightly in the first half of 2017 to 16.1 percent even as imports of goods increased by 8 percent, led by the high import-dependence of infrastructure projects and tourism. Meanwhile exports, led by steel and aluminum, surged by 7 percent. The largest contribution to CAD moderation
WESTERN BALKANS REGULAR ECONOMIC REPORT NO.12
50 | MONTENEGRO
came from exports of services, mostly tourism, which went up over 20 percent in the first half of the 2017, and from surpluses in the income accounts. Net FDI increased to 10.3 percent of GDP by June, financing two-thirds of the CAD. The 2017 CAD is projected at 18.6 percent of GDP; FDI is expected to slightly improve to 11.4 percent of GDP and hold at similar levels in 2018–19.
Outlook and Risks
The positive economic outlook is vulnerable to risks. The economy is expected to grow by an average of 2.7 percent in 2018–19, thanks to higher public investments and household consumption. While investment growth will slow as the highway is completed, its contribution to growth will stay strong throughout the projection period. External imbalances are projected to remain high because the current growth pattern is import-dependent.
A goal of the medium-term fiscal framework is to put debt and the public deficit on a sustainable trajectory. The fiscal position is projected to be in balance by 2019. Recent fiscal decisions are expected to stabilize public debt by 2019 and reduce the country’s vulnerability to external shocks. Compliance with the fiscal rule is expected by 2022.
Decisive fiscal consolidation and mitigation of its social impacts are essential to confidence and growth. With public debt growing, space must be created for 2019-20 for orderly servicing of the large refinancing needs (more than 12 percent of GDP). Reducing the deficit, though difficult, is urgent in order to reassure markets and successfully roll over current
obligations. Recent measures have already brought an upgrade in the S&P and Moody’s outlook rating, from negative to stable, at the current non-investment credit rating. Structural reforms to accelerate private sector growth and reduce unemployment, especially for women and youth, and mitigate the short-term poverty and social impacts of fiscal consolidation are needed to support inclusive growth.
MONTENEGRO | 51
JOB CREATION PICKS UP
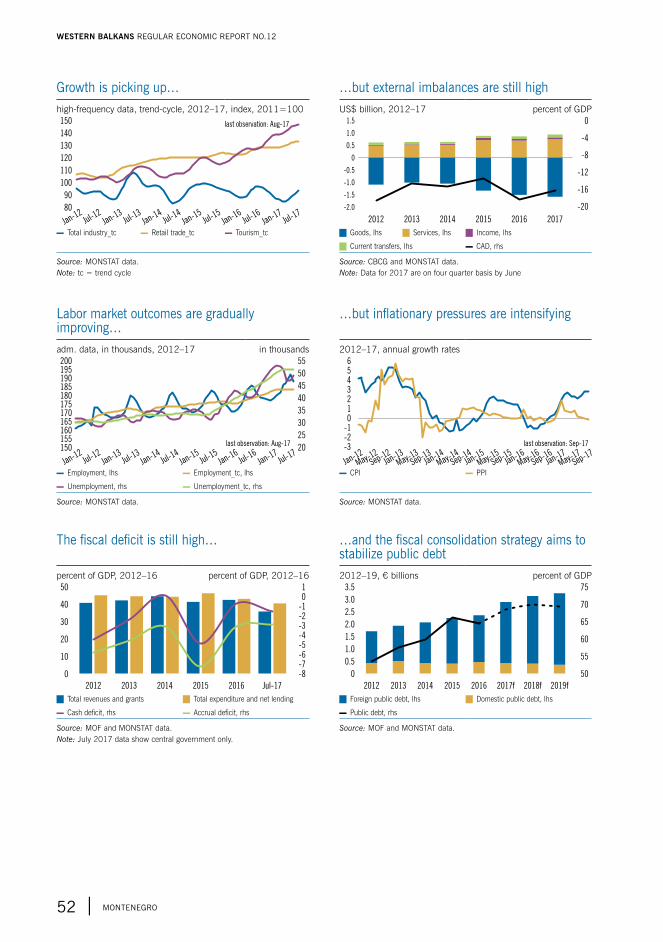
The fiscal deficit is still high…
percent of GDP, 2012–16 percent of GDP, 2012–16
-8
50
40
30
20
10
0
1
0
-1
-2
-3
-4
-5
-6
-7
2012 2013 2014 2015 Jul-172016
J Total revenues and grants J Total expenditure and net lending
▬ Cash deficit, rhs ▬ Accrual deficit, rhs
Source: MOF and MONSTAT data.Note: July 2017 data show central government only.
…and the fiscal consolidation strategy aims to stabilize public debt2012–19, € billions percent of GDP
0
3.5
2.5
2.0
1.5
1.0
0.5
50
75
70
65
60
55
2012 2013 2014 2015
3.0
2016 2017f 2018f 2019f
J Foreign public debt, lhs J Domestic public debt, lhs
▬ Public debt, rhs
Source: MOF and MONSTAT data.
Growth is picking up…high-frequency data, trend-cycle, 2012–17, index, 2011=100
80
150
140
130
120
110
100
90
last observation: Aug-17
Jan-12
Jan-13
Jan-14
Jan-15
Jan-16
Jul-12
Jul-13
Jul-14
Jul-15
Jul-16
Jul-17
Jan-17
▬ Total industry_tc ▬ Retail trade_tc ▬ Tourism_tc
Source: MONSTAT data.Note: tc = trend cycle
…but external imbalances are still highUS$ billion, 2012–17 percent of GDP
1.5
1.0
0.5
0
-0.5
-1.0
-1.5
-2.0
0
-4
-8
-12
-16
-20
2012 2013 2014 2015 20172016
J Goods, lhs J Services, lhs J Income, lhs
J Current transfers, lhs ▬ CAD, rhs
Source: CBCG and MONSTAT data.Note: Data for 2017 are on four quarter basis by June
Labor market outcomes are gradually improving…adm. data, in thousands, 2012–17 in thousands
150
200 55
50
45
40
35
30
25
20
195190185180175170165160155
Jan-12
Jan-13
Jan-14
Jan-15
Jan-16
Jul-12
Jul-13
Jul-14
Jul-15
Jul-16
Jul-17
last observation: Aug-17
Jan-17
▬ Employment, lhs ▬ Employment_tc, lhs
▬ Unemployment, rhs ▬ Unemployment_tc, rhs
Source: MONSTAT data.
…but inflationary pressures are intensifying
2012–17, annual growth rates6
5
4
3
2
1
0
-1
-2
-3
Jan-12
May-12
Sep-12Jan-1
3Jan-1
4Jan-1
5Jan-1
6
May-13
May-14
May-15
May-16
Sep-13
Sep-14
Sep-15
Sep-16Jan-1
7
May-17
Sep-17
last observation: Sep-17
▬ CPI ▬ PPI
Source: MONSTAT data.
WESTERN BALKANS REGULAR ECONOMIC REPORT NO.12
52 | MONTENEGRO
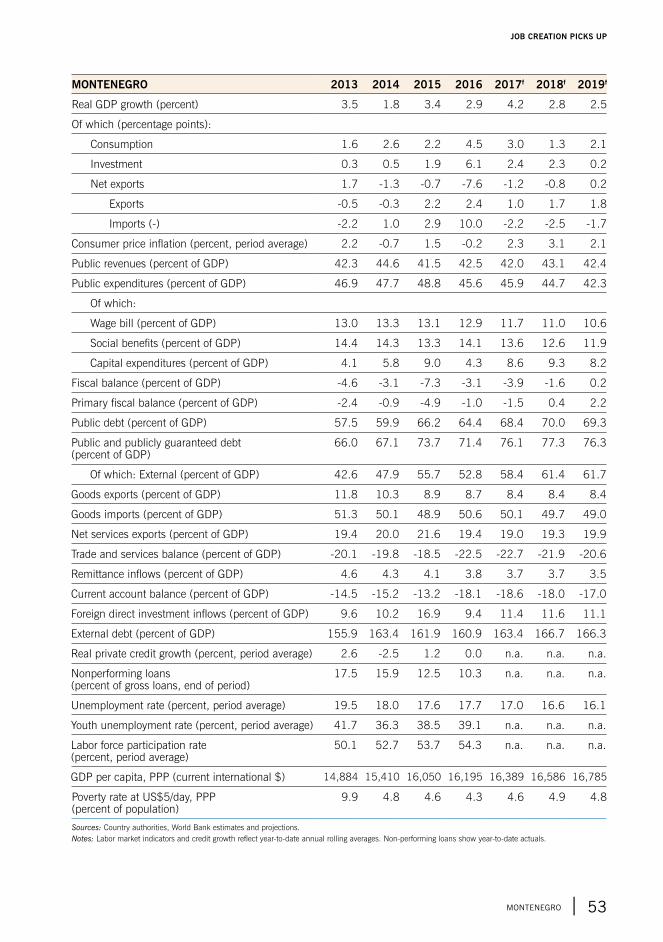
MONTENEGRO 2013 2014 2015 2016 2017f 2018f 2019f
Real GDP growth (percent) 3.5 1.8 3.4 2.9 4.2 2.8 2.5
Of which (percentage points):
Consumption 1.6 2.6 2.2 4.5 3.0 1.3 2.1
Investment 0.3 0.5 1.9 6.1 2.4 2.3 0.2
Net exports 1.7 -1.3 -0.7 -7.6 -1.2 -0.8 0.2
Exports -0.5 -0.3 2.2 2.4 1.0 1.7 1.8
Imports (-) -2.2 1.0 2.9 10.0 -2.2 -2.5 -1.7
Consumer price inflation (percent, period average) 2.2 -0.7 1.5 -0.2 2.3 3.1 2.1
Public revenues (percent of GDP) 42.3 44.6 41.5 42.5 42.0 43.1 42.4
Public expenditures (percent of GDP) 46.9 47.7 48.8 45.6 45.9 44.7 42.3
Of which:
Wage bill (percent of GDP) 13.0 13.3 13.1 12.9 11.7 11.0 10.6
Social benefits (percent of GDP) 14.4 14.3 13.3 14.1 13.6 12.6 11.9
Capital expenditures (percent of GDP) 4.1 5.8 9.0 4.3 8.6 9.3 8.2
Fiscal balance (percent of GDP) -4.6 -3.1 -7.3 -3.1 -3.9 -1.6 0.2
Primary fiscal balance (percent of GDP) -2.4 -0.9 -4.9 -1.0 -1.5 0.4 2.2
Public debt (percent of GDP) 57.5 59.9 66.2 64.4 68.4 70.0 69.3
Public and publicly guaranteed debt (percent of GDP)
66.0 67.1 73.7 71.4 76.1 77.3 76.3
Of which: External (percent of GDP) 42.6 47.9 55.7 52.8 58.4 61.4 61.7
Goods exports (percent of GDP) 11.8 10.3 8.9 8.7 8.4 8.4 8.4
Goods imports (percent of GDP) 51.3 50.1 48.9 50.6 50.1 49.7 49.0
Net services exports (percent of GDP) 19.4 20.0 21.6 19.4 19.0 19.3 19.9
Trade and services balance (percent of GDP) -20.1 -19.8 -18.5 -22.5 -22.7 -21.9 -20.6
Remittance inflows (percent of GDP) 4.6 4.3 4.1 3.8 3.7 3.7 3.5
Current account balance (percent of GDP) -14.5 -15.2 -13.2 -18.1 -18.6 -18.0 -17.0
Foreign direct investment inflows (percent of GDP) 9.6 10.2 16.9 9.4 11.4 11.6 11.1
External debt (percent of GDP) 155.9 163.4 161.9 160.9 163.4 166.7 166.3
Real private credit growth (percent, period average) 2.6 -2.5 1.2 0.0 n.a. n.a. n.a.
Nonperforming loans (percent of gross loans, end of period)
17.5 15.9 12.5 10.3 n.a. n.a. n.a.
Unemployment rate (percent, period average) 19.5 18.0 17.6 17.7 17.0 16.6 16.1
Youth unemployment rate (percent, period average) 41.7 36.3 38.5 39.1 n.a. n.a. n.a.
Labor force participation rate (percent, period average)
50.1 52.7 53.7 54.3 n.a. n.a. n.a.
GDP per capita, PPP (current international $) 14,884 15,410 16,050 16,195 16,389 16,586 16,785
Poverty rate at US$5/day, PPP (percent of population)
9.9 4.8 4.6 4.3 4.6 4.9 4.8
Sources: Country authorities, World Bank estimates and projections.Notes: Labor market indicators and credit growth reflect year-to-date annual rolling averages. Non-performing loans show year-to-date actuals.
MONTENEGRO | 53
JOB CREATION PICKS UP
Recent Economic Developments
The estimate for 2017 growth has now been dropped from 3 to 2 percent. Although growth of 2.8 percent in 2016 was broad-based, economic growth has since slowed substantially. Severe and protracted winter weather weighed heavily on energy4 and construction, and a recent drought caused agricultural output to plunge to an estimated 10 percent less than in 2016. Private and even more public investment fell, contributing only one-third as much to growth in 2017 as in 2016. Moreover, as rigid demand for intermediate goods and energy resulted in growth of imports, they overwhelmed output growth.
Nevertheless, employment rose5 by 4.3 percent in the second quarter of 2017, compared to the same quarter of 2016, pushing up the employment rate to a record high of 48.1 percent. However, nearly a quarter of all jobs are informal and thus not registered with social insurance institutions. Unemployment fell to
4 Production of electricity in particular.5 Labor Force Survey (LFS), second quarter of 2017.
11.8 percent in the second quarter, the lowest level since 1997. Equally important, youth unemployment dropped from 36.1 percent a year ago to 28.9 percent. The gradual recovery in wages that began in 2016 has continued: average wages increased by 1 percent in real terms (y-o-y) in the first half of 2017. Private sector wages recovered faster, at 4.9 percent y-o-y, but at 3.4 percent growth, wages in the public sector are catching up.
The budget will be balanced or in a small surplus. Continued higher revenues, spending controls, and under-execution of the public investment program led to a 1.8 percent annualized GDP surplus through August. Revenues were up 7.1 percent (y-o-y in nominal terms) and expenditures increased by only 1.2 percent. Revenues were up primarily because of higher proceeds from the VAT on imports; corporate income tax and social contributions also grew along with formal employment. Spending was similar to last year’s in all categories, except for purchases of goods and services (which includes hiring of new employees on short-term contracts) and on-lending to SOEs. However, the 13 percent
Serbia
y Severe weather conditions and lower investment have slowed economic growth in 2017; the growth projection for the year has therefore dropped from 3 to 2 percent.
y In the first eight months fiscal consolidation continued and government overshot its deficit target, producing a surplus of 1.8 percent of annual GDP.
y Reform priorities include continuation of SOE reforms, particularly privatization of large chemical and pharmaceutical companies, and restructuring state energy and transport utilities.
y The main concerns now are the sustainability of fiscal consolidation and widening external imbalance.
WESTERN BALKANS REGULAR ECONOMIC REPORT NO.12
54 | sERBIA
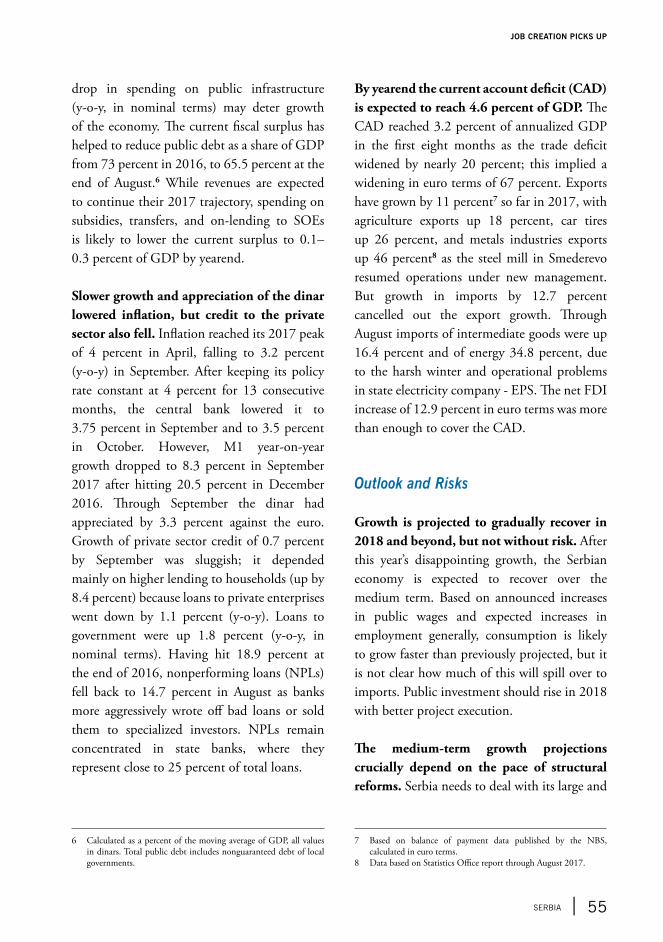
drop in spending on public infrastructure (y-o-y, in nominal terms) may deter growth of the economy. The current fiscal surplus has helped to reduce public debt as a share of GDP from 73 percent in 2016, to 65.5 percent at the end of August.6 While revenues are expected to continue their 2017 trajectory, spending on subsidies, transfers, and on-lending to SOEs is likely to lower the current surplus to 0.1–0.3 percent of GDP by yearend.
Slower growth and appreciation of the dinar lowered inflation, but credit to the private sector also fell. Inflation reached its 2017 peak of 4 percent in April, falling to 3.2 percent (y-o-y) in September. After keeping its policy rate constant at 4 percent for 13 consecutive months, the central bank lowered it to 3.75 percent in September and to 3.5 percent in October. However, M1 year-on-year growth dropped to 8.3 percent in September 2017 after hitting 20.5 percent in December 2016. Through September the dinar had appreciated by 3.3 percent against the euro. Growth of private sector credit of 0.7 percent by September was sluggish; it depended mainly on higher lending to households (up by 8.4 percent) because loans to private enterprises went down by 1.1 percent (y-o-y). Loans to government were up 1.8 percent (y-o-y, in nominal terms). Having hit 18.9 percent at the end of 2016, nonperforming loans (NPLs) fell back to 14.7 percent in August as banks more aggressively wrote off bad loans or sold them to specialized investors. NPLs remain concentrated in state banks, where they represent close to 25 percent of total loans.
6 Calculated as a percent of the moving average of GDP, all values in dinars. Total public debt includes nonguaranteed debt of local governments.
By yearend the current account deficit (CAD) is expected to reach 4.6 percent of GDP. The CAD reached 3.2 percent of annualized GDP in the first eight months as the trade deficit widened by nearly 20 percent; this implied a widening in euro terms of 67 percent. Exports have grown by 11 percent7 so far in 2017, with agriculture exports up 18 percent, car tires up 26 percent, and metals industries exports up 46 percent8 as the steel mill in Smederevo resumed operations under new management. But growth in imports by 12.7 percent cancelled out the export growth. Through August imports of intermediate goods were up 16.4 percent and of energy 34.8 percent, due to the harsh winter and operational problems in state electricity company - EPS. The net FDI increase of 12.9 percent in euro terms was more than enough to cover the CAD.
Outlook and Risks
Growth is projected to gradually recover in 2018 and beyond, but not without risk. After this year’s disappointing growth, the Serbian economy is expected to recover over the medium term. Based on announced increases in public wages and expected increases in employment generally, consumption is likely to grow faster than previously projected, but it is not clear how much of this will spill over to imports. Public investment should rise in 2018 with better project execution.
The medium-term growth projections crucially depend on the pace of structural reforms. Serbia needs to deal with its large and
7 Based on balance of payment data published by the NBS, calculated in euro terms.
8 Data based on Statistics Office report through August 2017.
sERBIA | 55
JOB CREATION PICKS UP
unsustainable state-owned enterprises (SOEs). Besides utilities, the government has a stake in more than 600 companies, some of which have required massive financial support (of about 1 percent of GDP each year). Finalizing this section of the transition from a planned to a market economy would lower fiscal pressures, reduce crowding-out, and increase competition. Given the potential fiscal impact and sector-specific rationale for government ownership, priority for attention should be several large chemical SOEs. Speeding up the restructuring of the state-owned utility companies, most of which are in the energy sector, would not only bring significant financial savings but would also ensure a more reliable electricity supply, which is one of the key components of growth (as demonstrated in 2017).
Gradual widening of the CAD is possible over the medium term. While exports are likely to increase (based on recent foreign investment in the real sector and with the services sectors gaining importance) to reach about 55 percent of GDP, consumption growth is likely to stimulate imports. Because the primary balance is likely to deteriorate as foreign companies transfer net income back home, more external financing will be required, which will push up external debt.
Inflation is set to pick up gradually as domestic demand recovers, though it is expected to stay within the NBS target band. Monetary policy will continue to operate within an inflation targeting framework, supported by a flexible exchange rate.
The main risks to the baseline scenario stem from a possible fiscal loosening and a widening of external imbalances. The current IMF program expires early in 2018 and the
medium-term fiscal framework is not yet clear. Recent increases in wages, substantial subsidies to SOEs, and delays in reforming the public wage system are exerting more pressure on fiscal stability, and near-term external financing needs will put upward pressure on external debt.
WESTERN BALKANS REGULAR ECONOMIC REPORT NO.12
56 | sERBIA
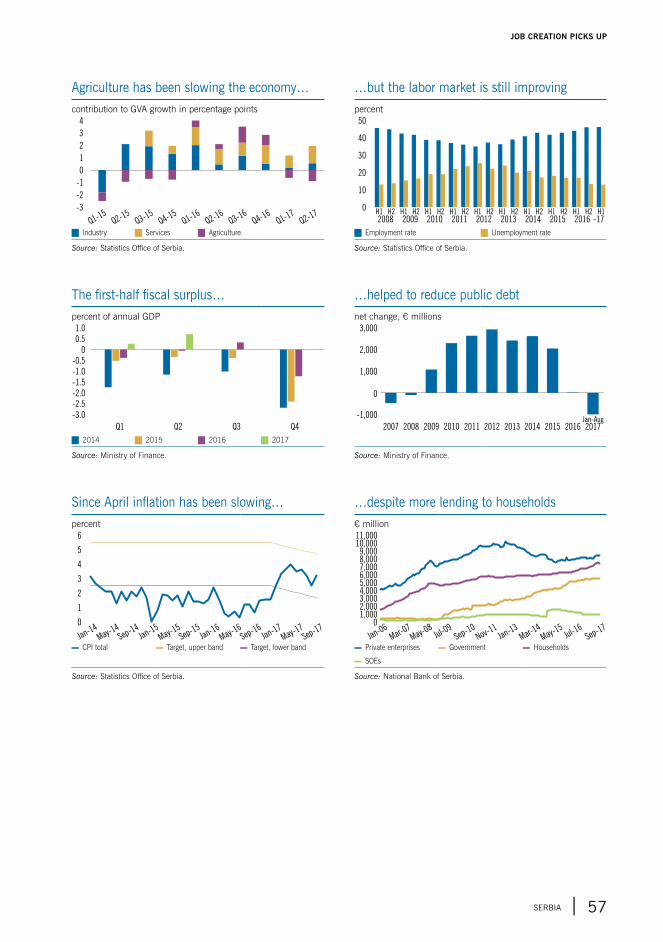
Agriculture has been slowing the economy…contribution to GVA growth in percentage points
-3
4
3
2
1
0
-1
-2
Q1-15
Q3-15
Q1-16
Q-1
52 Q
-15
4 Q-12
6Q3-1
6Q4-1
6Q1-1
7Q
-17
2
J Industry J Services J Agriculture
Source: Statistics Office of Serbia.
…but the labor market is still improvingpercent
0
50
40
30
20
10
2010 2012 20132008 2011 2014H1 H2 H1 H1 H1 H1 H1 H1H2 H2 H2 H2 H2
2015H2 H1 H2
2016H1 H2
2009H1
-17
J Employment rate J Unemployment rate
Source: Statistics Office of Serbia.
The first-half fiscal surplus…percent of annual GDP
-3.0
1.0
0.5
0
-0.5
-1.0
-1.5
-2.0
-2.5
Q1 Q2 Q3 Q4
J 2014 J 2015 J 2016 J 2017
Source: Ministry of Finance.
…helped to reduce public debtnet change, € millions
-1,000
3,000
2,000
1,000
0
2010 2012 20132007 2011 2014 2015Jan-Aug
20172009 20162008
Source: Ministry of Finance.
Since April inflation has been slowing…percent
0
6
5
4
3
2
1
Jan-14
Jan-15
Jan-16
May-14
May-15
May-16
Sep-14
Sep-15
Sep-16
Jan-17
May-17
Sep-17
▬ CPI total ▬ Target, upper band ▬ Target, lower band
Source: Statistics Office of Serbia.
…despite more lending to households€ million11,00010,000
9,0008,0007,0006,0005,0004,0003,0002,0001,000
0
Jan-06
Mar-07
May-08
Jul-09
Sep-10
Nov-11
Jan-13
Mar-14
May-15
Jul-16
Sep-17
▬ Private enterprises ▬ Government ▬ Households
▬ SOEs
Source: National Bank of Serbia.
sERBIA | 57
JOB CREATION PICKS UP
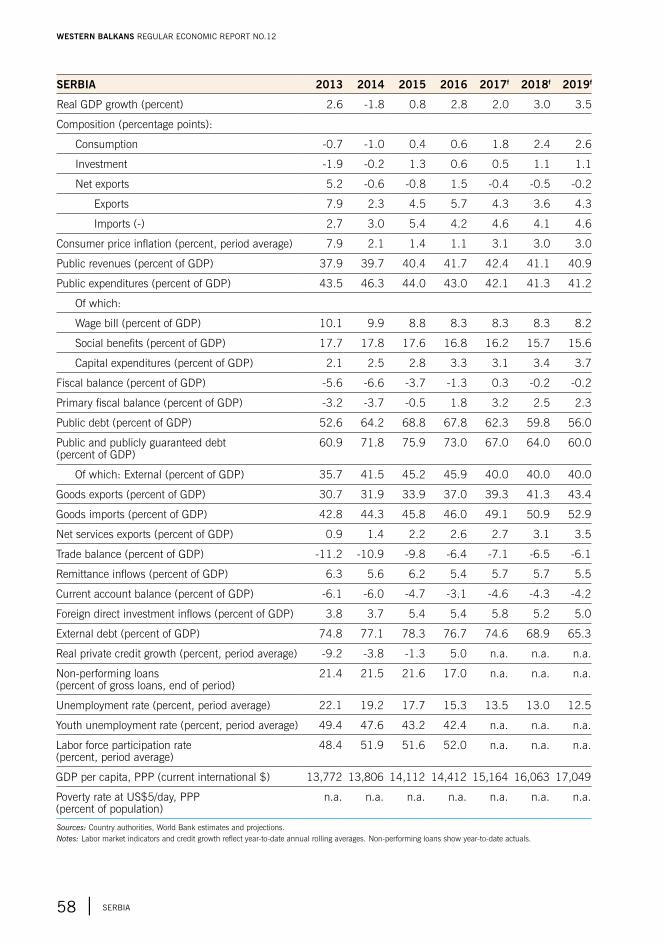
SERBIA 2013 2014 2015 2016 2017f 2018f 2019f
Real GDP growth (percent) 2.6 -1.8 0.8 2.8 2.0 3.0 3.5
Composition (percentage points):
Consumption -0.7 -1.0 0.4 0.6 1.8 2.4 2.6
Investment -1.9 -0.2 1.3 0.6 0.5 1.1 1.1
Net exports 5.2 -0.6 -0.8 1.5 -0.4 -0.5 -0.2
Exports 7.9 2.3 4.5 5.7 4.3 3.6 4.3
Imports (-) 2.7 3.0 5.4 4.2 4.6 4.1 4.6
Consumer price inflation (percent, period average) 7.9 2.1 1.4 1.1 3.1 3.0 3.0
Public revenues (percent of GDP) 37.9 39.7 40.4 41.7 42.4 41.1 40.9
Public expenditures (percent of GDP) 43.5 46.3 44.0 43.0 42.1 41.3 41.2
Of which:
Wage bill (percent of GDP) 10.1 9.9 8.8 8.3 8.3 8.3 8.2
Social benefits (percent of GDP) 17.7 17.8 17.6 16.8 16.2 15.7 15.6
Capital expenditures (percent of GDP) 2.1 2.5 2.8 3.3 3.1 3.4 3.7
Fiscal balance (percent of GDP) -5.6 -6.6 -3.7 -1.3 0.3 -0.2 -0.2
Primary fiscal balance (percent of GDP) -3.2 -3.7 -0.5 1.8 3.2 2.5 2.3
Public debt (percent of GDP) 52.6 64.2 68.8 67.8 62.3 59.8 56.0
Public and publicly guaranteed debt (percent of GDP)
60.9 71.8 75.9 73.0 67.0 64.0 60.0
Of which: External (percent of GDP) 35.7 41.5 45.2 45.9 40.0 40.0 40.0
Goods exports (percent of GDP) 30.7 31.9 33.9 37.0 39.3 41.3 43.4
Goods imports (percent of GDP) 42.8 44.3 45.8 46.0 49.1 50.9 52.9
Net services exports (percent of GDP) 0.9 1.4 2.2 2.6 2.7 3.1 3.5
Trade balance (percent of GDP) -11.2 -10.9 -9.8 -6.4 -7.1 -6.5 -6.1
Remittance inflows (percent of GDP) 6.3 5.6 6.2 5.4 5.7 5.7 5.5
Current account balance (percent of GDP) -6.1 -6.0 -4.7 -3.1 -4.6 -4.3 -4.2
Foreign direct investment inflows (percent of GDP) 3.8 3.7 5.4 5.4 5.8 5.2 5.0
External debt (percent of GDP) 74.8 77.1 78.3 76.7 74.6 68.9 65.3
Real private credit growth (percent, period average) -9.2 -3.8 -1.3 5.0 n.a. n.a. n.a.
Non-performing loans (percent of gross loans, end of period)
21.4 21.5 21.6 17.0 n.a. n.a. n.a.
Unemployment rate (percent, period average) 22.1 19.2 17.7 15.3 13.5 13.0 12.5
Youth unemployment rate (percent, period average) 49.4 47.6 43.2 42.4 n.a. n.a. n.a.
Labor force participation rate (percent, period average)
48.4 51.9 51.6 52.0 n.a. n.a. n.a.
GDP per capita, PPP (current international $) 13,772 13,806 14,112 14,412 15,164 16,063 17,049
Poverty rate at US$5/day, PPP (percent of population)
n.a. n.a. n.a. n.a. n.a. n.a. n.a.
Sources: Country authorities, World Bank estimates and projections.Notes: Labor market indicators and credit growth reflect year-to-date annual rolling averages. Non-performing loans show year-to-date actuals.
WESTERN BALKANS REGULAR ECONOMIC REPORT NO.12
58 | sERBIA

Key Economic Indicators

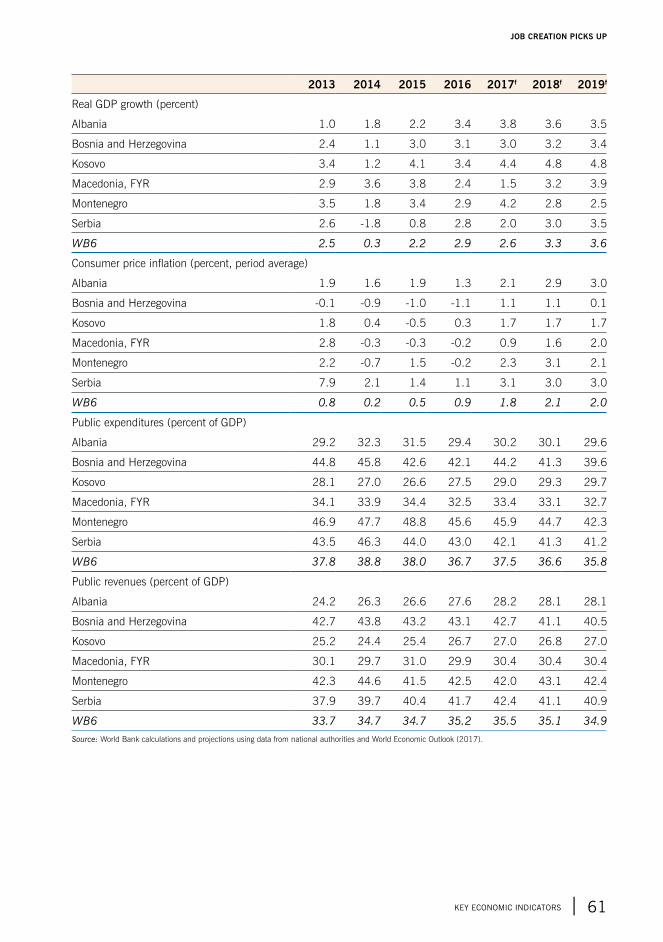
2013 2014 2015 2016 2017f 2018f 2019f
Real GDP growth (percent)
Albania 1.0 1.8 2.2 3.4 3.8 3.6 3.5
Bosnia and Herzegovina 2.4 1.1 3.0 3.1 3.0 3.2 3.4
Kosovo 3.4 1.2 4.1 3.4 4.4 4.8 4.8
Macedonia, FYR 2.9 3.6 3.8 2.4 1.5 3.2 3.9
Montenegro 3.5 1.8 3.4 2.9 4.2 2.8 2.5
Serbia 2.6 -1.8 0.8 2.8 2.0 3.0 3.5
WB6 2.5 0.3 2.2 2.9 2.6 3.3 3.6
Consumer price inflation (percent, period average)
Albania 1.9 1.6 1.9 1.3 2.1 2.9 3.0
Bosnia and Herzegovina -0.1 -0.9 -1.0 -1.1 1.1 1.1 0.1
Kosovo 1.8 0.4 -0.5 0.3 1.7 1.7 1.7
Macedonia, FYR 2.8 -0.3 -0.3 -0.2 0.9 1.6 2.0
Montenegro 2.2 -0.7 1.5 -0.2 2.3 3.1 2.1
Serbia 7.9 2.1 1.4 1.1 3.1 3.0 3.0
WB6 0.8 0.2 0.5 0.9 1.8 2.1 2.0
Public expenditures (percent of GDP)
Albania 29.2 32.3 31.5 29.4 30.2 30.1 29.6
Bosnia and Herzegovina 44.8 45.8 42.6 42.1 44.2 41.3 39.6
Kosovo 28.1 27.0 26.6 27.5 29.0 29.3 29.7
Macedonia, FYR 34.1 33.9 34.4 32.5 33.4 33.1 32.7
Montenegro 46.9 47.7 48.8 45.6 45.9 44.7 42.3
Serbia 43.5 46.3 44.0 43.0 42.1 41.3 41.2
WB6 37.8 38.8 38.0 36.7 37.5 36.6 35.8
Public revenues (percent of GDP)
Albania 24.2 26.3 26.6 27.6 28.2 28.1 28.1
Bosnia and Herzegovina 42.7 43.8 43.2 43.1 42.7 41.1 40.5
Kosovo 25.2 24.4 25.4 26.7 27.0 26.8 27.0
Macedonia, FYR 30.1 29.7 31.0 29.9 30.4 30.4 30.4
Montenegro 42.3 44.6 41.5 42.5 42.0 43.1 42.4
Serbia 37.9 39.7 40.4 41.7 42.4 41.1 40.9
WB6 33.7 34.7 34.7 35.2 35.5 35.1 34.9
Source: World Bank calculations and projections using data from national authorities and World Economic Outlook (2017).
KEY ECONOMIC INdICATORs | 61
JOB CREATION PICKS UP
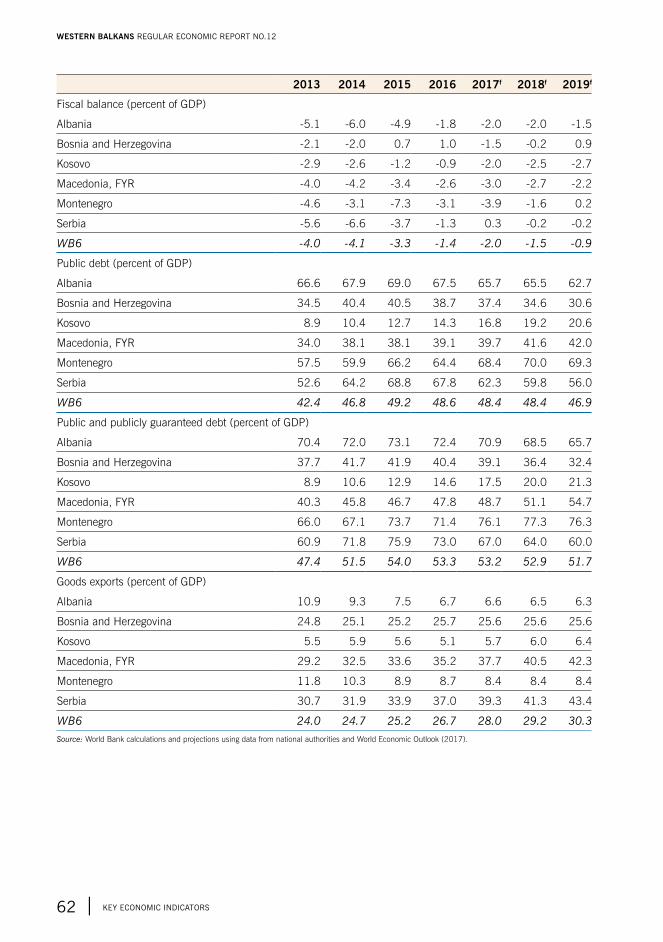
2013 2014 2015 2016 2017f 2018f 2019f
Fiscal balance (percent of GDP)
Albania -5.1 -6.0 -4.9 -1.8 -2.0 -2.0 -1.5
Bosnia and Herzegovina -2.1 -2.0 0.7 1.0 -1.5 -0.2 0.9
Kosovo -2.9 -2.6 -1.2 -0.9 -2.0 -2.5 -2.7
Macedonia, FYR -4.0 -4.2 -3.4 -2.6 -3.0 -2.7 -2.2
Montenegro -4.6 -3.1 -7.3 -3.1 -3.9 -1.6 0.2
Serbia -5.6 -6.6 -3.7 -1.3 0.3 -0.2 -0.2
WB6 -4.0 -4.1 -3.3 -1.4 -2.0 -1.5 -0.9
Public debt (percent of GDP)
Albania 66.6 67.9 69.0 67.5 65.7 65.5 62.7
Bosnia and Herzegovina 34.5 40.4 40.5 38.7 37.4 34.6 30.6
Kosovo 8.9 10.4 12.7 14.3 16.8 19.2 20.6
Macedonia, FYR 34.0 38.1 38.1 39.1 39.7 41.6 42.0
Montenegro 57.5 59.9 66.2 64.4 68.4 70.0 69.3
Serbia 52.6 64.2 68.8 67.8 62.3 59.8 56.0
WB6 42.4 46.8 49.2 48.6 48.4 48.4 46.9
Public and publicly guaranteed debt (percent of GDP)
Albania 70.4 72.0 73.1 72.4 70.9 68.5 65.7
Bosnia and Herzegovina 37.7 41.7 41.9 40.4 39.1 36.4 32.4
Kosovo 8.9 10.6 12.9 14.6 17.5 20.0 21.3
Macedonia, FYR 40.3 45.8 46.7 47.8 48.7 51.1 54.7
Montenegro 66.0 67.1 73.7 71.4 76.1 77.3 76.3
Serbia 60.9 71.8 75.9 73.0 67.0 64.0 60.0
WB6 47.4 51.5 54.0 53.3 53.2 52.9 51.7
Goods exports (percent of GDP)
Albania 10.9 9.3 7.5 6.7 6.6 6.5 6.3
Bosnia and Herzegovina 24.8 25.1 25.2 25.7 25.6 25.6 25.6
Kosovo 5.5 5.9 5.6 5.1 5.7 6.0 6.4
Macedonia, FYR 29.2 32.5 33.6 35.2 37.7 40.5 42.3
Montenegro 11.8 10.3 8.9 8.7 8.4 8.4 8.4
Serbia 30.7 31.9 33.9 37.0 39.3 41.3 43.4
WB6 24.0 24.7 25.2 26.7 28.0 29.2 30.3
Source: World Bank calculations and projections using data from national authorities and World Economic Outlook (2017).
WESTERN BALKANS REGULAR ECONOMIC REPORT NO.12
62 | KEY ECONOMIC INdICATORs
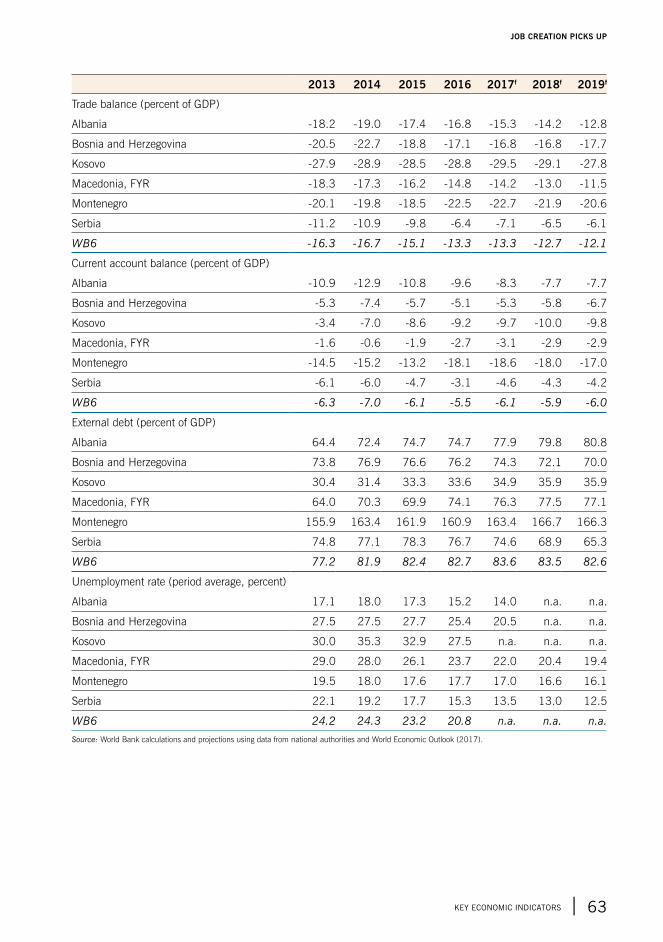
2013 2014 2015 2016 2017f 2018f 2019f
Trade balance (percent of GDP)
Albania -18.2 -19.0 -17.4 -16.8 -15.3 -14.2 -12.8
Bosnia and Herzegovina -20.5 -22.7 -18.8 -17.1 -16.8 -16.8 -17.7
Kosovo -27.9 -28.9 -28.5 -28.8 -29.5 -29.1 -27.8
Macedonia, FYR -18.3 -17.3 -16.2 -14.8 -14.2 -13.0 -11.5
Montenegro -20.1 -19.8 -18.5 -22.5 -22.7 -21.9 -20.6
Serbia -11.2 -10.9 -9.8 -6.4 -7.1 -6.5 -6.1
WB6 -16.3 -16.7 -15.1 -13.3 -13.3 -12.7 -12.1
Current account balance (percent of GDP)
Albania -10.9 -12.9 -10.8 -9.6 -8.3 -7.7 -7.7
Bosnia and Herzegovina -5.3 -7.4 -5.7 -5.1 -5.3 -5.8 -6.7
Kosovo -3.4 -7.0 -8.6 -9.2 -9.7 -10.0 -9.8
Macedonia, FYR -1.6 -0.6 -1.9 -2.7 -3.1 -2.9 -2.9
Montenegro -14.5 -15.2 -13.2 -18.1 -18.6 -18.0 -17.0
Serbia -6.1 -6.0 -4.7 -3.1 -4.6 -4.3 -4.2
WB6 -6.3 -7.0 -6.1 -5.5 -6.1 -5.9 -6.0
External debt (percent of GDP)
Albania 64.4 72.4 74.7 74.7 77.9 79.8 80.8
Bosnia and Herzegovina 73.8 76.9 76.6 76.2 74.3 72.1 70.0
Kosovo 30.4 31.4 33.3 33.6 34.9 35.9 35.9
Macedonia, FYR 64.0 70.3 69.9 74.1 76.3 77.5 77.1
Montenegro 155.9 163.4 161.9 160.9 163.4 166.7 166.3
Serbia 74.8 77.1 78.3 76.7 74.6 68.9 65.3
WB6 77.2 81.9 82.4 82.7 83.6 83.5 82.6
Unemployment rate (period average, percent)
Albania 17.1 18.0 17.3 15.2 14.0 n.a. n.a.
Bosnia and Herzegovina 27.5 27.5 27.7 25.4 20.5 n.a. n.a.
Kosovo 30.0 35.3 32.9 27.5 n.a. n.a. n.a.
Macedonia, FYR 29.0 28.0 26.1 23.7 22.0 20.4 19.4
Montenegro 19.5 18.0 17.6 17.7 17.0 16.6 16.1
Serbia 22.1 19.2 17.7 15.3 13.5 13.0 12.5
WB6 24.2 24.3 23.2 20.8 n.a. n.a. n.a.
Source: World Bank calculations and projections using data from national authorities and World Economic Outlook (2017).
KEY ECONOMIC INdICATORs | 63
JOB CREATION PICKS UP


Job Creation Picks up
View this report online:www.worldbank.org/eca/wbrer