western hudson bay polar bear aerial survey, 2011 · western hudson bay polar bear aerial survey,...
TRANSCRIPT

1
WESTERN HUDSON BAY POLAR BEAR AERIAL SURVEY, 2011
FINAL REPORT
MAY 14TH, 2012

2
Prepared by: Dr. Stephen Atkinson Dr. David Garshelis (Professor) Department of Environment Seth Stapleton (Student) Govt. of Nunavut Conservation Biology Graduate Program Box 209 University of Minnesota Igloolik, NU X0A-0L0 187 McNeal Hall, 1985 Buford Avenue Phone: (204) 284-1813 St. Paul, MN 55108 USA Fax: (204) 284-1813 Phone: (218) 327-4146 (DG) or (919) 357-8992 (SS) [email protected] or Fax: (218) 999-7944 [email protected] [email protected] [email protected]
Daryll Hedman Regional Wildlife Manager Manitoba Conservation Northeast Region Thompson, MB Phone: (204) 677-6643 [email protected]

3
Disclaimer
The opinions in this report reflect those of the authors and not necessarily those of the
Government of Nunavut, Department of Environment.

4
SUMMARY
Although capture-based studies in the Western Hudson Bay polar bear subpopulation (WH)
have documented declines in abundance, survival, and body condition, these findings are
inconsistent with local knowledge and perceptions. To address on-going debate about current
abundance and continue the development of non-invasive research methods, we conducted a
comprehensive aerial survey of WH, including Nunavut, Manitoba, and Ontario. We used a
combination of overland transects oriented perpendicular to the coastline and extending up to
100 km inland, coastal contour transects, and small island sampling during the August, 2011
survey. We implemented both distance sampling and sight-resight protocols while sampling
from helicopter and fixed wing platforms. We recorded a total of 711 polar bear sightings,
concentrated along the coastline and in the central and southern Manitoba and Ontario
portions of WH, although bears were also regularly sighted inland in the Wapusk National Park
region. We examined 4 datasets using distance sampling and sight-resight analyses and
generated an abundance estimate of about 1,000 bears (95% CI: about 715 – 1398). We
hypothesize that a distributional shift within WH toward southeastern Manitoba and Ontario,
particularly among adult males, has occurred in recent years. The aerial survey-derived
estimate is consistent with the 2004 capture-based estimate but inconsistent with projections
suggesting continued decreases in abundance. Limited spatial sampling, large numbers of bears
summering in southeastern WH, and high fidelity exhibited by bears during late summer may
have negatively biased capture-derived abundance estimates. However, potential bias in the
capture-based estimate does not necessarily negate the declining trend, estimates of vital
rates, and observed decreases in body condition. We note that mean litter sizes and number of
dependent offspring observed in 2011 in WH were less than recent research in other seasonal
ice subpopulations, suggesting relatively poor reproductive output. We emphasize that all
sources of data should be considered when evaluating WH subpopulation status.
INTRODUCTION
Status of the Western Hudson Bay Subpopulation
Scientific evidence, primarily based on a long-term tagging program, suggests that the
abundance of polar bears in Western Hudson Bay (WH) increased during the 1970’s, remained

5
stable for a period in the 1980’s and has subsequently declined (Derocher and Stirling 1995a;
Lunn et al. 1997; Regehr et al. 2007). Between 1984 and 2004, estimated abundance decreased
by approximately 22% from 1200 to 935 bears (Regehr et al. 2007). Associated declines in
survival, reproductive output and body condition during this period have been attributed to
earlier sea ice breakup in Hudson Bay as a result of global climate warming (Stirling et al. 1999;
Regehr et al. 2007). An increase in incidences of reported human-polar bear conflicts in the
region has also been interpreted as a sign that the subpopulation is undergoing significant
change and has created public safety concerns (GN unpublished data; Stirling and Parkinson
2006; Towns et al. 2009; Peacock et al. 2010). The extension of the ice-free season has forced
bears to spend longer periods on land without access to their primary food (seals), leading to
poorer condition and an increased tendency to seek alternative food sources such as those
available around settlements and camps (Stirling and Parkinson 2006). Population viability
analysis based on 2004 demographic data (Regehr et al. 2007) project that the WH
subpopulation will continue to decline (Obbard et al. 2010). In addition, climate models predict
that sea ice habitats in Hudson Bay will further deteriorate, resulting in additional declines in
abundance (Amstrup et al. 2008).
There is general consensus between science and the traditional ecological knowledge (TEK)
and local observations of Inuit in the WH region that polar bear abundance has increased since
the 1970’s (Tyrell 2006). There is also agreement that polar bear distribution has changed, that
more bears are being sighted around communities, that sea ice breakup is occurring earlier and
that climate change is negatively influencing seal populations (NWMB 2007). However, in
contrast to scientific evidence, Inuit perceptions of WH do not support the notion that
abundance has declined since the mid-1980’s (Tyrell 2006). Reports of more bears summering
on land in the Nunavut portion of Hudson Bay (i.e., the Kivalliq region) and increased incidences
of problem bears around camps and communities have been attributed to factors such as
higher abundance, habituation of bears to human activities such as ecotourism, changes in
behavior due to capture and handling for scientific research, and increasing use of unmanaged
garbage dumps in communities along the Hudson Bay coastline (Stirling and Parkinson 2006;
Dyck et al. 2007; NWMB 2007; Stirling et al. 2008a).
The disparity between scientific findings and TEK has generated significant debate over the
management and conservation of WH polar bears. Although harvest is not considered the
primary threat to conservation in this subpopulation, to a large extent the controversy has
focused on harvest management. This conflict has led to calls for new research to help inform
status assessment and resolve the apparent differences between these bodies of knowledge.

6
Updating the Abundance Estimate for WH
With a research program dating back more than 4 decades (e.g., Jonkel et al. 1972; Stirling et
al. 1977; Derocher and Stirling 1995a; Regehr et al. 2007) , WH is the most thoroughly studied
polar bear subpopulation and ranks as one of the most intensively researched large mammal
populations world-wide. Capture and tagging have been central to long-term monitoring in WH.
In addition to abundance and demographic estimates (e.g., Derocher and Stirling 1995a; Lunn
et al. 1997; Regehr et al. 2007), the WH capture program has facilitated studies of movements,
habitat use, genetics, body condition, energetics, growth, physiology, diet, effects of sex-
selective harvest, and contaminant levels (e.g. Atkinson and Ramsay 1995; Derocher and
Stirling 1995a, 1995b; Paetkau et al. 1995; Derocher et al. 1997; Clark and Stirling 1998;
Norstrom et al. 1998; Stirling et al. 1999; Lie et al. 2005; Richardson et al. 2005; Parks et al.
2006; Thiemann et al. 2008; Towns et al. 2010). The diverse range of information generated by
these studies has provided a broad ecological context for assessing subpopulation status.
In response to calls for updated information on WH, a new analysis of capture and recovery
data has been initiated by Environment Canada in collaboration with the United States Fish and
Wildlife Service. The analysis, incorporating data collected since the 2004 study (Regehr et al.
2007), will provide estimates of abundance and vital rates (survival and recruitment) current to
2011. However, among Inuit in the region, calls for new research were based in part on
concerns related to the methods used in physical capture studies and a desire to see alternative
research methods employed. These concerns fall into three categories. First, although several
studies have failed to detect impacts on body condition, survival and reproduction resulting
from polar bear capture and handling (Ramsay and Stirling 1986; Amstrup 1993; Derocher and
Stirling 1995b; Messier 2000), concerns remain about the invasiveness of this method1. This
has led some to question whether intensive tagging operations in WH have contributed to the
observed declines in abundance and vital rates (NWMB 2007; Dyck et al. 2007). Second, the
capture and release of polar bears is viewed by many Inuit to be inconsistent with cultural
beliefs regarding interactions with animals. Third, almost all of the polar bear research in WH
has been based on the capture of bears in Manitoba, focused in a study area between Churchill
and the Nelson River. Available scientific evidence suggests that relatively few bears spend the
ice-free period along the Nunavut coastline of WH (Peacock and Taylor 2007; Stapleton et al.
2010a), and proportions of tagged and untagged bears in this region are not statistically
different from the primary study region in Manitoba (Peacock and Taylor 2007). Additionally, 1 Negative effects on movement and body condition have been demonstrated in other Ursid species captured via
methods similar to those used on polar bears (Cattet et al. 2008).

7
multiple studies have suggested that focusing tagging operations in a core study area in
Manitoba has not significantly biased mark-recapture estimates of abundance and survival
(Lunn et al. 1997; Regehr et al. 2007; Peacock and Taylor 2007).2 Nevertheless, Inuit contend
that a significant and increasing number of WH bears are spending the ice-free period onshore
in Nunavut; thus, failing to extend tagging operations across the entirety of WH has negatively
biased abundance and vital rate estimates (NWMB 2007).
To address Inuit concerns about capture-based estimates and better inform status
assessment, we conducted a comprehensive aerial survey of the entire WH subpopulation
(including Nunavut, Manitoba and Ontario) during the 2011 ice-free period. In addition to
responding to population-specific needs, the aerial survey was part of a broader, on-going
Government of Nunavut-led initiative to develop more rapid and less invasive alternatives to
physical capture programs as a means to monitor the abundance of polar bear subpopulations.
While aerial surveys are well-established and widely implemented to monitor other wildlife
species, their application to polar bears has been limited. However, recent studies in the
Barents Sea (Aars et al. 2009), Foxe Basin (Stapleton et al. 2011), and Baffin Bay (Stapleton et al.
2010b) suggest that aerial surveys may be used to successfully estimate abundance in certain
regions. Additionally, because it has been the focus of an intensive, long-term mark-recapture
program, WH provides the opportunity to significantly advance aerial survey development.
Although capture studies have focused in a core study area in Manitoba, mark-recapture based
estimates are considered to represent the entire WH subpopulation (e.g., Obbard et al. 2010).
Hence, side-by-side comparison of aerial survey and capture-derived estimates enables us to
examine the methods’ respective biases and precision, promotes the acceptance of new
techniques in the scientific community, and can suggest possible technique modifications.
Objectives
The objectives of this study were to:
1) Generate an accurate and precise estimate of polar bear abundance in WH via aerial
survey.3
2
However, Peacock and Taylor (2007) noted the importance of expanding the study area to address any negative bias, or an increasing negative bias due to a potential distributional change (e.g., Towns et al. 2010), in demographic estimates due to incomplete coverage of the subpopulation. 3 Study design was based on a target coefficient of variation of 15 – 20%

8
2) Compare an aerial survey-derived abundance estimate with an updated (through 2011)
physical mark-recapture based abundance estimate.
3) Evaluate potential biases in and relative precision of aerial survey and physical mark-
recapture abundance estimates.
4) Provide training in aerial survey methods to community members to facilitate enhanced
public participation in polar bear monitoring.
5) Evaluate the distribution of polar bears in WH during the 2011 ice-free season with respect
to ecological variables.
MATERIALS AND METHODS
Study Area
Western Hudson Bay (WH), located at the southern extent of the global polar bear
distribution, stretches across roughly 435,000 km2of Hudson Bay and the adjacent coastline
including portions of Nunavut, Manitoba, and Ontario. This region is seasonally ice-free from
about July through November and shares borders with the Foxe Basin and Southern Hudson
Bay subpopulations. Like other subpopulations, WH boundary delineation is based on data
derived from a variety of sources including capture-recapture and capture-recovery (i.e.
harvest) studies (Stirling et al. 1977; Derocher and Stirling 1990; Kolenosky et al. 1992; Taylor
and Lee 1995; Derocher et al. 1997; Lunn et al. 1997; Stirling et al. 2004), aerial surveys (Stirling
et al. 2004), satellite telemetry (Stirling et al. 1999; Peacock et al. 2010), and genetic analysis
(Paetkau et al. 1995, 1999; Crompton et al. 2008). Although the boundaries are semi-discrete
and interchange occurs among neighboring subpopulations (Stirling et al. 1999; Crompton et al.
2008), their separation is most complete during the late summer and early fall ice-free season
when bears are on land (Peacock et al. 2010). The northern boundary of WH is located between
the communities of Chesterfield Inlet and Rankin Inlet, and the subpopulation extends south
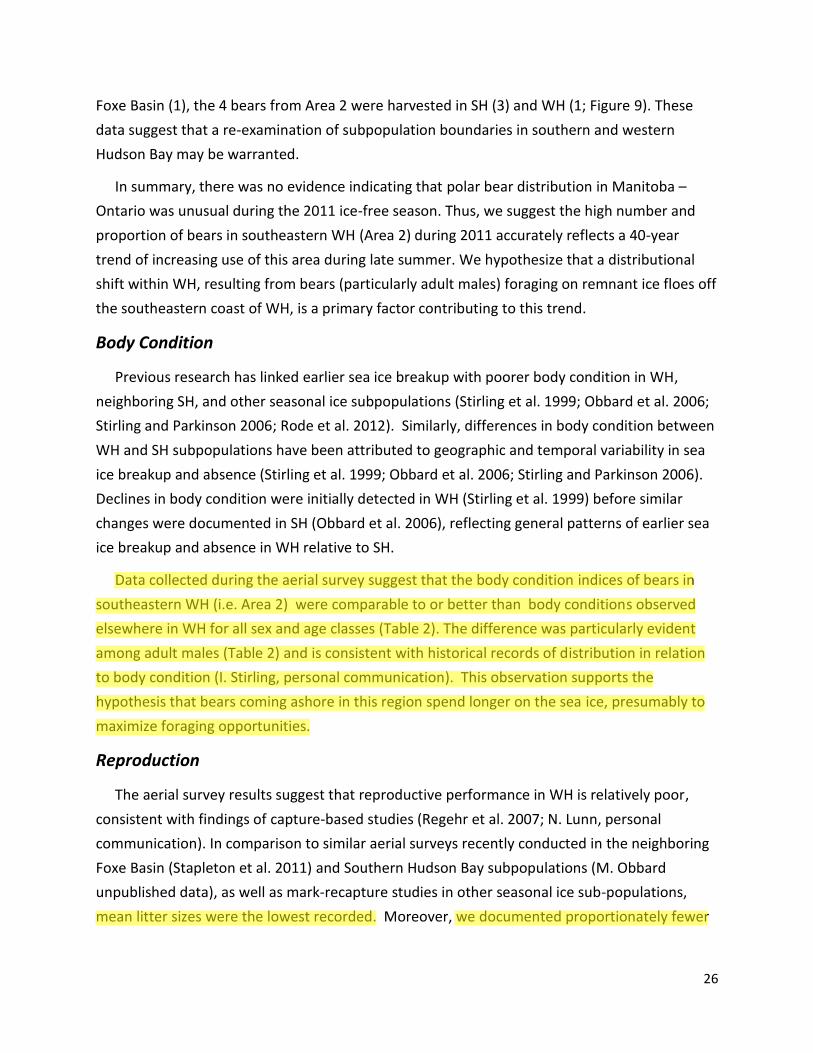
and east to about 40 km beyond the Manitoba – Ontario border (Figure 1). In addition to
Rankin Inlet, the communities of Whale Cove and Arviat (Nunavut) and Churchill (Manitoba) are
located within the boundaries of WH.

9
Survey Design and Field Methods
We conducted the aerial survey in August, 2011. During the ice-free season, bears are largely
confined to land, minimizing the area necessary to survey and thus facilitating a more efficient
study. Additionally, as noted above, range overlap between subpopulations within the Hudson
Bay complex (WH, Foxe Basin, and Southern Hudson Bay) reaches a minimum in late summer
and early fall, since polar bears exhibit a high degree of fidelity during this period (Derocher and
Stirling 1990; Lunn et al. 1997; Stirling et al. 2004; Parks et al. 2006). The absence of ice and
snow during late summer months also means that polar bears are readily observable against a
dark landscape, ideal conditions for an aerial survey. Finally, the timing of the study coincided
with the start of the maternity denning period4 and occurred before non-denning bears begin
to make directional northerly movements in the late fall, prior to freeze-up (e.g., Stirling et al.
1977; Derocher & Stirling 1990; Stirling et al. 2004).
We implemented a systematic, stratified study design to allocate sampling effort and
improve estimate precision. The base map used to delineate the shoreline and small offshore
islands was constructed from CanVec 1:50,000 scale GIS layers (available through Natural
Resources Canada). We considered multiple sources of information to define the inland extent
of the study area and to delineate strata, including:
Information on the distribution of bears from published papers (e.g., Derocher and
Stirling 1990; Lunn et al 1997; Stirling et al. 2004; Richardson et al 2005; Towns et al.
2010);
Pilot aerial survey data collected during 2010 in the Nunavut portion of WH (Stapleton
et al. 2010a);
Local knowledge about polar bear distribution provided by Nunavut hunters during a
workshop held in Churchill in July, 2010;
Polar bear capture records from Environment Canada in Manitoba (2003 – 2010);
Coastal and denning surveys conducted by Manitoba Conservation; and
4 Pregnant bears in WH enter dens as early as August (Clark et al. 1997; Clark and Stirling 1998; Lunn et al. 2004;
Richardson et al. 2005).

10
Satellite telemetry data on the movements of collared polar bears, collected by
Environment Canada and University of Alberta during summer and fall, 2010.
We a priori defined 4 strata based on presumed polar bear densities for the aerial survey: a
high density zone based on the core study area from Environment Canada’s long-term research
in Manitoba, including Wapusk National Park and extending up to 100 km inland; a moderate
density stratum, extending from the shoreline to 15 km inland elsewhere in Manitoba as well as
Ontario; a low density zone, from 15 km to 60 km inland elsewhere in Manitoba and Ontario;
and a low density Nunavut stratum, extending from the coastline to 60 km inland from the
Nunavut – Manitoba border to the community of Arviat, and from the shoreline to 50 km inland
from Arviat to the northern boundary of WH (Figure 1). The Nunavut stratum additionally
included 2 large islands.
We used a combination of overland transects, coastal contour transects, and small island
sampling to survey WH. Polar bears tend to congregate along or near the shoreline during the
ice-free season (Derocher and Stirling 1990; Towns et al. 2010), so overland transects were
oriented roughly perpendicular to the coast (i.e., against the coastal density gradient; hereafter
denoted as perpendicular transects) to improve precision and minimize potential biases (Figure
1; Buckland et al. 2001). Perpendicular transects spanned from the shoreline to 50 – 100 km
inland, depending on which stratum was being sampled. Transects were extended over any
exposed tidal flats to facilitate reliable estimation of abundance from perpendicular transects
and small island sampling alone. However, it was not possible to accurately delineate exposed
tidal flats in GIS, necessary for their inclusion in analysis. Hence, perpendicular transect
distances were measured to the shoreline and polar bear sightings on tidal flats were
considered to have occurred on land for analysis. Because sampling of tidal flats occurred at the
same intensity as the near-shore inland strata, any effect on the abundance estimate was
negligible.
After reaching the most inland point of transects, we flew roughly parallel to the shoreline to
join the adjacent perpendicular transect and returned to the coast. Data collected during this
cross-leg were generally not included in analyses. However, for 3 pairs of transects, we were
unable to reach the far inland extent of the stratum due to logistical constraints. To incorporate
sampling in the far inland portions of the strata in these instances, we included data collected
along this cross leg.

11
Survey effort was allocated among strata to maximize encounters while ensuring adequate
coverage of all regions. Because polar bears are concentrated along the coast and the Wapusk
National Park region is a well-documented denning site (e.g., Richardson et al. 2005), we
focused sampling in the high density and near-shore inland zones. Perpendicular transects were
systematically spaced at 6, 7, and 10 km intervals in the high density, moderate density, and
low density Nunavut strata, respectively (Figure 1). Every other pair of transects in the
moderate density zone in Manitoba and Ontario was extended through the low density (far
inland) stratum, such that transect spacing there averaged 14 km. We were able to survey
Nunavut at a higher intensity than the low density stratum in Manitoba and Ontario due to the
use of a fixed wing platform (see below).
We additionally surveyed from independent, comprehensive coastal contour transects
(Figure 2). Contour transects were flown at or slightly below the high-water line (HWL) with one
side of the aircraft dedicated to monitoring tidal flats and near-shore waters (i.e. swimming
bears)5. We surveyed along coastal contours as close to high tide as possible to minimize tidal
flat exposure and reduce the need to double-back to ensure that the coastal zone was
comprehensively covered. Observers looked for bears as far as they could reasonably see, not
within a pre-defined strip width. Because perpendicular transects were extended to the
shoreline and over tidal flats (where applicable), some bears along the shoreline could be
sighted from both perpendicular and coastal transects (accommodated by analyses; see below
and Figure 2). Bears sighted on tidal flats or in nearshore waters were considered within the
coastal zone (i.e., on land, where area could be estimated with GIS) in order to calculate density
and extrapolate to unsurveyed areas. We additionally sampled as many small islands as
possible within WH.
The Nunavut and Manitoba – Ontario portions of the aerial survey were conducted from
fixed wing (Turbo Beaver) and helicopter (Bell 206L) platforms, respectively. Separate platforms
were used to complete the survey in a logistically efficient manner and enhance opportunities
for community participation. The fixed wing survey crew consisted of 4 dedicated observers6
(community representatives), with front and rear observer teams each comprised of 2 spotters,
as well as a data recorder (a GN Biologist). The helicopter crew consisted of staff from the GN,
Manitoba Conservation, and Parks Canada. Here, the pilot and observer in the co-pilot seat
comprised the first team, and 2 individuals seated in the rear of the helicopter comprised the
second team.
5
Clark and Stirling (1998) reported that 4% of captured bears were located on tidal flats. 6
Members of Hunters’ & Trappers’ Organizations from communities in the Kivalliq region of Nunavut

12
For each aircraft, sampling protocols facilitated the collection of data for both distance
sampling (Buckland et al. 2001) and sight-resight (i.e., double-observer platform, a mark-
recapture variant; Pollock and Kendall 1987) analyses. Sightings were not announced until both
teams of observers were afforded a full opportunity to independently spot a bear. Transects
were flown at an above-ground level altitude of about 120 m and groundspeed of roughly 150
km / hr with both platforms. Flight parameters were based on polar bear aerial surveys
conducted in Foxe Basin during 2009 and 2010 (Stapleton et al. 2011).
We recorded flight paths and bear locations at the time of first observation via GPS and
measured perpendicular distances from sighted bears to the flight path in a GIS (Marques et al.
2006). We estimated sex and age class remotely7, documented group size and approximated
body condition using a qualitative fatness index (1 – 58, with 1 being leanest and 5 being most
obese; Stirling et al. 2008b). Groups were defined as multiple individuals whose detections
were non-independent (e.g., a family group including an adult female and her cubs or a
fraternity of 2 or more adult males). For each bear sighting, we also recorded factors that may
have influenced detection probability, including activity when first observed (e.g., lying down or
running), weather conditions and habitat characteristics, such as topography and habitat
structure within 30 m of an individual bear (all on qualitative 1 - 3 scales).
During the late summer and early fall, polar bears in WH, particularly pregnant females, may
retreat to earthen dens (Jonkel et al. 1972; Lunn et al. 2004). Denning bears that are completely
unavailable for sighting during sampling cannot be incorporated in an aerial survey-derived
abundance estimate. We investigated dens with recent digging or other signs of activity to
determine occupancy, when possible.
7 With the exception of adult females and their accompanying offspring, we acknowledge that there was
uncertainty in age and sex classifications, especially sub-adults and unaccompanied adult females. Data from a
recent tagging study in Davis Strait (Government of Nunavut, unpublished data) suggest that experienced
observers are able to identify adult males and lone adult females from the air with 94% (n=329) and 63% (n=111)
accuracy, respectively. Thus we suggest that our estimates of age and sex composition are a reasonable
approximation of the true composition of bears observed during the 2011 survey. Furthermore, our data should be
free of systematic geographic bias.
8 We acknowledge that assigning fatness scores remotely may differ from scoring bears during physical handling.
However, our fatness scores were assigned by an individual highly experienced with both polar bear capture and
aerial surveys and should be free of systematic bias.

13
Analyses
Perpendicular Transects
We used distance sampling (DS) to estimate abundance using data collected from
perpendicular transects. DS, a well-established technique implemented for a variety of taxa, is
based on the premise that an animal’s probability of detection decreases with increasing
distance from the survey transect. Perpendicular distances from the transect path to the animal
are directly measured or calculated from auxiliary data. Fitting a function to sightings distances
data enables the estimation of abundance (and density) within the survey strip, which is then
extrapolated across the study area to derive an estimate of total abundance. Preliminary
histograms of WH polar bear sightings distance data suggested a strongly supported detection
function (i.e., detections declined with increasing distance), indicating that DS was an
appropriate analytical method (Figure 3).
A key assumption of DS is that sampling is random with respect to the distribution of bears
(Buckland et al. 2001). Since polar bears concentrate along the shore during the ice-free season,
bears sighted from coastal contour transects may partially reflect this coastal density gradient
(as opposed to solely reflecting a distance-based detection function). Coastal contour transect
data are thus inappropriate for DS analysis. However, because perpendicular transects
(oriented against the density gradient) extended to the coastline and over tidal flats, we were
able to include the coastal zone in DS analysis via perpendicular transects. Alternatively, we
were able exclude these coastal zone data from DS analysis and independently estimate the
number of bears in the coastal strip using the coastal contour transect data in sight-resight
analyses (see below). We therefore compiled datasets including and excluding the
perpendicular transect data from the coastal zone to generate 2 estimates of abundance.
Detection of all objects on the transect line (i.e., detection probability = 1 at distance 0) is
another fundamental assumption of distance sampling (Buckland et al. 2001). Violation of this
assumption would produce a negatively biased abundance estimate. During the survey, our
impression was that virtually all animals on and near the transect line were detected, and we
initially proceeded with analyses incorporating all perpendicular transect sightings data (see
Discussion for further evaluation of this assumption). We note that both teams of observers in
the fixed wing had a blind spot of nearly 170 m on either side of the aircraft; hence, 170 m was
subtracted from all observations to establish the transect line at an appropriate distance from
the aircraft.

14
Although conventional DS and multiple covariate distance sampling (Marques and Buckland
2003) require complete detection at distance 0 to generate reliable abundance estimates,
mark-recapture distance sampling (MRDS; Laake and Borchers 2004) facilitates the estimation
of detection on the transect line using sight-resight data, thereby correcting for circumstances
in which detection at distance 0 is <1. In the helicopter platform, front observers were able to
survey on and near the flight path, while rear observers had a blind spot of about 70 m on both
sides of the helicopter. To fully evaluate survey data and assess detection at distance 0 using
MRDS, bears must be available to both teams of observers. Therefore, we created an additional
left-truncated dataset in which observations within 75 m of the helicopter were censored and
75 m was subtracted from all other sighting distances (Borchers et al. 2006). This procedure
established the transect line at a point in which all bears were visible to both teams of
observers. Fixed wing data were adjusted to ensure that bears were available for sighting by
both front and rear observers (described above), so these data were not further altered. In
sum, we analyzed 4 combinations of datasets with DS: including and excluding the coastal zone
perpendicular transect data as well as untruncated and left-truncated (75 m) transect datasets.
We initially fit conventional DS models in program Distance (Version 6.0, Release 2; Thomas
et al. 2009) to evaluate detection functions and to assess whether group size influenced
detection (via the regression method implemented in Distance). Following this preliminary
review, we fit all DS models in the MRDS engine of Distance. The 2 untruncated transect
datasets were modeled as single observer studies, and the left-truncated transect datasets
were modeled as double observer surveys. Data in all analyses were right-truncated at roughly
5% to smooth the tail of the detection function and improve model fit and parsimony (Buckland
et al. 2001). For the double observer surveys, we employed the point independence mark-
recapture model (Laake and Borchers 2004) and specified distance as the only covariate.
We fit DS models with hazard and half-normal key functions and used a forward stepwise
procedure to evaluate the impact of covariates. We considered visibility (weather) and habitat
structure near (within 30 m of) a sighting as covariates in these models. Covariates were
collected on a qualitative 1 to 3 scale, but we condensed into binary categories because of
underrepresentation of values. We specified a global detection function and used stratum-
specific encounter rates and group sizes to estimate density and abundance by stratum.
Stratum abundance estimates were subsequently summed to obtain an overall abundance
estimate.
Sample size constraints compelled us to pool data collected from fixed wing and helicopter
platforms for all DS analyses. Additionally, we condensed the Nunavut stratum and the low

15
density, far inland zone in Manitoba and Ontario into a single stratum due to few encounters in
these areas. Although sampling intensity was greater in Nunavut, estimated densities were very
low in these two strata and individual encounter rates were similar. Therefore, pooling these
data had a negligible impact on the overall DS-derived abundance estimates.
We employed Aikaike’s Information Criteria for model selection (Burnham and Anderson
2002) and examined q-q plots and chi-square, Kolmogorov-Smirnov, and Cramer-von Mises
tests to evaluate goodness of fit. Individual transects, within stratum, were considered sampling
units for variance estimation. We used the Innes et al. (2002) method to estimate variance,
since this technique does not require independence among variance components (stratum-
specific abundance estimates were not fully independent because we estimated a global
detection function). We assigned equal model weights (w = 0.5) to the untruncated and left-
truncated estimates for each of the datasets including and excluding the coastal zone data and
generated model-averaged estimates of abundance and unconditional variance. Model-
averaging enabled us to account for variability in the estimation of the detection functions and
associated densities.
Coastal Transects and Small Islands
We used sight-resight analyses to provide a separate estimate of coastal zone abundance
with coastal contour transects. This technique uses data collected by independent observers to
estimate individual detection probabilities. Individual detection probabilities, in turn, are used
to estimate the number of bears within the survey strip that were not observed by either team.
Here, we employed the Huggins mark-recapture model (Huggins 1989, 1991), a closed
population model in which the likelihood is conditional on capture (i.e., sighting). The Huggins
model facilitates the inclusion of covariates to explain variability in detection probabilities.
Front and rear observer teams comprised our first and second sampling periods,
respectively, and we considered discrete groups of polar bears (as defined above) the sampling
unit. We assumed that we effectively sampled the coastal zone 500 m inland of the high-water
line (since coastal contour transects were often flown slightly below the HWL to improve
coverage of the tidal flats). We allowed detection probabilities to remain constant or vary
between observers and used a backwards stepwise process to assess the importance of
covariates potentially impacting detection, including habitat structure, group size, and activity
at first sighting. (Visibility was graded as uniform along coastal contour transects and thus not
included as a covariate.) Models were fit in Program MARK (White and Burnham 1999) and AIC
adjusted for small sample sizes (AICc) employed for model selection. Detection probabilities

16
from the most supported model and a generalized Horvitz-Thompson estimator were used to
estimate the number of groups present in the sampled areas.
For small islands, the front team of observers spotted all groups that were sighted within the
half-strip width of 750 m. Therefore, it was unnecessary to estimate individual detection
probabilities via the Huggins model (i.e., front observers detection was estimated at 1). For
both the coastal contour transects and the small island sampling, we extrapolated group
density estimates across the coastal zone and small islands and multiplied estimates by mean
group sizes. We calculated group sampling variance following Buckland et al. (2001) and
extrapolated and multiplied variances via the delta method (Powell 2007).
Total Abundance
Sampling and analytical protocols enabled us to generate two partially independent WH
abundance estimates. First, total abundance was derived by summing estimates from coastal
contour transects, perpendicular transects excluding coastal zone data, and small island
sampling. The second estimate incorporated estimates from the complete perpendicular
transects and small islands. We summed point estimates and their variances to obtain 2
abundance estimates, assigned equal model weights to these estimates, and model-averaged
to obtain an overall abundance estimate.
RESULTS
Survey Effort and Observations
We surveyed >100 combined hours from the 2 survey platforms during the August 13 – 29
study period. Sampling was completed under a mixture of weather conditions, ranging from
sunny and clear to cloudy with intermittent rain. We did not fly when ceilings were <300 m,
horizontal visibility <3 km, or winds >20 km / hour.
A total of 711 polar bear sightings were recorded, including 41 and 670 observations in
Nunavut and Manitoba – Ontario, respectively (Figure 4). Because the coastal contour and
perpendicular transects were conducted independently, we were unable to calculate the
number of unique bears that were sighted. However, sampling itineraries in Nunavut enabled
us to estimate that no more than 31 unique bears were sighted there. Several aggregations of 4
or more bears, including 5 groups with 8 to 10 bears and a group with 21 individuals, were
documented in far southeastern WH and near Cape Churchill. Fifty cubs-of-the-year (COY) and

17
22 yearlings were observed. Mean litter sizes were 1.43 (SD: 0.50; n = 35) and 1.22 (SD: 0.43; n
= 18) for COYs and yearlings, respectively9.
Distribution
Polar bear sightings were not uniformly distributed across WH (Figure 4; Table 1). The
highest concentrations of bears were documented in the high density stratum, encompassing
the historical Environment Canada study area including Wapusk National Park, and along the
coast of southeastern WH. The distribution and number of bears observed in Nunavut during
2011 (Figure 4) were consistent with the 2010 pilot aerial survey and the 2007 capture research
in the Nunavut portions of WH (Figure 5; Peacock and Taylor 2007).
In general, observations were highly concentrated along or near the coast throughout the
subpopulation (Figure 4). However, inland bears >10 km from the coastline were often
recorded in the high density stratum and less frequently observed in the southeastern portion
of WH. Thirty-five bears were sighted >40 km from the nearest coastline, most within the high
density stratum; the furthest inland bear was sighted about 75 km from the shore.
To further examine distribution and facilitate comparison with earlier studies, we divided
bears observed in Manitoba and Ontario into groups corresponding with two distinct
geographic regions. We defined Area 1 as the region extending from the Manitoba-Nunavut
border to the Nelson River, including the primary long-term study area for Environment
Canada’s capture program [approximating Area 5 in Stirling et al (2004)]. Area 2 was defined as
the region extending from the Nelson River to the eastern boundary of WH, approximating Area
4 in Stirling et al. (2004). A total of 182 bears were sighted from coastal contour transects
(including small islands) in Area 1, while 216 bears were spotted from contour transects in Area
2 (Table 1). We note that 41% (88) of the individuals sighted in southeastern WH (Area 2) were
spotted within Ontario.
Remotely assessed sex and age-class distribution were generally similar across these broadly
defined geographic regions (Table 1). Notably, however, we observed a greater proportion of
adult males in the southeastern portion of WH (Area 2), while proportionately more solitary
adult females and family groups were sighted from perpendicular transects in the central and
northern portions of WH (Area 1). Body condition scores among bears in the southeastern
region were generally consistent with or better than those of bears further north for all sex and
age classes (Table 2).
9
Litter sizes and cub observations were calculated from all observations in Manitoba and Ontario and only unique bears in Nunavut.

18
Abundance Estimation
Perpendicular Transects
We flew approximately 8,000 km along perpendicular transects, including >2,900 km in the
high-density stratum, nearly 1,100 km in the moderate density Manitoba zone, and about 4,000
km in the Nunavut and far inland Manitoba strata. Two perpendicular transects in the high
density stratum were sampled twice, but only the initial flights were included in analyses
because of non-independence. We included 139 and 62 polar bear groups in DS analysis (after
right-truncation at ~5%) for the datasets that included and excluded the coastal zone,
respectively. The substantial sample size difference highlights the high concentration of bears in
the coastal strip and the associated density gradient.
Observed group sizes along perpendicular transects ranged from 1 to 8 ( : 1.44; SD: 0.94). A
group of 6 bears, including 2 family groups (each with an adult female and a single cub of the
year) and 2 independent bears, was sighted in Nunavut, congregating around harvested whale
carcasses. Because the far inland Manitoba – Ontario and Nunavut strata were pooled and we
viewed this aggregation as an anomaly that would not reflect group sizes in interior Manitoba –
Ontario, we instead calculated a stratum-specific mean group size for this observation.
Preliminary analyses did not indicate an effect of group size on detection probabilities, a finding
that was consistent with our field observations. Goodness of fit metrics suggested adequate
model fit for all highly supported models (P > 0.05 for all Chi-square, Kolmogorov-Smirnov, and
Cramer-von Mises tests).
MRDS analyses (i.e., the left-truncated datasets) indicated nearly perfect detection on the
adjusted transect line, estimated at 98% and 97% for datasets including and excluding the
coastal zone, respectively. Model selection was similar among analyses and supported the
inclusion of covariates to explain variability in detection probabilities (Table 3). Because there
was some within-dataset variability in density and abundance estimates derived from the most
highly supported models, we first obtained model-averaged estimates for models within ΔAIC
of 2 for each dataset combination.
Abundance estimates from the untruncated and left-truncated transect analyses were
consistent within datasets that included the coastal zone (untruncated: : 929, SE: 186; left-
truncated: : 899, SE: 200) or excluded this region (untruncated: : 561, SE: 124; left-
truncated: : 472, SE: 102). Combining the untruncated and left-truncated datasets via model-
averaging yielded abundances of 914 (SE: 194) and 517 (SE: 122) for datasets including and
excluding the coastal zone, respectively.

19
We note that the exclusion of the coastal zone data from DS analyses produced narrower
half-strip widths (Figure 6). This finding supports our field observations: minimal habitat
structure along the coast produced excellent sighting conditions, but vegetation and other
habitat features increased farther inland, obscuring polar bears and reducing visibility.
Coastal Transects and Small Islands
Nunavut’s coastline is highly irregular in portions of northern WH, making it challenging to
conduct and analyze a comprehensive coastal contour transect. This finding, coupled with the
low number of observations in the pooled low density stratum (n = 6), compelled us to rely
exclusively on perpendicular transects to estimate coastal zone abundance in Nunavut; we did
not generate a separate coastal contour estimate there. In Manitoba and Ontario, however, we
sampled >95% of the coastline and included 190 polar bear groups in sight-resight analysis. Our
highest ranked model incorporated separate detection probabilities for the front and rear
observers and covariates for habitat structure and group size. Detection and abundance
estimates were very consistent among the best supported models. Thus, we used detection
probabilities from the most highly supported model ( front: 0.97, SE: 0.014; rear: 0.86, SE: 0.027)
to generate a group abundance estimate ( : 192 groups; SE: 1.7) for the sampled areas,
inflated across the unsurveyed coastal areas, and multiplied by mean group size ( : 1.45; SD:
1.6) to derive a coastal zone abundance estimate from coastal transects in Manitoba and
Ontario ( : 291 individuals; SE: 23.8).
We sampled about 85% and 60% of islands in Manitoba – Ontario and Nunavut, respectively,
observed 102 and 9 bears (41 and 7 groups) and obtained estimates of 120 (SE: 19.8) and 15
(SE: 1.6) total bears on and near small islands in the 2 areas. Additionally, 2 groups of bears – a
family group including a female with 2 cubs of the year and a single adult female – were sighted
beyond the maximum inland extent of the defined study site (>75 km and >60 km inland,
respectively). Because we were unable to incorporate these individuals elsewhere in the
analysis, they were added to final calculations.
Total Abundance
Summing estimates from the complete perpendicular transects (i.e., including the coastal
zone), small island sampling, and the 4 out-of-study area bears yielded an abundance estimate
of 1,053 (SE: 195). Estimates from perpendicular transects excluding the coastal zone data,
coastal contour transects, and small island sampling , as well as the 4 bears observed out of the
study area, produced a total abundance of 947 (SE: 126). Model averaging these estimates

20
yielded an abundance of 1,000 (CV: 17.2; 95% Lognormal CI: 715 – 1,398) for WH during the
2011 ice-free season.
DISCUSSION
Distribution of Polar Bears in Western Hudson Bay
Nunavut
Residents of communities along WH’s Nunavut coastline have reported more frequent
encounters with polar bears since the 1970’s (Tyrell 2006), resulting in a perception locally that
abundance has increased (Dowsley and Taylor 2006; NWMB 2007). These observations have
also been interpreted as evidence that a larger proportion of the subpopulation is summering
on land in Nunavut, generating concern that the Manitoba-focused mark-recapture sampling
has yielded biased results (NWMB 2007). Indeed, a northwards distributional shift into Nunavut
could result in greater capture heterogeneity or entirely exclude some bears from sampling.
However, there is no scientific evidence to support such a large-scale range shift. A capture-
based study (Peacock and Taylor 2007), a recent pilot aerial survey (Stapleton et al. 2010a) and
this study all found relatively few bears in the Nunavut section of WH during late summer. For
example, only about 6% of sightings during the 2011 survey were in Nunavut, suggesting that
the vast majority of individuals still summer in Manitoba. We further note that the distribution
of bears in Nunavut was very consistent among these 3 studies. During the summer, polar
bears in this region were found at relatively low densities, concentrated along the coast and on
offshore islands. The highest densities were observed south of Arviat towards the Manitoba
border (Figures 3 and 4). Finally, capture work indicated that the proportion of marked bears in
Nunavut did not statistically differ from the proportion of marked bears in Manitoba,
illustrating that mark-recapture based estimates are not significantly biased by a lack of
sampling in Nunavut (Peacock and Taylor 2007).
We note that Towns et al. (2010) documented a progressive northward and eastward shift
(i.e. towards the coast) of bears captured in the core Environment Canada study area in
Manitoba (roughly our high density stratum) between 1986 and 2004. The distributions of
some age and sex classes shifted by up to 20 km during this period. Causes are unknown, but
distributional shifts could be related to changes in population structure or environmental
conditions (Towns et al. 2010). Similarly, Ramsay and Stirling (1990) noted a northward shift of
maternity dens in the same area between the 1970s and 1980s. Given the lack of long-term
data on the distribution and density of bears in the Kivalliq region, we cannot test the

21
hypothesis that a comparable change in summertime distribution is extending into Nunavut.
Increased occupancy of the coastal strip in Nunavut, however, would be consistent with Inuit
reports of more bears since human activities are generally focused along the coast. Regardless,
our survey findings indicate that the proportion of the subpopulation currently summering in
Nunavut is low, and there is no evidence of a major distributional change into Nunavut that
could affect the accuracy of on-going mark-recapture studies.
Manitoba and Ontario
Similar to previous studies (e.g. Stirling et al. 1977; Derocher and Stirling 1990; Lunn et al.
1997; Towns et al. 2010), we found marked differences in polar bear distribution between two
broad geographic regions (Figure 4). In the area extending from the Nelson River north to
Churchill and the Nunavut border (here denoted as Area 1), the highest densities of bears
occurred along the coastline. However, we also encountered a significant number of individuals
far inland (>10 km), mostly within the bounds of Wapusk National Park. In contrast, virtually all
polar bears in the region from the Nelson River eastward into Ontario (denoted as Area 2) were
highly concentrated in a relatively narrow strip along the coast. These patterns of distribution
have been well-documented previously and attributed to several factors, including variation in
the availability of suitable inland habitats for denning, the avoidance of conspecifics and
thermoregulation (Stirling et al. 1977; Derocher and Stirling 1990; Lunn et al. 1997; Clark and
Stirling 1998; Richardson et al. 2005).
In comparison to Area 1, little is known about the ecology of polar bears summering in Area
2. This region lies outside the study area for most research conducted since the 1960’s and has
received relatively little sampling effort for mark-recapture studies (Kolenosky et al. 1992; Lunn
et al. 1997; Lunn et al. unpublished data). However, Inuit elders in the Kivalliq region of
Nunavut have noted that, in the days before the introduction of harvesting quotas, most bears
were harvested in the Churchill region and beyond the Nelson River (NWMB 2007), suggesting
that this region was historically important as a summering area for polar bears in WH. The 2011
survey indicated that this area remains an important summering area. Nearly half of the polar
bear sightings in Manitoba – Ontario occurred in Area 2 (outside the primary capture sampling
area), illustrating that a large segment of the subpopulation came ashore and spent some
portion of the ice-free period in this region during 2011.
To more fully evaluate polar bear distribution during the 2011 aerial survey, we examined
the hypothesis that the high proportion of bears encountered in southeastern WH (i.e., Area 2)
was influenced by large-scale movements of bears from the adjacent Southern Hudson Bay (SH)
subpopulation. First, although they represent a small (n=7) and sex-biased (i.e., all females)

22
sample, bears outfitted with satellite collars in SH during 2011 did not exhibit unusual
movements during the ice-free season and were well within the bounds of SH during the late
summer and fall (M. Obbard and K. Middel, unpublished data). Additionally, an aerial survey
was conducted in SH in September 2011, extending from James Bay in southeastern Hudson
Bay westward to the Ontario – Manitoba border (i.e., into WH; see Future Research and
Recommendations). More than 650 sightings were recorded within the Ontario portion of SH,
including nearly 600 observations >70 km from the shared WH – SH boundary (M. Obbard et al.,
unpublished data), demonstrating that a high number of bears remained within the SH
boundaries duirng the 2011 ice-free season. [The current abundance estimate for the SH
subpopulation is 900 – 1000 bears (Obbard et al. 2007).] Combined, these data suggest that a
large influx of bears into WH from SH during 2011 is unlikely to have significantly impacted our
results.
To assess if the high proportion of bears encountered in southeastern WH (i.e., Area 2)
during the 2011 aerial survey was consistent with previous years, we examined data from
coastal survey counts conducted in the same region by the Manitoba Department of
Conservation (MDOC, unpublished data). These data were previously analyzed by Stirling et al.
(2004) for the 1970 to 1997 period. We extended this analysis to include data collected since
1997. Similar to Stirling et al. (2004), we restricted our analysis to surveys conducted in late
August to early September. During our 2011 survey, the coastal contour transects for this
region were flown on August 21st and 22nd and are thus comparable with previous coastal
surveys.
Stirling et al. (2004) reported a significant increase in polar bears counted along the coast
between the Nelson River and the Manitoba – Ontario border (i.e., Area 2). Data collected
since 1997 suggest a continuation of this trend (1970 – 2011: r2 = 0.45; P < 0.0001; Figure 7b).
Furthermore, the number of bears counted along this stretch of coast and nearshore islands
during the 2011 aerial survey was consistent with the recent MDOC coastal count surveys. Since
bears in this area are concentrated along the coastline, the vast majority of individuals are
observable during coastal surveys. Consequently, the trend in survey counts likely accurately
indexes changes in abundance within this area. We note, however, that there is substantial
inter-annual variation in coastal counts, perhaps driven by annual patterns of ice breakup
(Stirling et al. 2004).
The long-term increasing trend in coastal survey counts in Area 2 could be attributed to an
increase in overall subpopulation abundance and / or a distributional shift. Documented
declines in WH abundance, survival, reproduction and body condition (Stirling et al. 1999;

23
Stirling and Parkinson 2006; Regehr et al. 2007) and the remarkably low proportions of cubs
and yearlings seen in this study do not support the hypothesis that increasing numbers of bears
in Area 2 are the result of overall subpopulation growth.
Similarly, multiple lines of evidence suggest that an influx of bears from neighboring
subpopulations appears to be an unlikely cause of the long-term trend. First, Stirling et al.
(2004) found no relationship between the number of bears counted in southeastern WH (here,
Area 2) and in Southern Hudson Bay (SH), suggesting that exchange between the
subpopulations did not account for annual variation in counts within each subpopulation. Using
mark-recapture data, Lunn et al. (1997) also documented that WH and SH are largely
segregated, even in areas close to the subpopulations’ shared boundary. More recently,
sampling in southeastern WH (Area 2) yielded 50 individuals captured from 2003 to 2004 (N.
Lunn, unpublished data). Eleven individuals were subsequently recaptured between 2004 and
200510. Although more capture effort was expended in Area 1 than 2, 1 and 8 bears were
recaptured in the sites, respectively, and 2 additional bears were captured in SH (M. Obbard,
unpublished data). Despite small sample sizes, these numbers reinforce that polar bears exhibit
high inter-annual fidelity during the ice-free period. We acknowledge, however, that shifts in
subpopulation boundaries have been hypothesized as a potential impact of climate change
(Derocher et al. 2004), but additional data are required to fully evaluate current boundaries.
A shift in the distribution of bears within WH, specifically bears entering Area 2 from other
parts of WH, appears to be a more plausible hypothesis to explain increasing coastal counts.
Using historical MDOC coastal survey data for Area 1 [i.e., extending previous analyses by
Stirling et al. (2004)], we found no significant change in counts between 1970 and 2011,
illustrating that the increased occupancy of the coastline documented in Area 2 is not occurring
elsewhere in WH (r2 = 0.10; P = 0.06; Figure 7a). However, this does not discount the possibility
of a shift in late summer distribution from Area 1 to Area 2. In comparison to Area 2, coastal
surveys in Area 1 may be a relatively insensitive indicator of abundance since many bears in this
area are found inland (where they are unavailable for observation). Furthermore, coastal
counts in this area may be confounded by inter-annual variation and long-term changes in the
distribution of bears between the coastal and inland zones. Indeed, as previously noted, Towns
et al. (2010) documented a northerly and easterly (i.e., coastward) shift in occupancy in Area
10
The recapture period examined was limited because, to our knowledge, mark-recapture sampling has not occurred in Area 2 since 2005.

24
1.11 Such changes could well mask a decline in abundance in Area 1 if one relied exclusively on
coastal counts.
Stirling et al. (2004) concluded that coastal survey counts were a reliable indicator of long-
term population trends in WH. However, pooled coastal survey data for Areas 1 and 2 (MDOC,
unpublished data) demonstrate an increase in the total number of bears observed along the
WH coastline in Manitoba between 1970 and 2011 (r2 = 0.48; p < 0.0001; Figure 8). We also
note that the total number of bears sighted from coastal transects during our 2011 survey was
very consistent with this trend. These findings contrast with mark-recapture results indicating
that abundance has declined since the 1980’s (Regehr et al. 2007). To reconcile these seemingly
contradictory observations, we hypothesize that the current trend in coastal survey counts may
reflect a shift in distribution within the subpopulation rather than a change in overall
abundance. More bears are coming ashore in southeastern WH (in comparison to the Churchill
area), where they spend all or part of the ice-free period occupying a narrow band along the
coast. As such, they are more readily observable during coastal surveys than bears in Area 1.
Trends in coastal counts therefore may reflect a real increase in abundance locally (within Area
2) and an overall increase in coastal occupancy (rather than abundance) at the subpopulation
level.
Multiple factors could be responsible for a southeastern distributional shift of WH polar
bears during the ice-free period. Changes in the quality, quantity and distribution of sea ice
habitat could have a profound effect on distribution. Sea ice breakup in Hudson Bay is occurring
on average 2 – 3 weeks earlier than 30 years ago (Stirling and Parkinson 2006; Scott and
Marshall 2010). Stirling et al. (2004) reported that the timing of breakup was approximately 1
week later along the southeastern coast of WH (Area 2) relative to central and northern
Manitoba (Area 1). The increasing numbers of bears coming ashore and summering along the
southeastern Manitoba coastline may therefore indicate that the extra time bears gain on the
ice by coming ashore at this location is becoming increasingly important. Presumably, bears use
this time as an opportunity to improve body condition by feeding, a behavior that may now
outweigh any benefits accrued from coming ashore further north nearer Churchill.
More detailed analyses of historical coastal survey data would provide additional insights
about the distribution of WH polar bears and facilitate testing several predictions. For example,
solitary (pregnant) adult females appear to be more constrained in where they come ashore
11
Regehr et al. (2007) also noted a shift in distribution towards the coast between 1987 to 2004, finding that within the mark-recapture study area (Area 1 in this report), bears were increasingly likely to be captured along the coast.

25
from the sea ice, likely because of the need to seek suitable denning habitat (Stirling et al.
1999). In contrast, adult males may exhibit greater flexibility in landfall location since they tend
to remain along the coast and have less specific habitat needs (Stirling et al. 2004). Indeed,
Stirling et al. (2004) documented a small yet significant difference between adult males and
solitary adult females in the mean distance between successive capture locations, indicating
that males tend to show lower fidelity. Thus, broad changes in use of summer range will likely
first be apparent in adult males.
The geographic distribution of different age, sex and reproductive classes observed during
the aerial survey (Tables 1 and 4) were consistent with patterns of spatial segregation reported
elsewhere (Derocher and Stirling 1990; Lunn et al. 1997; Towns et al. 2010). In Area 1, the
coastline was dominated by adult males, while we observed a greater balance of sex and age
classes in inland regions of Wapusk National Park, including more solitary adult females and
family groups. In contrast, the composition of bears was very similar between coastal contour
and perpendicular transects in Area 2, with adult males accounting for the vast majority of
encounters on both types of transects. The compositional similarity between Area 2’s contour
and perpendicular transects suggests that a representative demographic sample of bears in this
region can be obtained from coastal survey flights alone.
Reports that fewer adult males are occupying the coast in Area 1 (Towns et al. 2010) may
reflect a real change in population structure as a result of factors such as sex-selective
harvesting (Derocher et al. 1997; Taylor et al. 2008). However, since this observation is based
on capture data collected in Area 1, a distributional shift away from the area where capture
operations are taking place could also account for this change. We note that adult males
comprised a greater proportion of bears observed during the aerial survey in Area 2 than Area 1
(Tables 1 and 4), consistent with the hypothesis that an increasing number of adult males are
coming ashore further south in Area 2. These results are also similar to the most recent capture
sampling in southeastern WH (2003 – 2005; Table 4), but are inconsistent with previous
descriptions suggesting that the Area 2 coastline was characterised by a more balanced mix of
age, sex and reproductive classes (i.e., less adult male-dominated) than the Area 1 coast (Lunn
et al 1997).
Finally, while bears exhibit strong fidelity in late summer, harvest data suggest that there
may be differences in the geographic areas used at other times of the year by bears residing in
Area 1 in comparison to Area 2. Twenty-one bears were captured in WH from 2003 to 2005 and
subsequently harvested between 2004 and 2011, including 17 and 4 individuals captured in
Areas 1 and 2, respectively. Whereas the 17 bears from Area 1 were harvested in WH (16) and
26
Foxe Basin (1), the 4 bears from Area 2 were harvested in SH (3) and WH (1; Figure 9). These
data suggest that a re-examination of subpopulation boundaries in southern and western
Hudson Bay may be warranted.
In summary, there was no evidence indicating that polar bear distribution in Manitoba –
Ontario was unusual during the 2011 ice-free season. Thus, we suggest the high number and
proportion of bears in southeastern WH (Area 2) during 2011 accurately reflects a 40-year
trend of increasing use of this area during late summer. We hypothesize that a distributional
shift within WH, resulting from bears (particularly adult males) foraging on remnant ice floes off
the southeastern coast of WH, is a primary factor contributing to this trend.
Body Condition
Previous research has linked earlier sea ice breakup with poorer body condition in WH,
neighboring SH, and other seasonal ice subpopulations (Stirling et al. 1999; Obbard et al. 2006;
Stirling and Parkinson 2006; Rode et al. 2012). Similarly, differences in body condition between
WH and SH subpopulations have been attributed to geographic and temporal variability in sea
ice breakup and absence (Stirling et al. 1999; Obbard et al. 2006; Stirling and Parkinson 2006).
Declines in body condition were initially detected in WH (Stirling et al. 1999) before similar
changes were documented in SH (Obbard et al. 2006), reflecting general patterns of earlier sea
ice breakup and absence in WH relative to SH.
Data collected during the aerial survey suggest that the body condition indices of bears in
southeastern WH (i.e. Area 2) were comparable to or better than body conditions observed
elsewhere in WH for all sex and age classes (Table 2). The difference was particularly evident
among adult males (Table 2) and is consistent with historical records of distribution in relation
to body condition (I. Stirling, personal communication). This observation supports the
hypothesis that bears coming ashore in this region spend longer on the sea ice, presumably to
maximize foraging opportunities.
Reproduction
The aerial survey results suggest that reproductive performance in WH is relatively poor,
consistent with findings of capture-based studies (Regehr et al. 2007; N. Lunn, personal
communication). In comparison to similar aerial surveys recently conducted in the neighboring
Foxe Basin (Stapleton et al. 2011) and Southern Hudson Bay subpopulations (M. Obbard
unpublished data), as well as mark-recapture studies in other seasonal ice sub-populations,
mean litter sizes were the lowest recorded. Moreover, we documented proportionately fewer

27
cubs-of-the-year and yearlings (Table 5).12 These findings are a strong indication that WH is
currently less productive than other subpopulations in the Hudson Bay complex, and nearby
regions (Peacock et al. 2010).
Abundance of Polar Bears in Western Hudson Bay
Aerial Survey-Based Estimation
We generated an aerial survey-based abundance estimate for WH using a combination of
sampling and analytical techniques. While our results provide an estimate of current polar bear
abundance, this figure alone does not provide an indication of population status or trend.
Multiple surveys repeated at regular intervals would be required to assess trend with aerial
surveys (see also Comparison of Aerial Survey and Mark-Recapture Estimates below). The study
design, which incorporated delineation of multiple strata, perpendicular and coastal contour
transects, and sight-resight and distance sampling protocols, enabled us to achieve our target
precision level (projected coefficient of variation: 15 – 20%; actual CV: 17.2%). We note,
however, that precision in the WH aerial survey was poorer than recent FB aerial surveys
(Stapleton et al. 2011) due to highly variable encounter rates among transects (resulting from
clumped coastal distribution) and less robust detection functions (perhaps resulting from
habitat differences between the subpopulations and fewer overall encounters in WH). Greater
sampling intensity in high density regions and additional survey stratification may improve
precision in future surveys.
Abundance estimates derived from the untruncated DS datasets were consistent with
estimates based on left-truncated datasets (see also Methodological Assumptions). Similarly,
abundance estimates in which coastal bears were derived from perpendicular transects
extending through the coastal zone (i.e., distance sampling) were consistent with estimates in
which the coastal zone abundance was based on separate contour transects (i.e., sight-resight).
To incorporate uncertainty in model selection and estimated detection functions as well as
variability among techniques, we used model-averaging at multiple stages of the analyses.
While model-averaging slightly inflates precision, we believe that this procedure resulted in a
more accurate estimate.
We note that the inclusion of a separate, sight-resight estimate for bears in the coastal strip
improved overall precision. This finding is consistent with recent studies in FB (Stapleton et al.
2011). Although fewer observations were available to estimate the distance sampling detection 12
We note that differences in sampling protocols likely contributed, in part, to this finding.

28
function, the high precision of the coastal contour-derived abundance estimate (CV: 8%) offset
any reduction in precision from the exclusion of coastal zone data from DS analyses. We
additionally note that, because bears along the coast exhibited a clumped distribution,
estimating their abundance with comprehensive coastal contours facilitated the reduction of
encounter rate variability in DS analyses.
We sampled from both a helicopter and fixed wing aircraft during the aerial survey due to
logistical constraints. The 2 platforms differ in their respective benefits and limitations,
including the increased range and inclusion of a dedicated data recorder in the fixed wing
versus the increased flexibility and visibility of a helicopter. Insufficient detections from the
fixed wing compelled us to pool data from the 2 platforms in our analyses. However, our
experiences with helicopter and fixed wing surveys elsewhere suggest that pooling data from
the 2 platforms had a negligible effect on our results. The consistency in number and
distribution of sightings in Nunavut between this study (fixed wing) and previous, helicopter-
based research (Peacock and Taylor 2007; Stapleton et al. 2010a) also support this assertion.
Moreover, distance sampling models are robust to pooling of data with different detection
functions (Buckland et al. 2001). With more observations, analyses should be conducted
independently (e.g., to estimate platform-specific detection functions), or a covariate should be
incorporated to model effects of the survey platform.
Methodological Assumptions
Like other estimation methods, the ability of distance sampling to generate a reliable
abundance estimate is contingent on meeting a set of assumptions. Failure to meet these
assumptions can introduce bias and diminish the reliability of the results, depending on the
nature and extent of the violation. We attempted to minimize potential biases in the aerial
survey through our study design. Two assumptions of DS – complete detection on the transect
line (or accommodating incomplete detection through appropriate field and analytical
protocols) and random sampling with respect to the distribution of bears (in other words, bears
distributed independently of transects) – were described above. Our study design, specifically
the use of systematically spaced transects oriented against the coastal density gradient and the
analysis of coastal transects via sight-resight models rather than DS, adequately addresses
sampling assumptions. Similarly, we implemented MRDS field protocols and examined data in
both pooled (i.e., single-observer) and double-observer analyses to evaluate detection on the
line. MRDS analyses estimated 97 – 98% detection at distance 0 with the left-truncated
datasets. The consistency in results between the untruncated and left-truncated datasets
further suggests that we detected virtually all animals on the transect line (as flown) from the

29
helicopter, despite the rear observers’ blindspot. This finding is not surprising, since large white
bears are very conspicuous and readily observable against a dark landscape.
Detection of bears at their initial location (i.e., prior to any responsive movement) is another
core DS assumption (Buckland et al 2001). Because polar bears in WH have been subject to an
annual capture program over the past several decades, we anticipated that there may be some
evidence of responsive movements. However, >75% of bears sighted within 500 m of the
aircraft along perpendicular transects were stationary when first detected, and sighting
distance histograms (Figure 3) do not suggest significant responsive movement (i.e., sightings
peaked in the distance bins closest to the transect and declined thereafter). We further note
that the survey was flown at speeds much faster than a polar bear can travel, such that any
impact of movement prior to detection was likely minimal (Buckland et al. 2001).
Finally, accurate measurement of distances to sightings from the transect path is critical
(Buckland et al. 2001). We used methods adapted from Marques et al. (2006) that we
previously implemented in large-scale polar bear aerial surveys in Foxe Basin (Stapleton et al.
2011). Thus, we are confident that our measures of perpendicular distance between the aircraft
flight path and polar bears were accurate. Because our study met and evaluated fundamental
DS assumptions through proper study design and analysis, this aerial survey additionally
fulfilled the implicit assumption that polar bear distances from the transects (i.e., observed and
unobserved bears) follow a uniform statistical distribution (Fewster et al. 2008).
Abundance estimates derived from mark-recapture methods (here, sight-resight) will be
negatively biased if heterogeneity in detection probabilities is not adequately modeled. Sight-
resight methods may be particularly subject to negative bias since observations of bears
between front and rear observers were nearly instantaneous and from very similar vantage
points. In other words, sighting periods were not completely independent, such that bears with
reduced detection probabilities were less likely to be spotted by either team of observers. On
small islands, the detection of all bears within the defined strip width by front observers meant
that sight-resight analysis was unnecessary (i.e., pfront = 1). However, we estimated sighting
probalities and modeled heterogeneity for coastal contour transects (Huggins 1989, 1991). This
analysis yielded high individual detection probabilities and supported the inclusion of multiple
covariates to explain variability in detection and reduce bias. Although other unconsidered
variables may have been informative for modeling heterogeneity, our adoption of conservative
strip widths likely minimized the impacts of any unmodelled heterogeneity. Additionally, the
habitat along the coast and on small islands generally presented excellent conditions for

30
sighting bears, reducing the likelihood that a significant source of heterogeneity was not
included in modelling.
Other Potential Biases
We considered several sources of data (i.e., local knowledge, historical scientific data and
more recent scientific records) and weighed resource and logistical constraints to delineate the
extent of the study area and boundaries of survey strata. The available evidence suggests that
the defined study area encompassed nearly all bears located within the bounds of the WH
subpopulation during August, 2011. However, we note that 2 groups were sighted beyond the
inland extent of the study area in Manitoba, indicating that our delineation was not
comprehensive. Polar bears located far from the shore during the ice-free season have been
occasionally reported in the region, including a bear sighted in Shamattawa, Manitoba, some
140 km south of the mouth of the Nelson River in southern WH during 2010
(http://www.cbc.ca/news/canada/manitoba/story/2010/08/30/mb-polar-bear-shamattawa-
manitoba.html) and another sighted in northeastern Saskatchewan, more than 400 km from
the Hudson Bay coastline, during 1999 (Goodyear 2003). Such observations suggest that
additional polar bears may have been located outside the bounds of our inland sampling during
the survey, resulting in an underestimate of abundance. Although it is impossible to quantify
the extent of these occurences, we believe that the resultant negative bias would be minimal,
given other existing distribution and movement data used in study design.
Similarly, we cannot discount the presence of some bears in far offshore waters during the
survey period. Although we extended perpendicular transects over tidal flats and surveyed
during ferry flights between small islands, safety concerns and logistical efficiency precluded
systematically and intensively surveying offshore waters. Hudson Bay was completely ice-free
several weeks prior to the commencement of the aerial survey (Canadian Ice Service Weekly
Regional Ice Charts, available at http://ice-glaces.ec.gc.ca/). In Manitoba, our sampling itinerary
began at the Nunavut border and continued southward to the Ontario border, such that
southeastern Manitoba and Ontario were surveyed about 4 weeks after the last remnant ice
floes remained off the coasts there. Additionally, telemetry data indicate that bears predictably
arrive ashore about 3.5 weeks after ice breakup, defined as the date at which total ice cover
decreases to 50% (Stirling et al. 1999). Lunn et al. (1997) and Stirling et al. (1999) further report
onshore arrival dates in mid to late July during the late 1990s. Polar bears in WH remain
onshore in WH throughout the ice-free season (Stirling et al. 1977) and their movements are
markedly reduced (Parks et al. 2006). Thus, any bears swimming in WH’s offshore waters likely
represent an insignificant portion of the total population. For comparison, in recent Foxe Basin

31
aerial surveys, only 1 of 816 and 6 of 1,003 bears were observed in waters > 1 km from the
nearest land and ice during 2009 and 2010, respectively, despite significant time spent ferrying
over open water between islands, ice floes, and land (Stapleton et al. 2011).
Polar bears that are entirely hidden from observation are not incorporated in an aerial
survey abundance estimate, resulting in negative bias. In the Manitoba portions of WH, such
availability bias could arise from two sources. First, dense vegetation and small trees
encountered in inland regions may completely obscure polar bears from view. Estimated
detection functions including and excluding the coastal zone illustrate how detection changes
when it is estimated from sightings in inland areas alone versus when open coastal regions are
included (Figure 5). Not surprisingly, including habitat structure as a covariate to explain
heterogeneity in detection was supported in all datatsets. While we are unable to quantify this
potential source of availability bias, our impression was that although trees and brush impeded
detection and reduced sighting probabilities, it is likely that very few bears on or near the
transect line were completely concealed by vegetation.
Polar bears in WH, particularly pregnant females, may use earthen dens during the ice-free
season, entering them as early as August (Stirling et al. 1977; Clark et al. 1997; Clark and Stirling
1998; Lunn et al. 2004; Richardson et al. 2005). Although we cannot correct for bears that were
underground and entirely unavailable for observation during the survey, several lines of
evidence provide insight into the magnitude of this potential bias. During the survey, we
observed numerous dens, some signs of recent digging and sighted bears of various sex and
age-classes in known denning areas. However, we did not document any bears in dens or near
mouths of dens, suggesting that overall denning activity was low. Similarly, reports from the
Environment Canada capture program indicated that use of dens during August, 2011,
appeared to be very low (N. Lunn, personal communication). In addition to maternity denning,
seasonal den occupancy may serve as a means to conserve energy, thermoregulate or avoid
insects (Jonkel et al. 1972). Thus, warmer temperatures could lead to increased rates of den
occupancy. However, temperatures during the aerial survey were slightly cooler than the
s Finally,
in Manitoba, more than 50% of adult females observed from perpendicular transects were
solitary, indicating that our detection of the sex and age-class most likely to occupy dens during
the survey period was comparable to other adult female reproductive classes (Table 1).
Collectively, these pieces of evidence suggest that the prevalence of denning bears during the
2011 aerial survey was minimal. However, we acknowledge that availability bias arising from

32
bears obscured in dens or by other habitat features may have impacted our results and would
produce a negative bias in the abundance estimate.
Finally, the study period was selected, in part, because polar bears exhibit seasonal
directional movement later in the fall (Stirling et al. 1977, Derocher and Stirling 1990). In
addition, field work was completed within a narrow temporal window (Manitoba and Nunavut
WH were surveyed over 11 and 15 day periods, respectively), and the aircraft were able to
cover large expanses of land within a single day. Therefore, distributional shifts within WH
during the study period did not impact our results.
Because this study met analytical assumptions and potential sources of bias were likely
minimal, we believe that the aerial survey-based estimate of 1,000 bears (95% CI: ~715 – 1398)
accurately reflects the number of polar bears within the bounds of WH during August, 2011.
We note, however, that any biases in the aerial survey would likely result in an underestimate
of the true polar bear abundance in WH.
Comparison of Aerial Survey and Mark-Recapture Estimates
At present, we cannot directly compare estimates of abundance derived from the 2011
aerial survey with a current mark-recapture (MR) estimate13. We note that our aerial survey
abundance estimate (1,000; 95% CI: 715 – 1,398) is consistent with the 2004 MR estimate (935;
95% CI: 794 – 1,076; Regehr et al. 2007). However, analyses suggested that abundance is
declining without the additive effects of harvest (Regehr et al. 2007; Obbard et al. 2010), so an
updated MR abundance estimate is anticipated to be significantly less than the 2004 estimate.
Indeed, population simulations integrating the most recent MR estimates of WH abundance,
survival and recruitment (Regehr et al. 2007), combined with known harvest from 2004 to 2011
(GN unpublished data), project that abundance declined to around 650 (SE: 84)14 by 2011 (York
and Taylor, unpublished data).
While we are unable to undertake a comprehensive comparison of aerial survey and mark-
recapture results at present, it is informative to examine the 2 methods as they are
implemented in WH. The assumptions and potential biases of the WH aerial survey, as well as
the distribution of bears during the 2011 ice-free period, were reviewed above, leading us to
conclude that the 2011 aerial survey yielded an essentially unbiased estimate of abundance for
the entire WH subpopulation. Similarly, by assessing the assumptions of mark-recapture
13
Mark-recapture analyses incorporating data collected up to 2011 remain in progress and will yield a revised abundance estimate. 14
Simulations assume vital rates remained constant during the study period.

33
methods (as applied in WH), we can more fully evaluate potential inconsistencies in aerial
survey and capture-derived abundance estimates.
Equal probability of capture is a key assumption of capture-recapture methods. Unmodeled
heterogeneity in capture probabilities produces a negatively biased abundance estimate and
may impact vital rate estimates. Thus, obtaining a random sample of individuals that represents
the entire population of interest during capture periods (or completely modeling unequal
capture probabilities to eliminate capture heterogeneity) is necessary to generate reliable
results.
In WH, capture sampling effort historically has concentrated around Churchill and in Wapusk
National Park (e.g, Regehr et al. 2007), with limited and less frequent sampling elsewhere [e.g.,
Nunavut (Peacock and Taylor 2007) and southeastern WH (Lunn et al. 1997)]. Despite this
geographically limited sampling, WH capture analyses are considered to reflect abundance and
trends for the entire subpopulation (e.g., Obbard et al. 2010), generally under the assumption
that adequate ‘mixing’ ensures random sampling and thus estimate reliability. However,
multiple studies have reported that WH polar bears show a high degree of fidelity during the
ice-free period. Distances between successive year-to-year capture locations of individual bears
are relatively small, suggesting inter-annual fidelity to specific sites within WH during the ice-
free period (Derocher and Stirling 1990; Stirling et al. 2004). Similarly, telemetry data
demonstrate that bears exhibit high fidelity within the ice-free season, low net annual
displacement (Parks et al. 2006), and fidelity in where they come ashore (Derocher and Stirling
1990; Stirling et al. 2004). Such fidelity would seem to indicate that the allocation of sampling
effort across a limited portion of the subpopulation may subject MR methods in WH to capture
heterogeneity and associated negative biases. In short, the MR estimate may not reflect the
complete WH subpopulation, but rather a smaller area within WH.
Very low densities of WH polar bears in Nunavut during the early ice-free season (Peacock
and Taylor 2007; Stapleton et al. 2010a; this study) suggest that any bias arising from limited
sampling in this region is likely minimal. The proportion of marked bears in a recent capture
sample (Peacock and Taylor 2007) and among bears harvested in Nunavut also support this
hypothesis (Regehr et al. 2007). With respect to the limited extent of sampling in other parts of
WH, Lunn et al. (1997) reported that estimated population size did not differ based on the
inclusion or exclusion of the few capture data from southeastern WH (Area 2). However,
sampling was limited and inconsistent in this region (i.e., sampling during 1984 – 1986 and 1994
– 1995), thus limiting their inferences. In contrast, Regehr et al. (2007) noted a difference in WH
abundance estimates derived from Environment Canada (EC) data versus pooled EC – MDOC

34
capture data (point estimates: 762 versus 934), attributing this finding to undersampling of
subadults that tended to occupy areas closer to Churchill and were unavailable for capture by
EC. This finding illustrates the potential for spatial sampling issues to impact abundance
estimates in WH. Moreover, these observations seem to contrast with the assumption that
research focused in the core study area yields a random sample of individuals within WH.
The high density of bears residing along the coast of southeastern WH during the ice-free
season may present particular challenges with MR estimation, given the limited sampling there
and the tendency for bears to exibit fidelity to specific sites. Little is known about the
movements of bears in this region. However, several peices of evidence suggest that
individuals coming ashore in southeastern WH may be unavailable for MR sampling or have
significantly lower capture probabilities when sampling is restricted to the EC core study area
(Area 1). Data from 2003 - 2005 (when sampling last took place in southeastern WH) indicate
that 9 of 50 bears first handled in Area 2 during 2003 – 2004 were recaptured in WH the
following year; although >4 times more total captures occurred in Area 1, 8 of these 9 bears
were recaptured in Area 2 (N. Lunn, unpublished data). This finding suggests strong fidelity of
bears to southeastern WH. Additionally, studies focused around Churchill and in Wapusk
National Park indicate that movement rates during the ice-free period are relatively low (Parks
et al. 2006), and that a general northward movement of bears does not ocurr until late fall,
prior to freeze-up (Stirling et al. 1977; Derocher and Stirling 1990; Stirling et al. 2004). If bears in
southeastern WH exibit similar movement patterns,they may be present in Area 2 at the time
MR sampling is occuring and therefore unavailable for capture if sampling is restricted to Area
115. The hypothesized distributional shift towards southeastern WH may further compound
sampling issues. Increasing numbers of individuals coming ashore in Area 2 may result in
exclusion of a larger segment of the population from MR estimates.
A thorough assessment of WH subpopulation status and trend will require the completion of
MR analyses and consideration of all WH data (e.g., litter sizes, survival rates) as well as aerial
survey and other data for SH. At present, we can conclude that although the 2011 aerial survey
abundance estimate is consistent with the MR estimate from 2004 (Regehr et al. 2007), it is not
consistent with the predicted continued decline based on vital rates (Regehr et al. 2007) nor
projected abundance derived from simulations using MR-based estimates (York and Taylor,
unpublished data).
Additionally, the aerial survey results raise questions about the underlying assumptions
associated with mark-recapture as applied in WH. Specifically, we are uncertain that sampling
15
Mark-recapture sampling typically occurs in late August and September

35
within a core study site (i.e., the Environment Canada study area) facilitates random sampling
of bears from across the wider WH subpopulation, given the widespread documentation of
fidelity during the ice-free season and the significant number of bears summering in
southeastern WH. Failure to meet assumptions of random sampling or adequately model the
associated capture heterogeneity would yield a negatively biased abundance estimate. Thus,
incomplete sampling across the entire subpopulation likely resulted in an underestimate of
abundance, or an abundance estimate that does not pertain to the entire subpopulation.
Negative bias in previous MR abundance estimates does not necessarily negate the long-
term declining trends in vital rates, reproductive output and body condition observed in WH
(Stirling et al. 1999; Regehr et al. 2007). Earlier MR abundance estimates also may have been
subject to negative bias due to limited spatial sampling, and the aerial survey results may
simply adjust the WH abundance baseline. However, the hypothesized distributional shift
towards southeastern WH and lack of sampling there could further bias abundance, vital rate
estimates and other measures of status.
On-going Analyses and Recommendations
The primary objective of this study was to generate an aerial survey-based abundance
estimate. However, aerial surveys provide a wealth of ancillary data that can further inform
status assessment and address other ecological and management questions. The WH data are
being integrated into a broader analysis including Foxe Basin aerial survey data to investigate
environmental (e.g., habitat features, ice breakup and absence), anthropogenic (e.g., proximity
to communities) and ecological (e.g., proximity to conspecifics, segregation of family groups
from solitary bears) determinants of polar bear distribution during the ice-free season. Such
information may be useful in developing future study designs, informing environmental impact
assessments and mitigating potential human – wildlife conflicts. Body condition indices will
similarly be examined with respect to ice breakup and absence.
Additionally, an aerial survey was completed in the Ontario portion of the Southern Hudson
Bay subpopulation (SH) during September, 2012 (Obbard et al. unpublished data). Analyses are
currently in progress, with results anticipated by late spring, 2012. Although existing data
suggest that nearly all SH polar bears spend the ice-free season in Ontario (M. Obbard, personal
communication), a complementary survey is scheduled for Quebec portions of SH during late
summer, 2012. Combined, the SH and WH surveys, as well as the recent Foxe Basin study, will
provide a comprehensive picture of polar bear abundance in the Hudson Bay complex.

36
Our results suggest that aerial surveys provide an effective means to estimate polar bear
abundance in seasonally ice-free subpopulations. Given the recent changes in Hudson Bay sea
ice (Gough et al. 2004; Gagnon and Gough 2005) and associated impacts on body condition and
vital rates (e.g., Stirling et al. 1999; Regehr et al. 2007), regular monitoring of subpopulations in
the Hudson Bay complex will be critical to document changes in abundance, distribution and
demographics and inform management regimes. Our preliminary recommendation is that no
more than 5 years elapse between successive surveys to minimize potential negative impacts of
over-harvest in a reduced population. To better construct a future monitoring program, WH will
be analyzed alongside FB aerial survey data to evaluate the sampling intensity required to
achieve target levels of precision. We will also use these datasets to conduct a power analysis
to assess our ability to detect changes in abundance. We note that our statistical power will be
reduced in comparison to recent work in FB (Stapleton et al. 2011) due to the lower precision in
the WH survey. Finally, resource constraints are an important consideration of a long-term
monitoring program. Because they require only a single research season to generate an
abundance estimate, aerial surveys are a competitive monitoring method for abundance
estimation in terms of financial investment. However, capture-based studies are still required
to estimate vital rates and also facilitate other research objectives.
The WH aerial survey identified key topics that warrant additional study. Specifically, how
bears located in the southeastern portion of WH fit into greater Hudson Bay population
dynamics remains uncertain. We recommend multiple lines of research to address related
questions. First, a telemetry program will be required to assess movements of bears in
southeastern WH, update subpopulation delineation between SH and WH and evaluate the
extent and use of potential denning areas. Second, the Environment Canada capture and
tagging program should be extended across the entire WH subpopulation to ensure that
potential capture heterogeneity is minimized (or can be adequately modeled), increasing
confidence in estimated abundance and vital rates. Inclusion of the entire region in capture
work will additionally yield more detailed information on demographics and body condition.
Finally, more detailed analyses of Manitoba Conservation’s annual coastal surveys, including an
assessment of patterns of sea ice breakup, will quantify the occurrence, magnitude, and
potential drivers of any distributional shifts in WH.
ACKNOWLEDGMENTS

37
Financial support for the survey was provided by the Government of Nunavut (Department
of Environment), Environment Canada, the Nunavut Wildlife Management Board, and the
Nunavut General Monitoring Program (on behalf of Aboriginal Affairs and Northern
Development Canada). In-kind support was received from Manitoba Conservation, Parks
Canada and the Ontario Ministry of Natural Resources. S. Stapleton received additional support
from the Conservation Biology Program, University of Minnesota.
The authors wish to thank Mitch Campbell (GN Dept. Of Environment), Leah Muckpah, Leo
Ikakhik and Peter Mikeeuneak (Arviat HTO), Norman Ford, Tommy Kabuitok and Ralph Nukitut
(Rankin HTO), Joe Savikataaq, Jack Badstowe (Manitoba Conservation), Rodney Redhead (Parks
Canada) and Johnathan Talon (Hudson Bay Helicopters) for their work as observers and data
collectors during the survey.
Input on survey design was provided by members of the Arviat, Rankin Inlet, Whale Cove
Hunting and Trapping Organziations who attended a workshop in Churchill in July 2010 and at
the Kivalliq Wildlife Board in June 2011. David Lee and Bert Dean (Nunavut Tunngavik
Incorporated) also contributed to survey design.
Todd Arnold, Ian Stirling and an anonymous reviewer independently reviewed and provided
useful comments on earlier drafts of the report.
The survey was carried out under research permits from Parks Canada (Wapusk National
Park Research and Collection Permit #WAP-2011-8340), Government of Nunavut (Wildlife
Research Permit # 2011-040), and the University of Minnesota’s Institutional Animal Care and
Use Committee (Permit No. 0907A68891).
LITERATURE CITED Amstrup, S.C. 1993. Human disturbances of denning polar bears in Alaska. Arctic 46:246-250.
Amstrup, S.C., B.G. Marcot, and D.C. Douglas. 2008. A Bayesian network modeling approach to
forecasting the 21st century worldwide status of polar bears. Pp. 213-268 In: E.T. DeWeaver,
C.M. BItz and L.B. Tremblay, eds. Arctic Sea Ice Decline: Observations, Projections,
Mechanisms and Implications. Geophysical Monograph 180. American Geophysical Union,
Washington, DC.
Atkinson, S.N. and M.A. Ramsay 1995. The effects of prolonged fasting of the body composition
and reproductive success of female polar bears (Ursus maritimus). Functional Ecology 9: 559-
567.

38
Borchers, D.L., J.L. Laake, C. Southwell, and C.G.M. Paxton. 2006. Accommodating unmodeled
heterogeneity in double-observer distance sampling surveys. Biometrics 62:372-378.
Buckland, S.T., D.R. Anderson, K.P. Burnham, J.L. Laake, D.L. Borchers, and L. Thomas. 2001.
Introduction to Distance sampling: Estimating abundance of biological populations. Oxford
Univ. Press, Oxford, UK. 432 pp.
Burnham, K. P., and D. R. Anderson. 2002. Model selection and multimodal inference : a
practical information-theoretic approach. Springer, New York.
Clark, D.A., I. Stirling, and W. Calvert. 1997. Distribution, characteristics, and use of earth dens
and related excavations by polar bears on the Western Hudson Bay lowlands. Arctic 50: 158-
166.
Clark, D.A. and I. Stirling. 1998. Habitat preferences of polar bears in the Hudson Bay Lowlands
during late summer and fall. Ursus 10: 243-250.
COSEWIC. 2008. COSEWIC assessment and update status report on the polar bear (Ursus
maritimus in Canada. Committee on the Status of Endangered Wildlife in Canada, Ottawa. Vi
+29pp.
Crompton, A. E., M.E. Obbard, S.D. Petersen, and P.J. Wilson. 2008. Population genetic
structure in polar bears (Ursus maritimus) from Hudson Bay, Canada: Implications for future
climate change. Biological Conservation 141: 2528-2539.
Derocher, A.E. and I. Stirling. 1990. Distribution of polar bears (Ursus maritimus) during the ice-
free period in western Hudson Bay. Human Dimensions of Wildlife 68: 1395-1403.
Derocher, A.E. and I. Stirling. 1995a. Estimation of polar bear population size and survival in
western Hudson Bay. Journal of Wildlife Management 59:215-221.
Derocher, A.E. and I. Stirling. 1995b. Temporal variation in reproduction and body mass of polar
bears in western Hudson Bay. Human Dimensions of Wildlife 73:1657-1665.
Derocher, A.E., I. Stirling, and W. Calvert. 1997. Male-biased harvesting of polar bears in
western Hudson Bay. Journal of Wildlife Management 61:1075-1082.
Dowsley, M., and M.K. Taylor. 2006. Management consultations for the Western Hudson Bay
(WH) polar bear population (01-02 December, 2005). Government of Nunavut, Department
of Environment, Final Wildlife Report 3, Iqaluit, NU. 55 pp.

39
Dyck, M.G., W. Soon, R.K. Baydack, D.R. Legates, S. Baliunas, T.F. Ball, and L.O. Hancock. 2007.
Polar bears of western Hudson Bay and climate change: Are warming spring air
temperatures the “ultimate” survival control factor? Ecological Complexity 4:73-84.
Fewster, R., C. Southwell, D. Borchers, S. Buckland and A. Pople. 2008. The influence of animal
mobility on the assumption of uniform distances in aerial line-transect surveys. Wildlife
Research 35:275-288.
Gagnon, A.S., and W.A. Gough. 2005. Trends in the dates of ice freeze-up and breakup over
Hudson Bay, Canada. Arctic 58:370-382.
Goodyear, M. 2003. Extralimital sighting of a polar bear, Ursus maritimus, in Northeast
Saskatchewan. The Canadian Field-Naturalist 117:648-649.
Gough, A.S., A.R. Cornwell, and L.J.S Tsuji. 2004. Trends in seasonal sea ice duration in
southwestern Hudson Bay. Arctic 57:299-305.
Huggins, R. 1989. On the statistical analysis of capture experiments. Biometrika 76:133-140.
Huggins, R. 1991. Practical aspects of a conditional likelihood approach to capture experiments.
Biometrics 47:725-732.
Innes, S., M.P. Heide-Jørgensen, J.L. Laake, K.L. Laidre, H.J. Cleator, P. Richard, P. and R.E.A.
Stewart. 2002. Surveys of belugas and narwals in the Canadian High Arctic in 1996.
NAMMCO Scientific Publications 4:169-190.
Jonkel, C.J., G.B. Kolenosky, R.J. Robertson, and R.H. Russell. 1972. Further notes on polar bear
denning habits. International Conference on Bear Research and Management 2:142–158.
Kolenosky, G.B., Abraham, K.F., and Greenwood, C.J. 1992. Polar bears of southern Hudson Bay.
Polar Bear Project, 1984-88, Final Report, Ontario Ministry of Natural Resources, Maple,
Ontario.
Laake, J. and D. Borchers. 2004. Methods for incomplete detection at distance zero. Pp. 108-
189 In: S. Buckland, D. Anderson, K. Burnham, J. Laake, D. Borchers, and L. Thomas, eds.
Advanced Distance Sampling, Oxford: Oxford University Press.
Lie, E., H.J.S. Larsen, S. Larsen, G.M. Johansen, A.E. Derocher, N.J. Lunn, et al. 2005. Does high
organochlorine (OC) exposure impair the resistance to infection in polar bears (Ursus
maritimus)? Part II: Possible effects of OCs on mitogen and antigeninduced lymphocyte
proliferation. J. Toxicol. Environ. Health A 68:457-484.

40
Lunn, N.J., I. Stirling, D. Andriashek, and G.B. Kolenosky. 1997. Re-estimating the size of the
polar bear population in western Hudson Bay. Arctic 50: 234-240.
Lunn, N.J., I. Stirling, D. Andriashek, and E. Richardson. 2004. Selection of maternity dens by
female polar bears in western Hudson Bay. Polar Biol. 7:350–356.
Marques, F. F. C., and S. Buckland. 2003. Incorporating covariates into standard line transect
analyses. Biometrics 59:924–935.
Marques, T., M. Andersen, S. Christensen-Dalsgaard, S. Belikov, A. Boltunov, Ø. Wiig, S.
Buckland, and J. Aars. 2006. The use of global positioning systems to record distances in a
helicopter line-transect survey. Wildlife Society Bulletin 34:759-763.
Messier, F. 2000. Effects of capturing, tagging, and radiocollaring polar bears for research and
management purposes in Nunavat and NWT. Department of Biology, University of
Saskatchewan, Saskatoon, SK. 64 pp.
Norstrom, R.J., S.E. Belikov, E.W. Born, G.W. Garner, B. Malone, S. Olpinski, M.A. Ramsay, S.L.
Schliebe, I. Stirling, M.S. Stishov, M.K. Taylor, and O. Wiig. 1998. Chlorinated hydrocarbon
contaminants in polar bears from Eastern Russia, North America, Greenland, and Svalbard:
biomonitoring of Arctic pollution. Archives of Environmental Contamination and Toxicology
35: 354-367.
Nunavut Wildlife Management Board. 2007 West Hudson Bay polar bear population total
allowable harvest. Record of Decision. 37pp.
Obbard, M.E., M.R.L. Cattet, T. Moody, L.R. Walton, D. Potter, J. Inglis, and C. Chenier. 2006.
Temporal trends in the body condition of Southern Hudson Bay polar bears. Climate Change
Research Information Note, No. 3. Applied Research and Development Branch, Ontario
Ministry of Natural Resources, Sault Ste. Marie, ON.
Obbard, M.E., T.L. McDonald, E.J. Howe, E.V. Regehr, and E.S. Richardson. 2007. Trends in
abundance and survival for polar bears from Southern Hudson Bay, Canada, 1984–2005.
USGS Alaska Science Center, Anchorage, Administrative Report. 36 pp.
Obbard, M.E., G.W. Thiemann, E. Peacock, and T.D. DeBruyn (eds). 2010. Polar Bears:
Proceedings of the 15th Working Meeting of the IUCN/SSC Polar Bear Specialist Group,
Copenhagen, Denmark, 29 June–3 July 2009. Gland, Switzerland and Cambridge, UK: IUCN.
vii + 235 pp.
Paetkau, D., W. Calvert, I. Stirling, and C. Strobeck. 1995. Microsatellite analysis of population
structure in Canadian polar bears. Molecular Ecology 4: 347-354.

41
Paetkau, D., S.C. Amstrup, E.W. Born, W. Calvert, A.E. Derocher, G.W. Garner, F. Messier, I.
Stirling, M.K. Taylor, O. Wiig, and C. Strobeck. 1999. Genetic structure of the world's polar
bear populations. Molecular Ecology 8: 1571-1584.
Parks, E.K., A.E. Derocher, and N.J. Lunn. 2006. Seasonal and annual movement patterns of
polar bears on the sea ice of Hudson Bay. Canadian Journal of Zoology-Revue Canadienne de
Zoologie 84: 1281-1294.
Peacock, E., and M.K. Taylor. 2007. Polar bears of western Hudson Bay: survey extension
investigation. NWMB Project # 2-07-19, Igloolik, NU. 16 pp.
Peacock, E., M.K. Taylor, J. Laake, I. Stirling (In Review). Population ecology of polar bears in
Davis Strait, Canada and Greenland. Journal of Wildlife Management.
Peacock, E., A.E. Derocher, N.J. Lunn, and M.E. Obbard. 2010. Polar bear ecology and
management in Hudson Bay in the face of climate change. In: A Little Less Arctic: Top
Predators in the World’s Largest Northern Inland Sea, Hudson Bay. S.H. Ferguson (ed). Xx
pp.
Pollock, K. and W. Kendall. 1987. Visibility bias in aerial surveys: a review of estimation
procedures. Journal of Wildlife Management 51:502-510.
Powell, L. 2007. Approximating variance of demographic parameters using the delta method: A
reference for avian biologists. The Condor 109:949-954.
Ramsay, M.A. and I. Stirling. 1986. Long-term effects of drugging and handling free-ranging
polar bears. Journal of Wildlife Management 50: 619-626.
Ramsay, M.A. and I. Stirling. 1990. 1990. Fidelity of polar bears to winter den sites. Journal of
Mammalogy 71:233-236.
Regehr, E.V., N.J. Lunn, S.C. Amstrup, and I. Stirling. 2007. Effects of earlier sea ice breakup on
survival and population size of polar bears in western Hudson bay. Journal of Wildlife
Management 71: 2673-2683.
Richardson, E., I. Stirling, and D.S. Hik. 2005. Polar bear (Ursus maritimus) maternity denning
habitat in western Hudson Bay: a bottom-up approach to resource selection functions.
Canadian Journal of Zoology-Revue Canadienne de Zoologie 83: 860-870.
Rode, K. D., E. Peacock, M. K. Taylor, I. Stirling, E. W. Born, K. L. Laidre, and O. Wiig. 2012. A tale
of two polar bear populations (Ursus maritimus): ice habitat, harvest, and body condition.
Population Ecology 54:3-18.

42
Scott, J.B.T. and G.J. Marshal. 2010. A step change in the date of sea-ice break-up in Western
Hudson Bay. Arctic 63: 155-164.
Stapleton, S., S. Atkinson and D. Garshelis. 2010a. Western Hudson Bay polar bear aerial survey,
2010 Pilot Project Report. Government of Nunavut. 6 pp.
Stapleton, S., T. Arnold, S. Atkinson and D. Garshelis. 2010b. Baffin Bay polar bear aerial survey:
Pilot results and research alternatives. Unpublished report to project collaborators:
Government of Nunavut, Greenland Institute of Natural Resources, Qikiqtarjuaq HTO, and
the University of Minnesota: 23 pp.
Stapleton, S., E. Peacock, and D. Garshelis. 2011. Aerial survey estimation of abundance for
polar bears during the ice-free season. 20th International Conference on Bear Research and
Management. Ottawa, Ontario, Canada.
Stirling, I., C. Jonkel, P. Smith, R. Robertson, and D. Cross. 1977. The ecology of the polar bear
(Ursus maritimus) along the western coast of Hudson Bay. Occ. Pap. No. 33, Canadian
Wildlife Service, Ottawa, ON.
Stirling, I., N.J. Lunn, and J. Iacozza. 1999. Long-term trends in the population ecology of polar
bears in Western Hudson Bay in relation to climatic change. Arctic 52:294-306.
Stirling, I., N.J. Lunn, J. Iacozza, C. Elliott, and M. Obbard. 2004. Polar bear distribution and
abundance on the Southwestern Hudson Bay Coast during open water season, in relation to
population trends and annual ice patterns. Arctic 57: 15-26.
Stirling, I. and C.L. Parkinson. 2006. Possible effects of climate warming on selected populations
of polar bears (Ursus maritimus) in the Canadian Arctic. 59 ed. pp. 261-275.
Stirling, I., A. Derocher, K. Rode, and W. Gough. 2008a. Response to Dyck et al. (2007) on polar
bears and climate change in western Hudson Bay. Ecological Complexity 5:193-201.
Stirling, I., G. W. Thiemann, and E. Richardson. 2008b. Quantitative support for a subjective
fatness index for immobilized polar bears. Journal of Wildlife Management 72:568-574.
Taylor, M.K. and L.J. Lee. 1995. Distribution and abundance of Canadian polar bear populations:
a management perspective. Arctic 48: 147-154.
Taylor, M.K., S. Akeeagok, D. Andriashek, W. Barbour, E.W. Born, W. Calvert,, H.D. Cluff, S.H.
Ferguson, J. Laake, A. Rosing-Asvid, I. Stirling, and F. Messier. 2001. Delineating Canadian
and Greenland polar bear (Ursus maritimus) populations by cluster analysis of movements.
Human Dimensions of Wildlife 79: 690-709.

43
Taylor, M. K., P.D. McLoughlin, & F. Messier. 2008. Sex-selective harvesting of polar bears.
Wildlife Biology 14: 217-226.
Thiemann, G.W., S.J. Iverson, and I. Stirling. 2008. Polar bears diets and arctic marine food
webs: Insights from fatty acid analysis. Ecological Monographs 78: 591-613.
Thomas, L., J. Laake, E. Rexstad, S. Strindberg, F.F.C. Marques, S. Buckland, S.T., D. Borchers, D.
Anderson, K. Burnham, M. Burt, S. Hedley, J. Pollard, J. Bishop, and T. Marques. 2009.
Distance 6.0. Release “2”. Research Unit for Wildlife Population Assessment, University of St.
Andrews, UK. http://www.ruwpa.st-and.ac.uk/distance/
Towns, L., A.E. Derocher, I. Stirling, N.J. Lunn, and D. Hedman. 2009. Spatial and temporal
patterns of problem bears in Churchill, Manitoba. Polar Biology. 32: 1529-1537.
Towns, L., A.E. Derocher, I. Stirling, and N.J. Lunn. 2010. Changes in land distribution of polar
bears in Western Hudson Bay. Arctic 63: 206-212.
Tyrrell, M. 2006. More bears, less bears: Inuit and scientific perceptions of polar bear
populations on the west coast of Hudson Bay. Journal of Inuit Studies 30: 191–208.
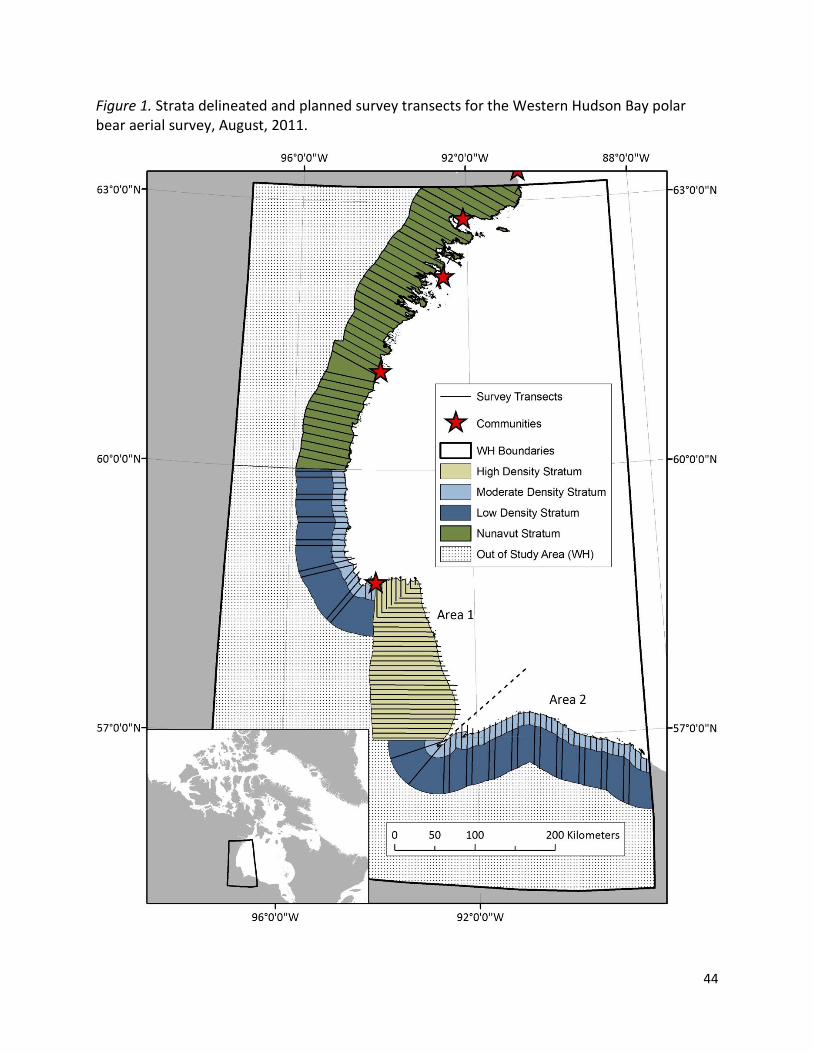
44
Figure 1. Strata delineated and planned survey transects for the Western Hudson Bay polar bear aerial survey, August, 2011.

45
Figure 2. The Western Hudson Bay polar bear aerial survey included sampling from perpendicular transects and independent, coastal contour transects. Because perpendicular transects extended through the coastal zone, bears near the shoreline could be sighted from both perpendicular and contour transects.

46
Figure 3. Histograms showing the distribution of sightings from the original transect line for sightings of polar bears from perpendicular transects during the Western Hudson Bay aerial survey, August, 2011. All strata are pooled. (a) All sightings, including perpendicular transects extending through the coastal zone. (b) Only sightings inland of the coastal zone. (a)
(b)
0
5
10
15
20
25
30
35
Gro
up
s O
bse
rved
Distance from Transect (m)
0
2
4
6
8
10
12
14
16
18
Gro
up
s O
bse
rved
Distance from Transect (m)

47
Figure 4. Polar bear sightings recorded during the Western Hudson Bay aerial survey, August, 2011.

48
Figure 5. Polar bear observations and transects flown during the 2010 pilot aerial survey in Nunavut.
49
Figure 6. Detection functions estimated from polar bear sightings during the Western Hudson Bay aerial survey, August, 2011. Data are from untruncated transects, and all strata are pooled. The blue line illustrates the average detection function (based on observed covariates) from the most highly supported model including perpendicular transect data from the coastal zone. The yellow line represents the average detection function from the most supported model excluding perpendicular transect data from the coastal zone.
0
0.2
0.4
0.6
0.8
1
0 200 400 600 800 1000 1200 1400
Det
ecti
on
Pro
bab
ility
Distance from Transect (m)

50
Figure 7. Polar bear counts from coastal surveys conducted between August 15 and September 15 from 1970 to 2011 in Western Hudson Bay in: (a) the area extending from Churchill to the Nelson River (approximating Area 1 in this study); and (b) the area extending from the Nelson River to the Manitoba – Ontario border (Manitoba Department of Conservation unpublished data; Stirling et al. 2004; Area 2). The observations from this survey, including all bears sighted along the coast and on small islands during the coastal contour transects, are denoted by red squares. The 2011 transects were flown on August 15 and August 21 – 24. (a)
(b)
0
20
40
60
80
100
120
140
160
180
200
1970 1975 1980 1985 1990 1995 2000 2005 2010
Nu
mb
er
of
be
ars
Year
0
20
40
60
80
100
120
140
160
180
200
1970 1975 1980 1985 1990 1995 2000 2005 2010
Nu
mb
er
of
be
ars
Year

51
Figure 8. Polar bear counts from coastal surveys in the Manitoba portion of Western Hudson Bay, extending from the Manitoba – Ontario border to Churchill (Manitoba Department of Conservation unpublished data; Stirling et al. 2004). The red diamond represents 2011 aerial survey data gathered from coastal contour transects in the same area.
0
50
100
150
200
250
300
1970 1975 1980 1985 1990 1995 2000 2005 2010
Nu
mb
er
of
be
ars
Year

52
Figure 9. Harvest recovery locations of polar bears tagged in Areas 1 and 2 during 2003 – 2005.

53
Table 1. Polar bears sighted in Manitoba and Ontario on coastal contour transects (including small islands) and perpendicular transects during the WH aerial survey, conducted during August, 2011. All bears included in distance sampling analyses, plus 2 far inland (out of study area) groups and 5 groups sighted during repeat flights of transects, are included with perpendicular transect data. Area 1 extends from the Nunavut – Manitoba border to the Nelson River, approximating Environment Canada’s long-term study area and Stirling et al.’s (2004) Area 5. Area 2 extends from the Nelson River eastward to the WH border, similar to Stirling et al. (2004)’s Area 4. Twenty-seven and 88 bears were sighted on coastal transects north of Churchill and east of the Manitoba - Ontario border, respectively [i.e., outside the bounds of zones sampling in Stirling et al. (2004)].
Age/Sex/Reproductive Status Coastal contours
Perpendicular transects
Area 1 Area 2 Area 1 Area 2
Adult males 93 136 35 43
Adult females: Solitary 15 9 24 4
w/ cubs of the year 6 5 15 4
w/ yearlings 3 7 4 3
Sub-adults 47 39 28 14
Unknown sex and age-class 3 5 0 3
Cubs of the year 11 6 21 5
Yearlings 4 9 4 3
Total 182 216 131 79

54
Table 2. Body condition index scores (1 – 5; Stirling et al. 2008b) of polar bears sighted in Manitoba on coastal contour transects (including small islands) and perpendicular transects during the WH aerial survey, August, 2011. All bears included in DS analyses, plus 2 far inland (out of study area) groups and 5 groups sighted during repeat flights of transects, are included with perpendicular transect data. Area 1 extends from the Nunavut – Manitoba border to the Nelson River, approximating Environment Canada’s long-term study area and Stirling et al.’s (2004) Area 5. Area 2 extends from the Nelson River eastward to the WH border, similar to Stirling et al. (2004)’s Area 4. Twenty-seven and 88 bears were sighted on coastal transects north of Churchill and east of the Manitoba – Ontario border, respectively [i.e., outside the bounds of zones defined in Stirling et al. (2004)]. Data are presented as mean (sample size, standard deviation).
Age/Sex/Reproductive Status Coastal Contours
Inland Transects
Area 1 Area 2 Area 1 Area 2
Adult males 2.95 (93, 0.33) 3.47 (136, 0.35)
3.07 (35, 0.35) 3.41 (43, 0.35)
Adult females: Solitary 3.37 (15, 0.61) 3.78 (9, 0.62)
4.02 (24, 0.60) 4.13 (4, 0.63)
w/ cubs of the year 3.0 (6, 0) 3.3 (5, 0.27)
3.1 (15, 0.21) 3.0 (4, 0)
w/ yearlings 3.0 (3, 0) 3.08 (7, 0.20)
3.25 (4, 0.29) 3.0 (3, 0)
Sub-adults 2.99 (47, 0.07) 3.04 (39, 0.13)
2.84 (28, 0.51) 3.11 (14, 0.21)
Unknown sex and age-class 3.25 (2, 0.35) 3.0 (5, 0)
N/A 3.33 (3, 0.58)
Cubs of the year 3.0 (11, 0) 3.17 (6, 0.26)
3.03 (20, 0.11) 3.0 (5, 0)
Yearlings 3.0 (4, 0) 3.06 (9, 0.18)
3.25 (4, 0.29) 3.0 (3, 0)

55
Table 3. Summary of most supported models (ΔAIC < 2) for distance sampling analyses of the WH polar bear aerial survey, conducted during August, 2011. In the column Model, the first term signifies the key function and subsequent terms represent covariates (Struc = Habitat structure within a 30 m radius of the polar bear; Vis = visibility).
Dataset Model ΔAIC Parameters Global density
1
(bears per km2)
Coefficient of
variation (%)
All Inland Sightings,
Untruncated transect Half-normal / Struc + Vis 0.000 3 0.011 17.6
Hazard / Struc + Vis 0.106 4 0.013 20.7
All Inland Sightings,
Left-truncated transect
Half-normal / Struc + Vis 0.000 3 0.11 18.5
Hazard / Struc + Vis 0.593 4 0.13 22.5
Sightings excluding coastal
zone, Untruncated transect Half-normal / Struc + Vis 0.000 3 0.007 20.3
Hazard / Vis 0.331 3 0.008 23.3
Hazard / Struc + Vis 1.030 4 0.008 24.2
HN / Vis 1.059 2 0.007 18.8
HN / Struc 1.630 2 0.007 20.0
Sightings excluding coastal
zone, Left-truncated
transect
Half-normal / Struc 0.000 2 0.006 21.5
Half-normal / Struc + Vis 1.301 3 0.006 21.6
1Global density estimates refer to density within the region estimated by distance sampling. For example, datasets excluding sightings in the coastal strip do not incorporate those bears in the global density estimate.

56
Table 4. Proportion of polar bears in different sex and age classes within Areas 1 and 2 of WH as observed during the 2011 aerial survey and as captured during Environment Canada research 2003-05.
Age/Sex Class
Area 1 Area 2
2011 Aerial Survey EC Captures1
(2003-05)
2011 Aerial Survey EC Captures1
(2003-05) Coastal Transects
Perpendicular Transects
Coastal Transects
Perpendicular Transects
Adult Males 0.51 0.27 0.28 0.63 0.54 0.60
Family Groups 0.13 0.34 0.46 0.13 0.19 0.12
Other 0.36 0.39 0.26 0.24 0.27 0.28 1 N=373 and 73 for Areas 1 and 2 respectively.

57
Table 5. Polar bear litter sizes and number of dependent offspring observed (as proportion of total observations) during recent ice-free season studies in central and eastern Canada. Data are presented as mean (standard error).
Subpopulation Litter Size
Proportion of Total Observations Source
Cubs of the year Yearlings Cubs of the year Yearlings
Western Hudson Bay (2011)
1.43 (0.08) 1.22 (0.10) 0.07 0.03 This report
Southern Hudson Bay (2011)
1.56 (0.06) 1.54 (0.08) 0.16 0.12 M. Obbard
(unpublished data)
Baffin Bay (2011) 1.57 (0.06) 1.51 (0.09) 0.19 0.10 GN (unpublished
data)
Foxe Basin (2009-2010)
1.54 (0.04) 1.48 (0.05) 0.13 0.10 Stapleton et al.
(2011)
Davis Strait (2005-2007)
1.49 (0.15) 1.22 (0.28) 0.08 0.09 Peacock et al. (In
Review)