western port local coastal hazard assessment - seccca · report western port local coastal hazard...
TRANSCRIPT

Western Port Local Coastal Hazard Assessment
Report 1 (R01) – Summary Report
September 2014

Melbourne Water 2548-01R01v07
2548-01 / R01 V07 - 04/09/2014 ii
DOCUMENT STATUS
Version Doc type Reviewed by Approved by
Distributed to Date issued
V01 Draft CLA CLA Melbourne Water, DEPI 12/12/2013
V02 Draft PSG CLA Melbourne Water, DEPI, PSG 14/02/2014
V03 Draft Kristina Sestokas CLA Melbourne Water, DEPI, PSG 17/02/2014
V04 Draft Kristina Sestokas CLA Melbourne Water, DEPI, PSG 20/02/2014
V05 Final Kristina Sestokas CLA Melbourne Water, DEPI, PSG 18/07/2014
V06 Final Kristina Sestokas CLA Melbourne Water, DEPI, PSG 14/08/2014
V07 Final Kristina Sestokas CLA Melbourne Water, DEPI, PSG 04/09/2014
PROJECT DETAILS
Project Name 2548-01R01v07
Client Melbourne Water
Client Project Manager Kristina Sestokas
Water Technology Project Manager Christine Lauchlan Arrowsmith
Report Authors Christine Lauchlan Arrowsmith, Tim Womersley
Job Number 2548-01
Report Number R01
Document Name 2548-01R01v07_Summary
Cover Photo: Tooradin Boat Ramp
Copyright
Water Technology Pty Ltd has produced this document in accordance with instructions from Melbourne Water for their use only. The concepts and information contained in this document are the copyright of Water Technology Pty Ltd. Use or copying of this document in whole or in part without written permission of Water Technology Pty Ltd constitutes an infringement of copyright.
Water Technology Pty Ltd does not warrant this document is definitive nor free from error and does not accept liability for any loss caused, or arising from, reliance upon the information provided herein.
15 Business Park Drive
Notting Hill VIC 3168
Telephone (03) 8526 0800
Fax (03) 9558 9365
ACN No. 093 377 283
ABN No. 60 093 377 283

Melbourne Water 2548-01R01v07
2548-01 / R01 V07 - 04/09/2014 iii
TABLE OF CONTENTS
1. Introduction .................................................................................................................. 1
1.1 Background .............................................................................................................................. 1
1.2 Scope ....................................................................................................................................... 1
1.3 Governance ............................................................................................................................. 2
1.4 Project Team ............................................................................................................................ 3
1.5 Reporting ................................................................................................................................. 3
2. Study Area Context ........................................................................................................ 5
2.1 Geology and Geomorphology.................................................................................................. 5
2.2 Peripheral Vegetation Communities ....................................................................................... 5
2.3 Other Coastal Structures ......................................................................................................... 6
2.4 Hydrodynamic Setting ............................................................................................................. 6
3. The Main Findings – Broad Scale .................................................................................... 9
3.1 Overview .................................................................................................................................. 9
3.2 Inundation Hazards ................................................................................................................. 9
3.2.1 Introduction ............................................................................................................................. 9
3.2.2 Key Findings ........................................................................................................................... 10
3.3 Shoreline Erosion Hazards ..................................................................................................... 11
3.3.1 Introduction ........................................................................................................................... 11
3.3.2 Key Findings ........................................................................................................................... 15
3.4 Uncertainty & Assumptions ................................................................................................... 20
3.4.1 Uncertainties ......................................................................................................................... 20
3.4.2 Assumptions .......................................................................................................................... 21
3.5 Recommendations ................................................................................................................. 23
3.5.1 Inundation Hazard Assessments ........................................................................................... 23
3.5.2 Erosion Hazard Assessments ................................................................................................. 24
4. The Main Findings - Representative Locations .............................................................. 27
4.1 Overview ................................................................................................................................ 27
4.2 Location Specific Findings ...................................................................................................... 28
5. Outputs ....................................................................................................................... 34
5.1 Hazard Mapping .................................................................................................................... 34
5.2 How to Use the Study Outputs .............................................................................................. 34
6. References .................................................................................................................. 42
LIST OF FIGURES
Figure 1-1 WPLCHA Study Area Extent ........................................................................................... 2 Figure 2-1 Mean High Water Springs Tidal Plane (MHWS) – Present Mean Sea Level .................. 7 Figure 2-2 Overview of Wave Power in Western Port from Ocean Swells and Locally Generated
Wave.............................................................................................................................. 7 Figure 3-1 Schematic Showing the Main Processes Contributing to Inundation in Western Port 9 Figure 3-2 Coastal Wetland Conceptual Shoreline Type .............................................................. 12 Figure 3-3 Low Earth Cliff Conceptual Shoreline Type ................................................................. 12

Melbourne Water 2548-01R01v07
2548-01 / R01 V07 - 04/09/2014 iv
Figure 3-4 Hard Rock Cliff and Shore Platform Conceptual Shoreline Type ................................ 13 Figure 3-5 Platform-Beach and Bluff Conceptual Shoreline Type ................................................ 13 Figure 3-6 Soft Rock, High Cliff Conceptual Shoreline Type ......................................................... 14 Figure 3-7 Sandy Spit Conceptual Shoreline Type ........................................................................ 14 Figure 3-8 Estuarine and Tidal Channel Conceptual Landform .................................................... 15 Figure 3-9 Recommended Data Collection, Monitoring and Future Assessments to Improve
Certainty in the Erosion Hazard Estimation ................................................................ 24 Figure 4-1 Outline of Part B Local Coastal Hazard Assessment Locations and Extents................ 29 Figure 4-2 Overview of Coastal Hazards for Balnarring-Somers .................................................. 30 Figure 4-3 Overview of Coastal Hazards for Tooradin and Coastal Villages................................. 31 Figure 4-4 Overview of Coastal Hazards for Lang Lang (Main Drain to Jam Jerrup) .................... 32 Figure 4-5 Overview of Coastal Hazards for Rhyll Inlet and Silverleaves ..................................... 33 Figure 5-1 Inundation Hazard Extents for Western Port – Map 1 ................................................ 35 Figure 5-2 Inundation Hazard Extents for Western Port – Map 2 ................................................ 36 Figure 5-3 Inundation Hazard Extents for Western Port – Map 3 ................................................ 37 Figure 5-4 Erosion Hazard Extents for Western Port – Map 1 ..................................................... 38 Figure 5-5 Erosion Hazard Extents for Western Port – Map 2 ..................................................... 39 Figure 5-6 Erosion Hazard Extents for Western Port – Map 3 ..................................................... 40 Figure 5-7 How to Use the Study Outputs for a Local Coastal Hazard Assessment ..................... 41
LIST OF TABLES
Table 3-1 Summary of Shoreline Type Erosion Trajectory .......................................................... 16 Table 3-2 Summary of Key Uncertainties – Inundation Hazards ................................................ 20 Table 3-3 Summary of Key Uncertainties – Erosion Hazards ...................................................... 20 Table 3-4 Coastal structures specifically included within coastal hazard layers......................... 22 Table 4-1 Overview of Coastal Hazards for the Representative Locations ................................. 27

Melbourne Water 2548-01R01v07
2548-01 / R01 V07 - 04/09/2014 v
GLOSSARY Aeolian The erosion, transport and deposition of material by wind.
Atmospheric Pressure The pressure exerted by the earth’s atmosphere at any given point. E.g. under a ‘Low Pressure’ weather system the atmospheric pressure on the ocean surface is reduced resulting in a local increase in the water surface elevation.
Australian Height Datum(AHD)
A common national plane of level corresponding approximately to mean sea level.
AEP Annual Exceedance Probability: The measure of the likelihood (expressed as a probability) of an event equalling or exceeding a given magnitude in any given year.
Alluvial Water driven sediment transport process (non-marine).
Astronomical tide Water level variations due to the combined effects of the Earth’s rotation, the Moon’s orbit around the Earth and the Earth’s orbit around the Sun.
Backshore The available width of beach extending between the average high-tide mark and the vegetation, which is affected by waves only during severe storms. Backshore sand lobe migration is the longshore transport of the beach width. Backshore sand lobe migration is a dynamic process that occurs due to variations in sediment transport processes along the sandy shoreline.
Barometric Pressure Refer Atmospheric Pressure. The depression of the water surface under high atmospheric pressure, and its elevation under low atmospheric pressure, is often described as the inverted barometer effect.
Brunn Rule The first and best known model relating shoreline retreat to an increase in local sea level is that proposed by Per Bruun (1962). The Bruun rule states that a typical concave-upward beach profile erodes sand from the beach face and deposits it offshore to maintain constant water depth. The Bruun rule can be applied to correlate sea-level rise with eroding beaches. The Bruun rule estimates the response of the shoreline profile to sea-level rise. This simple model states that the beach profile is a parabolic function whose parameters are entirely determined by the mean water level and the sand grain size. The analysis by Bruun assumes that with a rise in sea level, the equilibrium profile of the beach and shallow offshore moves upward and landward.
Calibration
The process by which the results of a computer model are brought to agreement with observed data.
Chart Datum (CD) Common datum for navigation charts. Typically relative to Lowest Astronomical Tide.
Chenier Discrete, elongated, vegetated marine beach ridge, sandy hummock and/or shell bodies stranded on a coastal mudflat or marsh and roughly parallel to a prograding shoreline.
Coastal Hazard A term to collectively describe physical changes and impacts to the natural environment which are significantly driven by coastal or oceanographic processes.
Colluvium A term used to describe loose, unconsolidated sediments that have been deposited at the base of a slope or cliff.
Delta A complex association of geomorphic settings, sediment types and ecological habitats, at a point where a freshwater sources enters an estuarine water body.
DTM Digital Terrain Model, a three dimensional representation of the ground surface.
Embayment A coastal indentation which has been submerged by rising sea-level and has not been significantly infilled by sediment.

Melbourne Water 2548-01R01v07
2548-01 / R01 V07 - 04/09/2014 vi
Equilibrium Shoreline Recession
The cross-shore movement (i.e. landward and shoreward) of the beach profile. Sometimes referred to as shoreline retreat. The best known model for relating equilibrium shoreline recession to increases in sea level rise is that proposed by Per Brunn (1962) – the Brunn Rule. In this report equilibrium shoreline recession refers to the specific equilibrium response of a sandy shoreline to sea level rise when everything else is held constant.
Estuaries The seaward limit of a drowned valley which receives sediment from both river and marine sources and contains geomorphic and sedimentary conditions influenced by tide, wave and river processes.
Exceedance Probability The probability of an extreme event occurring at least once during a prescribed period of assessment is given by the exceedance probability. The probability of a 1 in 100 year event (1% AEP) occurring during the first 25 years is 22%, during the first 50 years the probability is 39% and over a 100 year asset life the probability is 63%.
Foreshore The area of shore between low and high tide marks and land adjacent thereto.
Geomorphology The study of the origin, characteristics and development of land forms.
GIS Geographical Information System.
Holocene The period beginning approximately 12,000 years ago. It is characterised by warming of the climate following the last glacial period and rapid increase in global sea levels to approximately present day levels.
Hydrodynamic Model A numerical model that simulates the movement of water within a defined model area.
ICOLL Intermittently closed and open lake or lagoon
Intertidal Pertaining to those areas of land covered by water at high tide, but exposed at low tide, eg. intertidal habitat.
Intertidal Flats Intertidal flats are un-vegetated, generally low gradient and low energy environments that are subject to regular tidal inundation and consist of sandy mud and muddy sand.
Levee Raised embankment along the edge of a coastal or riverine environment.
LiDAR Light Detection and Ranging – also known as airborne laser scanning, is a remote sensing tool that is used to generate highly accurate 3D maps of the Earth’s surface.
Lithology A description of the physical character if a rock or rock formation.
Littoral Zone An area of the coastline in which sediment movement by wave, current and wind action is prevalent.
Littoral Drift Processes Wave, current and wind processes that facilitate the transport of water and sediments along a shoreline.
Meander A description given to a bend or sinuous watercourse.
Mesozoic The geological era covering the period from around 252 million years ago to about 66 million years ago.
MHWS Mean High Water Springs, i.e. the mean of spring tide water levels over a long period of time.
MSL Mean Sea Level.
Nearshore The region of land extending from the backshore to the beginning of the offshore zone.

Melbourne Water 2548-01R01v07
2548-01 / R01 V07 - 04/09/2014 vii
Paleochannel A remanent of an inactive river or stream channel that has been either filled or buried by younger sediment.
Palaeozoic The geological area covering the period from about 541 to 252 million years ago. Incorporates the Devonian, Silurian, Ordovician, and Cambrian geological periods.
Paludal Sediments that have accumulated in a marshy or swampy environment.
Physiography The study of the physical patterns and processes of the environment to understand the forces that produce and change rocks, oceans, weather, and flora and fauna patterns.
Pleistocene The period from 2.5M to 12,000 years before present that spans the earth's recent period of repeated glaciations and large fluctuations in global sea levels.
Recharge Groundwater recharge is a hydrologic process where water moves downward from the surface water to groundwater.
Regolith A layer of unconsolidated weathered material overlying bedrock.
Shoal A shallow area within a water body; a sandbank or sandbar.
Sea Level Rise (SLR) A permanent increase in the mean sea level.
Sea water Intrusion The movement of sea water into freshwater aquifers due to natural process or human activities
Spring Tides Tides with the greatest range in a monthly cycle, which occur when the sun, moon and earth are in alignment (the gravitational effects of the moon and sun act in concert on the ocean).
Storm Surge The increase in coastal water levels caused by the barometric and wind set-up effects of storms. Barometric set-up refers to the increase in coastal water levels associated with the lower atmospheric pressures characteristic of storms. Wind set-up refers to the increase in coastal water levels caused by an onshore wind driving water shorewards and piling it up against the coast.
Storm tide Coastal water level produced by the combination of astronomical and meteorological (storm surge) ocean water level forcing.
Sub-aerial Processes that take place on the land or at the earth’s surface as opposed to underwater or underground.
Susceptibility The sensitivity of coastal landforms to the impacts of coastal hazards such as sea-level rise and storm waves. This may include physical instability and/or inundation.
Tidal Planes
A series of water levels that define standard tides, eg. 'Mean High Water Spring' (MHWS) refers to the average high water level of Spring Tides.
Tidal Prism The volume of water moving into and out of an estuary or coastal waterway during the tidal cycle.
Tidal Range
The difference between successive high water and low water levels. Tidal range is maximum during Spring Tides and minimum during Neap Tides.
Tides
The regular rise and fall in sea level in response to the gravitational attraction of the Sun, Moon and Earth.
Vulnerability Vulnerability is a function of exposure to climatic factors, sensitivity to change and the capacity to adapt to that change. In this report it means the degree to which a natural system is or is not capable of adapting or responding to the impacts of coastal hazards to which they are physically susceptible and exposed.

Melbourne Water 2548-01R01v07
2548-01 / R01 V07 - 04/09/2014 viii
Wave Setup The increase in mean water level due to the presence of waves
Wind Setup The vertical rise of the water surface above the still water level caused by wind stresses on the water surface
Wind Shear
The stress exerted on the water's surface by wind blowing over the water. Wind shear causes the water to pile up against downwind shores and generates secondary currents.
ACKNOWLEDGEMENTS
Numerous organisations and individuals have contributed both time and valuable information to the Western Port Local Coastal Hazard Assessment. The study team acknowledges the contributions made by these groups and individuals, in particular:
• Simone Corby and Kristina Sestokas (Melbourne Water) • Rebecca Cohen & Virginia Brookes (Mornington Peninsula Shire Council) • Jacqui Houguet (Casey City Council) • Janene Vurlow (Cardinia Shire Council) • Orla Seccull, Diane Whittington & Paul Lennox (Bass Coast Shire Council) • Greg Hunt (South East Councils Climate Change Alliance) • Alex Edwards & Rod Anderson (Department of Environment and Primary Industries) • Hans Van Elmpt (Department of Environment and Primary Industries)
The study team also wishes to thank all those stakeholders and members of the public who participated in the workshop and/or information session and provided valuable inputs to the assessment of coastal inundation and erosion hazards within Western Port.

Melbourne Water 2548-01R01v07
2548-01 / R01 V07 - 04/09/2014 1
1. INTRODUCTION
1.1 Background
Western Port is one of four locations within Victoria where a Local Coastal Hazard Assessment (LCHA) has been undertaken as part of the Victorian Government’s Future Coasts Program. Led by the Department of Environment and Primary Industries (DEPI), the Future Coasts Program is designed to help Victorians understand and plan for climate risks along the coast by generating detailed coastal mapping and information. This information will assist in preparing Victorians for storm surges and possible sea level rise impacts into the future.
The four locations selected to undertake the LCHAs included Ninety Mile Beach and the Gippsland Lakes, Port Fairy, the Bellarine Peninsula, and Western Port. Each was chosen based on its representative nature, and previous data/studies, such as the Victorian Coastal Inundation Dataset (VCID), which highlighted potential coastal hazards in these areas. The Western Port location was selected due to its significant social, economic, built and natural values, which were all recognised as at risk from storm surge and sea level rise impacts now and into the future.
The Western Port Local Coastal Hazard Assessment (WPLCHA) (this study) involved detailed and comprehensive hazard assessment, with a focus on inundation and erosion hazards around all shorelines of Western Port and French Island, as well as the northern shorelines of Phillip Island (Figure 1-1). This project did not include any subsequent assessment of the impacts of the coastal hazards on built, economic or social infrastructure, assets, or values and does not include the preparation of adaptation plans or suggested responses to the hazards.
This project was commission by DEPI in partnership with Melbourne Water, South East Councils Climate Change Alliance, Bass Coast Shire Council, Cardinia Shire Council, the City of Casey and the Mornington Peninsula Shire Council.
The information developed by the project will assist in better understanding, planning for, and managing coastal hazards. It will allow management agencies and other key stakeholders to identify and define triggers as the basis for short, medium and long term management responses. Specifically, the information is intended to support decision-making about local infrastructure, natural asset management, emergency management planning, to inform land use planning and statutory planning decisions, and to provide information to support the development of adaptation plans.
Information from this project will also add to the suite of information available to help identify how and where State Government, Western Port Councils, the community, industry and other levels of government and governance agencies can work together to respond to or address the potential impacts of climate change.
1.2 Scope
The WPLCHA project provides information on the extent of coastal hazards and their physical impacts for the Western Port coastal environment, focusing on inundation and erosion hazards in particular. Each of these hazards has been assessed at a broad Western Port wide scale to provide a consistent analysis across the study area, as well as at a more detailed local scale at four representative locations:
Balnarring to Somers,
Tooradin and Coastal Villages,
Lang Lang (Main Drain to Jam Jerrup), and
Rhyll Inlet and Silverleaves.

Melbourne Water 2548-01R01v07
2548-01 / R01 V07 - 04/09/2014 2
Figure 1-1 WPLCHA Study Area Extent
The Victorian Coastal Strategy (Victorian Coastal Council, 2008) requires planning for sea level rise of not less than +0.8 m by 2100, which is reflected in the three sea level rise scenarios of +0.2m (2040), +0.5m (2070) and + 0.8 m (2100) that have been considered in this study. It is noted that in the recently released IPCC AR5 Summary for Policy Makers (2013) document that future sea level rise in excess of 0.8 m by 2100 is predicted for two of the greenhouse gas emission scenarios. However, 0.8 m remains within the predicted range, and therefore is still considered appropriate.
Along with sea level rise each scenario also considered the 1% Annual Exceedance Probability (AEP) storm tide and 10% AEP catchment generated inflows to Western Port. Each scenario has been assessed in terms of the likely impacts on inundation and erosion hazards both at a broad Western Port wide scale and also at a local scale for the four representative locations.
In addition to coastal hazards associated with surface water, a high level review of the impact of the sea level rise scenarios on groundwater within the coastal areas of Western Port was also undertaken.
1.3 Governance
A Project Steering Group (PSG) and Technical Review Group (TRG) were established to govern the WPLCHA project. These were made up of members from each agency, as well as independent technical experts. The project has undergone technical reviews at various stages and a final peer review by independent technical experts engaged by DEPI.

Melbourne Water 2548-01R01v07
2548-01 / R01 V07 - 04/09/2014 3
1.4 Project Team
This project was undertaken as a partnership between Water Technology (Lead Consultant and project manager) and a number of independent technical experts who provided specialist input to key aspects of the assessment.
The key team members are summarised as follows:
Andrew McCowan and Tim Womersley (Water Technology) – hydrodynamics and physical processes
Christine Lauchlan Arrowsmith (Water Technology) – project management, hydrodynamics, physical processes, and groundwater
Georgina Race (Water Technology) – spatial analysis
Paul Boon (Dodo Environmental) – mangrove and saltmarsh ecology
Neville Rosengren (Environmental GeoSurveys) – coastal geomorphology
Jon Hinwood (Coastal Environmental Consultants) – hydrodynamics and physical processes
John Tilleard (Moroka) – catchment processes
1.5 Reporting
This document (Report 1) is one of a series of reports produced as part of the WPLCHA project. It should be read in conjunction with Part A and Part B of the project, which is documented in Reports 2-6, as follows:
Report 1: Summary Report (R01)
Report 2: Data Review (R02)
Report 3: Methodology Overview (R03)
Report 4: Inundation Hazards (R04)
Report 5: Erosion Hazards (R05)
Report 6: Review of Representative Locations (R06)
Reports R02 and R03 were produced for the project steering committee at an early stage in the study and provide a brief overview of the available data and methods proposed on commencement of the project. A more comprehensive discussion of the data and assessment methods adopted for each of the study components is provided within Reports R04, R05 and R06.
This report is structured as follows:
Section 1: Introduction and Background,
Section 2: Summary of main finding for the broad scale local coastal hazard assessment (Part
A),
Section 3: Summary of the main findings for each of the four representative locations (Part
B), and
Section 4: Overview of the study outputs.
Accompanying this report and the supporting documents is a project geographical information system (GIS), which includes the following outputs from the inundation and erosion assessments:
Digital geo-referenced data, including the GIS layers and associated metadata files for the following:
o The shoreline as defined in the generation of inundation and erosion hazard layers. o The shoreline erosion hazard which provides an assessment as to the potential
change in erosion susceptibility under higher mean sea level scenarios.

Melbourne Water 2548-01R01v07
2548-01 / R01 V07 - 04/09/2014 4
o The extent of storm tide inundation for the 1% AEP storm tide with the current mean sea level and +0.2 m/+0.5 m/and +0.8 m sea level rise scenarios based on hydrodynamic modelling.
o The 10 cm contours for the 1% AEP inundation water surface for the current mean sea level and +0.2 m/+0.5 m/and +0.8 m sea level rise scenario based on hydrodynamic modelling.
o The extent of inundation for a 10% AEP catchment generated flood events under higher mean sea level scenarios.

Melbourne Water 2548-01R01v07
2548-01 / R01 V07 - 04/09/2014 5
2. STUDY AREA CONTEXT
The characteristics and susceptibility of the shorelines of Western Port to coastal hazard impacts, including sea level rise, is integrally related to the nature and variations in geology, geomorphology, coastal vegetation and the hydrodynamic setting that exists in Western Port. These are briefly summarised below, with more detailed information provided in Reports R04, R05 and R06.
2.1 Geology and Geomorphology
Western Port is shaped by a series of northeast-trending faults that define the Mornington Peninsula, Western Port itself, and the western side of the Strzelecki Ranges. Other east-west oriented faults have produced the elevated areas of Phillip Island and French Island. A wide variety of interacting processes including exposure of varied lithology, accumulation of alluvial (river transported) and aeolian (wind transported) sediments and the development of a range of wetland plant communities including mangrove and saltmarsh has resulted in a diverse coastal and backshore (hinterland) environment.
Western Port Bay developed its present configuration around 12 000 years ago. Since then, a wide variety of interacting processes including different shoreline configurations and materials, water and sediment movements, and the establishment of various wetlands and vegetation communities has led to localised changes and the development of the varied and diverse shorelines we see today. There are approximately 300 kilometres of shoreline included in the study area and a variety of coastal and intertidal landforms are present.
The configuration of each section of the shoreline is determined principally by the nature and structure of the coastal geology, and the features and terrain of the backshore (hinterland) and the near-shore (intertidal and below water surface areas close to the shore). In broad terms, the southern shorelines of Western Port are characterised by more prominent coastal terrain (e.g. steep cliffs, and embayments) and relatively erosion resistant geology, whilst the northern shorelines are characterised by lower terrain profiles (e.g. low lying intertidal areas, swamps) generally comprised of unconsolidated or poorly consolidated sediments which are more prone to erosion.
The tide range, and prevailing wind, wave and current regimes also strongly influence the configurations of the shorelines. In Western Port these factors vary depending on the shoreline location relative to the entrances to Bass Strait.
As part of this study, the different shorelines around the study area have been assessed and categorised in order to assess their potential responses to sea level rise. Further information is provided in Section 3 of this Summary Report and in Reports R05 and R06.
2.2 Peripheral Vegetation Communities
Western Port is fringed by many different types of water-dependent vegetation, including mangrove (Avicennia marina) shrublands, coastal saltmarsh (of various species), Sea Rush (Juncus kraussii) marshes, and Swamp Paperbark (Melaleuca ericifolia) swamps. At least eight other less well-known vegetation types (i.e. Ecological Vegetation Classes) may also occur in the region.
Western Port has been listed as a Ramsar site on the basis of, among other things, the extent and diversity of its coastal wetlands. Large expanses of coastal wetland with such floristic and structural diversity are not common elsewhere in Victoria; mangroves line about 40% of the Western Port shoreline and, second only to the stands of ‘bonsai’ mangroves at Corner Inlet, are the highest-latitude mangroves in the world (Duke, 2006). Coastal saltmarshes are also extensive, although not as floristically diverse as those in other locations along the Victoria coast (Boon et. al, 2011 & Carr,

Melbourne Water 2548-01R01v07
2548-01 / R01 V07 - 04/09/2014 6
2012); they are also relatively undisturbed, unlike many other areas of coastal saltmarsh in south-eastern Australia (Laegdsgaard, 2006 & 2008).
2.3 Other Coastal Structures
In addition to considering natural shoreline features and processes around Western Port, it was also important to identify and consider and key built structures around the study area in terms of how these may (or may not) affect coastal inundation and erosion both now and into the future with sea level rise. The types of structures considered included levees (formal and informal), major facilities (e.g. such as the Port of Hastings), and any other significant structures that Project Partner organisations identified as being significant and/or that would be maintained into the future.
Further details on which structures and their significance (with respect to this study) are provided in Reports R04, R05 and R06.
2.4 Hydrodynamic Setting
Coastal Driven Water Levels
Western Port experiences water level variations associated with astronomical tides caused by the gravitational attractions between the Earth, Moon and Sun. Astronomical tides result in relatively high frequency diurnal (daily) and semi-diurnal (twice daily) water level variations that propagate through the Western and Eastern Entrances of Western Port bay. The astronomical tides undergo further modifications within the bay due to interactions with the shoreline and the intertidal and underwater terrain, for example towards the northern and eastern shorelines the tide is amplified, as shown in Figure 2-1.
Additional coastal water level variations also propagate into Western Port associated with various other meteorological forcing factors; for example low pressure systems elevate water levels due to inverse barometric pressure effects, and the interaction of weather systems and coastal waters generate coastally trapped waves along the southern shores of Australia. Extreme meteorologically driven water level events are generally referred to as storm surges. The combined elevated water level due to the astronomical tide and storm surge is referred to as a storm tide. Storm tide and storm surge are described further in Section 3.
Ocean Swell & Wind Generated Waves
When waves break on a beach they can produce an increase in the mean water level, known as wave set-up. Waves can therefore contribute to peak water levels along a shoreline. Two sources of waves occur within Western Port; ocean swell waves and locally generated wind waves.
Ocean swell waves generated in the Southern Ocean propagate through Bass Strait and into Western Port, where they undergo a range of transformations such as refraction, shoaling and breaking. Ocean swell waves are essentially confined to the shorelines adjacent to the Western Entrance (Figure 2-2), with locally generated wind waves dominating the wave conditions of the remainder of Western Port.
Locally generated wind waves are characterised by their generally smaller wave height, shorter wave period and highly variable directional distribution in comparison to ocean swell waves.

Melbourne Water 2548-01R01v07
2548-01 / R01 V07 - 04/09/2014 7
Figure 2-1 Mean High Water Springs Tidal Plane (MHWS) – Present Mean Sea Level
Figure 2-2 Overview of Wave Power in Western Port from Ocean Swells and Locally Generated Wave

Melbourne Water 2548-01R01v07
2548-01 / R01 V07 - 04/09/2014 8
Catchment Streamflows
A number of major streams and drains enter Western Port, including the Bunyip, Lang Lang and Bass Rivers. Intense and/or prolonged rainfall in the catchment produces flood flows which can affect low-lying areas adjacent to the coast. Many of these low-lying areas were swamps prior to European settlement, and are naturally flood-prone. They rely on constructed drains to reduce the severity and duration of flooding. Elevated coastal water levels can exacerbate catchment generated flood events in these areas although the peak flows or water levels associated with catchment flood events and storm surge events rarely occur together.
Sediment Movement
The tidal currents and circulation patterns drive the movement of sediment throughout the bay. In high energy areas such as the Western Entrance, strong tidal currents and varying degrees of wave action create conditions where there is the potential for a strong inward movement of sand from offshore areas outside of Western Port. Moving further into the bay, the movement of sand reduces and increasing deposition of finer sediments such as mud occurs. The extensive intertidal system in the north and north-east of the bay is dominated by deposition and suspension of mud, with sediment inputs to the system being primarily from erosion of the eastern shoreline and catchment inflows.

Melbourne Water 2548-01R01v07
2548-01 / R01 V07 - 04/09/2014 9
3. THE MAIN FINDINGS – BROAD SCALE
3.1 Overview
Coastal inundation and erosion hazards vary significantly across Western Port. For this broad scale assessment a range of techniques were developed and applied to understand the key drivers and processes associated with these hazards in order to develop estimates of the likely extent of each hazard under projected increases in mean sea level of +0.2 m, +0.5 m and +0.8 m. Broad scale in this context refers to the spatial extent of the project area rather than the level of detail of the components assessments.
Reports 4 and 5 of this project detail the broad scale Western Port wide assessment of these coastal hazards. However, the main findings of this broad scale coastal hazard assessment are presented in the following sections.
3.2 Inundation Hazards
3.2.1 Introduction
Extreme elevated water levels within Western Port are a function of a number of different physical pressures and processes including coastally driven water levels, wind and wave set-up, and catchment generated inflows, Figure 3-1.
Figure 3-1 Schematic Showing the Main Processes Contributing to Inundation in Western Port
To assess inundation hazards two major inundation processes were analysed; a representative extreme storm tide event (defined as the 1% AEP storm tide) and an extreme catchment generated flood event (defined as the 10% AEP catchment inflow) occurring in all major catchments within Western Port. Both inundation processes were modelled under present mean sea level conditions and the predicted sea level rise increments of +0.2 m, +0.5 m and +0.8m above present mean sea level. The two inundation processes were modelled separately (independent of each other) as the probability of them occurring together is highly unlikely.

Melbourne Water 2548-01R01v07
2548-01 / R01 V07 - 04/09/2014 10
In addition to these surface water inundation hazards, a high level overview of groundwater hazards was also undertaken.
3.2.2 Key Findings
Key findings of the broad scale coastal inundation hazard assessment are as follows:
Storm Tide Inundation (1% AEP storm tide)
The inundation extent between Flinders and Somers is constrained by the steep sloping topography behind the shoreline, so minimal changes in inundation extent were observed between all of the sea level rise scenarios.
Significant increases in inundation extent were observed upstream of Sawtells Inlet at Tooradin, under each increased mean sea level scenario.
Along the eastern shorelines, around Lang Lang, Pioneer Bay and Queensferry, the storm tide was largely contained where raised embankments (termed ‘coastal levees’ in this study) are present under existing mean sea level; however, some overtopping did occur along low areas or where there were breaks in the coastal levees. Large increases in inundation extent were observed with each progressive rise in mean sea level scenario, with the majority of the coastal levees being overtopped under the +0.8 m sea level rise (SLR) scenario.
Scenario testing with and without the existing coastal levees showed the most significant increase in inundation extent when the levees were removed was between Lang Lang and Yallock Drain, where coastal inundation extended approximately one kilometre further inland.
The Bass River delta was observed to be inundated during the storm tide under existing mean sea level conditions, however, only relatively small changes in inundation extent were observed under the subsequent increased mean sea level scenarios due to the steep topography behind the delta.
Inundation extents increased under each of the increasing mean sea level rise scenarios inside Rhyll Inlet, with the inundation extent increasing towards the head of the inlet.
Each of these key findings was investigated in further detail during the local scale ‘representative location’ assessments (Part B) of the study. The results of these local scale assessments are discussed further in Section 4.
Catchment Derived Inundation (10% AEP flood)
The result of the inundation analysis associated with the 10% AEP catchment inflow assessment can be briefly summarised as follows:
Only relatively minor changes in inundation extent were observed under sea level rise scenarios for the 10 % AEP catchment inflows, and where inundation extents did increase with sea level rise, they were primarily a result of increased tidal inundation rather than a direct result of catchment inflows.
The largest inundation extents resulting from the 10 % AEP catchment inflows were observed downstream of Cardinia Creek, Deep Creek, Toomuc Creek, the Lang Lang and Bass Rivers and Yallock Drain. Inundation typically occurred where inflow water levels overtopped the drain/river banks and levees or embankments (if present), onto the surrounding low lying land, resulting in inundation further inland than was observed during the storm tide assessment. This was particularly noticeable to the north-east of Tooradin.
Groundwater
A preliminary high level assessment of climate change and groundwater hazards was undertaken to assess how sea level rise is likely to impact coastal groundwater aquifers and to identify any key issues warranting further assessment beyond the scope of this project.

Melbourne Water 2548-01R01v07
2548-01 / R01 V07 - 04/09/2014 11
For Western Port’s coastal aquifers, the review identified the following potential impacts due to sea level rise:
Increased sea water intrusion, the extent of which would be enhanced by current extraction and surface drainage systems across the Koo Wee Rup area.
Potential for reduced freshwater recharge through a reduction in the extent of recharge areas as a result of increased permanent tidal inundation of low lying areas and increased frequency and intensity of temporary inundation.
It should however be noted, that the rate of change of groundwater systems can be significantly slower than surface waters due to the properties of the aquifer material. This means that over the time scale of this assessment (to 2100) any changes in the coastal aquifer systems are unlikely to have reached equilibrium and would continue to respond to the higher mean sea level conditions.
In addition to the impacts identified above, increases in groundwater levels as a result of sea level rise may also have a significant impact on shoreline erosion processes for cliffed shorelines around Western Port (refer to Report 5 for further details). This potential hazard has not been considered further in the erosion assessment for this study due to the current lack of knowledge of both the process and responses under present mean sea level or under sea level rise conditions.
3.3 Shoreline Erosion Hazards
3.3.1 Introduction
Shoreline erosion within Western Port is a function of a range of key processes and different physical forcing factors, the relative importance of which vary considerably depending on the shoreline geology and geomorphology. Detailed assessments including hydrodynamic modelling have been used to integrate these processes to enable estimates of potential shoreline erosion to be developed taking into account how the processes respond to increasing mean sea levels.
Shoreline Types
In order to understand the variable effects of sea level rise on coastal erosion across the wide variety of coastal morphologies that are present across the Western Port study area it was necessary to develop a geomorphic classification system. This classification system was based around groupings of coastal landforms that respond in the same or similar manner to current and future pressures and processes on the shoreline.
Seven major geomorphic shoreline types were defined which were considered to best suit the unique environment of Western Port and provided a practical classification system to support the assessment of potential coastal hazard impacts due to sea level rise.
The seven major geomorphic shoreline classes identified for Western Port have been termed as follows.

Melbourne Water 2548-01R01v07
2548-01 / R01 V07 - 04/09/2014 12
1. Coastal Wetland Fringed Shorelines - largely comprising coastal saltmarsh and mangroves, they represent one of the most extensive shoreline classes in Western Port. An example of this shoreline type is the mangrove fringed shore around Tooradin and the coastal villages.
Figure 3-2 Coastal Wetland Conceptual Shoreline Type
2. Low Earth Cliffed Shorelines – occur relatively extensively on the eastern shorelines of Western Port. An example of this shoreline type is the Lang Lang shoreline between Main Drain and Jam Jerrup.
Figure 3-3 Low Earth Cliff Conceptual Shoreline Type

Melbourne Water 2548-01R01v07
2548-01 / R01 V07 - 04/09/2014 13
3. Hard Rock Cliff and Shore Platform Shorelines - occur extensively in the southern sections of Western Port. The most extensive, highest and steepest slopes are in Palaeogene volcanic basalts along the Bass Strait coastline from Cape Schanck to Flinders.
Figure 3-4 Hard Rock Cliff and Shore Platform Conceptual Shoreline Type
4. Platform Beach and Bluff - occurs extensively along the western shorelines of Western Port and Phillip Island as well as some southern sections of French Island.
Figure 3-5 Platform-Beach and Bluff Conceptual Shoreline Type

Melbourne Water 2548-01R01v07
2548-01 / R01 V07 - 04/09/2014 14
5. Soft Rock, High Cliffed Shorelines – occur at localised locations around Western Port where deeply weathered and/or weakly consolidated sediments are exposed as high cliffs. An example of this shoreline type is Red Bluff at Jam Jerrup.
Figure 3-6 Soft Rock, High Cliff Conceptual Shoreline Type
6. Sandy Spit Shorelines – due to the generally bold coastal relief and lithology of the cliffed shorelines of Western Port, which yields little beach material when eroded, there are only limited examples of this shoreline type across the study area. Unconstrained sandy shorelines exist essentially only as the major spit landforms of Sandy Point, Observatory Point, Stockyard Point and Spit Point within Western Port.
Figure 3-7 Sandy Spit Conceptual Shoreline Type
Melbourne Water 2548-01R01v07
2548-01 / R01 V07 - 04/09/2014 15
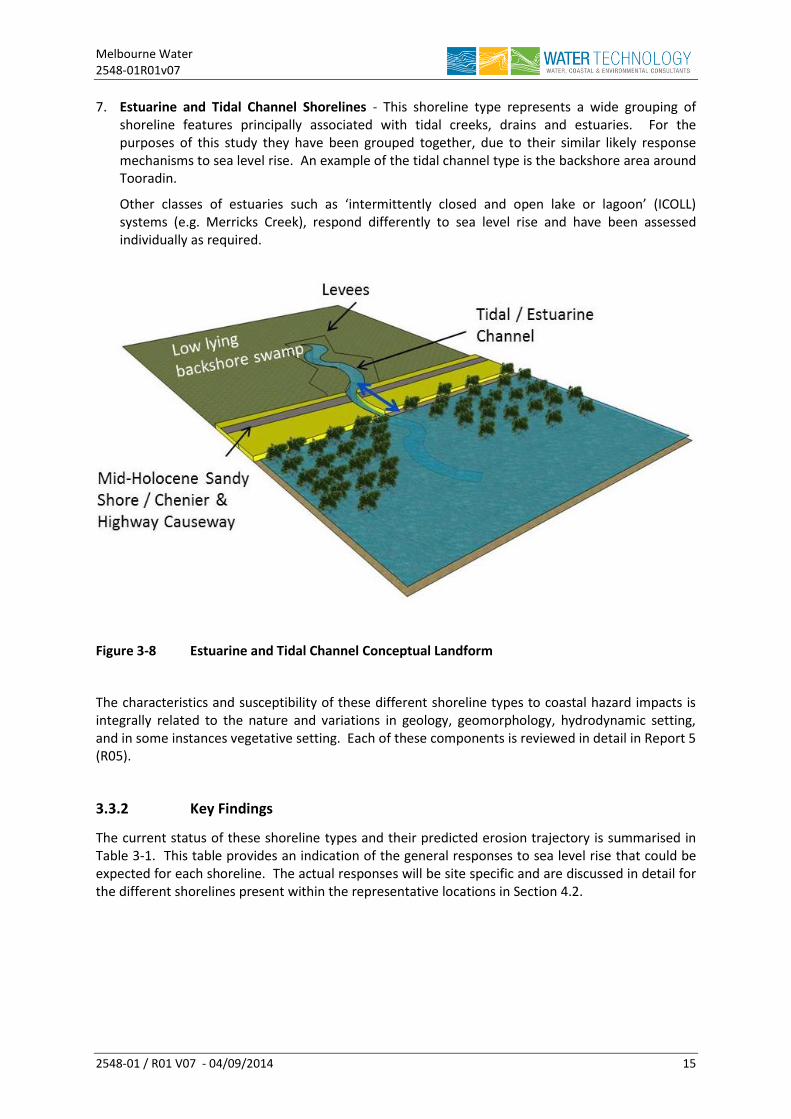
7. Estuarine and Tidal Channel Shorelines - This shoreline type represents a wide grouping of shoreline features principally associated with tidal creeks, drains and estuaries. For the purposes of this study they have been grouped together, due to their similar likely response mechanisms to sea level rise. An example of the tidal channel type is the backshore area around Tooradin.
Other classes of estuaries such as ‘intermittently closed and open lake or lagoon’ (ICOLL) systems (e.g. Merricks Creek), respond differently to sea level rise and have been assessed individually as required.
Figure 3-8 Estuarine and Tidal Channel Conceptual Landform
The characteristics and susceptibility of these different shoreline types to coastal hazard impacts is integrally related to the nature and variations in geology, geomorphology, hydrodynamic setting, and in some instances vegetative setting. Each of these components is reviewed in detail in Report 5 (R05).
3.3.2 Key Findings
The current status of these shoreline types and their predicted erosion trajectory is summarised in Table 3-1. This table provides an indication of the general responses to sea level rise that could be expected for each shoreline. The actual responses will be site specific and are discussed in detail for the different shorelines present within the representative locations in Section 4.2.

Melbourne Water 2548-01R01v07
2548-01 / R01 V07 - 04/09/2014 16
Table 3-1 Summary of Shoreline Type Erosion Trajectory
Shoreline Type Trajectory – Present Mean Sea Level to +0.8 m Sea Level Rise (2100)
Coastal Wetland Fringed Shorelines
Present
Particularly sensitive to sea level rise as mangroves and saltmarsh can only survive in a relatively narrow range of inundation regimes and the saltmarsh-mangrove depositional terrace generally has a very low gradient, such that relatively small absolute changes in mean sea level results in large relative changes to the frequency and extent of inundation across the terrace.
+0.2m (2040) Changes are initiated in the extent of coastal saltmarsh and mangroves, with some shoreward movement of mangroves encroaching on existing saltmarsh extents. Shoreward movement of saltmarsh is generally limited by existing development along the shorelines.
+0.5m (2070) to +0.8m (2100)
For sea level rise scenarios of approximately +0.5 m or greater, the tide would extend across the majority of the existing saltmarsh-mangrove depositional terraces and intersect with steeper backshore landforms. In many locations the backshore landforms are associated with earlier, mid-Holocene sandy beach ridges.
The shorelines are unlikely to provide appropriate inundation regimes to support extensive areas of coastal saltmarsh and the extent of mangroves would also be expected to be compromised by predicted significant increases in wave energy along the seaward mangrove fringe and subsequent increase in sediment transport dynamics.
Low Earth Cliffed Shorelines
Present Historically and presently undergoing active shoreline recession.
+0.2m (2040) to +0.8 (2100)
These shorelines are highly susceptible to future sea level rise impacts. Current rates of shoreline recession could be expected to increase significantly with sea level rise as the duration and depth of tidal inundation across the broad intertidal mud flats fronting these shorelines will enable very significant increases in the amount of wave energy expended on these low cliffed shorelines to occur. Significant increases in the rates of future shoreline recession are projected for these shorelines.
Where sea level rise results in frequent, tidal backshore inundation, the persistent flood and ebb tide flows through failed levees and/or natural depressions in the backshore landscape could be expected to result in relatively rapid dissection of the shoreline as tidal channels develop and expand in response to the extent of backshore inundation generated by tidal water level variations along these shorelines.

Melbourne Water 2548-01R01v07
2548-01 / R01 V07 - 04/09/2014 17
Shoreline Type Trajectory – Present Mean Sea Level to +0.8 m Sea Level Rise (2100)
Hard Rock Cliff and Shore Platform Shorelines
Present The local morphology of these shorelines is related to the resistance of the material and the relative exposure to wave energy. In many locations along these shorelines the underlying hard rock lithology is capped by deeply weathered regolith.
These hard rock cliff slopes are particularly susceptible to deep-seated mass movements that may be initiated by a combination of surface processes and/or due to marine influences at the base of the cliff.
+0.2m (2040) to +0.8 (2100)
Sea level rise over the timeframes considered in this study (to 2100) are not considered to significantly influence the extent of potential hazards associated with slope failures/mass movements on these shorelines; however, sea level rise may possibly increase the likelihood and/or frequency of these hazards along these shorelines.
Slope failures are considered a potential significant source of hazard along these shorelines in Western Port as they can result in major impacts landward of the cliff edge and can occur with little to no warning.
Platform Beach and Bluff
Present
These shorelines are comprised of bluffs of deeply weathered regolith that have been isolated from direct marine influence by the accumulation of sand and gravel beach ridges and plains. Many of the existing bluffs in Western Port likely existed as active marine cliffs during the mid-Holocene higher sea level still stand. Due to their isolation from the marine influences they are currently not experiencing active coastal erosion.
These shorelines generally have a high degree of local variability and complexity associated with the underlying structure of the geologic formations and associated shore platforms as well as the width of the sandy platform beach and plain.
+0.2m (2040) to +0.8 (2100)
The potential response of the platform beaches to sea level rise is likely to be complex and site specific; however the platform beaches are expected to migrate landward at a rate that is a related to the slope of the underlying shore platform. This will essentially result in the recession of the sandy shoreline and narrowing of the sandy plain in front of the bluffs with sea level rise.
Depending on the sea level rise scenario and the initial width of the sandy plain in front of the bluffs, it is likely that platform beaches and plains will be narrowed to such an extent that marine influences may begin to impact the material comprising the base of the bluffs along sections of these shorelines. Failure of the cliffs could then be initiated.

Melbourne Water 2548-01R01v07
2548-01 / R01 V07 - 04/09/2014 18
Shoreline Type Trajectory – Present Mean Sea Level to +0.8 m Sea Level Rise (2100)
Soft Rock, High Cliffed Shorelines
Present
A range of surface processes contribute to erosion of these shorelines and intermittent wave action at the base of the cliff can undermine the cliff face resulting in block detachment/toppling of the cliff material onto the shore platform. Erosion under present mean sea level conditions is site specific.
+0.2m (2040) to +0.8 (2100)
Increased rates of cliff erosion could be expected on these shorelines due to the increased amount of wave energy that would be expended on the cliff face due to sea level rise; however the processes and rates of change are likely to continue to vary linearly.
Sandy Spit Shorelines
Present
These landforms are particularly young, with the majority of these shorelines only forming following the Holocene marine transgression into Western Port approximately 10,000 years ago. The combination of their young age, unconsolidated geology and sediment transport associated with waves and tides is such that these shorelines are exceptionally dynamic geomorphologic environments.
A particular feature of the sediment transport processes along these shorelines that results in large underlying shoreline variability and subsequent coastal hazard impacts is the migration of backshore sand lobes. Review of the detailed LiDAR survey and historical aerial photography of these landforms reveals the scale of shoreline variability (both erosion and accretion) that can be attributed to this process.
+0.2m (2040) to +0.8 (2100)
Potential future rates of change and coastal hazard impacts along these shorelines due to the underlying variability associated with the migration of backshore sand lobes1 and equilibrium shoreline recession2 as a response to sea level rise is uncertain. These processes are described in detail in Reports 5 and 6.
Aspects of the genesis and processes that transport sediment as large longshore migrating sand lobes along these shorelines are considered poorly understood. Consequently, the mechanisms by which these shorelines may respond to sea level rise may possibly not be well described by conventional sandy shore response models (referred to as ‘equilibrium shoreline recession models’).
1 In Western Port these sandy shorelines experience dynamic and intermittent longshore sediment movement which takes the form of large scale lobes of sand that
migrate along the shoreline. 2 Equilibrium shoreline recession describes the adjustment of the beach and shallow offshore areas to a rise in sea level through upward and landward movement. A key
assumption is that the beach profile is in equilibrium with the present mean sea level.

Melbourne Water 2548-01R01v07
2548-01 / R01 V07 - 04/09/2014 19
Shoreline Type Trajectory – Present Mean Sea Level to +0.8 m Sea Level Rise (2100)
Estuarine and Tidal Channels
Present Estuarine and tidal channels around Western Port occur in many different forms. The critical component of this shoreline class relevant to the assessment of coastal hazard impacts in Western Port is the presence of a tidal or estuarine channel(s) that cuts perpendicular across the shoreline. These types of channel link the coastal systems to backshore areas and can extend considerable distances landward of the main shoreline. Present conditions with relation to erosion of these systems are site specific.
+0.2m (2040) to +0.8 (2100)
Where the elevation of the backshore areas is such that sea level rise may result in tidal variations through the estuarine or tidal channels this may result in large backshore areas becoming tidally inundated. With increasing frequency of inundation in these backshore areas new shorelines could be expected to develop at the advancing tidal limit.
Lowering of stream gradients along the lower reaches of drains and estuaries in Western Port due to sea level rise may also result in variations in the channel alignments due to the development of more frequent and larger amplitude meanders.
For specific estuarine forms such as ‘intermittently closed and open lakes or lagoons’ (ICOLLs), which occur at locations such as Merricks Creek, the likely response to sea level rise will be an increase in the average berm height. As sea level rise occurs there will be a landward and upward movement of the shoreline at the estuary entrance. The increase in the entrance berm height will result in water levels in the lagoon reaching a higher level before a natural break out can occur across the entrance. This could result in an expansion of semi-permanently inundated areas.

Melbourne Water 2548-01R01v07
2548-01 / R01 V07 - 04/09/2014 20
3.4 Uncertainty & Assumptions
3.4.1 Uncertainties
The uncertainty related to both the existing knowledge and assessment methods used to underpin this study are briefly outlined in the following tables.
Table 3-2 Summary of Key Uncertainties – Inundation Hazards
Inundation hazard Key Uncertainties
1% AEP Storm Tide
Inundation
The level of uncertainty in the results of the 1% storm tide inundation assessment is considered low to moderate depending on the location. Hazard impacts can be predicted relatively confidently based on the modelling of existing conditions, however future adaptive responses to levees or embankments and the South Gippsland Highway will likely influence the hazard extent towards the end of the century.
The 1% AEP storm tide modelled in this assessment represents a representative extreme condition. It has not been optimised for all combinations of tide, wind and wave set-up or for all location around the Western Port shoreline.
10% AEP
Catchment
Generated Inflows
The level of uncertainty in the results of the 10% catchment inundation assessment is considered low to moderate depending on the location. Hazard impacts can be predicted relatively confidently based on the modelling of existing conditions, however future adaptive responses to levees or embankments and the South Gippsland Highway will likely influence the hazard extent towards the end of the century.
There is also a high degree of uncertainty around the estimation of future rainfall and river flow conditions due to climate change towards the end of the century.
Groundwater A high level assessment of groundwater hazards and the impact of sea level rise on these hazards have been undertaken for this study. There is a moderate to high level of uncertainty around groundwater impacts due to the current lack of knowledge of both the processes and responses under present mean sea level conditions or with sea level rise.
Table 3-3 Summary of Key Uncertainties – Erosion Hazards
Shoreline Type Key Uncertainties
Coastal Wetland
Fringed Shorelines
The level of uncertainty is low to moderate; the adaptive capabilities of vegetation communities may limit the impact of modest amounts of sea level rise but relatively major loss of coastal wetlands could be expected by the end of the century. An upper limit on the probable extent of erosion hazards can be reasonably defined.
Low Earth Cliffed
Shorelines
Ongoing high rates of cliff recession are virtually certain. The uncertainty relating to the trajectory and probable rates of change is considered low.
Hard Rock Cliff and Detailed site specific knowledge of the geology, geomorphology, hydrogeology and the soil and rock mechanics is necessary to assess the local soil and rock

Melbourne Water 2548-01R01v07
2548-01 / R01 V07 - 04/09/2014 21
Shoreline Type Key Uncertainties
Shore Platform
Shorelines
slope stability and potential failure mechanisms along these shorelines.
A moderate level of uncertainty exists in understanding the key processes influencing erosion of these shorelines due to the site specific nature of the local underlying geology. Site specific data and specialist geotechnical assessments are required to improve confidence at the lot/parcel scale.
Platform Beach
and Bluff
Erosion hazards at these shorelines will occurs as a possible consequence of the loss of the sandy beach platforms currently situated shoreward of deeply weathered bluffs. These bluffs may be vulnerable to mass movements once the base of the bluff is destabilised by wave action.
A moderate level of uncertainty exists in understanding this process due to limited information or understanding of the underlying geology and potential hazard processes. Site specific data and specialist geotechnical assessments are required to improve confidence at the lot/parcel scale.
Sandy & Sandy
Spit Shorelines
Erosion hazards along these shorelines are generally due to two main mechanisms; backshore migrating sand lobes, and equilibrium profile recession (described in detail in Report 5 and 6).
Where backshore migrating sand lobes are present, a high level of uncertainty exists in understanding the likely response of these shoreline types to sea level rise. This is because the sediment transport processes are highly dynamic, can be intermittent, and vary both spatially and in time. Decision making in response to this hazard is only considered appropriate at the landform/settlement scale.
Estimating equilibrium profile recession is considered to have a moderate level of uncertainty due to limitations of available assessment methods.
Estuarine & Tidal
channels
Significant backshore tidal inundation is increasingly likely towards the end of the century within some areas such as the Koo Wee Rup Swamp. The level of uncertainty is considered low to moderate as the impact of this hazard on erosion processes can be predicted relatively confidently based on existing conditions. However future adaptive responses to levees or embankments and the South Gippsland Highway will likely influence the hazard extent towards the end of the century.
3.4.2 Assumptions
Coastal Structures
The analysis of local coastal hazards has adopted a precautionary approach with respect to the effect of existing coastal structures on inundation and erosion hazards. In locations where a coastal structure is present that is currently or has in the past provided some form of protection against local erosion the determination of the erosion hazard zone does not consider the presence of the structure in limiting potential future erosion, except for a small number of specific coastal infrastructure related structures detailed in Table 3-4. This is because many of the coastal structures in Western Port are informal and/or poorly designed and constructed and they are vulnerable to damage or failure due to extreme storm events or chronic exposure to wave action. Erosion hazards landward of these structures may develop quickly during future events if the structure is not maintained and upgraded to relevant engineering design standards. This approach is in keeping with

Melbourne Water 2548-01R01v07
2548-01 / R01 V07 - 04/09/2014 22
the approach adopted for other coastal hazard assessments in Victoria and also in the recently released Queensland Coastal Hazard Technical Guidelines, EHP (2013).
In the locations detailed in Table 3-4 the erosion hazard zone extent has been reduced due the presence of coastal engineering structures at these locations. These locations and associated coastal structures are typically major marine infrastructure such as ports, harbours, or boat ramps, and may include sections of rock seawall or revetments as part of the infrastructure. It is considered that the coastal structures in these locations will be maintained and upgraded to an approved engineering design into the future and that any such repairs as are required would be promptly addressed.
Table 3-4 Coastal structures specifically included within coastal hazard layers
Location Structure
Cowes Jetty
Newhaven Newhaven – Phillip Island Bridge
Tooradin Rock wall adjacent to the tidal gates at Sawtells Inlet and rock revetment extending to the boat ramp.
Sommerville Yaringa Boat harbour
Blind Bight Boat Ramp
Hastings Port of Hastings
Hastings Hastings Marina
Crib Point Jetty
Stony Point Jetty
Cerberus Defence Base
For the purposes of the inundation hazard assessment, it is assumed that all embankment or coastal levees that are currently in place remain in place at their current extent and configuration. However, given uncertainties as to how these structures will be maintained and/or rebuilt into the future, an additional modelling run was undertaken without the structures present to provide an indicate of potential changes to inundation extents (Refer Report 4 for details).
Storm Tide Scenarios
The modelled storm tide scenarios used in this assessment considered only the 1% AEP storm tide event. There is however, a very tight absolute distribution between the 10% AEP and 1% AEP storm surge levels (0.08 m) which is characteristic of storm surges and is an important consideration when evaluating the inundation and vulnerability of locations within Western Port.
With increases in sea level the increased frequency of inundation associated with more frequent storm tide events (> 1% AEP frequency) may pose a higher hazard in some areas. Recommendations for future assessment of more frequent storm tide events are provided in the following section.
The 1% AEP design storm tide condition adopted for this study is representative of conditions for Western Port as a whole and may not provide a ‘worst case’ estimate for all locations along the shoreline. To refine the design storm tide the use of a statistically based approach such as a Monte Carlo analysis may be required.
Storm Tide & Catchment Flooding
An analysis of peak coastal driven water levels and catchment flood flows indicated that these is little to no correlation between these events and hence the storm tide and catchment flood events for each sea level rise increment were modelled separately.

Melbourne Water 2548-01R01v07
2548-01 / R01 V07 - 04/09/2014 23
Changes below MHWS
Changes to the configuration or elevation of the coastal terrain below present mean sea level were not modelled or assessed in this study for either the Part A or Part B assessments. It was assumed based on historical rates of change, sediment properties, and the detailed review of physical processes in Western Port that has been undertaken for this study, that elevation changes associated with increased deposition or erosion in these areas will not be sufficient to impact modelled water levels, inundation extents, or determination of wave energy.
For instance, in areas, such as the eastern shoreline, significant erosion of the shoreline has occurred and is predicted to continue to occur over the time scale to 2100. As the banks erode the fine grained material eroded (typically mud) can be moved around Western Port with the tidal movements and is often deposited in the intertidal areas. Due to the fine nature of the material the rate of deposition is low and the subsequent rate of accretion of the intertidal flat is also low. Consolidation of this material can also occur which would reduce the rate of vertical accretion.
In low lying areas where significant erosion and backshore inundation could occur as a result of sea level rise, the effect of inundation on erosion rates or erosion on the extent of inundation have not been modelled. This approach was adopted as it is not possible to accurately quantify the spatial extent of erosion at a given location at a given time in the future due to the uncertainty around rates and progress of the erosion (episodic or gradual). There may be local effects related to wave energy on the shoreline due to changes in fetch and water depths as sea level rises and material is exposed which could change the rate of shoreline erosion, although without further information of sediment properties this cannot be quantified.
For areas where sand movement is important, such as Silverleaves on Phillip Island or the Somers-Balnarring shoreline, sea level rise may alter the flow movements within Western Port bay and change the dynamics of the sand movement which could influence shoreline recession and accretion. Due to the high level of uncertainty around the existing dynamics of large scale sand movement in this system (R05 and R06), only qualitative predictions of future changes to these processes can be made.
3.5 Recommendations
The following recommendations are made with regard to further data and knowledge requirements which would build upon and extend the work undertaken as part of this WPLCHA.
3.5.1 Inundation Hazard Assessments
Collection of the following data sets would reduce uncertainties for future inundation hazard assessments:
Detailed bathymetric data in Sawtells’ Inlet, upstream of the control structures, and within all of the main rivers and drains connecting into Western Port bay.
An audit and condition assessment of the coastal levees surrounding Western Port bay.
Collection of a comprehensive wave dataset throughout Western Port in order to further understand the spatial and temporal differences in the wave climate, and further calibrate existing and future wave models.
Continued monitoring of coastal groundwater systems such as in the Koo Wee Rup Water Supply Protection Area. This could be expanded to other coastal aquifers in the Western Port area.
Documentation and data collection after storm surge and catchment generated flood events including survey marks and photographs.
Melbourne Water 2548-01R01v07
2548-01 / R01 V07 - 04/09/2014 24
Future Assessments
Based on the results of the various sea level rise scenarios assessed in this project the following future assessments are recommended:
Refinement of the estimates of 1% AEP storm tide to provide ‘worst case’ estimates for all locations around Western Port. This may require the use of a statistically based approach such as a Monte Carlo analysis.
Extension of the current inundation assessment to include consideration of more frequent storm tide events (e.g. 10% AEP storm tide) for each sea level rise scenario. Increased frequency of inundation may pose a higher hazard in some areas that that generated by more extreme events.
While the peak of a storm tide and the peak of a catchment generated flood occurring together have been shown to very rare events (>1% AEP) within Western Port, the impact of more frequent storm tides on prolonging or exacerbating catchment generated flooding has not been assessed in the current study. This could be examined further through additional sensitivity analyses.
A detailed assessment of vulnerability of the Western Port groundwater basin to sea water intrusion, based on the approach outlined in Ivkovic et al (2012).
3.5.2 Erosion Hazard Assessments
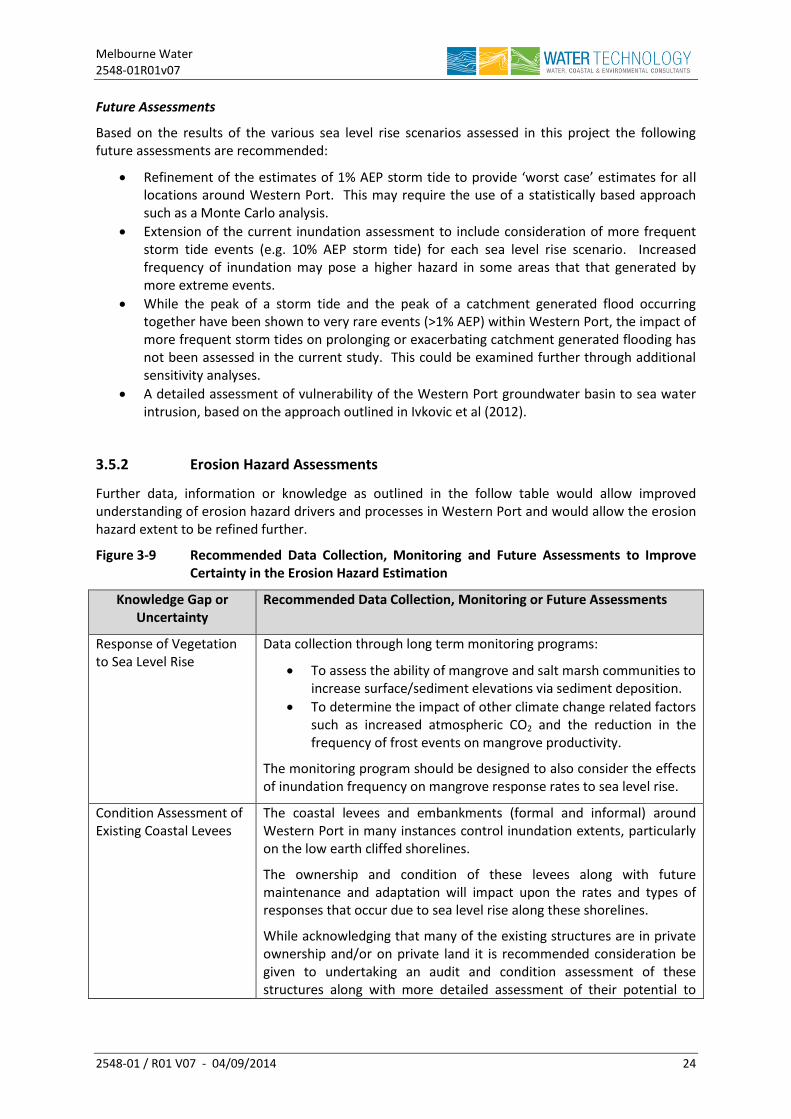
Further data, information or knowledge as outlined in the follow table would allow improved understanding of erosion hazard drivers and processes in Western Port and would allow the erosion hazard extent to be refined further.
Figure 3-9 Recommended Data Collection, Monitoring and Future Assessments to Improve Certainty in the Erosion Hazard Estimation
Knowledge Gap or Uncertainty
Recommended Data Collection, Monitoring or Future Assessments
Response of Vegetation to Sea Level Rise
Data collection through long term monitoring programs:
To assess the ability of mangrove and salt marsh communities to increase surface/sediment elevations via sediment deposition.
To determine the impact of other climate change related factors such as increased atmospheric CO2 and the reduction in the frequency of frost events on mangrove productivity.
The monitoring program should be designed to also consider the effects of inundation frequency on mangrove response rates to sea level rise.
Condition Assessment of Existing Coastal Levees
The coastal levees and embankments (formal and informal) around Western Port in many instances control inundation extents, particularly on the low earth cliffed shorelines.
The ownership and condition of these levees along with future maintenance and adaptation will impact upon the rates and types of responses that occur due to sea level rise along these shorelines.
While acknowledging that many of the existing structures are in private ownership and/or on private land it is recommended consideration be given to undertaking an audit and condition assessment of these structures along with more detailed assessment of their potential to

Melbourne Water 2548-01R01v07
2548-01 / R01 V07 - 04/09/2014 25
Knowledge Gap or Uncertainty
Recommended Data Collection, Monitoring or Future Assessments
impact inundation of both private and public assets.
Sediment transport processes associated with backshore migrating sand lobes
Dating of the sediments and individual dune ridge sequences of the Sandy Spit landforms would enable the evolutionary trajectory and underlying variability of these landforms to be understood with much greater confidence and may provide the ability to refine hazard extents on these landforms.
Improved understanding of the drivers and processes involved in genesis and transport of these sand lobes could be gained through additional study of the morphological dynamics of Middle Bank (in the western entrance of Western Port). However, such a study would require a significant field monitoring program and may not result in further refinement of the predicted erosion hazards along the sandy shorelines.
Collation of further local information, such as oblique photographs, community history and recollections could inform an understanding of how these sand lobes have varied.
How backshore tidal channels develop into new shorelines
Further modelling of locations in the Koo Wee Rup Swamp that may potentially become tidally engaged and could possibly develop proto shorelines around the tidal limit in these areas would aid in understanding the potential risks to these areas and the time scale over which these processes may occur.
This could include simulation of wave and tidal conditions for different levels of shoreline erosion, explicitly included within the model bathymetry.
A field monitoring program of sites where these types of changes are or are likely to occur could inform an understanding of the possible responses to these shorelines to sea level rise and be used to refine any future analysis of backshore inundation or channel development.
How lowering of stream gradients, along the lower reaches of drains and estuaries due to sea level rise may alter channel meander patterns
Lowering of stream gradients along the lower reaches of drains and estuaries in Western Port due to sea level rise may result in variations in the channel alignments due to the development of more frequent and larger amplitude meanders. This could be investigated further through additional geomorphic analysis, potentially utilising process based sediment transport modelling tools.
Slope Stability Detailed, site specific knowledge of the geology, geomorphology, hydrogeology and the soil and rock mechanics through a geotechnical assessment is recommended in order to further understand the stability and potential failure mechanisms along the Hard Rock Cliff and Shore Platform shorelines
Underlying erosion processes and rates of change
Collection of repeat survey data sets of key landforms would enable the underlying processes and rates of change to be quantified more precisely and assist in refining estimates of future rates of change due to sea level rise.
Emerging survey data capture technologies such as unmanned aerial
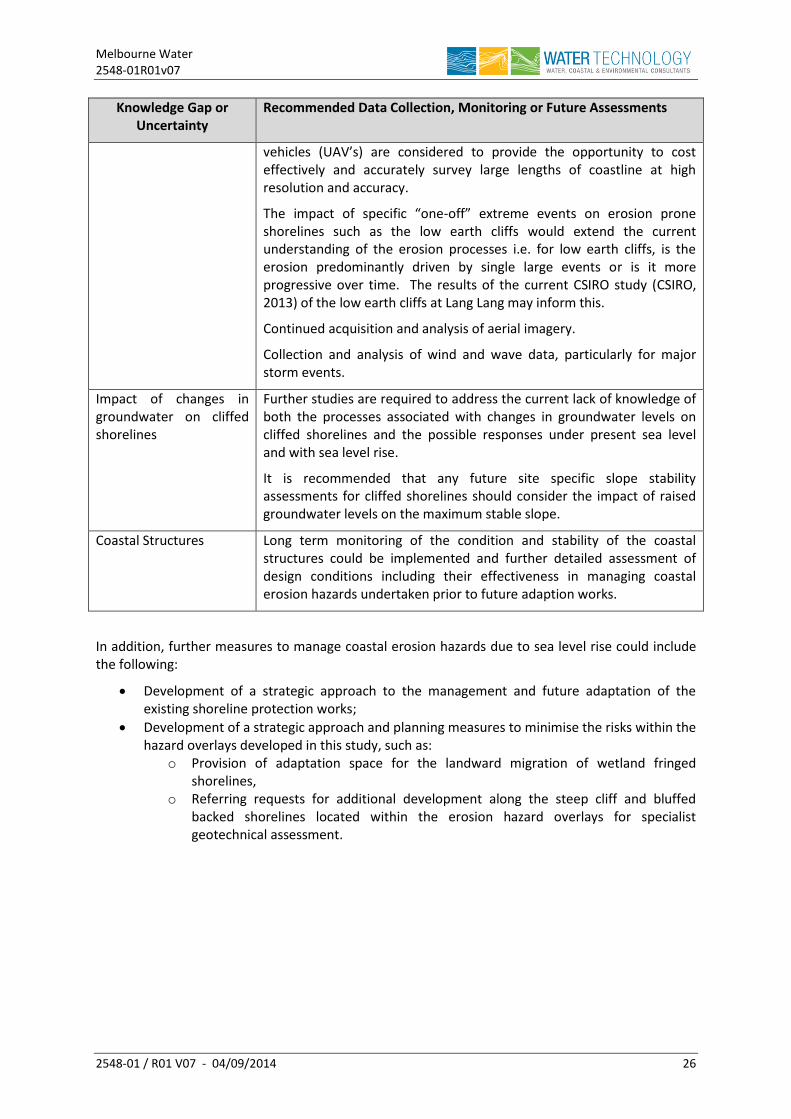
Melbourne Water 2548-01R01v07
2548-01 / R01 V07 - 04/09/2014 26
Knowledge Gap or Uncertainty
Recommended Data Collection, Monitoring or Future Assessments
vehicles (UAV’s) are considered to provide the opportunity to cost effectively and accurately survey large lengths of coastline at high resolution and accuracy.
The impact of specific “one-off” extreme events on erosion prone shorelines such as the low earth cliffs would extend the current understanding of the erosion processes i.e. for low earth cliffs, is the erosion predominantly driven by single large events or is it more progressive over time. The results of the current CSIRO study (CSIRO, 2013) of the low earth cliffs at Lang Lang may inform this.
Continued acquisition and analysis of aerial imagery.
Collection and analysis of wind and wave data, particularly for major storm events.
Impact of changes in groundwater on cliffed shorelines
Further studies are required to address the current lack of knowledge of both the processes associated with changes in groundwater levels on cliffed shorelines and the possible responses under present sea level and with sea level rise.
It is recommended that any future site specific slope stability assessments for cliffed shorelines should consider the impact of raised groundwater levels on the maximum stable slope.
Coastal Structures Long term monitoring of the condition and stability of the coastal structures could be implemented and further detailed assessment of design conditions including their effectiveness in managing coastal erosion hazards undertaken prior to future adaption works.
In addition, further measures to manage coastal erosion hazards due to sea level rise could include the following:
Development of a strategic approach to the management and future adaptation of the existing shoreline protection works;
Development of a strategic approach and planning measures to minimise the risks within the hazard overlays developed in this study, such as:
o Provision of adaptation space for the landward migration of wetland fringed shorelines,
o Referring requests for additional development along the steep cliff and bluffed backed shorelines located within the erosion hazard overlays for specialist geotechnical assessment.

Melbourne Water 2548-01R01v07
2548-01 / R01 V07 - 04/09/2014 27
4. THE MAIN FINDINGS - REPRESENTATIVE LOCATIONS
4.1 Overview
The findings of the Part A broad scale assessment were used to identify a number of locations within the study area which were particularly vulnerable to inundation or erosion hazards and/or had a significant degree of uncertainty in relation to the potential extent of the hazard.
Recommendations were made at the completion of Part A as to which locations warranted local scale investigations in Part B of the project. In developing these recommendations consideration was given to selecting sites that:
Were representative of the range of shoreline types identified in Part A,
Provided examples of the key physical processes, related to both inundation and erosion hazards, and
Were representative of a range of shoreline asset classes, such as economic, social/cultural, ecological, geological/geomorphological, and archaeological.
Four representative locations were then selected and agreed upon by the PSG for the Part B assessment. They included:
Balnarring-Somers (Mornington Peninsula Shire Council)
Tooradin and Coastal Villages (City of Casey)
Lang Lang shoreline – Main Drain to Jam Jerrup (Cardinia Shire Council)
Rhyll Inlet and Silverleaves (Bass Coast Shire Council)
An outline of each representative location is shown in Figure 4-1. The critical sources of potential hazards and the extent of uncertainty relating to the assessment of the impact of sea level rise on these hazards were analysed and are discussed in detail in Report 6. The critical sources of potential hazards were again grouped under the broad categories of erosion and inundation hazards for ease of understanding and for the purposes of mapping hazard extents. The shoreline types and hazard processes referred to in Part B are described in detail in Reports 4 and 5.
An overview of the key hazard components associated with inundation and erosion hazards for each of the representative locations is provided in Table 4-1. The processes and drivers related to each of the hazards identified in the table are detailed within Report 6 and more broadly for Western Port in general in Report 5.
Table 4-1 Overview of Coastal Hazards for the Representative Locations
Loca
tio
n Shoreline Types Key Coastal Hazard Components
Inundation Hazards Erosion Hazards
Bal
nar
rin
g-So
me
r
Sandy spit
Platform beach and bluff
Estuarine
Estuarine (ICOLL) response
Storm tide inundation
Backshore sand lobe migration
Equilibrium profile recession
Bluff reactivation

Melbourne Water 2548-01R01v07
2548-01 / R01 V07 - 04/09/2014 28
Loca
tio
n Shoreline Types Key Coastal Hazard Components
Inundation Hazards Erosion Hazards
Too
rad
in &
C
oas
tal V
illag
es
Coastal wetland fringed
Estuarine
Storm tide inundation
Loss of coastal wetlands
Backshore tidal inundation
Lan
g La
ng
(Mai
n D
rain
to
Ja
m J
erru
p)
Low earth cliffed Storm tide inundation
Cliff recession
Backshore tidal inundation
Rh
yll I
nle
t &
Si
lver
leav
es
Sandy spit
Coastal wetland fringed
Storm tide inundation Backshore sand lobe migration
Equilibrium profile recession
Loss of coastal wetlands
Bluff reactivation
4.2 Location Specific Findings
The principal results in terms of inundation and erosion hazards for each of the representative locations are summarised in Figure 4-2, Figure 4-3, Figure 4-4, and Figure 4-5 respectively. For each location the detailed assessment of coastal hazards has produced a refined estimate of the hazard extent.

Melbourne Water 2548-01R01v07
2548-01 / R01 V07 - 04/09/2014 29
Figure 4-1 Outline of Part B Local Coastal Hazard Assessment Locations and Extents

Melbourne Water 2548-01R01v07
2548-01 / R01 V07 - 04/09/2014 30
Figure 4-2 Overview of Coastal Hazards for Balnarring-Somers

Melbourne Water 2548-01R01v07
2548-01 / R01 V07 - 04/09/2014 31
Figure 4-3 Overview of Coastal Hazards for Tooradin and Coastal Villages
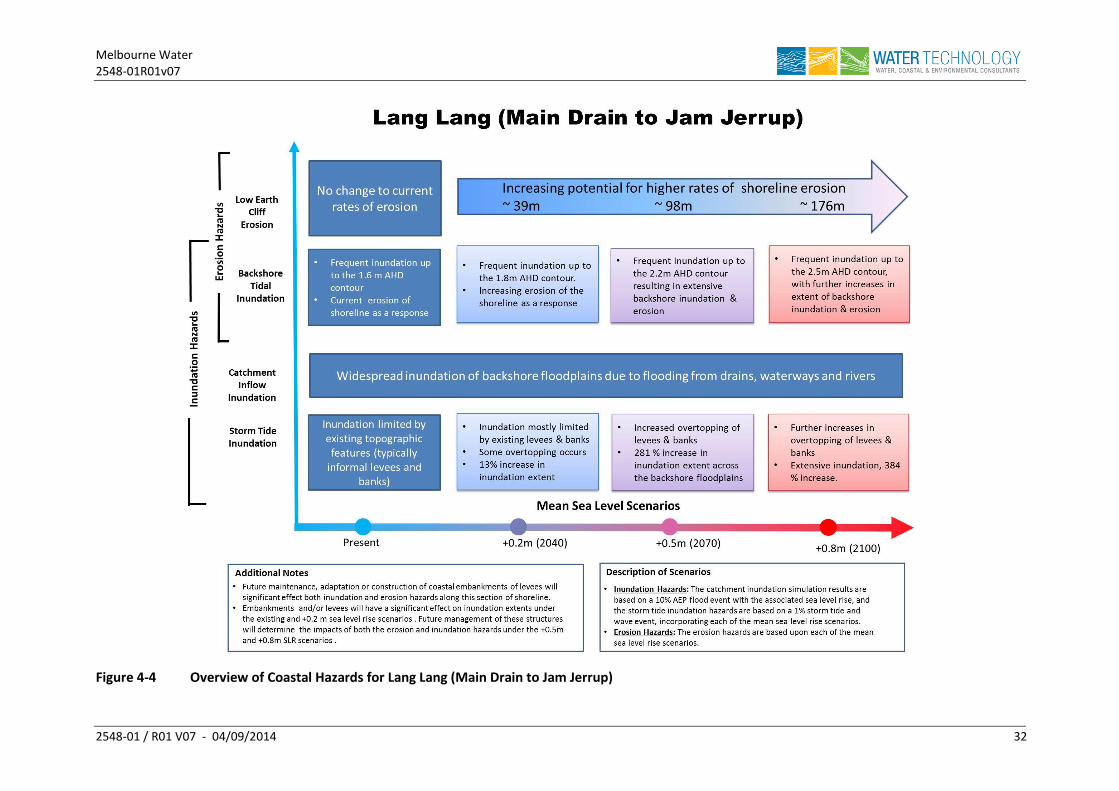
Melbourne Water 2548-01R01v07
2548-01 / R01 V07 - 04/09/2014 32
Figure 4-4 Overview of Coastal Hazards for Lang Lang (Main Drain to Jam Jerrup)

Melbourne Water 2548-01R01v07
2548-01 / R01 V07 - 04/09/2014 33
Figure 4-5 Overview of Coastal Hazards for Rhyll Inlet and Silverleaves

Melbourne Water 2548-01R01v07
2548-01 / R01 V07 - 04/09/2014 34
5. OUTPUTS
5.1 Hazard Mapping
The key output of the coastal hazards assessments for both the Part A and Part B are erosion and inundation hazard extents in the form of GIS layers along the full length of the Western Port shoreline, defined by the study area. A layer has been produced to quantify the extent of the erosion or inundation hazard for each sea level rise scenario investigated. Details of the specific assessment methods applied to different sections of shoreline or hazard types and used to derive the hazard extents are described in Reports 4, 5 and 6.
The erosion hazard extents have been mapped based on specific rules for each shoreline type (or local conditions for the representative locations). The inundation hazard extents were mapped based on the outputs from the hydrodynamic modelling which has been smoothed to match in with the local elevation model.
All hazard extents are relative to a shoreline delineated relative to the mean high water springs (MHWS) tidal plane and subsequent variation in Western Port.
A summary of the GIS layers and associated metadata provided as outputs from this study is noted in Section 1.5. Figure 5-1 to Figure 5-6 provide an overview of the mapped inundation and hazard extents along the Western Port shoreline.
5.2 How to Use the Study Outputs
The information contained in the series of reports produced in this study along with the GIS datasets can be used to provide a better understanding of coastal hazards in any specific area of interest, particularly in relation to the key processes and drivers of change and how these may be impacted by sea level rise. Figure 5-7 outlines the typical process for applying the project outputs to assess potential hazards (and hence risks) for a particular section of the Western Port shoreline.
The recommendations provided in the various study reports, with regard to future data collection and monitoring, knowledge gaps, and assessments, aim to further improve certainty and confidence in the outputs of this study.

Melbourne Water 2548-01R01v07
2548-01 / R01 V07 - 04/09/2014 35
Figure 5-1 Inundation Hazard Extents for Western Port – Map 1

Melbourne Water 2548-01R01v07
2548-01 / R01 V07 - 04/09/2014 36
Figure 5-2 Inundation Hazard Extents for Western Port – Map 2

Melbourne Water 2548-01R01v07
2548-01 / R01 V07 - 04/09/2014 37
Figure 5-3 Inundation Hazard Extents for Western Port – Map 3

Melbourne Water 2548-01R01v07
2548-01 / R01 V07 - 04/09/2014 38
Figure 5-4 Erosion Hazard Extents for Western Port – Map 1

Melbourne Water 2548-01R01v07
2548-01 / R01 V07 - 04/09/2014 39
Figure 5-5 Erosion Hazard Extents for Western Port – Map 2

Melbourne Water 2548-01R01v07
2548-01 / R01 V07 - 04/09/2014 40
Figure 5-6 Erosion Hazard Extents for Western Port – Map 3

Melbourne Water 2548-01R01v07
2548-01 / R01 V07 - 04/09/2014 41
Figure 5-7 How to Use the Study Outputs for a Local Coastal Hazard Assessment
•Use Figure 4-1 (R05) or (R06) to identify what Shoreline Type the area of interest is located within
Locate Shoreline Area of Interest
•Review relevent shoreline type in Chapter 3 (R05) or (R06)
•Understand key processes & drivers, historical change & future response as shown in the conceptual diagrams
Develop Understanding of the
Shoreline Type
•Refer to GIS datasets, Chapter 4 (R05) or (R06)
•Visualise the potential erosion hazard extent for the area of interest for each sea level rise scenario
Consider Future Erosion Hazard Zones
•Review other issues/considerations for the shoreline type e.g. existing shoreline structures, timescales etc
•Consider uncertainties in existing knowledge (R05, R06)
Understand Uncertainties
•Use the information in Chapter 4 (R04) or (R06) to understand potential inundation hazard for a location
• What is the key driver- storm surge / catchment flooding?
Understand inundation processes
•Refer to the inundation hazard GIS datasets, Chapter 4 (R04) or (R06)
•Visualise the potential inundation hazard extent for the area of interest for each sea level rise scenario
Consider Future Inundation Hazard
Zones
•Review other issues/considerations for the location e.g. existing shoreline structures, timescales etc
•Consider uncertainties (R04, R06) and how they may affect the location
Understand Uncertainties
Erosion Hazard Assessment Inundation Hazard Assessment
Using the information from the Erosion and Inundation Hazard Assessments (above) develop a Local Hazard Assessment

Melbourne Water 2548-01R01v07
2548-01 / R01 V07 - 04/09/2014 42
6. REFERENCES
Boon, P. I., Allen, T., Brook, J., Carr, G., Frood, D., Hoye., J, Harty, C., McMahon, A., Mathews, S., Rosengren, N., Sinclair, S., White, M. & Yugovic, J. (2011). Mangroves and coastal saltmarsh of Victoria: distribution, condition, threats and management. Melbourne. Available on-line at: http://www.vu.edu.au/institute-for-sustainability-and-innovation-isi/publications: Institute for Sustainability and Innovation, Victoria University.
Carr, G. (2012). Inventory of Victorian marine, estuarine and saltmarsh vascular plant species. In H. J. Sainty G, Estuary plants and what’s happening to them in south-east Australia. (pp. 398-419). Potts Point: Sainty & Associates.
CSIRO (2013). Coastal erosion data, Western Port Bay Project, accessed on line http://csirocameras.com/view
Department of Environment and Heritage Protection (2013) Coastal Hazard Technical Guidelines, The State of Queensland
Duke, N. (2006). Australia’s mangroves. The authoritative guide to Australia’s mangrove plants. St Lucia: University of Queensland Press.
Ivkovic, K.M. Marshall, S.K. Morgan, L.K. Werner, A.D. Carey, H. Cook, S. Sundaram, B. Norman, R. Wallace, L. Caruana, L. Dixon-Jain, P. and Simon, D. (2012). National-scale vulnerability assessment of seawater intrusion: summary report, Waterlines Report, National Water Commission, Canberra
Laegdsgaard P, K. J. (2009). Protection and management of coastal saltmarsh. In S. N, Australian saltmarsh ecology. (pp. 179-210). Collingwood: CSIRO Publishing.
Laegdsgaard, P. (2006 & 2008). Ecology, disturbance and restoration of coastal saltmarsh in Australia: a review. Wetlands Ecology and Management, 379-399.
Marsden, M.H. Mallet, C.W. and Donaldson, A.K. (1979). Geological and Physical Setting, Sediments and Environments, Western Port, Victoria, Marine Geology, 30 (1979), 11-46
Victorian Coastal Council (2008). Victorian Coastal Strategy 2008 http://www.vcc.vic.gov.au/resources/VCS2008/purpose.htm
Victorian Coastal Hazard Guide (2010), Department of Sustainability and Environment, East Melbourne