western regional air partnership (wrap) west-wide · pdf file · 2013-06-13western...
TRANSCRIPT
July 20, 2011
1
Western Regional Air Partnership (WRAP)
West-wide Jump Start Air Quality Modeling Study
(WestJumpAQMS)
SCOPE OF WORK Revised from February 23, 2011 original
Prepared for: Tom Moore
Western Regional Air Partnership c/o CIRA, Colorado State University
1375 Campus Delivery Fort Collins, CO 80523-1375
Prepared by:
ENVIRON International Corporation 773 San Marin Drive, Suite 2115
Novato, California, 94945 P-415-899-0700 F-415-899-0707
Alpine Geophysics, LLC
University of North Carolina
July 20, 2011

July 20, 2011
2
July 20, 2011
3
1.0 INTRODUCTION
ENVIRON International Corporation (ENVIRON), Alpine Geophysics, LLC (Alpine) and the University of North Carolina (UNC) at Chapel Hill Institute for Environment have prepared this scope of work, schedule and cost estimate for conducting the Western Regional Air Partnership (WRAP) Western U.S. Jump Start Air Quality Modeling Study (WestJumpAQMS). The objectives of the WestJumpAQMS are as follows:
• Initiate the next generation of regional technical analysis and support for ozone transport and attainment demonstrations for the Intermountain West.
• Further the concept developed by New Mexico Environment Department Air Quality Bureau, EPA Region 6, the Bureau of Land Management (BLM) New Mexico office, British Petroleum (BP), and the Western Regional Air Partnership (WRAP).
• Continue work conducted at the WRAP Regional Modeling Center (RMC) from 2001-2009 to provide regionally complete and consistent emissions and air quality modeling for the western U.S. The RMC modeling products became the basis of many state and federal land manager air analyses in the West, including numerous NEPA studies, the Denver ozone study, and the Four Corners Air Quality Task Force (FCAQTF) work. The regional collaboration initiated by the WRAP RMC was effective and efficient for state and regional planning, and will feedback to the WestJumpAQMS through the application of WRAP-IPAMS work to compile Oil and Gas VOC and NOX emission inventories.
• Leverage recent modeling and monitoring analyses that suggest both natural ozone impacts and international impacts are occurring in elevated rural terrain in the spring and the impacts from such events may be above the level of the revised standard.
• Provide a modeling platform to begin addressing the next generation of air quality issues related to particulate matter (PM2.5 and PM10), visibility and nitrogen and sulfur (acid) deposition.
The goals of the WestJumpAQMS include the following:
1. Incorporate all of the recent western modeling analyses into a single modeling database 2. Perform a comprehensive model performance evaluation in an open technical forum
independent of any specific project or regulatory activity 3. Perform a comprehensive source apportionment analysis to evaluate local, regional,
international, and natural source impacts on elevated ozone concentrations (both rural and urban) across the west
4. Develop a modeling platform that can be used to conduct or as a starting point for SIP analyses, regional air quality planning and NEPA (EIS) analyses in the west
5. Evaluate local and regional control strategies that can be used to demonstrate compliance with new air quality standards
6. Provide a framework and recommendations for performing future analysis to address ozone, PM, visibility, and deposition issues in the western U.S.
Forthcoming revised ozone standards will drive a great deal of the emerging air quality analysis needs in the West and depending on the level at which the standard is established, may require innovative regional solutions to achieve compliance. To that end, WRAP has been working with its partners to develop a plan for 2011 that initiates gathering of air quality data and improvements to air quality models and source apportionment work. To provide resources for this work, WRAP has acquired initial funding from western states, EPA, BLM and BP.
July 20, 2011
4
1.1 BACKGROUND
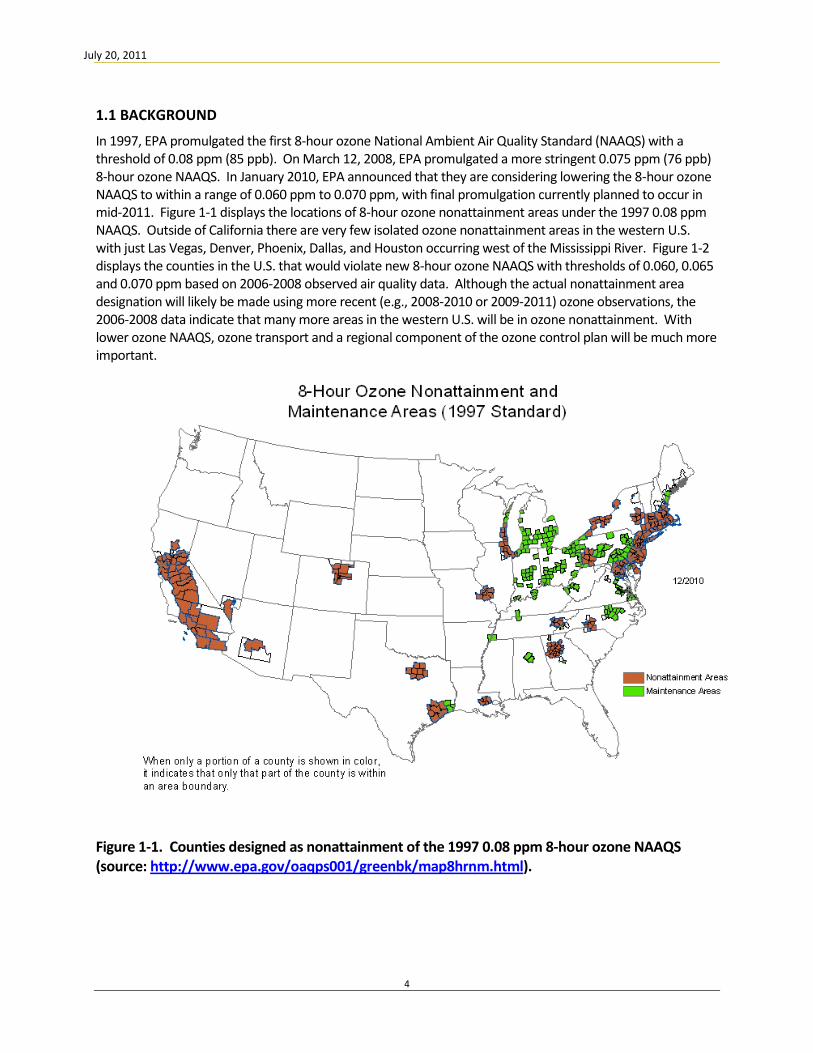
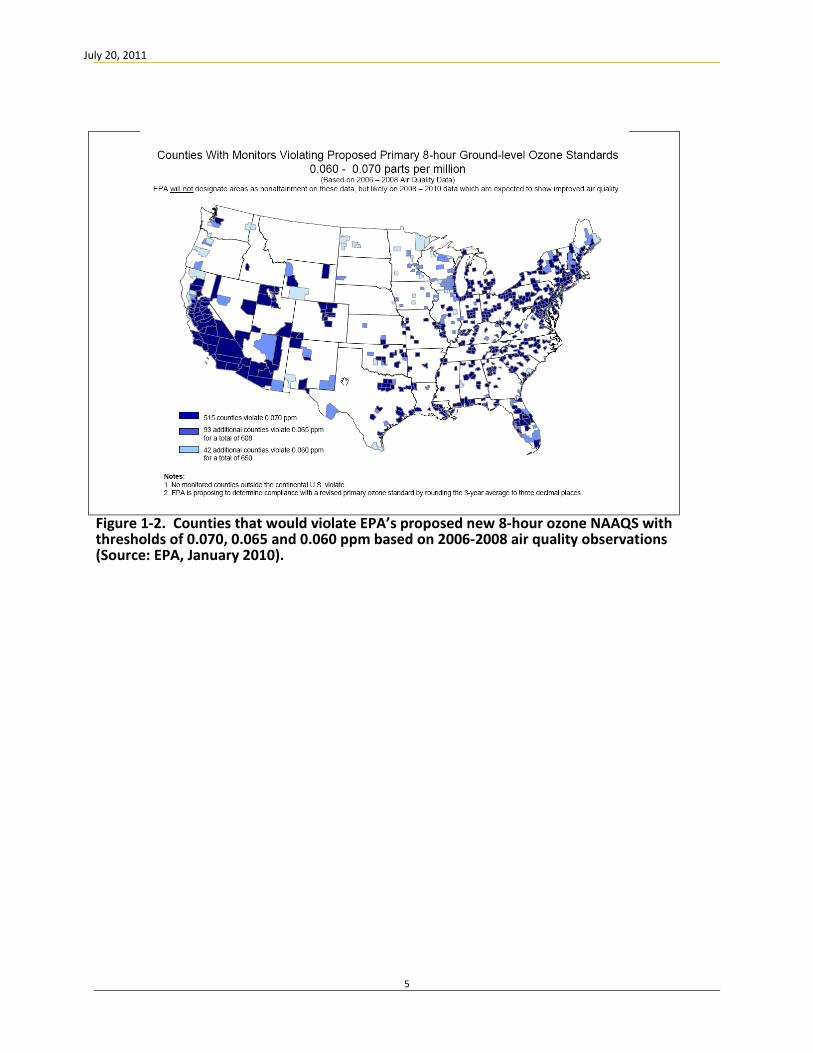
In 1997, EPA promulgated the first 8-hour ozone National Ambient Air Quality Standard (NAAQS) with a threshold of 0.08 ppm (85 ppb). On March 12, 2008, EPA promulgated a more stringent 0.075 ppm (76 ppb) 8-hour ozone NAAQS. In January 2010, EPA announced that they are considering lowering the 8-hour ozone NAAQS to within a range of 0.060 ppm to 0.070 ppm, with final promulgation currently planned to occur in mid-2011. Figure 1-1 displays the locations of 8-hour ozone nonattainment areas under the 1997 0.08 ppm NAAQS. Outside of California there are very few isolated ozone nonattainment areas in the western U.S. with just Las Vegas, Denver, Phoenix, Dallas, and Houston occurring west of the Mississippi River. Figure 1-2 displays the counties in the U.S. that would violate new 8-hour ozone NAAQS with thresholds of 0.060, 0.065 and 0.070 ppm based on 2006-2008 observed air quality data. Although the actual nonattainment area designation will likely be made using more recent (e.g., 2008-2010 or 2009-2011) ozone observations, the 2006-2008 data indicate that many more areas in the western U.S. will be in ozone nonattainment. With lower ozone NAAQS, ozone transport and a regional component of the ozone control plan will be much more important.
Figure 1-1. Counties designed as nonattainment of the 1997 0.08 ppm 8-hour ozone NAAQS (source: http://www.epa.gov/oaqps001/greenbk/map8hrnm.html).
July 20, 2011
5
Figure 1-2. Counties that would violate EPA’s proposed new 8-hour ozone NAAQS with thresholds of 0.070, 0.065 and 0.060 ppm based on 2006-2008 air quality observations (Source: EPA, January 2010).
July 20, 2011
6
.2 OVERVIEW OF APPROACH
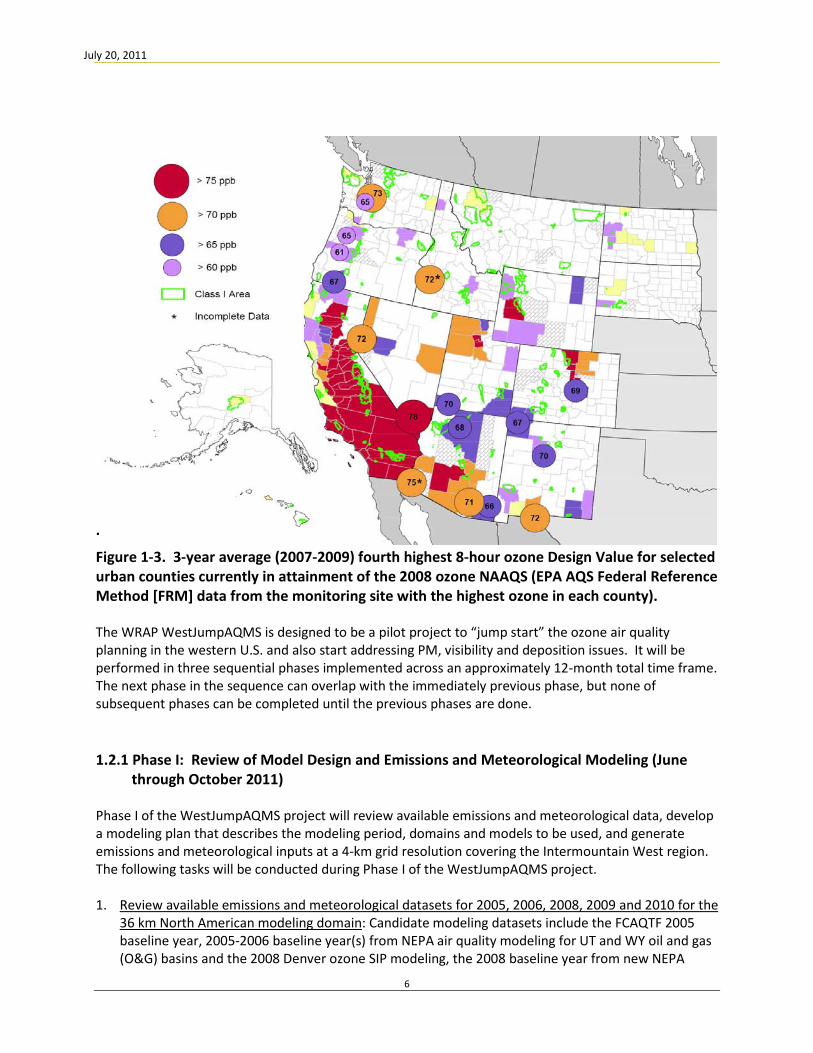
Figure 1-3. 3-year average (2007-2009) fourth highest 8-hour ozone Design Value for selected urban counties currently in attainment of the 2008 ozone NAAQS (EPA AQS Federal Reference Method [FRM] data from the monitoring site with the highest ozone in each county). The WRAP WestJumpAQMS is designed to be a pilot project to “jump start” the ozone air quality planning in the western U.S. and also start addressing PM, visibility and deposition issues. It will be performed in three sequential phases implemented across an approximately 12-month total time frame. The next phase in the sequence can overlap with the immediately previous phase, but none of subsequent phases can be completed until the previous phases are done. 1.2.1 Phase I: Review of Model Design and Emissions and Meteorological Modeling (June
through October 2011)
Phase I of the WestJumpAQMS project will review available emissions and meteorological data, develop a modeling plan that describes the modeling period, domains and models to be used, and generate emissions and meteorological inputs at a 4-km grid resolution covering the Intermountain West region. The following tasks will be conducted during Phase I of the WestJumpAQMS project.
1. Review available emissions and meteorological datasets for 2005, 2006, 2008, 2009 and 2010 for the
36 km North American modeling domain: Candidate modeling datasets include the FCAQTF 2005 baseline year, 2005-2006 baseline year(s) from NEPA air quality modeling for UT and WY oil and gas (O&G) basins and the 2008 Denver ozone SIP modeling, the 2008 baseline year from new NEPA
July 20, 2011
7
planning activities (e.g., Wyoming LaBarge, GMI and Beaver Creek and Colorado Grand Junction and Uncompahgre RMPs), the 2009 baseline year from the National Park Service (NPS) Rocky Mountain Atmospheric Nitrogen and Sulfur study Phase II (RoMANS2), and the proposed 2010 baseline year that future NEPA planning in Utah may use. It is important to review these and other data for consistency, completeness and comparability. Objectives of this review process will include: • Assess completeness, representativeness, and performance testing results for the
WestJumpAQMS. • Select the WestJumpAQMS baseline modeling year. Factors that will be considered in selecting
the modeling year include: o Meteorology and emissions data availability from one of the studies listed above; o Representativeness and completeness of these datasets; o The feasibility of integrating, modifying, and/or supplementing the available data from the
above list to best represent a specific base year; o The feasibility of selecting a more recent year (e.g., 2010) and modifying the available data
from the above list to represent growth/controls through 2010; o The effort required to compile and build a completely new inventory database that uses a
preliminary version of the National Emissions Inventory 2008 (NEI2008), or other state or national inventory databases.
o Based on our review, the 2008 modeling year was selected for the initial analysis. • Project WRAP-IPAMS Phase III oil and gas 2006 base year inventories1
• Prepare a “Phase III-light” oil and gas emissions inventory for the Permian Basin of southeast NM and west TX, building on work for the BLM by other consulting firms.
to reflect growth/changes in exploration and production activities, as well as controls in place, to represent 2008 actual emissions.
• Define the modeling domains o Review the available modeling datasets to determine if they coincide with the proposed
WestJumpAQMS modeling domain o Define the 36 km continental U.S. (CONUS) modeling domain. o Define the 12 km western U.S. (WESTUS) modeling domain. o Define the 4 km Intermountain West meteorological and emissions Processing Domain
(IWPD). o Define 4 km Detailed Source Apportionment Domains (DSADs) that can be used in fully
linked two-way nesting 36/12/4 km source apportionment modeling to address upwind and downwind regional transport.
o Define 4 km Impact Assessment Domains (IADs) that can be used as stand-alone 4 km domains (i.e., one-way nesting between the 36/12 km domains and 4 km IADs) for performing air impact assessments of projects or sources within the 4 km IAD.
• Review and evaluate available emissions and meteorological databases for the baseline modeling year. o Determine if the available datasets can be used to meet the goals of the WestJumpAQMS o Compile additional emissions data and process for WestJumpAQMS modeling domain(s) and
time period(s) as needed. o Compile additional meteorological data as needed.
• Select the photochemical grid model(s) and configuration for the WestJumpAQMS project. • Report in technical memo.
1 http://www.wrapair2.org/PhaseIII.aspx
July 20, 2011
8
2. Process available or generated emissions and meteorological datasets for the base modeling year using a 4-km grid resolution for the Intermountain West Processing Domain (IWPD): The second major work element under Phase I will be to generate regional 36/12-km modeling databases and process meteorological and emissions data at 4-km resolution for the Intermountain West. • Process emissions for WestJumpAQMS modeling domain(s) and time period(s) as needed. • Conduct additional meteorology modeling as needed. Use nudging, lessons learned in BLM
NEPA work, FCAQTF work, Denver ozone SIP work and Wyoming meteorological modeling studies o Analyze use of WRF vs. MM5 as the prognostic meteorological model o Apply the higher-performing of the two meteorological models. o Detailed modeling performance evaluation that includes individual site comparisons not just
ensemble averages Phase I Deliverables:
• Modeling plan that provides a basic summary of the procedures, data, domains and models to be used for the WestJumpAQMS project (a formal Modeling Protocol will be prepared under Phase II).
• Process all meteorology in the Intermountain West at 4-km (IWPD) using the selected modeling system/configuration.
• Process all emissions in Intermountain West at 4-km, (to allow recombining as desired to 12-km for 4-km nesting) and 36-km for continental U.S.
• A website for the WestJumpAQMS Project providing access to documents, files, analytical results, and reference materials. Transfer of 36/12/4-km data files to WRAP members would be handled externally on portable hard drives by the contractor team at the direction from the WRAP project manager and tracked on the website.
1.2.2 Phase II: Model Improvements & Base Case Modeling (October 2011 through January 2012)
Phase II of the WestJumpAQMS will review and implement the latest model improvements, prepare photochemical grid model inputs for the selected base modeling year and domains and perform a base-year base-case simulation and model performance evaluation. The following tasks will be conducted during Phase II of the WestJumpAQMS project.
1. Incorporate available model physics and parameterizations improvements and updates: This task
will build upon the work that American Petroleum Institute (API) has done (Emery et al., 2009a,b) with CAMx to refine the vertical velocity formulation in the model. Other potential model improvements will also be investigated.
2. Establish boundary conditions based on a review of previous GEOS-Chem modeling, MOZART modeling, API boundary condition (BC) evaluations and other potential data sources (e.g., EPA, CAM-Chem modeling): Use previous modeling data to establish the accuracy of BC predictions that are used in the overall modeling. Such evaluations should use existing data and evaluate model performance for all seasons of the year. • This task will include an option to evaluate impacts of uncertainties in specification of BCs,
which includes evaluating BC data against appropriate measurements (e.g., ozonesondes, remote monitoring sites, etc.)
July 20, 2011
9
3. Develop a draft modeling protocol document that details the procedures for conducting the modeling in the WestJumpAQMS: The protocol will be developed following EPA’s emissions and air quality modeling guidance and define air quality model performance test metrics (individual site statistics, unmonitored grid cell results, station ensemble averages, spatial and/or temporal averaging methods, soccer and bugle plots, et cetera). In addition to the content specified by the EPA guidance, the protocol will include the following: • Details on the definitions of the DSAD and IAD 4 km domains. • Procedures for adding more Class I area receptors in the study area to improve model
performance evaluation, source apportionment among nested gridded simulations, and making the results available for the added Class I locations to serve NAAQS air quality planning and NEPA air quality analyses.
• Guidance regarding how to use model predictions in regions with sparse monitoring data. • In an Appendix to the Modeling Protocol, for future-year air quality modeling simulations not
included in this project, a description of how NEPA-related project-level emissions inventories with ranges of potential development, will be processed into future WRAP projection scenarios while preventing double-counting of emissions sources to enable future air quality projection modeling simulations of cumulative air quality impacts, at a quality-completeness-representativeness suitable for air quality planning to the requirement of the NAAQS. This will be called the “Data Exchange Protocol”.
4. Perform base case modeling and model performance evaluation: This task will include conducting subregional evaluation for key locations and evaluation at individual monitors for key sites.
5. Develop and implement tools on the project website to allow use of simplified air quality screening
methods, based on using data from Phases I and II from this project, and readily available data from outside the WestJumpAQMS project: This task will develop an interactive website that will allow the project participants to explore the air quality, meteorological and emissions databases developed as part of Phase I and perform simplified calculations.
Phase II Deliverables:
• Draft and final Modeling Protocol documents. • NEPA “Data Exchange Protocol”. • Results from Tasks 1-4 in a report describing applications/limitations of each element. • Website addition of screening tools to analyze data and results.
1.2.3 Phase III: Source Apportionment & Future Analysis Issues (January through May 2012) The following tasks will be conducted during Phase III of the WestJumpAQMS project. 1. Apply ozone and PM source apportionment methods to simulate ozone and PM air quality and
calculate associated visibility impairment for the base case: Under this task we will identify number of simulations and how those project decisions will be made and define and perform ozone and PM source apportionment modeling for the western U.S. a. For all monitoring sites in the 12-km western domain identified in Phase II, we will analyze and
report the upwind sources and geographic areas contributing to Ozone and PM air quality impacts; and
July 20, 2011
10
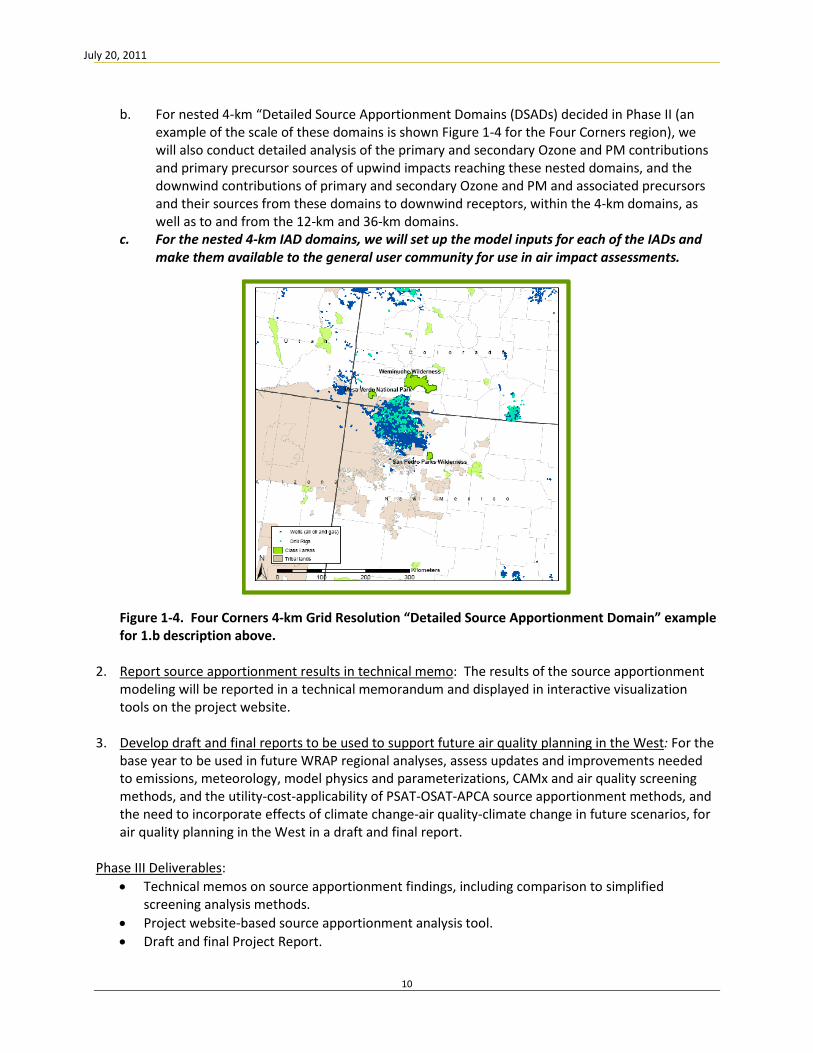
b. For nested 4-km “Detailed Source Apportionment Domains (DSADs) decided in Phase II (an example of the scale of these domains is shown Figure 1-4 for the Four Corners region), we will also conduct detailed analysis of the primary and secondary Ozone and PM contributions and primary precursor sources of upwind impacts reaching these nested domains, and the downwind contributions of primary and secondary Ozone and PM and associated precursors and their sources from these domains to downwind receptors, within the 4-km domains, as well as to and from the 12-km and 36-km domains.
c. For the nested 4-km IAD domains, we will set up the model inputs for each of the IADs and make them available to the general user community for use in air impact assessments.
Figure 1-4. Four Corners 4-km Grid Resolution “Detailed Source Apportionment Domain” example for 1.b description above.
2. Report source apportionment results in technical memo: The results of the source apportionment modeling will be reported in a technical memorandum and displayed in interactive visualization tools on the project website.
3. Develop draft and final reports to be used to support future air quality planning in the West: For the
base year to be used in future WRAP regional analyses, assess updates and improvements needed to emissions, meteorology, model physics and parameterizations, CAMx and air quality screening methods, and the utility-cost-applicability of PSAT-OSAT-APCA source apportionment methods, and the need to incorporate effects of climate change-air quality-climate change in future scenarios, for air quality planning in the West in a draft and final report.
Phase III Deliverables:
• Technical memos on source apportionment findings, including comparison to simplified screening analysis methods.
• Project website-based source apportionment analysis tool. • Draft and final Project Report.
July 20, 2011
11
Also included in Phases I, II and III are 3 one-day meeting presentations assumed to be in the greater Denver area (e.g., Denver or Fort Collins), several conference calls proportional to the level of effort for each task within each phase and monthly progress reports and invoices. 1.3 PROJECT MANAGEMENT
Mr. Tom Moore of the Western Governors’ Association (WGA), who coordinates the technical activities of the Western Regional Air Partnership (WRAP), will serve as Project Director and be the main contact between WRAP and the other sponsors and the contracting team. The contracting team will consist of ENVIRON International Corporation (ENVIRON) as the prime contractor with Alpine Geophysics, LLC (Alpine) and the University of North Carolina (UNC) at Chapel Hill Institute for Environment as subcontractors. Mr. Ralph Morris of ENVIRON will be the Project Manager for the contracting team, with Mr. Dennis McNally and Mr. Zac Adelman leading the work at, respectively, Alpine and UNC. Mr. Morris has over 30 years experience in meteorological, emissions and photochemical grid modeling and has led numerous similar large air quality modeling studies including, the recent 2008 Denver ozone SIP2 as well as the 2004 Denver 8-hour ozone Early Action Compact (EAC) SIP3, the southeastern states (VISTAS) visibility4 and 8-hour ozone and PM2.5 SIPs (ASIP)5, and the central states (CENRAP) visibility SIPs6. Mr. Morris and Mr. Zac Adelman were also key analysts and data managers for the WRAP Technical Support System in their capacities as Co-Principal Investigators for the WRAP Regional Modeling Center (RMC)7
2
. Messrs. McNally and Adelman also bring substantial experience in regional meteorological, emissions and photochemical modeling to the WestJumpAQMS project.
http://www.colorado.gov/airquality/documents/deno308/ 3 http://www.colorado.gov/airquality/documents/eac/ 4 http://www.vistas-sesarm.org/ 5 http://www.metro4-sesarm.org/vistas/sesarmASIP.htm 6 http://www.cenrap.org/ 7 http://vista.cira.colostate.edu/tss/ and http://pah.cert.ucr.edu/aqm/308/

July 20, 2011
12
2.0 TECHNICAL APPROACH Below we present details of our technical approach for carrying out the three Phases of the WestJumpAQMS project.
2.1 PHASE I: REVIEW OF MODEL DESIGN AND EMISISONS AND METEOROLOGICAL MODELING
2.1.1 Task 1A: Management, Meetings and Reporting
Objective: To manage the Phase I project activities, including conference calls, a meeting with presentations, monthly progress reports and invoices, and day-to-day management of the project.
Approach:
We have budgeted one meeting in the greater Denver area that will be attended by Mr. Morris and Mr. McNally, where we will make a presentation on the progress of the WestJumpAQMS project.
Mr. Ralph Morris will be the Project Manager of the project and coordinate activities with ENVIRON staff and the Subcontractors. Mr. Dennis McNally will lead the activities of Alpine and Mr. Zac Adelman will lead UNC’s activities. Mr. Morris will coordinate project conference calls with the WRAP Project Director, Mr. Tom Moore, bringing in appropriate staff from the ENVIRON/Alpine/UNC Team for the topic(s) to be discussed. We will prepare PowerPoint presentations for conference calls and meetings.
Mr. Morris will also prepare monthly progress reports and invoices that detail:
• The progress on each active task in the previous month • The number of hours spent by staff during the previous month • Any indirect costs and their justification • The percent completion of each task and remaining funds • Any problems encountered and their proposed resolution
Deliverables
: Project management, conference calls, project meeting, PowerPoint presentations, and monthly progress reports and invoices.
2.1.2 Task 1B: Review Air Quality, Emissions and Meteorological Data
Objective: To review available air quality, emissions and meteorological data and select best data and approach for modeling ozone and PM in the western U.S.
Approach
: We will review available air quality, emissions, and meteorological databases that can be used to conduct air quality modeling for the WestJumpAQMS. We will develop a draft Modeling Plan that contains the results of the review and a plan for the WestJumpAQMS modeling approach, including recommendations for a base modeling year, modeling domains, modeling software, and sources of emissions and meteorological data. The draft Modeling Plan will be a working document to help define the overall design of the WestJumpAQMS modeling approach. We will use the draft Modeling Plan to reach consensus on the approach with the Project Director, project sponsors and contracting team. A more formal Modeling Protocol will be prepared under Task 2C.
Air quality data will be reviewed to help select a baseline modeling year for the project. We will seek a recent year, such as from the 2008-2010 period, for consistency with what the EPA will likely use for defining ozone nonattainment areas (NAA) under the new ozone NAAQS that are expected in July 2011. We will select the
Base Modeling Year Review and Selection

July 20, 2011
13
baseline modeling year based on the severity of ozone air quality problem in the western U.S. and the availability of appropriate air quality, emissions and meteorological data. As 2009 represents one of the cleanest ozone years in the western U.S. on recent record it would be a poor choice for the baseline modeling year. The year 2008 is the best candidate for the baseline modeling year because it is a National Emissions Inventory (NEI) year, has existing WRF and MM5 meteorological data and 2010 will not have complete air quality data available at the beginning of the WestJumpAQMS project (e.g., 2010 IMPROVE measurements won’t be available until late 2011). Thus, we have selected 2008 as the modeling year for the WestJumpAQMS project. We will develop a draft modeling plan that describes the reasons for the selection of the 2008 baseline modeling year, modeling domains, and models to be used in the WestJumpAQMS project.
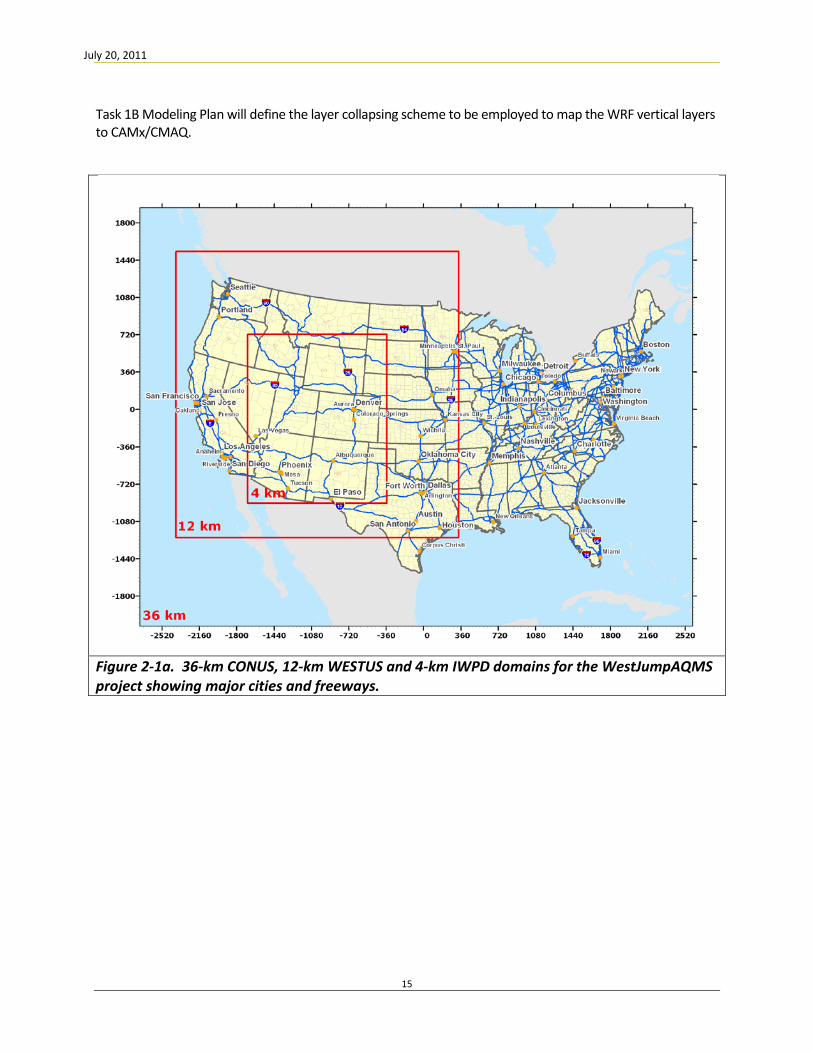
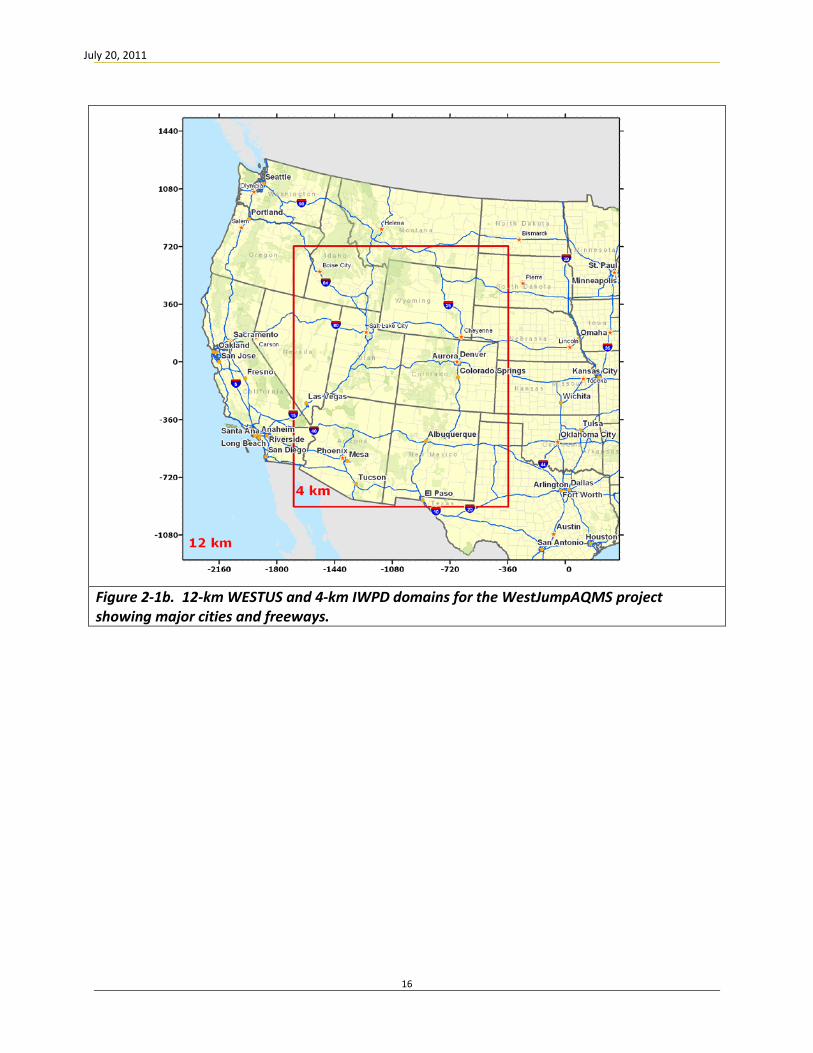
We propose to use a 36/12/4-km nested grid structure, following the 3:1 grid-nesting ratio typically used for MM5/WRF meteorological modeling. Figure 2-1 displays the 36-km continental U.S. (CONUS), 12-km western U.S. (WESTUS) modeling domains that we believe best meet the goals of the WestJumpAQMS project. The 36-km domain (Figure 2-1a) is the standard CONUS domain that has been adopted in numerous modeling studies (e.g., RPO modeling including the WRAP RMC work). The 12-km domain (Figures 2-1b and 2-1c) is an enlarged version of the WRAP RMC 12-km western U.S. domain
Horizontal Air Quality Modeling Domain Review and Selection
8
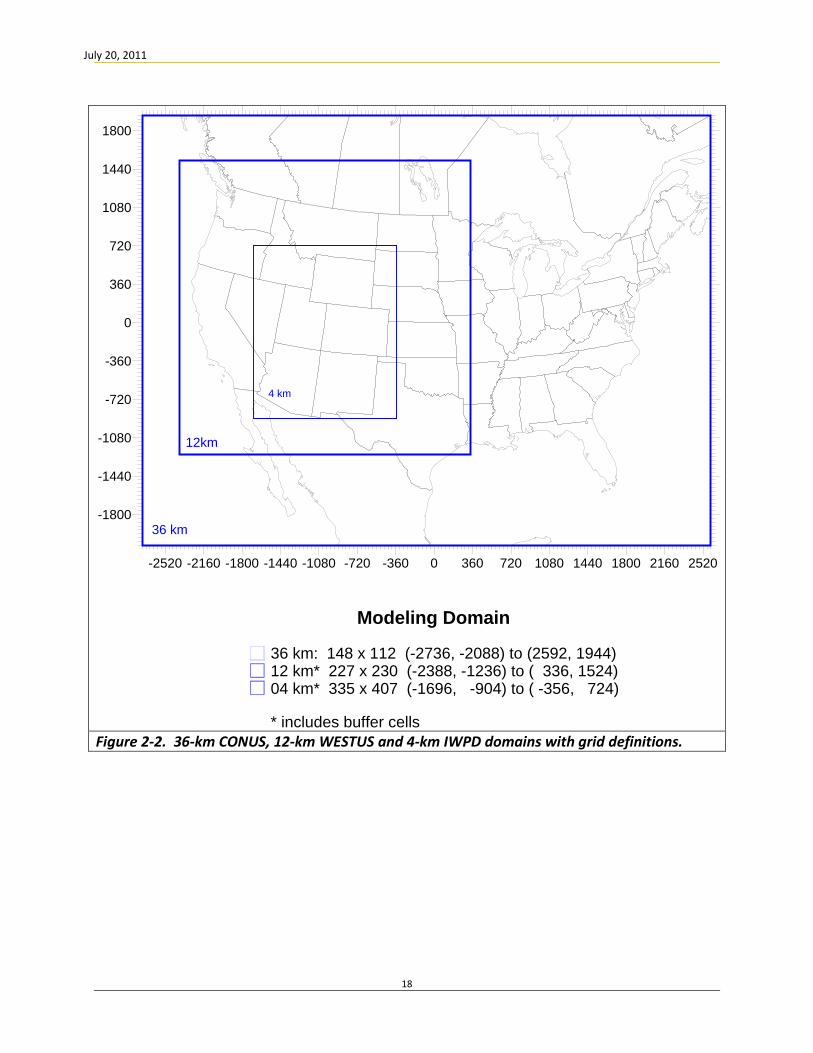
Also shown in Figure 2-1 is a 4-km Intermountain West Processing Domain (IWPD). We will develop emissions and meteorological inputs at 4-km grid resolution within the 4-km IWPD. Multiple 4-km domain nests for photochemical modeling can be specified for subsections of the 4-km processing domain by windowing in on the 4-km emissions and meteorological input data for the domain. The 4-km emissions and meteorological processing domain was selected to include the major oil and gas areas in the Intermountain West region from New Mexico to Wyoming as well as the Phoenix, Las Vegas and Boise urban areas. Figure 2-2 displays the 36-km CONUS, 12-km WESTUS and 4-km IWPD and their grid definitions.
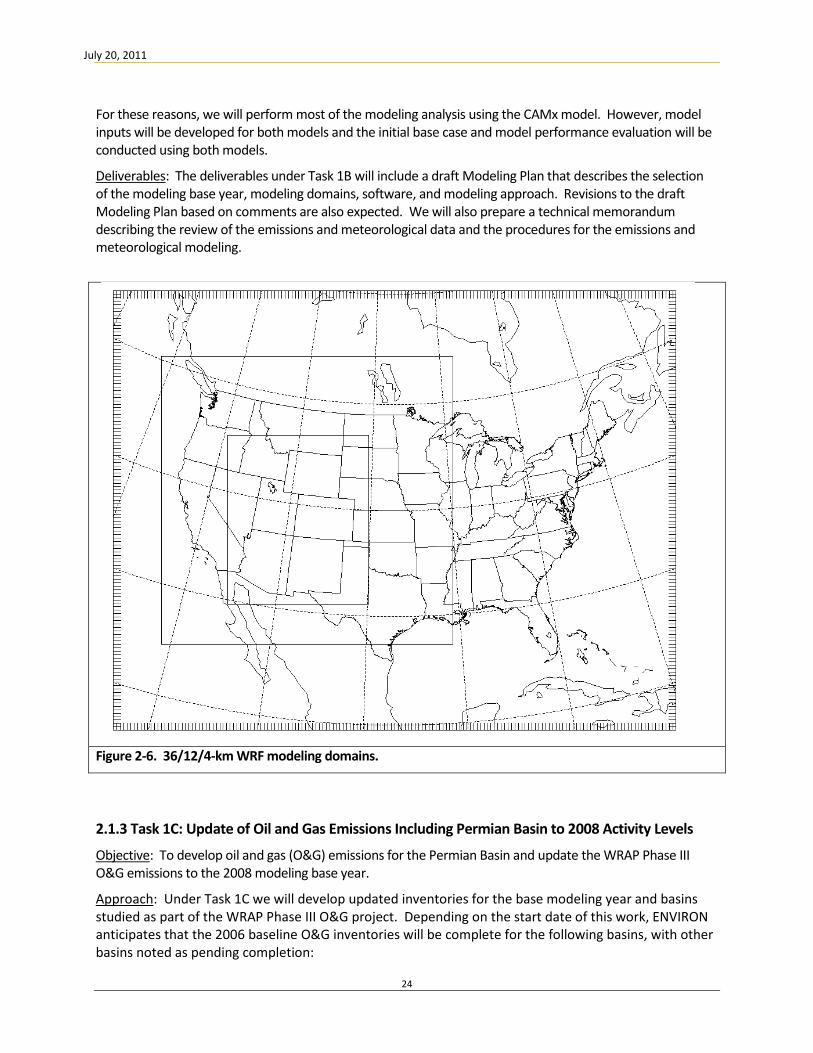
that has been expanded further north to include Vancouver, further south to include more of the Permian Basin as well as Houston and Big Bend and allow a buffer between the 12-km and 4-km domains and further east so that the impact of emissions from WRAP states on downwind nonattainment areas can be assessed. The 36-km CONUS and 12-km WESTUS domains will be used in the CAMx/CMAQ photochemical and SMOKE emissions modeling. The meteorological modeling domains will be defined slightly bigger than the photochemical/emissions modeling domains (see Figure 2-6).
There will be two types of 4-km nested grid domains that will be used in the photochemical modeling analysis:
• Detailed Source Apportionment Domains (DSAD) 4-km domains will be defined so that fully linked 36/12/4 km ozone and PM source apportionment modeling can be performed to examine the upwind transport of pollutants from throughout the 36/12/4 km CONUS region into the 4-km DSAD domains, as well as downwind transport of emissions from the DSAD and other regions on downwind ozone and PM concentrations; and
• Impact Assessment Domains (IAD) that will be larger 4-km domains and will be defined as stand-alone 4-km photochemical modeling databases using boundary conditions (BCs) from the 36/12 km modeling. The IADs are defined for performing air impact assessments of sources within the IAD 4-km domain on receptors within the IAD 4-km domain.
8 http://pah.cert.ucr.edu/aqm/308/index.shtml#domains
July 20, 2011
14
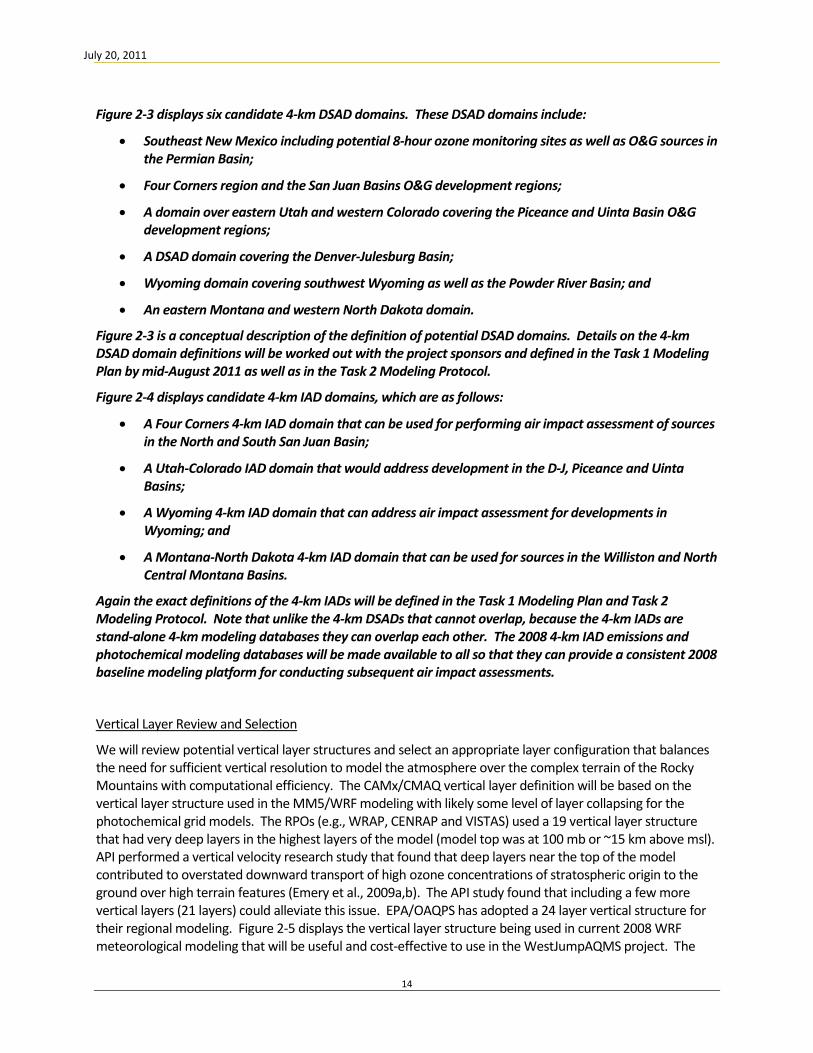
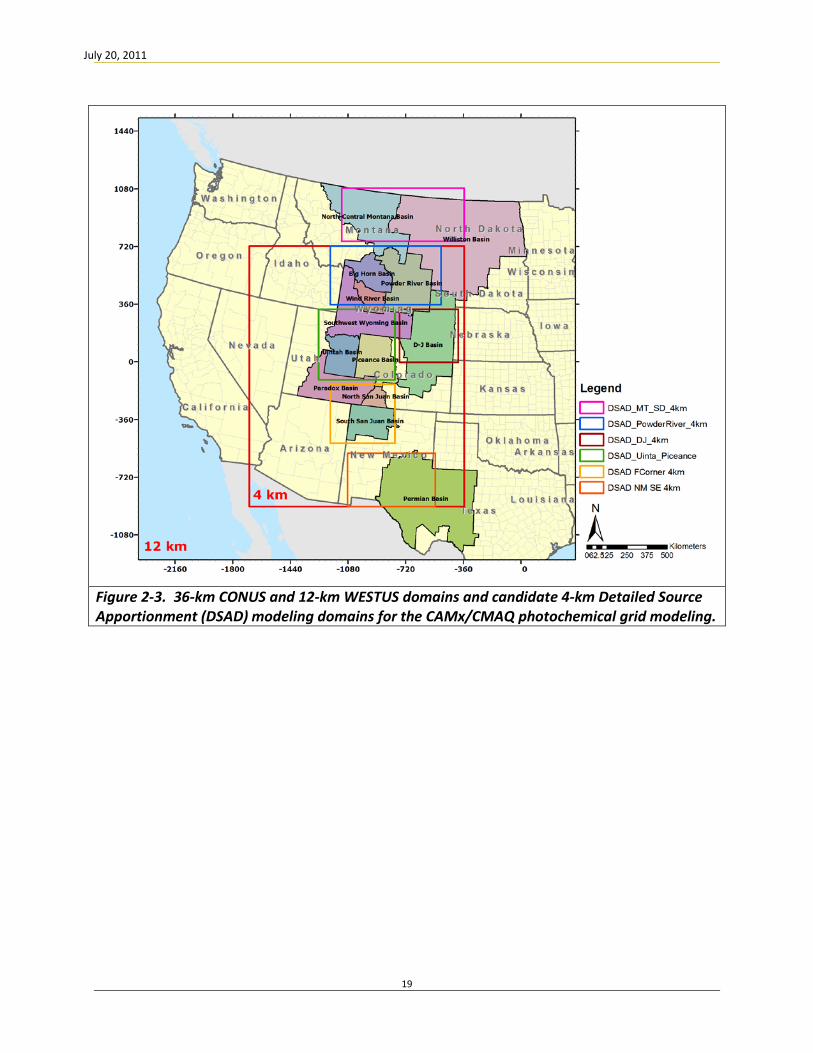
Figure 2-3 displays six candidate 4-km DSAD domains. These DSAD domains include:
• Southeast New Mexico including potential 8-hour ozone monitoring sites as well as O&G sources in the Permian Basin;
• Four Corners region and the San Juan Basins O&G development regions;
• A domain over eastern Utah and western Colorado covering the Piceance and Uinta Basin O&G development regions;
• A DSAD domain covering the Denver-Julesburg Basin;
• Wyoming domain covering southwest Wyoming as well as the Powder River Basin; and
• An eastern Montana and western North Dakota domain.
Figure 2-3 is a conceptual description of the definition of potential DSAD domains. Details on the 4-km DSAD domain definitions will be worked out with the project sponsors and defined in the Task 1 Modeling Plan by mid-August 2011 as well as in the Task 2 Modeling Protocol.
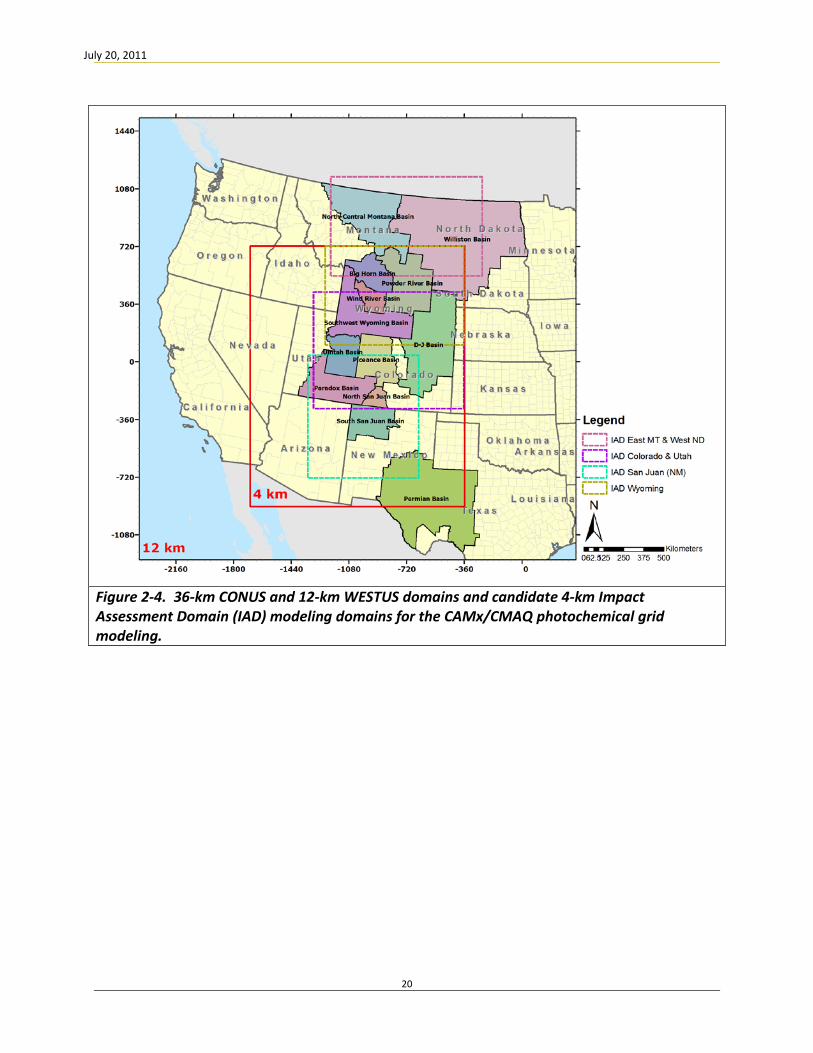
Figure 2-4 displays candidate 4-km IAD domains, which are as follows:
• A Four Corners 4-km IAD domain that can be used for performing air impact assessment of sources in the North and South San Juan Basin;
• A Utah-Colorado IAD domain that would address development in the D-J, Piceance and Uinta Basins;
• A Wyoming 4-km IAD domain that can address air impact assessment for developments in Wyoming; and
• A Montana-North Dakota 4-km IAD domain that can be used for sources in the Williston and North Central Montana Basins.
Again the exact definitions of the 4-km IADs will be defined in the Task 1 Modeling Plan and Task 2 Modeling Protocol. Note that unlike the 4-km DSADs that cannot overlap, because the 4-km IADs are stand-alone 4-km modeling databases they can overlap each other. The 2008 4-km IAD emissions and photochemical modeling databases will be made available to all so that they can provide a consistent 2008 baseline modeling platform for conducting subsequent air impact assessments.
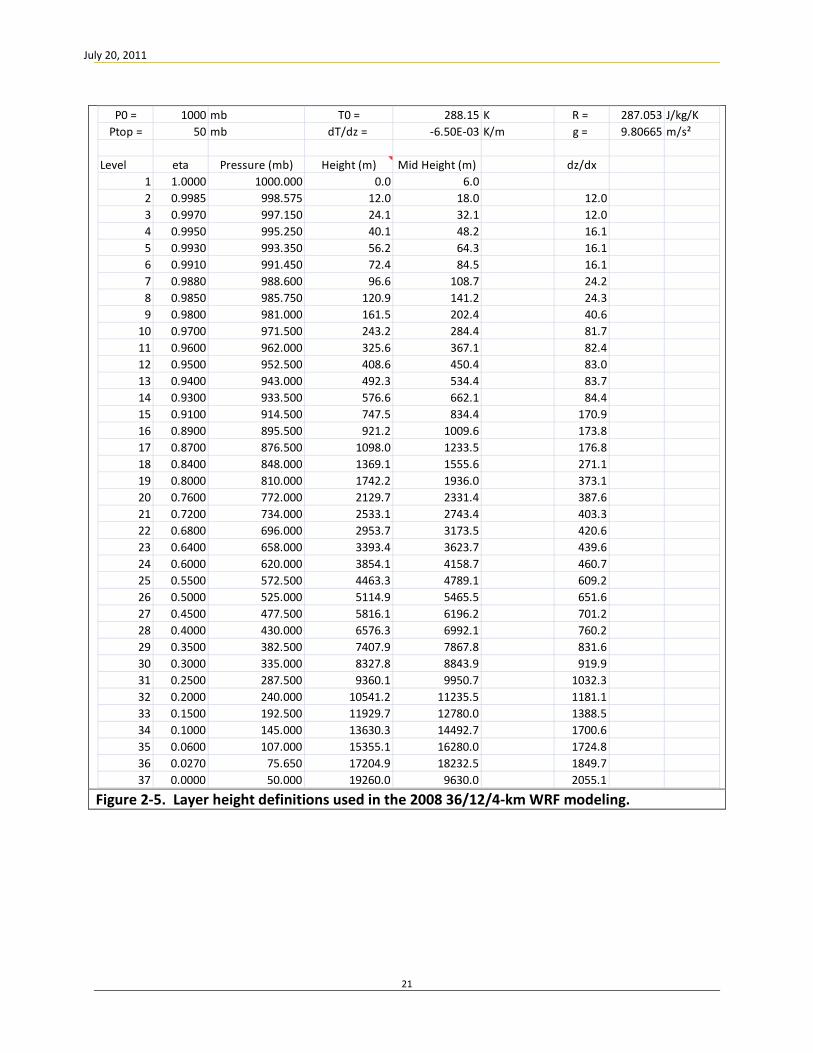
We will review potential vertical layer structures and select an appropriate layer configuration that balances the need for sufficient vertical resolution to model the atmosphere over the complex terrain of the Rocky Mountains with computational efficiency. The CAMx/CMAQ vertical layer definition will be based on the vertical layer structure used in the MM5/WRF modeling with likely some level of layer collapsing for the photochemical grid models. The RPOs (e.g., WRAP, CENRAP and VISTAS) used a 19 vertical layer structure that had very deep layers in the highest layers of the model (model top was at 100 mb or ~15 km above msl). API performed a vertical velocity research study that found that deep layers near the top of the model contributed to overstated downward transport of high ozone concentrations of stratospheric origin to the ground over high terrain features (Emery et al., 2009a,b). The API study found that including a few more vertical layers (21 layers) could alleviate this issue. EPA/OAQPS has adopted a 24 layer vertical structure for their regional modeling. Figure 2-5 displays the vertical layer structure being used in current 2008 WRF meteorological modeling that will be useful and cost-effective to use in the WestJumpAQMS project. The
Vertical Layer Review and Selection
July 20, 2011
15
Task 1B Modeling Plan will define the layer collapsing scheme to be employed to map the WRF vertical layers to CAMx/CMAQ.
Figure 2-1a. 36-km CONUS, 12-km WESTUS and 4-km IWPD domains for the WestJumpAQMS project showing major cities and freeways.
July 20, 2011
16
Figure 2-1b. 12-km WESTUS and 4-km IWPD domains for the WestJumpAQMS project showing major cities and freeways.
July 20, 2011
17
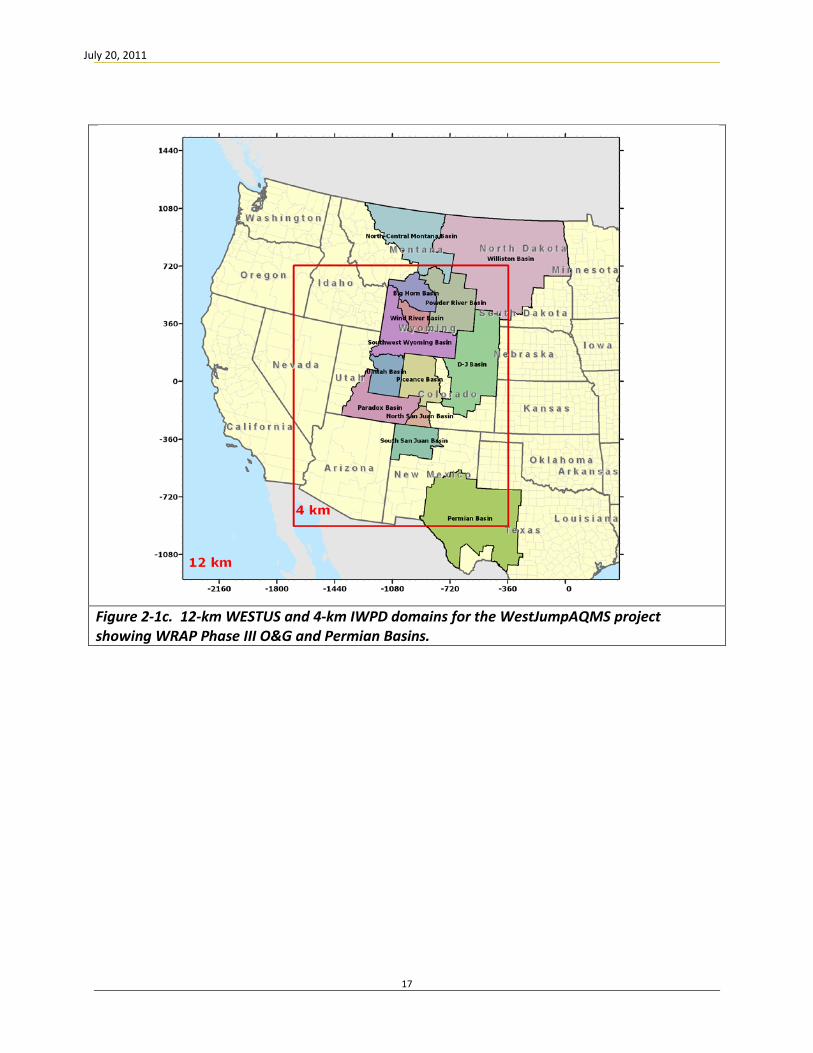
Figure 2-1c. 12-km WESTUS and 4-km IWPD domains for the WestJumpAQMS project showing WRAP Phase III O&G and Permian Basins.
July 20, 2011
18
Figure 2-2. 36-km CONUS, 12-km WESTUS and 4-km IWPD domains with grid definitions.
36 km
12km
4 km
36 km: 148 x 112 (-2736, -2088) to (2592, 1944)12 km* 227 x 230 (-2388, -1236) to ( 336, 1524)04 km* 335 x 407 (-1696, -904) to ( -356, 724)
* includes buffer cells
Modeling Domain
-2520 -2160 -1800 -1440 -1080 -720 -360 0 360 720 1080 1440 1800 2160 2520
-1800
-1440
-1080
-720
-360
0
360
720
1080
1440
1800
July 20, 2011
19
Figure 2-3. 36-km CONUS and 12-km WESTUS domains and candidate 4-km Detailed Source Apportionment (DSAD) modeling domains for the CAMx/CMAQ photochemical grid modeling.
July 20, 2011
20
Figure 2-4. 36-km CONUS and 12-km WESTUS domains and candidate 4-km Impact Assessment Domain (IAD) modeling domains for the CAMx/CMAQ photochemical grid modeling.
July 20, 2011
21
Figure 2-5. Layer height definitions used in the 2008 36/12/4-km WRF modeling.
P0 = 1000 mb T0 = 288.15 K R = 287.053 J/kg/KPtop = 50 mb dT/dz = -6.50E-03 K/m g = 9.80665 m/s²
Level eta Pressure (mb) Height (m) Mid Height (m) dz/dx1 1.0000 1000.000 0.0 6.02 0.9985 998.575 12.0 18.0 12.03 0.9970 997.150 24.1 32.1 12.04 0.9950 995.250 40.1 48.2 16.15 0.9930 993.350 56.2 64.3 16.16 0.9910 991.450 72.4 84.5 16.17 0.9880 988.600 96.6 108.7 24.28 0.9850 985.750 120.9 141.2 24.39 0.9800 981.000 161.5 202.4 40.6
10 0.9700 971.500 243.2 284.4 81.711 0.9600 962.000 325.6 367.1 82.412 0.9500 952.500 408.6 450.4 83.013 0.9400 943.000 492.3 534.4 83.714 0.9300 933.500 576.6 662.1 84.415 0.9100 914.500 747.5 834.4 170.916 0.8900 895.500 921.2 1009.6 173.817 0.8700 876.500 1098.0 1233.5 176.818 0.8400 848.000 1369.1 1555.6 271.119 0.8000 810.000 1742.2 1936.0 373.120 0.7600 772.000 2129.7 2331.4 387.621 0.7200 734.000 2533.1 2743.4 403.322 0.6800 696.000 2953.7 3173.5 420.623 0.6400 658.000 3393.4 3623.7 439.624 0.6000 620.000 3854.1 4158.7 460.725 0.5500 572.500 4463.3 4789.1 609.226 0.5000 525.000 5114.9 5465.5 651.627 0.4500 477.500 5816.1 6196.2 701.228 0.4000 430.000 6576.3 6992.1 760.229 0.3500 382.500 7407.9 7867.8 831.630 0.3000 335.000 8327.8 8843.9 919.931 0.2500 287.500 9360.1 9950.7 1032.332 0.2000 240.000 10541.2 11235.5 1181.133 0.1500 192.500 11929.7 12780.0 1388.534 0.1000 145.000 13630.3 14492.7 1700.635 0.0600 107.000 15355.1 16280.0 1724.836 0.0270 75.650 17204.9 18232.5 1849.737 0.0000 50.000 19260.0 9630.0 2055.1
July 20, 2011
22
We will review the available emissions data for appropriateness for use in the WestJumpAQMS, assigning particular importance to the quality of the emissions inventories for the western U.S. states. The first couple versions of the 2008 National Emissions Inventory (NEI) is due for release by mid-February 2011, with the next version released by summer 2011. As the first versions of the NEI are highly uncertain and usually have missing categories or states, inventory data from the western U.S. states may be the best source of emissions for key categories/regions. We will identify the best available emissions inventory for the selected modeling baseline year for use in the study. Based on an initial review of the available inventory and ancillary emissions data, we have the following comments:
Emissions Data Review and Selection
• Major point source SO2 and NOX emissions will be based off of Continuous Emissions Monitor (CEM) data that are available online from the EPA Clean Air Markets Division (CAMD). These data are hour-specific for SO2, NOx, and heat input. The temporal variability of other pollutant emissions (e.g., PM) from the CEM sources will be simulated using the hourly CEM heat input data; magnitudes of the emissions for these other pollutants will be estimated from the annual inventory.
• We will analyze the sources of inventory data for other point sources (e.g., EPA, NEI, state data, etc.) and select the best source for the modeling study and evaluated.
• Similarly, the best source for the area sources will be evaluated and selected. • We will utilize 2008 updated versions of WRAP-IPAMS Phase III oil and gas 2006 base year
inventories and a “Phase III-light” oil and gas emissions inventory for the Permian Basin of southeast NM and west TX.
• Non-road mobile emissions will be estimated with the NONROAD model with adjustments for the western U.S. as performed by WRAP.
• On-road mobile source emissions will be based on the latest versions of the MOVES model with county-specific VMT for the selected baseline modeling year. The feasibility of running SMOKE-MOVES using day-specific hourly meteorology will be investigated versus running MOVES in county inventory mode (e.g., monthly with climatological average temperatures) and then using SMOKE to spatially and temporally disaggregate to the grid cells using spatial and temporal surrogate distributions.
• The sources of ammonia emissions will be analyzed, including state and EPA estimates, the Carnegie Mellon ammonia model, and the WRAP ammonia model. We will select the best estimate of these emissions that we can obtain under the WestJumpAQMS project resources. We will coordinate the selection of these data with the NPS RoMANS2 study.
• Methods for generating windblown dust (WBD) emissions will be investigated, including potentially using the WRAP WBD model with day-specific hourly meteorology.
• The source of emissions from fires (wildfires, prescribed burns and agricultural burning) will be investigated and the best available database selected. These activities include top down MODIS estimates, SMARTFIRE and WRAP FETS. WRAP and ENVIRON also have a proposal (DEASCO39
• Biogenic emissions will be generated using both the Model of Emissions of Gases and Aerosols in Nature (MEGAN
) into the Joint Fire Sciences Program (JFSP) that would develop a detailed fire emissions inventory for regional modeling that could be used in the WestJumpAQMS study if funded.
10) and the Biogenic Emissions Information System (BEIS11
• We will investigate the best source of emissions data for emissions from commercial offshore shipping sources. Procedures for estimating emissions from off-shore shipping that ENVIRON used in
).
9 https://www.firescience.gov/projects/11-1-6-6/proposal/11-1-6-6_11-1-6_attachment_1_primary.pdf 10 http://acd.ucar.edu/~guenther/MEGAN/MEGAN.htm 11 http://www.epa.gov/AMD/biogen.html
July 20, 2011
23
the WRAP, VISTAS and CENRAP studies could be used in the WestJumpAQMS project. A second option for these data include data recently released by EPA that include vertically resolved shipping lane emissions that distinguish between in-shore, near-shore, and commercial shipping lane sources for all waters surrounding North America.
• Mexico emissions will use 2008 projections from the 1999 Mexico national emissions inventory. • The Environment Canada 2006 (or newer) National Pollutant Release Inventory (NPRI) will be used
for Canada. • Spatial surrogates will be developed using roadway, population, and housing data for years that
most closely match the selected baseline modeling year. TIGER line data for roads and railroads are available on an annual basis and can be matched with any selected modeling year. The 2010 Census data are now available and will include population and housing statistics for 2010 and interpolations for the years between 2000 and 2010. We will review and generate updated surrogate data for major emissions categories for use in the WestJumpAQMS project.
Available meteorological data will be reviewed and evaluated. The evaluation will include both individual site as well as ensemble evaluations (e.g., by state). EPA has performed WRF modeling for 2007-2009 at 12 km resolution over the continental U.S. (CONUS) domain. MM5 modeling has also been performed for many of these years. ENVIRON/Alpine has done numerous WRF and MM5 meteorological sensitivity tests for the Denver SIP for the June-July 2006 period and found that despite the newer physics in WRF, it is not always the best performing model. ENVIRON/Alpine is also doing WRF modeling for the state of Wyoming that includes annual modeling as well as intensive episodic modeling focusing on high winter ozone events. There is also meteorological modeling conducted as part of several NEPA analyses in the Rocky Mountains.
Meteorological Data Review and Selection
Based on our initial review and needs for 4-km meteorological data over the 4-km processing domain, we will perform 36/12/4-km WRF meteorological modeling for the 2008 calendar year using the domains depicted in Figure 2-6 and vertical layer structure shown in Figure 2-5. WRF will be run using overlapping 6-day segments. The WestJumpAQMS WRF modeling results will be evaluated using the METSTAT program and surface wind speed, wind direction, temperature and humidity (mixing ratio) measurements. The WestJumpAQMS 4-km WRF performance will be compared against the performance of EPA’s 12-km WRF results. We will perform both ensemble (e.g., by state and 4-km domain) and individual site meteorological model performance. The performance of the two WRF simulations for simulating precipitation will also be evaluated.
Photochemical grid model inputs will be set up for both the Comprehensive Air-quality Model with extensions (CAMx
Photochemical Grid Model Selection
12) and Community Multiscale Air Quality (CMAQ13
• CAMx supports two-way grid nesting so that regional ozone transport analysis can be performed through the linked 36/12/4 km domains; CMAQ only supports one-way grid nesting.
) modeling systems. We will use CAMx as the primary model because:
• CAMx contains ozone and particulate matter source apportionment probing tools that are an integral component of the WestJumpAQMS Phase III work effort; the current publicly released version of CMAQ does not support source apportionment.
12 http://www.camx.com/ 13 http://www.cmaq-model.org/
July 20, 2011
24
For these reasons, we will perform most of the modeling analysis using the CAMx model. However, model inputs will be developed for both models and the initial base case and model performance evaluation will be conducted using both models.
Deliverables
: The deliverables under Task 1B will include a draft Modeling Plan that describes the selection of the modeling base year, modeling domains, software, and modeling approach. Revisions to the draft Modeling Plan based on comments are also expected. We will also prepare a technical memorandum describing the review of the emissions and meteorological data and the procedures for the emissions and meteorological modeling.
Figure 2-6. 36/12/4-km WRF modeling domains.
2.1.3 Task 1C: Update of Oil and Gas Emissions Including Permian Basin to 2008 Activity Levels
Objective
Approach: Under Task 1C we will develop updated inventories for the base modeling year and basins studied as part of the WRAP Phase III O&G project. Depending on the start date of this work, ENVIRON anticipates that the 2006 baseline O&G inventories will be complete for the following basins, with other basins noted as pending completion:
: To develop oil and gas (O&G) emissions for the Permian Basin and update the WRAP Phase III O&G emissions to the 2008 modeling base year.
July 20, 2011
25
(1) Denver-Julesburg Basin (CO) (2) Piceance Basin (CO) (3) Uinta Basin (UT) (4) North San Juan Basin (CO) (5) South San Juan Basin (NM) (6) Wind River Basin (WY) (7) Powder River Basin (WY) (8) Greater Green River Basin (WY) (9) Williston Basin – Pending (MT and ND)
In addition, a 2008 emission inventory of O&G activity will be prepared for the Permian Basin, which spans both Southeast New Mexico and western Texas (see Figure 2-1c), following the format of the Phase III project. The technical work required to develop these inventories is described under this Task 1C.
IHS Database Analysis
Prior to developing the 2008 inventory updates for the basins completed as part of Phase III or the Permian Basin, analysis will be conducted using a commercial database to obtain production-related statistics. The analysis will utilize the Enerdeq database published by IHS Global, also referred to as the “PI Dwight’s” database. ENVIRON has used this database to develop the Phase III inventories, and has found that this database contains production statistics that are of significantly higher quality than the primary data in individual state O&G Commission databases. Due to the data quality issue, and the consistency of the use of the IHS database in the Phase III project and this proposed study, ENVIRON will use the database again. For 2008 updates to the existing WRAP Phase III basins, the IHS database will be accessed using an existing third-party license agreement provided by the Western Governors’ Association (WGA) to ENVIRON. For the Permian Basin oil and gas production statistics analysis, ENVIRON assumes that the WGA will provide a similar third-party license agreement with access to the IHS database for the Permian Basin in both New Mexico and Texas counties.
Processing of the IHS data will follow the same methodology as described in the technical memoranda drafted as part of the Phase III study14
The resulting production statistics data will be summarized at the county, tribal and basin levels for all basins including the Permian Basin.
. This analysis assumes that access will be provided for both the Enerdeq database and Powertools software. ENVIRON will prepare summaries of production statistics including well count by well type and location, spud count, production of gas by well type and well location, production of liquid petroleum (oil or condensate) by well type and well location, and production of water by well type and well location. All data will be summarized at the county and basin level, for tribal and non-tribal land separately as applicable to each basin. As no new survey work is anticipated in this study, the IHS database analysis will not include an analysis of company-specific production statistics.
2008 Updated Emission Inventories for WRAP Phase III Basins
14 http://www.wrapair2.org/PhaseIII.aspx
July 20, 2011
26
For those basins completed as part of the WRAP Phase III project, which may include the Greater Green River and Williston Basins depending on project schedule, the 2008 production statistics from the IHS database will be used to project the baseline 2006 inventories for these basins. We will develop the projections as scaling factors that represented the ratio of the value of a specific activity parameter in 2008 to the value in 2006. The scaling factors will be developed at the county and tribal levels for all basins. Scaling factors will then be matched to all source categories considered as part of the Phase III inventories, using the same cross-referencing analysis conducted as part of the midterm projections in the Phase III study.
Where specific scaling factors are estimated to be less than one (1), indicating a reduction in an activity parameter from 2006 to 2008, all emissions factors and activity data will be assumed to be identical in 2008 as in 2006 and no further analysis will be needed for those source categories matched to the activity parameter. In this case, the 2008 emissions for will be developed assuming application of the scaling factor directly. Where scaling factors are estimated to be greater than one (1), it is assumed that some growth in activity has occurred in the 2006-2008 time period. ENVIRON will conduct a simplified controls analysis, specific to each basin and utilizing the control measures identified as part of the midterm projections work for the Phase III project. The controls analysis will only consider broad control factors, rather than detailed analyses as conducted in the Phase III midterm projections. Where no significant impact of controls from federal or state regulations are anticipated in the 2006-2008 time period, ENVIRON will assume no control fraction for the specific source category.
The 2008 updated inventories for the Phase III basins will be formatted identically to the baseline 2006 inventories generated for the Phase III study. The summary spreadsheets by basin will be the primary deliverable for this task.
2008 Emission Inventory for the Permian Basin
ENVIRON will utilize a study prepared by Applied EnviroSolutions, Inc. (AES) on 2007 O&G emissions in the New Mexico portion of the Permian Basin to develop a comprehensive inventory of the Permian Basin including activities in Texas. The AES study was commissioned for the Bureau of Land Management (BLM) Carlsbad Field Office (CFO), and used a methodology developed by ENVIRON as part of a study prepared for the Central Regional Air Planning Association (CENRAP)15
For the New Mexico portion of the Permian Basin, ENVIRON has determined from a preliminary review of the AES study that additional O&G area source categories may need to be added to the inventory. The AES study only examined emissions from wellhead/lateral compression, heaters, and flaring. Given the prevalence of both O&G production in the Permian Basin, additional emissions of ozone precursors (nitrogen oxides and volatile organic compounds) are expected from tanks, fugitive emissions, pneumatic devices, dehydrators, drilling, blowdown and completion venting, well workovers, and other source categories. To estimate emissions from these categories, ENVIRON will rely on previous source category emissions estimates from other Phase III basins, and will attempt to gather input data from other basin inventories matched as closely as possible to the production type in the Permian Basin. Where applicable, the adjacent inventory for the South San Juan Basin will serve as the primary reference for these additional O&G area source category emission estimates. For the missing source categories in the Permian Basin, ENVIRON will use the total inventories by source category from other
. The preparation of the 2008 inventory for the Permian Basin will expand on the AES study, including both additional emissions estimates in the New Mexico portion of the basin and new emissions estimates for the Texas portion of the basin. The steps in developing the Permian Basin inventory are described below.
15 http://www.cenrap.org/html/presentations.php
July 20, 2011
27
Phase III basins scaled by the appropriate activity parameters to generate unit-level emissions factors for each source category. These will then be scaled by the 2008 production data in the Permian Basin by county and tribal land to generate new emissions estimates for the missing source categories. Where appropriate, scaling will also account for variations in the volatile fraction of produced gas in the Permian Basin relative to the other Phase III basins. The same scaling will be applied for tank source categories (oil, condensate and water tanks), but it should be noted that ENVIRON will use the volatile fraction of the liquid to scale the emissions rather than rerun the E&P TANK model, as it is not expected that sufficient data will be available to rerun the model. For those area sources for which emissions were estimated by AES, ENVIRON will scale the emissions from 2007 to 2008 using scaling factors developed from the production statistics. No control analysis will be used for these projections. Emissions data from permitted point sources of oil and gas in the New Mexico portion of the Permian Basin (primarily gas processing plants and compressor stations) have been gathered by AES as part of the study and ENVIRON will make use of these directly. AES will provide further breakdown of emissions by process source category if available, and will assist ENVIRON in identifying the oil and gas permitted sources specifically.
ENVIRON will aggregate the previously estimated area source emissions, the newly estimated area source emissions and the point source emissions into a single inventory for the New Mexico portion of the Permian Basin. The inventory will be formatted similarly to other Phase III basins.
For the Texas portion of the Permian Basin, ENVIRON will use the area source inventory as described above for the New Mexico portion of the basin, and expand this to the counties in Texas that lie within the boundaries of the basin. The emissions estimates from the New Mexico portion of the Basin will be scaled by the appropriate production statistic to generate unit-level emissions factors, and these will be applied to the production data for the Texas counties. For the permitted sources in Texas, ENVIRON assumes that the WGA will conduct outreach to the Texas Commission on Environmental Quality (TCEQ) and request a database of permitted oil and gas sources. The permitted sources emission data will be aggregated with the area source estimates to generate an inventory of the Permian Basin in Texas. It will be similarly formatted in the Phase III format, and combined with the New Mexico portion of the basin for a comprehensive Permian Basin inventory.
Deliverables
: Base modeling year (e.g., 2008) O&G emissions inventory for the Permian Basin and all current Basins in the WRAP Phase III study that have developed 2006 baseline emissions. Technical Memorandum describing the Permian Basin O&G emissions development approach, the O&G projection approach, and summary results of emissions.
2.1.4 Task 1D: Meteorological Modeling and Model Performance Evaluation
Objective: To develop 4 km meteorological inputs covering areas in the western U.S. where we anticipate 4 km nested grids will be used for photochemical grid modeling and to evaluate the meteorological model performance.
Approach: Based on the review and recommendations from Task 1B, we will set up WRF so that we could perform meteorological modeling of the base modeling year at a 4-km resolution for the 4-km IWPD processing domain depicted in Figures 2-1 and 2-2. The set up of the meteorological models includes downloading and processing surface meteorological data in the western U.S. that can be used in the WRF four dimensional data assimilation (FDDA) for the 4-km processing domain. If the Project Director and sponsors desire an additional 4-km nested grid domain in the western U.S. not covered by the 4-km IWPD processing domain (Figure 2-1 and 2-2) we will perform additional 4-km WRF modeling under Optional Task 1G.
July 20, 2011
28
The WRF 36/12/4-km meteorological output will be evaluated against surface meteorological observations using the METSTAT program. The evaluation will include wind speed, wind direction, temperature, and water vapor mixing ratio. The evaluation will be performed using ensembles (e.g., by state or portions of states) and for individual monitoring sites. The meteorological model performance evaluation statistical metrics will be compared against benchmarks that have been developed by the meteorological modeling community. These benchmarks were developed by analyzing numerous meteorological model simulations performed to support of air quality (mainly ozone) model applications and represent the typical range that a good performing meteorological model achieves. The benchmarks are not pass/fail thresholds and are used to help interpret the meteorological model performance and compare its performance across studies, models, regions and time periods. Our experience is that the performance of meteorological models in the Rocky Mountains frequently does not meet these benchmarks due to the more complex flows and meteorological conditions than occurred in the model simulations that the benchmarks were based on. We will also evaluate the meteorological model performance for precipitation using the CPC precipitation observations. We will also evaluate the EPA 2008 12-km WRF model performance at the same time and provide a technical memorandum that compares and contrasts the WestJumpAQMS WRF 4-km and EPA WRF 12-km model performance.
Also under this task we will process the meteorological model output for the CAMx and CMAQ photochemical grid models for the 2008 base modeling year and the selected 36/12/4- km modeling domains, where in the Base Effort we are assuming two 4-km nested grids as shown in Figure 2-3. Two copies of back up disk drives of the meteorological model outputs will be generated and stored at the ENVIRON California and Alpine Colorado modeling centers and three copies of disk drives will be generated for the CAMx and CMAQ model inputs and stored at the ENVIRON and Alpine modeling centers as well as the UNC modeling center in North Carolina.
Deliverables
: Meteorological outputs and CAMx/CMAQ meteorological inputs. Technical memorandum on the WestJumpAQMS 2008 36/12/4-km WRF application and comparisons of the WestJumpAQMS 4-km WRF and EPA 12-km WRF model performance evaluation and intercomparison.
2.1.5 Task 1E: Emissions Modeling
Objective: To generate photochemical grid model-ready emission inputs for the selected base modeling year and the selected 36-km CONUS, 12-km WESTUS, and 4-km IWPD processing domains.
Approach: Using the most appropriate base modeling year emissions data and approaches identified in Task 1B, we will generate CAMx and CMAQ emission inputs for the base modeling year on the 36-km CONUS, 12-km WESTUS and 4-km processing domains. We will use the Sparse Matrix Operator Kernel Emissions (SMOKE16
16
) modeling system to process the baseline modeling year emissions to generate the hourly, speciated, gridded emissions inputs needed by CAMx and CMAQ. We will likely process the emissions through SMOKE for CAMx for most of the inventory sectors and use the CAMx2CMAQ processor to reformat emissions inputs to CMAQ-format. The emissions will be processed for simulating both ozone and PM, including secondary organic aerosol (SOA) precursors, using the Carbon Bond 05 (CB05) photochemical mechanism. As noted in Task 1B, we will estimate biogenic emissions using both the MEGAN and BEIS biogenic emissions models. We may also use the WRAP windblown dust (WBD) models. ENVIRON also has specialized software for generating fire emissions from the NCAR MODIS fire emissions database and for generating off-shore marine shipping emissions using the Corbett database. We may also use EPA’s off-shore marine emissions database. For ammonia emissions we will use the best source of available data. We have
http://www.smoke-model.org/index.cfm
July 20, 2011
29
reviewed available ammonia models including the WRAP ammonia model and the CMU ammonia model and concluded that the WRAP ammonia model is now out of date. We have included the application of the CMU ammonia model in this study as Task 2H under Phase II of the study. The results of the Task 1B review will ultimately determine the emissions data that we use for the project.
An important component of this task is the Quality Assurance (QA) and Quality Control (QC). We propose to institute the concept of an Emissions Gatekeeper to be part of the Task 1B emissions review and under this task to have custody and control of the emissions data and assure that the data are of high quality before they be passed off to the emissions modeling team. The Emissions Gatekeeper will also be an independent QA/QC auditor of the emissions modeling and assure that the processed emissions are consistent with the original inventories.
The results of the emissions modeling will be documented in a Technical Memorandum that describes the emissions sources, modeling procedures, QA/QC procedures and results, and summary emission modeling results.
Deliverables
Task 1F: New 4-km DSAD/IAD Domains outside of the IWPD
: CAMx-ready and CMAQ-ready 36/12/4-km emission inputs for the base modeling year and Technical Memorandum on their development.
Objective: To develop 4-km DSAD and IAD meteorological and emissions databases for eastern Montana and western North Dakota not covered by the Intermountain West Processing Domain (IWPD). Approach: WRF meteorological and SMOKE emissions modeling will be conducted for a 4-km domain of sufficient size to developed DSAD and IAD domains for E-MT/W-ND. The procedures and discussed in Tasks 1D and 1E will be utilized. Deliverables: CAMx-ready and CMAQ-ready 4-km emissions and meteorological inputs for 4-km DSAD and IAD regions covering E-MT/W-ND.
July 20, 2011
30
2.2 PHASE II: MODEL IMPROVEMENTS, BASE YEAR MODELING, AND MODEL PERFORMANCE EVALUATION
2.2.1 Task 2A: Management, Meetings and Reporting
Objective: To manage the Phase II project activities, including conference calls, a meeting with presentations, monthly progress reports and invoices, and day-to-day management for Phase II of the project.
Approach: The technical approach for Task 2A will be the same as Task 1A.
Deliverables
: Project management, PowerPoint presentations, conference calls, meeting and monthly progress reports and invoices.
2.2.2 Task 2B: Model Updates and Improvements
Objective: To incorporate any model updates into the WestJumpAQMS project.
Approach
We will document the results of the model improvement review in a Technical Memorandum and recommend which updates should be incorporated in the WestJumpAQMS modeling.
: We will review the latest updates to photochemical grid modeling, especially as they pertain to ozone and PM modeling in the western U.S. and complex terrain. The main review will be for the CAMx and CMAQ models where we will contact the model developers (ENVIRON and EPA) and review the current literature to determine whether there are new or upcoming features in the model that would improve western U.S. ozone and PM modeling. For example, the API vertical velocity update in the CAMx model greatly improved the CAMx spring time model performance; a similar update was made in CMAQ. EPA and API are both investigating the use of global chemistry models to define the boundary conditions (BCs) for the 36-km CONUS domain whose results could also be important for western U.S. ozone and PM modeling. Further, a recent update to a critical inorganic reaction rate (nitric acid formation) in the photochemical models used to simulate ozone will likely have a significant impact on the model reactivity.
Deliverables
: Technical Memorandum on model improvements.
2.2.3 Task 2C: Modeling Protocol
Objective: To develop a formal Modeling Protocol for the WestJumpAQMS project.
Approach
The main function of the Modeling Protocol is to serve as a means for planning and communicating how the modeling will be performed before it occurs (EPA, 1999, pg 95). The protocol guides the technical details of a modeling study and provides a formal framework within which the scientific assumptions, operational details, commitments and expectations of the various participants can be set forth explicitly. A formal protocol provides a means for resolution of potential differences of technical and policy opinion to be worked out
: We will prepare a Modeling Protocol for the WestJumpAQMS project following EPA’s emissions inventory and modeling guidance, including: the 1991 and 1994 UAM SIP modeling guidance for the 1-hour ozone NAAQS; 1999, 2001 and 2007 modeling guidance for the 1997 8-hour ozone NAAQS; new modeling guidance expected in early 2011; and emissions inventory guidance such as the August 2005 guidance for preparing inventories to address ozone, fine particulate and regional haze issues. We will rely on our extensive experience in preparing Modeling Protocols for SIP modeling and other air quality modeling studies, including those for the Denver 2004 EAC and 2008 ozone SIPs, WRAP regional haze SIPs for the western states, VISTAS and ASIP ozone, PM2.5 and regional haze SIPs for the southeastern states; New Mexico, Oklahoma and Texas EAC ozone SIPs; and numerous EISs and RMPs within the Rocky Mountain States.
July 20, 2011
31
openly and within prescribed time and budget constraints. Although the EPA guidance is designed for SIP modeling, which is a little different than the WestJumpAQMS project, much of the same content should be included in the WestJumpAQMS Modeling Protocol. As set forth in EPA guidance, the protocol governing the complete study should cover all required aspects as summarized below:
• Synthesis of recent relevant modeling studies • Identification of all participating stakeholders • Management/communication procedures • Conflict resolution methodology • Episode selection criteria and methodology • Model domain and resolution • Emission, meteorological & AQ model selection • Model selection and science configurations • Model justification (40CFR51, Appendix W) • Model input preparation methods, including:
- Emissions processing methodology and data sources that will be used - Spatial, temporal and speciation allocations factors - Temperatures to be used for biogenics and MOVES modeling - Vegetation and land cover data used - Chemistry mechanisms and parameters - Vertical turbulent exchange coefficients (e.g., ACM2, Kv)
• Scientific peer-review of modeling procedures • Data requirements for AQ modeling • Data requirement for WOE analyses • Emissions QA/QC methods • Model evaluation procedures & criteria • Diagnostic/sensitivity/uncertainty methodology • Procedures to use if model performance fails • Weight of Evidence (WOE) analyses • Outcomes from WOEs that suggest attainment • Sensitivity & other tests to select control measures • Recommend future year control strategy runs • Methods for interpreting modeled outcomes • Overall QA/QC analysis • Archival, documentation, and reporting • Deliverables and schedule • Procedures for updating protocol during study • Computing resource requirements
A key component of the Modeling Protocol is the quality assurance and quality control (QA/QC) plan. Some of the major steps where we envision QA/QC steps will be utilized include the following:
• Acquisition of the emissions, meteorology and air quality data and reformatting/processing for use.
• To address this issue we will institute the roles of data Gatekeepers in the WestJumpAQMS study with the responsibility of examining the data received and review them for quality. o Greg Stella will be the Emissions Data Gatekeeper and will examine and QA/QC the collected
emissions data prior to emissions modeling. o Dennis McNally will be the Meteorological Data Gatekeeper and evaluate the meteorological
data prior to use o Edward Tai will be the Air Quality Data Gatekeeper reviewing the data and reformatting for
use in the modeling. • SMOKE emissions processing, with the checklist including a summary of the emissions that went
into and out of SMOKE.
July 20, 2011
32
o Cyndi Loomis and Zac Adelman will be the primary SMOKE emissions modelers with Greg Stella contributing independent QA/QC and comparisons back to the raw inventory data.
• Emissions merging, including a summary of total emissions from each stream of SMOKE emissions modeling. o Dennis McNally will be responsible for the emissions merging with QA/QC conducted by
Edward Tai. • Model performance evaluation including ozone, ozone precursor and ozone product species and
key indicator ratios as well as PM species and the precursor and product species. o Edward Tai will take the lead on the model performance evaluation with QA/QC provided by
Ralph Morris. We will work with the WRAP project manager to determine the all monitoring sites in the 12-km western domain to be analyzed and for which results will be reported, as to the upwind sources and geographic areas contributing to Ozone and PM air quality impacts. We will also work with the WRAP project manager to determine the definition of all of the nested 4-km “Detailed Source Apportionment Domain(s) (DSADs) (see Figure 2-3 for candidate 4-km DSADs). For those DSADs, pending sufficient funding, we will also conduct detailed analysis of the primary and secondary Ozone and PM contributions and primary precursor sources of upwind impacts reaching these nested domains, and the downwind contributions of primary and secondary Ozone and PM and associated precursors and their sources from these domains to downwind receptors, within the 4-km DSADs, as well as to and from the 12-km and 36-km domains. We will also work with the WRAP project manager to determine the 4-km Impact Assessment Domains (IADS) (see Figure 2-4 for candidate 4-km IADs). We will document these decisions in the Modeling Protocol.
An important component of the Modeling Protocol will be recommendations on procedures for adding new emissions information to the WestJumpAQMS database. Under NEPA, the emissions associated with new developments are disclosed as part of EISs, EAs, RMPs and permit actions. Frequently these new sources are new O&G development projects. Many of these new O&G development projects are infill projects that drill new wells in existing O&G fields. An Appendix to the Modeling Protocol will describe how emissions from these types of projects can be included in the WestJumpAQMS future year emission inventory in a fashion that avoids double counting or dropping sources. For example, for an O&G infill development, the emissions from existing wells typically decline over time or at capped, and emissions from the new producing wells are added to the inventory.
Deliverables
2.2.4 Task 2D: Boundary Condition and Other PGM Inputs
: The deliverables under Task 1C will be a draft Modeling Protocol that will be submitted to the WRAP Project Director. During the course of the study there may be reasons to modify the modeling approach, in which case the draft final Modeling Protocol will be updated to be consistent with the final modeling approach.
Objective: To develop boundary condition (BC) inputs and other inputs needed by the CAMx and CMAQ photochemical grid models (PGMs).
Approach: BC and additional PGM inputs needed for the base modeling year and 36/12/4-km domains will be prepared under this task. These inputs may include BCs for the 36-km outer CONUS domain, which will be based on a global chemistry model output such as GEOS-Chem or MOZART or other sources (e.g., CAM-Chem). They may also include photolysis rates, day-specific ozone column (TOMS) data, and other inputs. Recommendations from the Task 1B Review and Task 2A Model Improvements will be followed in the PGM input development. Inputs will be developed for both the CAMx and CMAQ models.
Deliverables
: Technical Memorandum on the development of the BC and other PGM inputs.
2.2.5 Task 2E: Base Case Modeling and Model Performance Evaluation
July 20, 2011
33
Objective: To perform a baseline modeling year base case simulation and model performance evaluation.
Approach: The CAMx and CMAQ models will be applied for the base modeling year on the 36/12/4-km domain and subjected to a model performance evaluation. The model performance evaluation will be performed on a subregional basis for key regions in the western U.S. The model evaluation will be conducted for ozone, PM species and total PM, and ozone and PM precursor and product species. We will also evaluate model performance at key individual monitors. Outside of the 4-km DSAD domains we will focus the evaluation on rural monitors and on periods with high ozone and PM concentrations. We will use similar procedures for model performance as we used in the Denver ozone SIP17, for WRAP18, VISTAS19 and other regulatory modeling studies. This evaluation relies on both statistical performance metrics and graphical displays of model performance. Graphical displays include time series, bugle plots, soccer plots, Q-Q plots and spatial maps. Details on the model performance approach will be provided in the Task 2C Modeling Protocol.
Deliverables
: Technical Memorandum on the model performance evaluation and website with details on the model performance evaluation products.
2.2.6 Task 2F: Base Case Modeling, Model Performance Evaluation, and Data Transfer for 4-km IADs
Objective: To develop stand-alone 4-km IAD SMOKE emissions and CAMx/CMAQ photochemical modeling databases for four IAD regions and conduct base case modeling and model performance evaluation.
Approach: Stand-alone SMOKE emissions and CAMx and CMAQ photochemical modeling databases will be developed for four IAD regions (e.g., as shown in Figure 2-4). 2008 base case model simulations will be conducted using the CAMx model and a model performance evaluation performed. The databases would be archived to separate disk drives and sent to one of the sponsors offices (e.g., BLM national center in Denver) where they can be provided to contractors for use in air quality impact assessments.
Deliverables
: Separate reports documenting the four 4-km IAD region modeling databases and model performance evaluation. Four separate disk drives with databases.
2.2.7 Task 2G: Methods for Screening Analysis and add tools to Project Website
Objective: Add tools to the project website that has an interactive capability to analyze the WestJumpAQMS project Phase I and II databases.
Approach
• Detailed analysis of emissions by location, including spatial plots and pie charts of source category contributions for user-selected subregions
: Under this Task we will develop a website tools that support various screening analyses using the air quality, emissions, and meteorological data developed in Phase I and II of the WestJumpAQMS project. The capabilities the interactive website may include:
• Back trajectories from user-selected points and times • Visualization of meteorological fields and air quality data
17 http://www.colorado.gov/airquality/documents/deno308/Denver_2006MPE_DraftFinal_Aug29_2008.pdf 18 http://pah.cert.ucr.edu/aqm/308/cmaq.shtml#base02bvsbase02a36k 19 http://www.vistas-sesarm.org/documents/ENVIRON_Air_Quality_Modeling_Technical_Support_Document_11-14-07.pdf
July 20, 2011
34
For example, the web interface could allow a user to analyze the ozone air quality for a receptor site through selecting the ten highest ozone days and then perform back trajectories from the site at the time of the high ozone. In this example, the user will be able to then analyze the emissions in the upwind source regions along the trajectory path.
At the start of this task we will hold a conference call with the Project Director and potential user community to obtain comments on the desired features of the interactive website. We will then prepare a draft design document for the website and provide this document to the Project Director for review. Once the website design is finalized we will provide a cost and time estimate for its development. The development of the website will likely leverage off of existing visualization tools (e.g., TSS, VERDI, HYSPLIT, etc.).
Deliverables
: Draft and final design plan for the interactive tools on the website. An interactive website with the capability to conduct screening analysis using the Phase I and II databases.
2.2.8 Task 2H: Application of the CMU Ammonia Model
Objective: To apply the CMU ammonia model for the 2008 calendar year and the 36/12/4-km domains.
Approach: The CMU ammonia model will be set up and applied to the 36/12/4-km modeling domains for the 2008 calendar year. The resultant ammonia emissions will be subjected to QA/QC and compared with other estimates of ammonia emissions, such as the WRAP 2002 inventory and the results of the ROMANS2 study.
Deliverables
: Gridded hourly ammonia emissions for the 2008 year and the 36/12/4-km modeling domains.
2.3 PHASE III: SOURCE APPORTIONMENT MODELING AND FUTURE ANALYSIS ISSUES
2.3.1 Task 3A: Management, Meetings and Reporting
Objective: To manage the project Phase III activities, including conference calls, a meeting with presentations, monthly progress reports and invoices and day-to-day management of the project.
Approach: The technical approach for Task 3A will be the same as Tasks 1A and 2A.
Deliverables
: Project management, PowerPoint presentations, conference calls, meeting and monthly progress reports and invoices.
2.3.2 Task 3B: Ozone and PM Source Apportionment Modeling
Objective: To perform ozone and particulate matter source apportionment modeling to estimate the contributions of emissions in the western states to downwind ozone and PM2.5 concentrations and visibility impairment.
Approach: Under this task, we will apply the CAMx model’s source apportionment probing tools to estimate the contributions of selected source regions and source categories to ozone and PM concentrations and visibility impairment. The CAMx Anthropogenic Precursor Culpability Assessment (APCA) ozone source apportionment and Particulate Source Apportionment Technology (PSAT) PM source apportionment tools will be used to estimate source region and emissions source category contributions to ozone and PM concentrations. We will work with the WRAP Project Director to define the source regions and emissions categories to tag in the APCA ozone and PSAT PM source apportionment modeling for the 2008 baseline modeling year and 36/12/4-km domain, with a special emphasis on characterizing the effects on, and
July 20, 2011
35
contributions from, the DSADs defined in the Modeling Protocol. We will prepare a draft source apportionment design document that clearly defines the source regions and source categories to be used in the source apportionment modeling. For example, separate source apportionment can be obtained for each western state by major source categories. Major source categories that are typically processed separately and can be tagged for source apportionment applications include:
• Biogenics • Fires • Electrical Generating Units (EGUs) • Non-EGU point sources • Oil and Gas sources • On-road mobile sources • Non-road mobile sources • Area sources
The APCA ozone and PSAT PM source apportionment results will be processed at each monitoring site to identify the contributions of source regions and categories on modeled high ozone and PM days. The source apportionment output will also be processed using the same procedures as EPA used in their Transport Rule that EPA used to identify which upwind states contribute significantly to ozone and PM2.5 nonattainment in a downwind state. We will coordinate with the Project Director on the best way to display the source apportionment modeling results. This could include the development of a PC- or Web-based APCA/PSAT visualization tool that will allow the user to develop their own displays of the source apportionment modeling results. For example, as part of a study sponsored by CENRAP ENVIRON developed a PSAT Visualization Tool that allowed users to visualize the species, source regions (states) and source categories that contributed to visibility impairment at Class I areas. The CENRAP Visualization Tool20
The source apportionment results will be documented in a draft and final Technical Memorandum as well as a display files and potentially a visualization tool.
was developed using Microsoft Access but could also be part of the Optional Task 2F interactive website if funded.
Deliverables
2.3.3 Task 3C: Future Analysis Issues
: Draft and final Technical Memorandum on source apportionment modeling, source apportionment displays and potentially source apportionment Visualization Tool.
Objective: To summarize issues that need to be addressed in the future for ozone , PM and visibility planning in the western U.S.
Approach
The memo will also describe how the effects of climate change could be accounted for in the future year air quality planning process. For example, EPA has funded million dollars in research into the effects of climate change on air quality including how the effects of climate change can be incorporated in air quality modeling as part of their STAR Grants program
: Under this task we will prepare a Technical Memorandum summarizing the lessons learned in the Phase I-III work efforts and what issues need to be addressed in future ozone, PM and visibility planning for the western U.S. The memo will address how current and future year emission inventories are updated, including how to incorporate future year emission inventories that become available as new projects and projections are made as part of the NEPA and SIP process.
21
20
. The procedures developed for downscaling data from climate
ftp://ftp.environ.org/pub/webaccess/Ralph/stuff/ 21 http://www.epa.gov/ncer/climate/
July 20, 2011
36
models may prove useful for future year air quality planning. This discussion will include procedures for how to account for changes in international transport in future years.
The application of models in data sparse areas is also an important issue in the western U.S. The use of an Unmonitored Area Analysis (UAA), like the one in MATS, will be important for the western U.S.
Deliverables
: Technical Memorandum summarizing future analysis issues.
2.3.4 Task 3D: Final Report
Objective: To prepare a draft and final report on the Phase I through III work effort.
Approach: The results of Phase I through III will be documented in a draft report and submitted to the WRAP Project Director. After receiving comments on the draft report from the WRAP Project Director, we will address these comments in a final version of the report.
Deliverables: Draft and final report.