westerville water department westerville ohio · • 7. 5 mgd capacity • constructed 1969 with...
TRANSCRIPT

Westerville Water DepartmentWesterville, Ohio
Granular Activated Carbon and Plant Upgrade Project
Dick Lorenz, Bob Gardner, Erik Fulton
SE-SW District MeetingApril 24, 2017
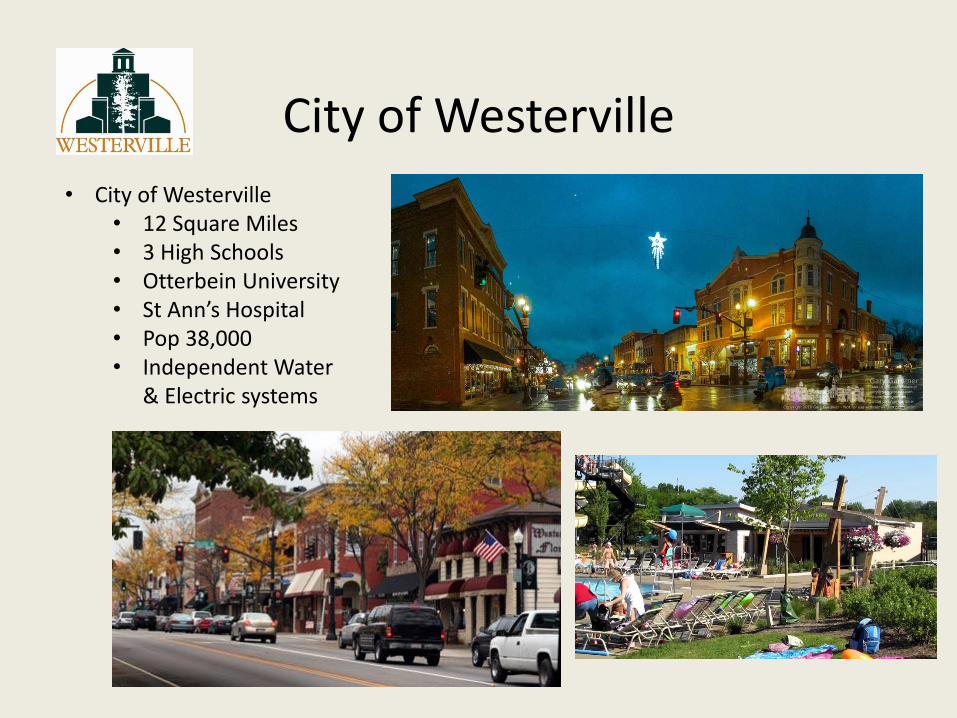
City of Westerville
• City of Westerville • 12 Square Miles• 3 High Schools• Otterbein University• St Ann’s Hospital• Pop 38,000• Independent Water
& Electric systems

Westerville Water
• Primarily Surface Water with Well Water• 7. 5 MGD capacity• Constructed 1969 with upgrades in 1980, 1992, 1999, 2016• Conventional Lime Softening Plant• 3 Elevated Storage Tanks, One Booster Station, 2 Pressure Zones• 3.1 MGD average treatment rate
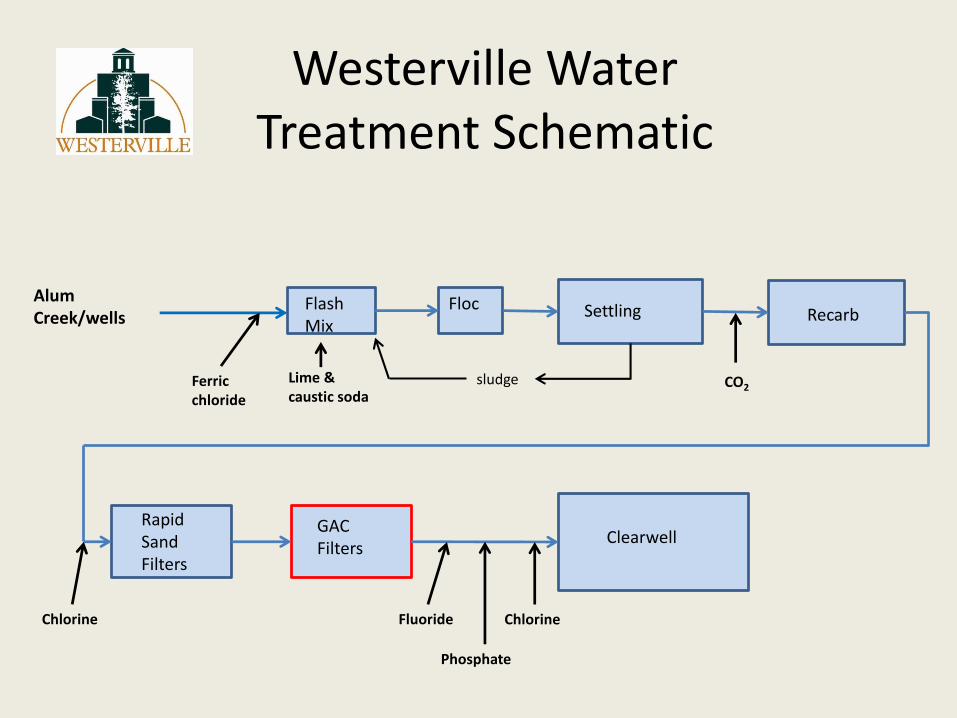
Westerville WaterTreatment Schematic
Alum Creek/wells
Flash Mix
Floc Settling Recarb
Rapid Sand Filters
GAC Filters
Clearwell
Ferric chloride
Lime & caustic soda
CO2
Chlorine ChlorineFluoride
Phosphate
sludge
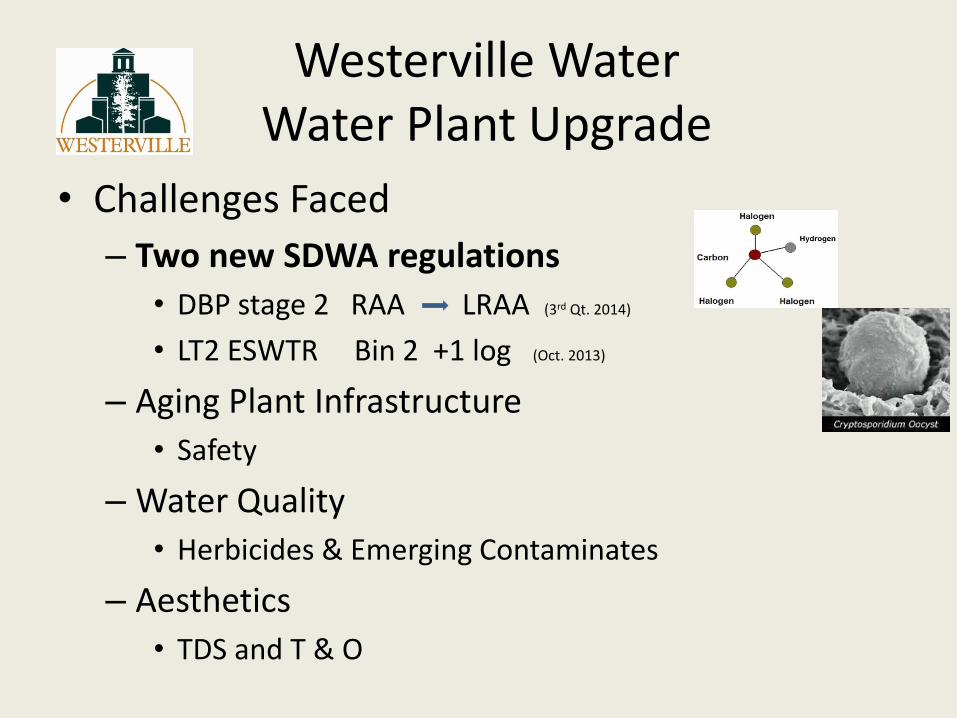
Westerville WaterWater Plant Upgrade
• Challenges Faced
– Two new SDWA regulations
• DBP stage 2 RAA LRAA (3rd Qt. 2014)
• LT2 ESWTR Bin 2 +1 log (Oct. 2013)
– Aging Plant Infrastructure
• Safety
– Water Quality
• Herbicides & Emerging Contaminates
– Aesthetics
• TDS and T & O

0
20
40
60
80
100
120
140
160
180
2009 2010 2011 2012 2013 2014 2015 2016
Qt. THM Data at Four Sites
ug/L

0
10
20
30
40
50
60
70
80
90
2010 2011 2012 2013 2014 2015 2016
Previous MCL for DBP’s RAA's
TTHM HAA TTHM MCL HAA MCL
ug/L

0
20
40
60
80
100
120
2010 2011 2012 2013 2014 2015 2016
THM RAA vs LRAA
RAA 4 site avg. MCl LRAA Max site
ug/L
LRAA

Westerville WaterInitial DBP Control Measures
• Elevated tank cycling
• Tank mixer
• Manage clearwell levels
• Blending of well water
• Moved initial chlorination point
• Coagulant dose

Westerville WaterProject Phases
• Assessment of Existing Conditions - 2009 Engineer- Malcolm Pirnie
– Engineering Audits of:• Water Quality• Treatment• Capacity• Facilities
• Established Water Quality Goals– Reduce DBP’s – stage 2– LT2 – bin 2, additional log – Emerging Contaminants– TDS
• Identify & Evaluate Options• Detailed Engineering Design• Funding – OEPA Water Supply Revolving Loan Account• Construction - 2013-16 Shook Construction, CM-Smoot Construction

Westerville WaterOptions Investigated
• Chloramination
• Ozonation
• High Pressure Membranes
• Low Pressure Membranes
• Raw Water pipeline
• MIEX
• Granular Activated Carbon
• 2 stage Lime softening
• Ground water blending
• UV disinfection
Westerville WaterGAC Treatment Selected
• Disposal of membrane reject water
• Source water limitations
• Utilized existing treatment facilities
• Constructability
• Capital and O & M costs
• Streamlined OEPA approval
• Operational familiarity and ease
• Scalable

Westerville WaterDesign Summary
• Post filtration GAC pressure filters (14)
– with intermediate pumping
• New chemical delivery, storage & feed facility
– Sodium Hypochlorite to replace gas
• Modifications to admin area
• Electrical system upgrades

Westerville WaterConstruction Photos

Westerville WaterCompletion Photos

Westerville WaterCompletion Photos
Westerville Water

Westerville Water

Westerville Water

Westerville Water

Westerville Water

Westerville WaterGAC Design
• 14 tanks, 10’x20’ with 20,000 lbs carbon ea
• 3 variable speed vertical turbine pumps
• Calgon Carbon F 300 0.8-1.0 mm bituminous coal
• EBCT 13 min (4.8 gpm/SF) @ 7.5 MGD, 27 min (2.5 gpm/SF) @ 4 MGD
• Secondary filtration provides 0.5 log LT2 credit
• Backwash pump
• GAC Reactivated, exchanged using water/air

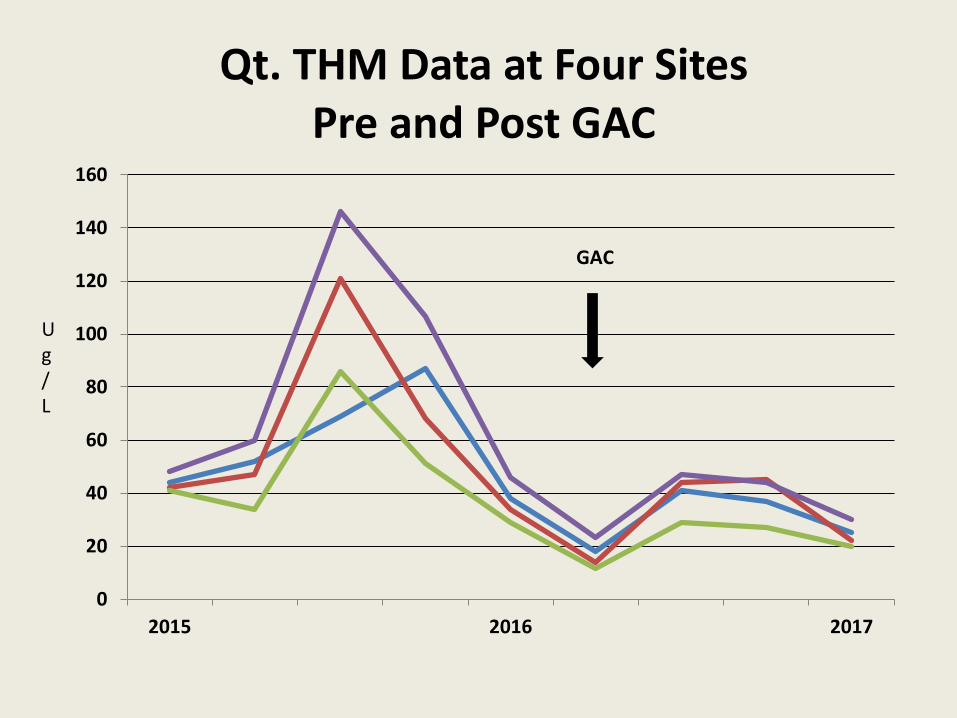
Westerville WaterFirst Year Results
March 2016 – March 2017
0
20
40
60
80
100
120
140
160
2015 2016 2017
Qt. THM Data at Four SitesPre and Post GAC
Ug/L
GAC
0
20
40
60
80
100
120
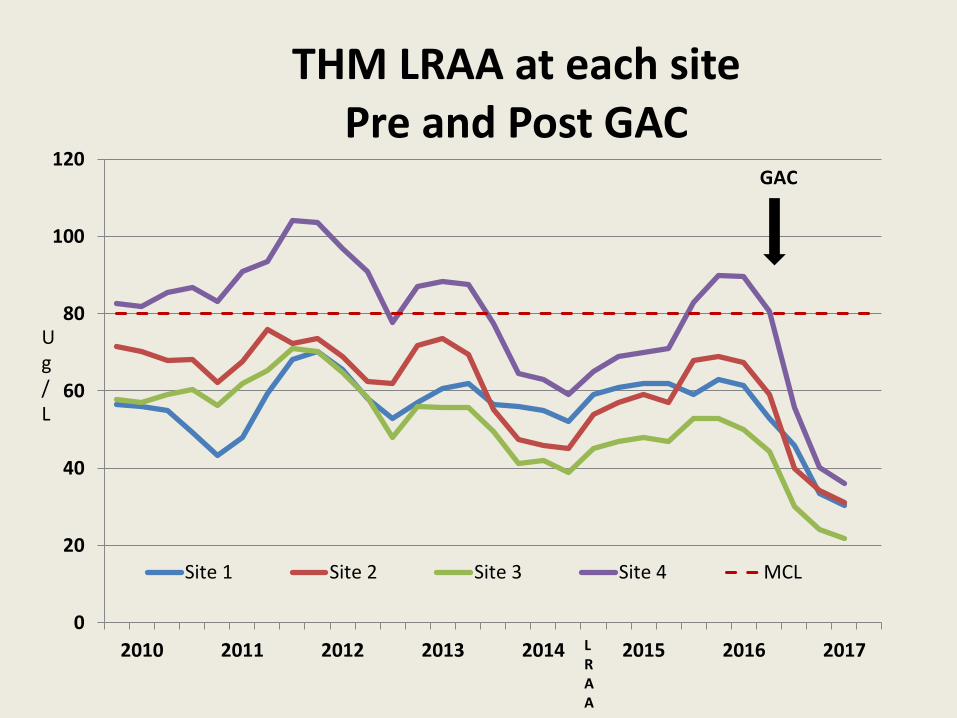
2010 2011 2012 2013 2014 2015 2016 2017
THM LRAA at each sitePre and Post GAC
Site 1 Site 2 Site 3 Site 4 MCL
Ug/L
GAC
LRAA

0
1
2
3
4
5
6
7Ja
n-1
4
Mar
-14
May
-14
Jul-
14
Sep
-14
No
v-1
4
Jan
-15
Mar
-15
May
-15
Jul-
15
Sep
-15
No
v-1
5
Jan
-16
Mar
-16
May
-16
Jul-
16
Sep
-16
No
v-1
6
Jan
-17
Mar
-17
TOC Reduction
Raw TOC Filtered TOC
mg/L
GAC
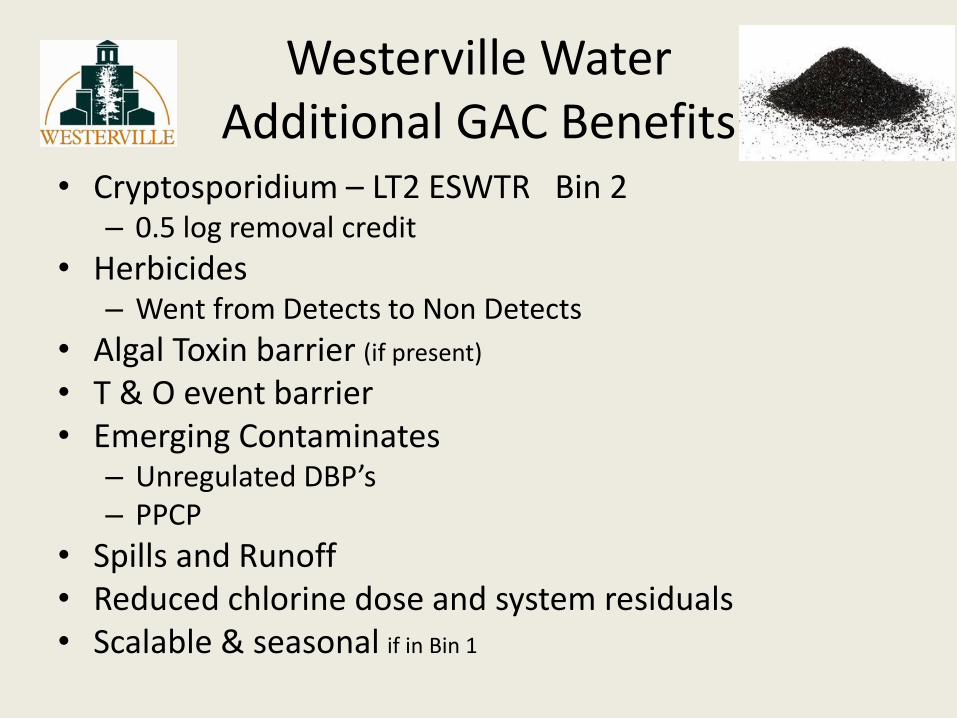
Westerville WaterAdditional GAC Benefits
• Cryptosporidium – LT2 ESWTR Bin 2– 0.5 log removal credit
• Herbicides– Went from Detects to Non Detects
• Algal Toxin barrier (if present)
• T & O event barrier• Emerging Contaminates
– Unregulated DBP’s– PPCP
• Spills and Runoff• Reduced chlorine dose and system residuals• Scalable & seasonal if in Bin 1

Westerville WaterSummary
• GAC meets current regulatory requirements
– DBP’s and LT2
• GAC provides additional barrier to multi-barrier treatment approach
– unregulated and undetected organic contaminates
• GAC fit into existing treatment facility
• Operator ease & acceptance

Westerville Water

Westerville WaterPoint of Initial Chlorination
• Post GAC– Biological RSF
• <5% TOC reduction
• Decreased Filter Run Times
• Appearance & Odor
– Lower chlorine dose
• Pre RSF– Historic operation
– Minimal feed – total residual 0.2 mg/L
– May lengthen GAC time to exhaustion for TOC removal
– Feedback if chlorine demand event