westmap the western climate mapping initiative
DESCRIPTION
WestMap The Western Climate Mapping Initiative. Western Climate Mapping Consortium Consortium Co-Chairs: Andrew Comrie, University of Arizona Kelly Redmond, Desert Research Institute and Western Regional Climate Center Chris Daly, Oregon State University Organizing Membership: - PowerPoint PPT PresentationTRANSCRIPT
WestMapWestMapThe Western Climate Mapping InitiativeThe Western Climate Mapping Initiative
Western Climate Mapping ConsortiumWestern Climate Mapping Consortium
Consortium Co-Chairs:Consortium Co-Chairs: Andrew Comrie, University of ArizonaAndrew Comrie, University of Arizona
Kelly Redmond, Desert Research Institute and Western Regional Climate CenterKelly Redmond, Desert Research Institute and Western Regional Climate CenterChris Daly, Oregon State UniversityChris Daly, Oregon State University
Organizing Membership: Organizing Membership: University of Arizona – Climate Assessment of the Southwest (UA)University of Arizona – Climate Assessment of the Southwest (UA)
Western Regional Climate Center (WRCC)Western Regional Climate Center (WRCC)Spatial Climate Analysis Service – Oregon State University (OSU)Spatial Climate Analysis Service – Oregon State University (OSU)
USDA Natural Resources Conservation Service (NRCS)USDA Natural Resources Conservation Service (NRCS)Scripps Institution of Oceanography – California Applications Program (Scripps/CAP)Scripps Institution of Oceanography – California Applications Program (Scripps/CAP)
NOAA Climate Diagnostics Center (CDC)NOAA Climate Diagnostics Center (CDC)

WestMap AimsWestMap Aims
• 50-100 years, 1 km gridded, monthly climate observations, continuously updated
• Provide to data users & stakeholders:– online analysis tools– associated error/accuracy estimates– educational resources

BackgroundBackground• Very high stakeholder demand for these kinds of climate data
– noted by the NOAA-funded Regional Integrated Science and Assessment (RISA) projects across the west (e.g., CLIMAS, the Climate Assessment for the Southwest)
• Main WestMap focus on a western US domain– Large demand and complex climate mapping
challenges in the West• fine scale topographic variations• extensive high elevation mountain ranges• deserts• coastal boundary regions• interior valleys• rain shadows• data availability• poor station distribution
• May evolve to:– national/international– northern Mexico and western Canada– daily data, but not initially

Courtesy Tim Owen, NCDC
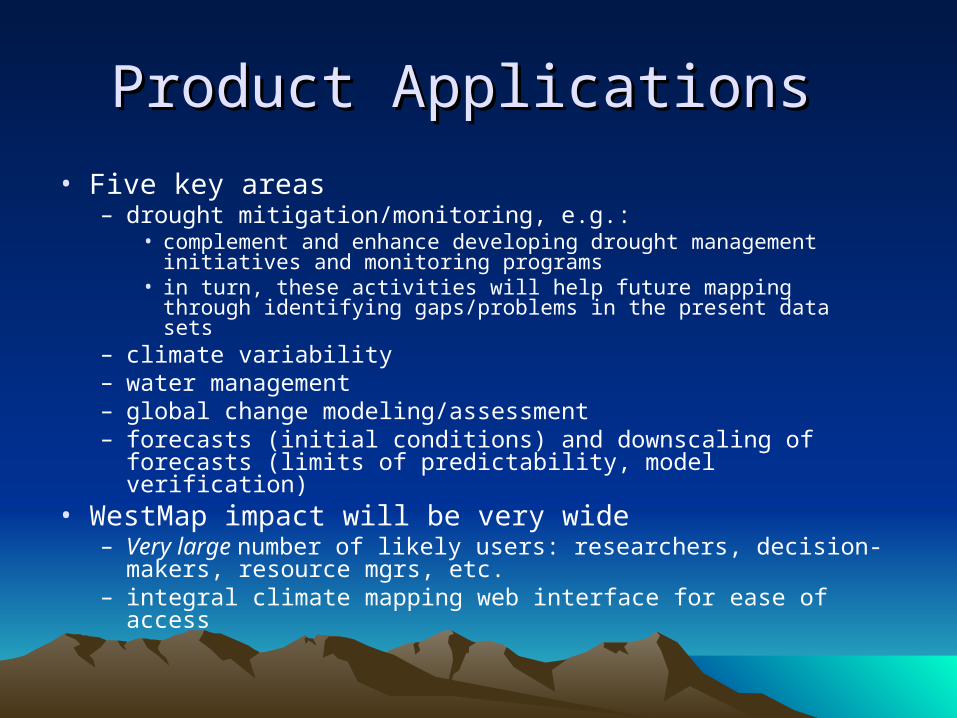
Product Applications Product Applications • Five key areas
– drought mitigation/monitoring, e.g.:• complement and enhance developing drought management
initiatives and monitoring programs• in turn, these activities will help future mapping through identifying
gaps/problems in the present data sets– climate variability– water management– global change modeling/assessment– forecasts (initial conditions) and downscaling of forecasts
(limits of predictability, model verification)• WestMap impact will be very wide
– Very large number of likely users: researchers, decision-makers, resource mgrs, etc.
– integral climate mapping web interface for ease of access
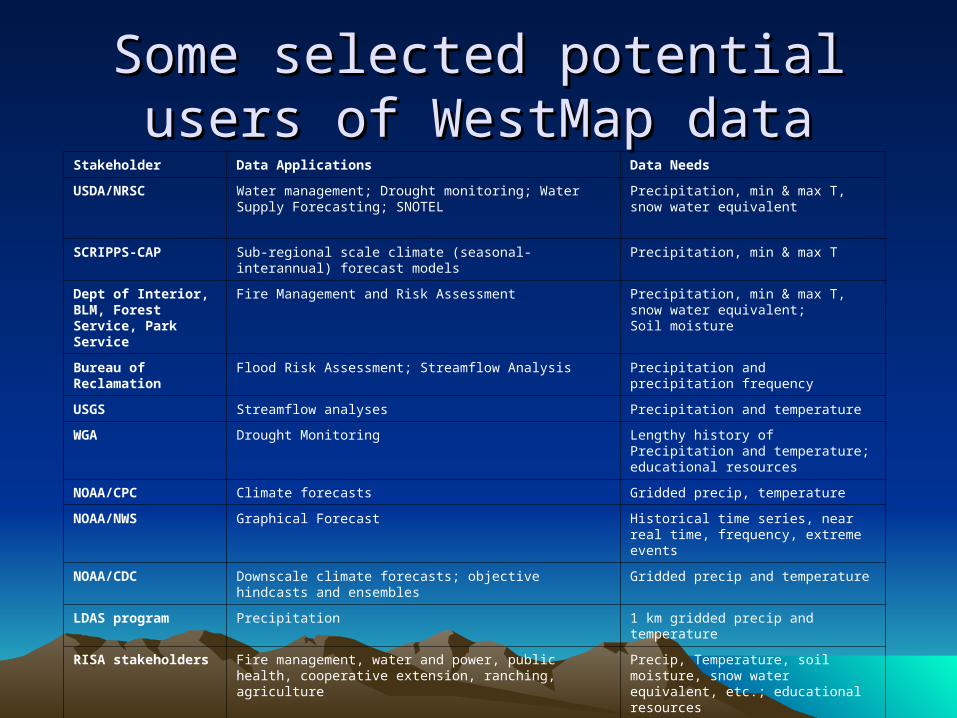
Some selected potential users of Some selected potential users of WestMap dataWestMap data
Stakeholder Data Applications Data Needs
USDA/NRSC Water management; Drought monitoring; Water Supply Forecasting; SNOTEL
Precipitation, min & max T, snow water equivalent
SCRIPPS-CAP Sub-regional scale climate (seasonal-interannual) forecast models Precipitation, min & max T
Dept of Interior, BLM, Forest Service, Park Service
Fire Management and Risk Assessment Precipitation, min & max T, snow water equivalent;Soil moisture
Bureau of Reclamation Flood Risk Assessment; Streamflow Analysis Precipitation and precipitation frequency
USGS Streamflow analyses Precipitation and temperature
WGA Drought Monitoring Lengthy history of Precipitation and temperature; educational resources
NOAA/CPC Climate forecasts Gridded precip, temperature
NOAA/NWS Graphical Forecast Historical time series, near real time, frequency, extreme events
NOAA/CDC Downscale climate forecasts; objective hindcasts and ensembles Gridded precip and temperature
LDAS program Precipitation 1 km gridded precip and temperature
RISA stakeholders Fire management, water and power, public health, cooperative extension, ranching, agriculture
Precip, Temperature, soil moisture, snow water equivalent, etc.; educational resources
University Climate variability analyses and reconstruction of paleo histories; regional impacts of climate; climate-social impacts/informational needs
Everything available
K-12 and Community Education
Local climate variability and basic climate curriculum Precipitation and temperature; educational resources

3 Major WestMap Components3 Major WestMap Components
DataDevelopment & Operations
ErrorAssessments,Data Analyses& Diagnostics
Data Access,Visualization
& EducationalResources
algorithm improvements and data updates
improvedonline tools and understanding of data uncertainty
better access and tools; increased
dataset utility
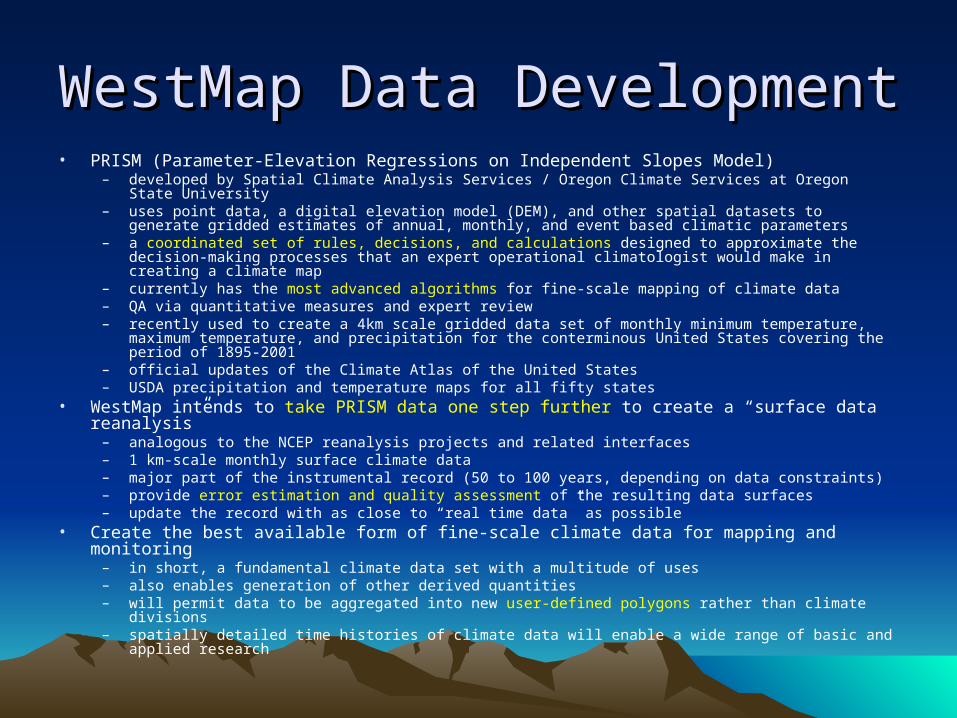
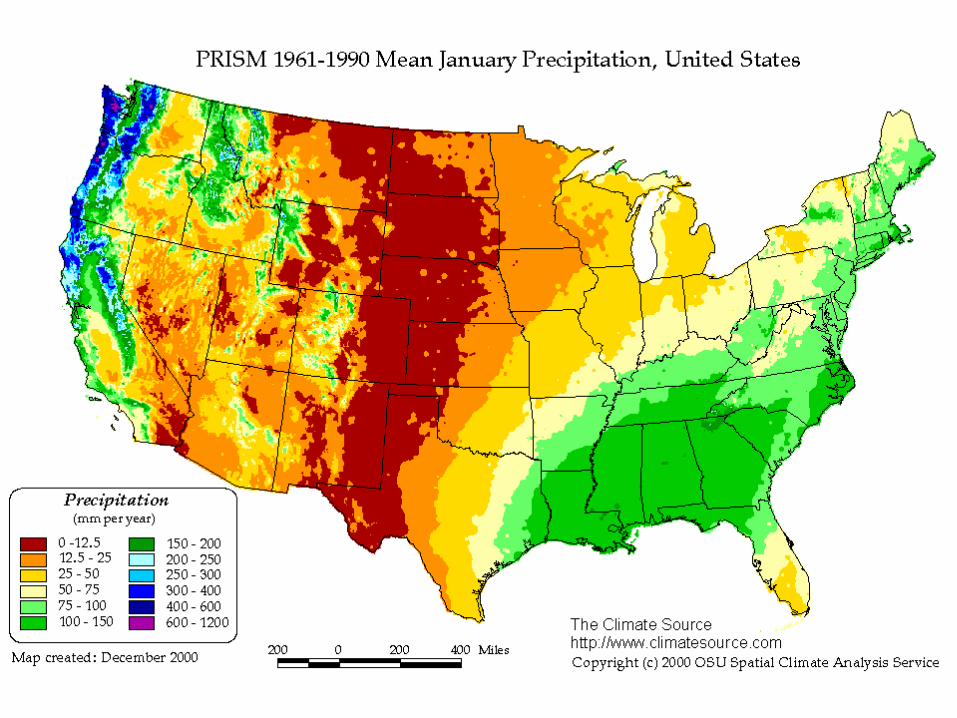
WestMap Data DevelopmentWestMap Data Development• PRISM (Parameter-Elevation Regressions on Independent Slopes Model)
– developed by Spatial Climate Analysis Services / Oregon Climate Services at Oregon State University– uses point data, a digital elevation model (DEM), and other spatial datasets to generate gridded estimates
of annual, monthly, and event based climatic parameters– a coordinated set of rules, decisions, and calculations designed to approximate the decision-making
processes that an expert operational climatologist would make in creating a climate map– currently has the most advanced algorithms for fine-scale mapping of climate data– QA via quantitative measures and expert review – recently used to create a 4km scale gridded data set of monthly minimum temperature, maximum
temperature, and precipitation for the conterminous United States covering the period of 1895-2001– official updates of the Climate Atlas of the United States – USDA precipitation and temperature maps for all fifty states
• WestMap intends to take PRISM data one step further to create a “surface data reanalysis” – analogous to the NCEP reanalysis projects and related interfaces– 1 km-scale monthly surface climate data– major part of the instrumental record (50 to 100 years, depending on data constraints)– provide error estimation and quality assessment of the resulting data surfaces– update the record with as close to “real time data” as possible
• Create the best available form of fine-scale climate data for mapping and monitoring– in short, a fundamental climate data set with a multitude of uses– also enables generation of other derived quantities– will permit data to be aggregated into new user-defined polygons rather than climate divisions– spatially detailed time histories of climate data will enable a wide range of basic and applied research

PRISM Modeling ApproachPRISM Modeling Approach
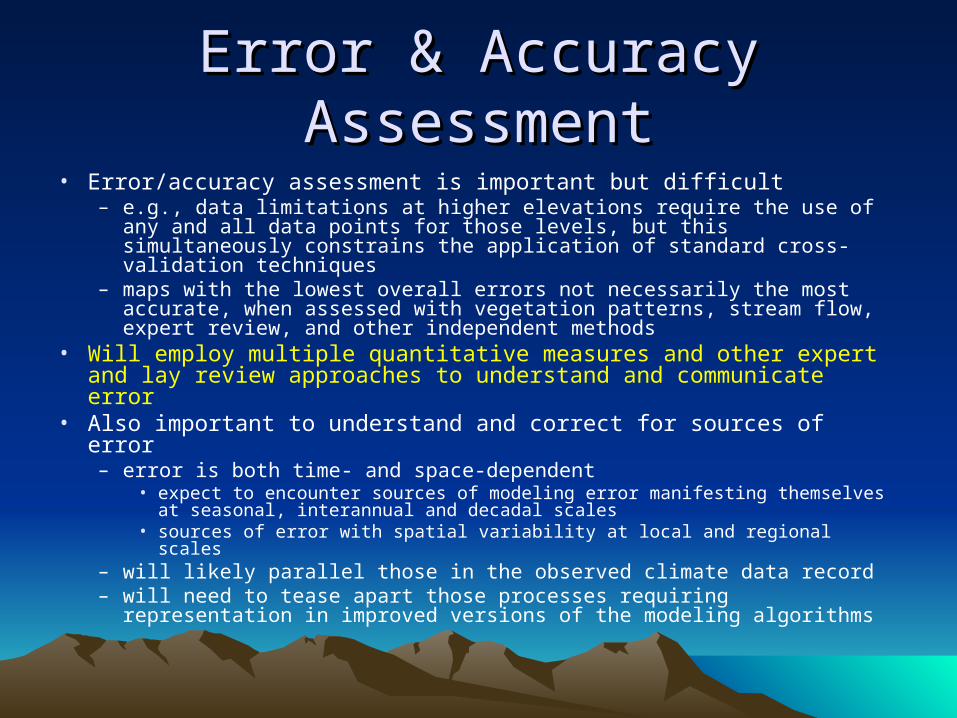
Error & Accuracy AssessmentError & Accuracy Assessment• Error/accuracy assessment is important but difficult
– e.g., data limitations at higher elevations require the use of any and all data points for those levels, but this simultaneously constrains the application of standard cross-validation techniques
– maps with the lowest overall errors not necessarily the most accurate, when assessed with vegetation patterns, stream flow, expert review, and other independent methods
• Will employ multiple quantitative measures and other expert and lay review approaches to understand and communicate error
• Also important to understand and correct for sources of error– error is both time- and space-dependent
• expect to encounter sources of modeling error manifesting themselves at seasonal, interannual and decadal scales
• sources of error with spatial variability at local and regional scales– will likely parallel those in the observed climate data record– will need to tease apart those processes requiring representation in
improved versions of the modeling algorithms

Data Analyses & DiagnosticsData Analyses & Diagnostics• Investigations of patterns and process underlying
variability and error in the WestMap data will also enable us to research a number of related complementary and critical questions
• Examples:– fine-scale data response to large-scale atmospheric processes– critical gaps in data coverage– episode monitoring applications (e.g., drought)– sub-regional climate variability– possible climate forecast model implementations of WestMap– data consistency versus accuracy– data assimilation and mapping– expert/lay perceptions of climate information and delivery– educational needs

Winter Precip & Anomalies
Data AccessData Access• Primary user interface via WRCC (website, online tools, data downloads)• Data cost approach similar to federally-managed climate datasets
– online access at no cost to public sector government and educational users (“.gov” & “.edu”)– optional media (CD, tape, etc.) and large or special requests available at nominal cost– fee structure for other interested users (e.g., private sector)
• Public-private collaboration– users of free data cannot release them to third-parties
to circumvent the access restrictions– some PRISM data products are currently marketed
through a licensing agreement between OSU and a private company, Climate Source, Inc.
– this will remain the outlet for private sector data delivery
– will provide increased financial support for the continued production of up to date climate maps for the public and private sector, adding to the database over time
– valuable way to continue WestMap growth after tools have been developed and public funding enters a lower-level, operational phase
• WestMap data storage– operationally stored at the Western Regional Climate Center– final archival storage at the National Climatic Data Center


Visualization Visualization ToolsTools
• WestMap will capitalize on these activities– development of specific new tools for spatial and temporal analysis– likely incorporation of WestMap data into above data analysis portal sites
• Visualization tools will be developed from the outset– Selected 4 km PRISM data are already publicly available– will form the initial dataset for development of WestMap visualization tools while the 1 km data
are being produced
• Cannot overstate the crucial role of visualization for data analysis
• Online visualization tools are a cornerstone of WestMap development
– leading example: NOAA CDC’s online tools for the NCEP reanalysis data set
– provides ability to manipulate, map, and associate data with other information (e.g., climate indices) in real time
– greatly improves the accessibility of the data for analysis and download by all categories of users
– core reason for the success and widespread use of the reanalysis data
– Similarly, WRCC has developed a variety of online data plotting tools


• Animation• Zoom
– pixels, polygons• Time Plots• Multi-panel display

Education/Outreach ResourcesEducation/Outreach Resources
• WestMap-type data are intuitive and appealing to many users– especially because they are based on observational data
• But, there are important caveats to be communicated– the data are nonetheless synthetic– appropriate use is contingent upon understanding how they were
developed• Also a need to provide educational & outreach resources
– for K-12, universities and broader stakeholders– WestMap includes development of interactive educational
materials– explain critical metadata, including caveats and error estimation– information resources to enable meaningful data interpretation
and applications
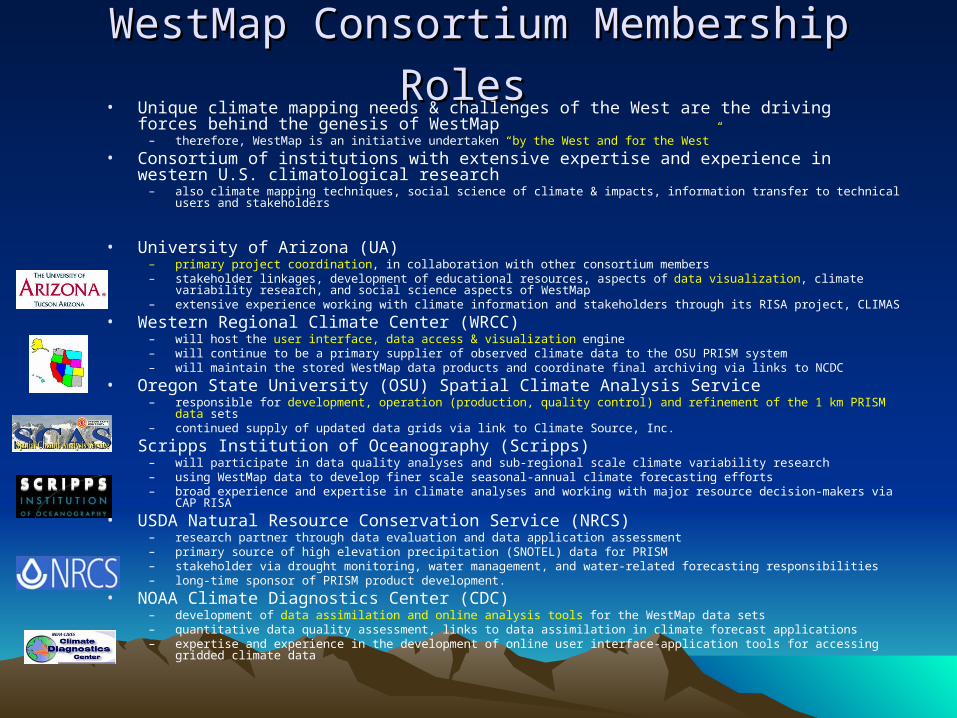
WestMap Consortium Membership RolesWestMap Consortium Membership Roles • Unique climate mapping needs & challenges of the West are the driving forces behind the
genesis of WestMap– therefore, WestMap is an initiative undertaken “by the West and for the West”
• Consortium of institutions with extensive expertise and experience in western U.S. climatological research
– also climate mapping techniques, social science of climate & impacts, information transfer to technical users and stakeholders
• University of Arizona (UA)– primary project coordination, in collaboration with other consortium members– stakeholder linkages, development of educational resources, aspects of data visualization, climate variability research, and
social science aspects of WestMap– extensive experience working with climate information and stakeholders through its RISA project, CLIMAS
• Western Regional Climate Center (WRCC)– will host the user interface, data access & visualization engine– will continue to be a primary supplier of observed climate data to the OSU PRISM system– will maintain the stored WestMap data products and coordinate final archiving via links to NCDC
• Oregon State University (OSU) Spatial Climate Analysis Service– responsible for development, operation (production, quality control) and refinement of the 1 km PRISM data sets– continued supply of updated data grids via link to Climate Source, Inc.
• Scripps Institution of Oceanography (Scripps)– will participate in data quality analyses and sub-regional scale climate variability research– using WestMap data to develop finer scale seasonal-annual climate forecasting efforts– broad experience and expertise in climate analyses and working with major resource decision-makers via CAP RISA
• USDA Natural Resource Conservation Service (NRCS)– research partner through data evaluation and data application assessment– primary source of high elevation precipitation (SNOTEL) data for PRISM– stakeholder via drought monitoring, water management, and water-related forecasting responsibilities– long-time sponsor of PRISM product development.
• NOAA Climate Diagnostics Center (CDC)– development of data assimilation and online analysis tools for the WestMap data sets– quantitative data quality assessment, links to data assimilation in climate forecast applications– expertise and experience in the development of online user interface-application tools for accessing gridded climate data

WestMap Funding StrategyWestMap Funding Strategy• Build the WestMap idea, simultaneously obtain funding from a range of sources
– wide range of stakeholders and potential users– many do not have the budgetary resources to completely support such an initiative– thus, define as an initiative that will attract partial, leveraged funding for several sub-projects– obtain broad “buy-in” from multiple agencies / institutions
• will better engage the climate data user community in funding a common data source– investigating multiple sources of funding
• federal agencies (e.g., NSF, NOAA, NASA, USDA, USGS) and multi-agency initiatives, Western Governor’s Association and/or Congressional funding, public-private enterprise programs, and others
• given importance for western stakeholders, explore RISA resources• WestMap is a large effort that needs substantial financial support
– set of postdocs, programmers, and grad students across several institutions– ideally, 3-5 years of funding on the order of $200-500K+ per year – will support the core development and initial operational components of the initiative
• Explore public-private partnership to support continued data production– take advantage of lower level of reliable steady support– follows high-cost development phase
• costs of storing/serving established data sets could be partly absorbed into regular operations
– major future upgrades will still need conventional funding

WestMap StatusWestMap Status• Held an organizational planning meeting
– January 8-9, 2003, hosted by UA/CLIMAS– established WestMap Consortium– defined objectives of the WestMap initiative
• Initial efforts now officially underway– consortium has begun looking for funding partners– Website coming soon– CDC lead on ESDIM proposal– PACLIM, Climate Diagnostics Workshop– Contacting agencies/program managers