westminster citywide parking...
TRANSCRIPT
Westminster Citywide Parking Occupancy
Surveys Executive Summary
Project No: 18650-01-1
July 2011
20 Eastbourne Terrace,
London,
W2 6LG
Telephone: 020 7053 1300
Fax: 020 7053 1301
Prepared by: Approved by:
____________________________________________ ____________________________________________
CH/DWP/TR/RS DWP
Status: Final Issue no: 1 Date: 20 July 2011
westminster citywide parking occupancy surveys - exec summary - final.doc
(C) Copyright Colin Buchanan and Partners Limited. All rights reserved.
This report has been prepared for the exclusive use of the commissioning party and unless otherwise agreed in writing by Colin Buchanan and Partners Limited, no other party may copy, reproduce, distribute, make use of, or rely on the contents of the report. No liability is accepted by Colin Buchanan and Partners Limited for any use of this report, other than for the purposes for which it was originally prepared and provided.
Opinions and information provided in this report are on the basis of Colin Buchanan and Partners Limited using due skill, care and diligence in the preparation of the same and no explicit warranty is provided as to their accuracy. It should be noted and is expressly stated that no independent verification of any of the documents or information supplied to Colin Buchanan and Partners Limited has been made

Westminster Citywide Parking Occupancy Surveys Executive Summary
Contents Page
1 Westminster Parking Occupancy Survey 2011 1 1.1 Background 1 1.2 Introduction 1 1.3 Executive summary 1 1.4 The scope of the surveys 2 1.5 The number of parking spaces in the city 3 1.6 The number of vehicles parking in the City 4 1.7 An estimation of visitors and workers parking 7 1.8 The occupancy of Resident parking spaces 8 1.9 The occupancy of Paid-for parking spaces 11 1.10 The occupancy of Shared Use parking spaces 14 1.11 Overview of survey findings 15 1.12 Conclusions 16
Tables Page
Table 1.1: Parked vehicles per period / per parking zone 6
Table 1.2: Parking occupancy % on Resident space - Sub-zones by period9
Table 1.3: Parking occupancy % - Paid-for spaces per Zone 11
Table 1.4: Parking occupancy % – Paid-for spaces per Sub-zone 12
Table 1.5: Parking occupancy % on Shared Use spaces - Sub-zones by period 14
Figures Page
Figure 1.1: Number of parking spaces in the city 3
Figure 1.2: Number of vehicles parking in the city 4
Figure 1.3: Number of vehicles parked per restriction type 5
Figure 1.4: Overnight occupancy % of Resident spaces 8
Figure 1.5: Resident Bay and Shared Use spaces - weekday overnight period - Heat Map 10
Figure 1.6: Paid-for spaces occupancy – Sunday daytime period 11:00 – 15:00 – Heat Map 13

1
Westminster Citywide Parking Occupancy Surveys 2011 Executive Summary
1 Westminster Parking Occupancy Survey
2011
1.1 Background
1.1.1 The City of Westminster experiences a very high demand for parking both from its resident population and those working in the area, parking for commercial / business reasons, and visiting shopping, tourist and other popular attractions. Therefore, as a consequence, high levels of parking pressure can occur as supply struggles to meet demand.
1.1.2 To determine whether the existing parking arrangements in the City remain appropriate today, and will do in the future, for both residents, businesses and workers/visitors, Westminster City Council (WCC) is currently, for the first time in a decade, undertaking a full review of it’s parking policy. The Westminster Council Parking Policy Review 2010/2011 will also determine whether it’s policy continues to meet the objectives of current traffic and parking legislation.
1.2 Introduction
1.2.1 The review has included a detailed parking consultation exercise with numerous groups including residents, visitors and local businesses, and with other stakeholders. The consultation was undertaken during November 2010 – January 2011.
1.2.2 This was followed during the spring of 2011 with a programme of traffic counts undertaken at numerous locations in the City, and a very comprehensive Citywide parking occupancy survey undertaken between February and May 2011.
1.2.3 The parking survey recorded a snapshot of parking occupancy, covering all parking spaces in the City, during nine periods of the day. The findings from this survey form a key element of the policy review, as this information provides evidence on exactly where, and when, supply in the City struggles to meet demand with parking occupancy exceeding acceptable and convenient rates.
1.2.4 The findings of the parking occupancy survey are reported in this Executive Summary.
1.3 Executive summary
1.3.1 This report includes chapters covering the following aspects of the survey:
� The scope of the surveys. � The number of parking spaces in the City. � The number of vehicles parking in the City. � An estimate of visitor and workers parking. � The occupancy of Resident parking spaces. � The occupancy of Paid-for parking spaces. � The occupancy of Shared Use parking spaces. � An overview of the survey findings; and, � Conclusions.

2
Westminster Citywide Parking Occupancy Surveys 2011 Executive Summary
1.3.2 The survey findings are reported as totals for the City, and separately for each of the Council’s eight defined parking Zones (A-H), and amongst smaller parking Sub-zones where different tariffs are charged and hours of control operate targeted to local parking needs. This enables a more localised analysis of parking pressure that might feasibly be hidden amongst average findings for wider areas.
1.3.3 The report focuses on the findings amongst the parking restriction types that form the largest proportion of the Council’s on-street parking provision, including Resident, Shared Use and Paid-for parking. The parking consultation indicated that parking problems exist amongst these types.
1.3.4 WCC operates a ‘traffic light’ system to measure parking ‘pressure’ amongst its parking spaces, based around official parking management guidance and their expert knowledge and experience, as follows:
� Red = 80+% Occupancy. � Amber = 70-80% Occupancy; � Green = less than 70% Occupancy.
1.3.5 When parking occupancy is over 80% (red) this indicates high levels of parking pressure / stress with supply either struggling, or not able to, meet the high demand for parking (possibly amongst a particular restriction type or throughout an area). Where the parking occupancy is 70% to 80% (amber) there is again likely to be parking pressure, however when occupancy is under 70% (green) supply is likely to be meeting demand.
1.3.6 This report uses these colours to present the parking occupancy findings.
1.4 The scope of the surveys
1.4.1 The first stage of the survey involved recording the location of all the parking spaces in the City. This was followed by a ‘snapshot’ survey of how occupied these spaces were during nine different survey periods of the weekday and weekend as follows:
� Survey Period 1: Weekday Overnight (Midnight to 06:00hrs). � Survey Period 2: Weekday Morning (07:30-09:30hrs). � Survey Period 3: Weekday Daytime (11:00-15:00hrs). � Survey Period 4: Weekday Evening (19:00-23:00hrs). � Survey Period 5: Saturday Overnight (Midnight to 03:00hrs). � Survey Period 6: Saturday Daytime (11:00-15:00hrs). � Survey Period 7: Saturday Evening (19:00-23:00hrs). � Survey Period 8: Sunday Overnight (Midnight to 03:00hrs). � Survey Period 9: Sunday Daytime (11:00-15:00hrs).
1.4.2 These periods cover those times when peak demand would be expected amongst residents and workers/visitors.
1.4.3 Parking occupancy was recorded separately for each of the Council’s various on-street parking restriction types, listed below. This includes City Car Club and Electric Charging spaces, and cashless parking using a mobile phone or credit/debit card.
� Car Club. � Diplomat � Disabled (Blue/ White Badge). � Doctor.

3
Westminster Citywide Parking Occupancy Surveys 2011 Executive Summary
� Electric Charging. � Hospital. � Loading Bay. � Motorcycle (Pay by Phone). � Paid-for (including Pay and Display and Pay by Phone). � Resident. � Shared Use (for residents permit holders and paying visitors at certain
times). � Single Yellow Line. � Taxi.
1.5 The number of parking spaces in the city
1.5.1 The chart below shows the number of ‘available’ on-street parking spaces in the City at the time of the 2011 survey. Double Yellow Lines are not included as they are unavailable for parking.
1.5.2 Those parking spaces affected by roadwork’s were unavailable for parking (Crossrail, building works etc) and are therefore excluded from these figures.
Figure 1.1: Number of parking spaces in the city
115 356 457 241 92 15 55 170
6,040
26,112
3,741
30,306
623
7,858
0
5000
10000
15000
20000
25000
30000
35000
Car Club
Diplomat
Disabled (Blue)
Disabled (White)
Doctor's Bay
Electric Charging
Hospital Parking
Loading Bay
Motorcycle
Paid-for
Resident
Shared Use
Single Yellow
Taxi Bay
Restriction Type
Number of Parking Spaces
1.5.3 There were some 30,000 spaces available for residents parking (Resident and Shared Use spaces) and 700 Disabled parking spaces. There are approximately 178km, or 30,306 theoretical parking spaces of Single Yellow Lines in the City that can be legally used outside the relevant hours of control.
4
Westminster Citywide Parking Occupancy Surveys 2011 Executive Summary
1.6 The number of vehicles parking in the City
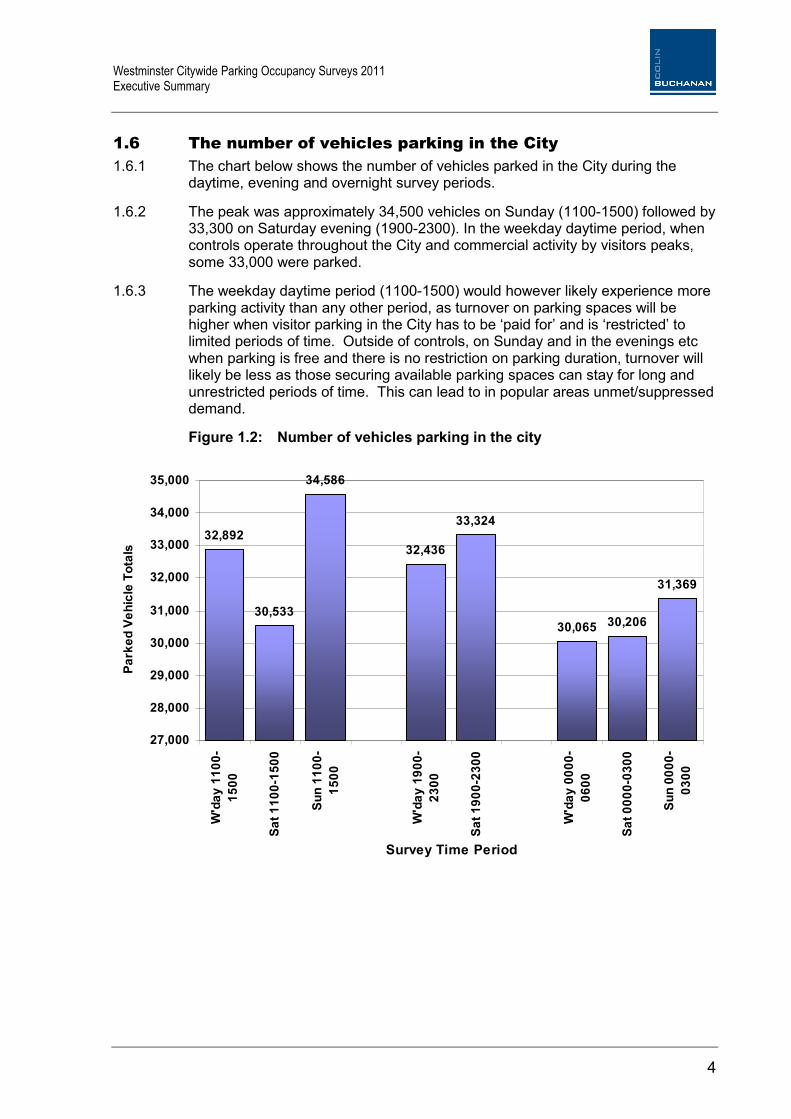
1.6.1 The chart below shows the number of vehicles parked in the City during the daytime, evening and overnight survey periods.
1.6.2 The peak was approximately 34,500 vehicles on Sunday (1100-1500) followed by 33,300 on Saturday evening (1900-2300). In the weekday daytime period, when controls operate throughout the City and commercial activity by visitors peaks, some 33,000 were parked.
1.6.3 The weekday daytime period (1100-1500) would however likely experience more parking activity than any other period, as turnover on parking spaces will be higher when visitor parking in the City has to be ‘paid for’ and is ‘restricted’ to limited periods of time. Outside of controls, on Sunday and in the evenings etc when parking is free and there is no restriction on parking duration, turnover will likely be less as those securing available parking spaces can stay for long and unrestricted periods of time. This can lead to in popular areas unmet/suppressed demand.
Figure 1.2: Number of vehicles parking in the city
32,892
30,533
34,586
32,436
33,324
30,065 30,206
31,369
27,000
28,000
29,000
30,000
31,000
32,000
33,000
34,000
35,000
W'day 1100-
1500
Sat 1100-1500
Sun 1100-
1500
W'day 1900-
2300
Sat 1900-2300
W'day 0000-
0600
Sat 0000-0300
Sun 0000-
0300
Survey Time Period
Parked Vehicle Totals
5
Westminster Citywide Parking Occupancy Surveys 2011 Executive Summary
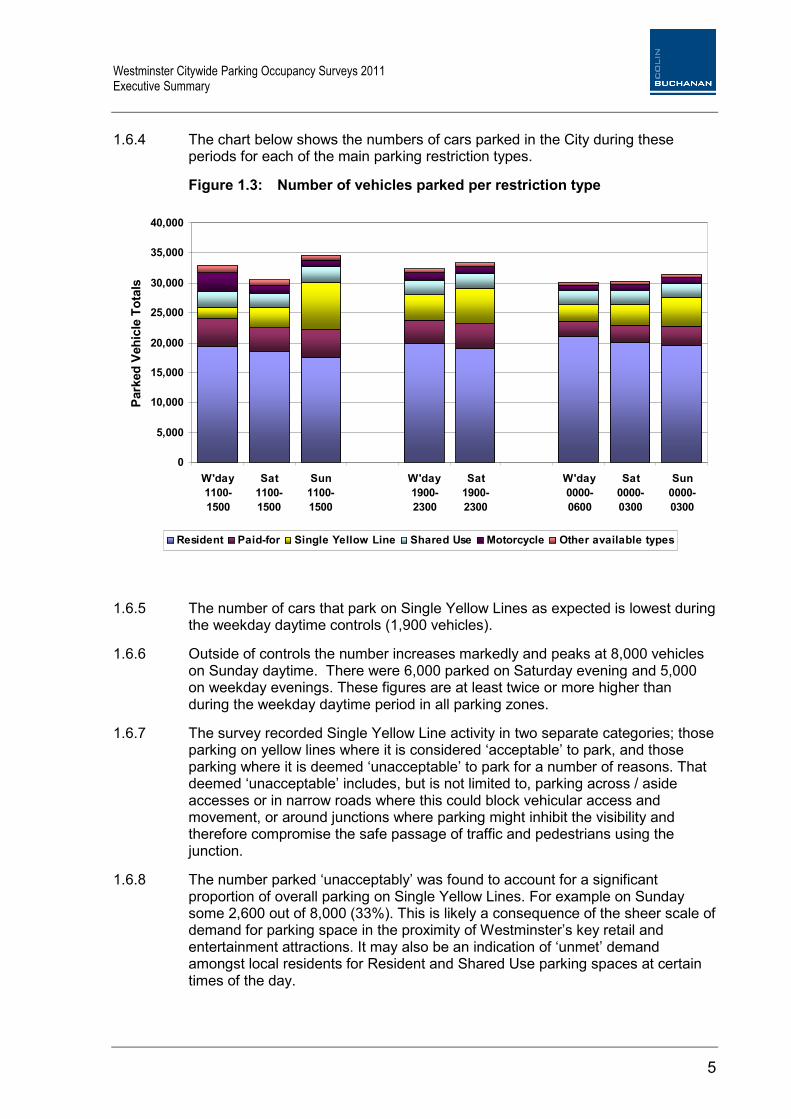
1.6.4 The chart below shows the numbers of cars parked in the City during these periods for each of the main parking restriction types.
Figure 1.3: Number of vehicles parked per restriction type
0
5,000
10,000
15,000
20,000
25,000
30,000
35,000
40,000
W'day
1100-
1500
Sat
1100-
1500
Sun
1100-
1500
W'day
1900-
2300
Sat
1900-
2300
W'day
0000-
0600
Sat
0000-
0300
Sun
0000-
0300
Parked Vehicle Totals
Resident Paid-for Single Yellow Line Shared Use Motorcycle Other available types
1.6.5 The number of cars that park on Single Yellow Lines as expected is lowest during the weekday daytime controls (1,900 vehicles).
1.6.6 Outside of controls the number increases markedly and peaks at 8,000 vehicles on Sunday daytime. There were 6,000 parked on Saturday evening and 5,000 on weekday evenings. These figures are at least twice or more higher than during the weekday daytime period in all parking zones.
1.6.7 The survey recorded Single Yellow Line activity in two separate categories; those parking on yellow lines where it is considered ‘acceptable’ to park, and those parking where it is deemed ‘unacceptable’ to park for a number of reasons. That deemed ‘unacceptable’ includes, but is not limited to, parking across / aside accesses or in narrow roads where this could block vehicular access and movement, or around junctions where parking might inhibit the visibility and therefore compromise the safe passage of traffic and pedestrians using the junction.
1.6.8 The number parked ‘unacceptably’ was found to account for a significant proportion of overall parking on Single Yellow Lines. For example on Sunday some 2,600 out of 8,000 (33%). This is likely a consequence of the sheer scale of demand for parking space in the proximity of Westminster’s key retail and entertainment attractions. It may also be an indication of ‘unmet’ demand amongst local residents for Resident and Shared Use parking spaces at certain times of the day.
6
Westminster Citywide Parking Occupancy Surveys 2011 Executive Summary
1.6.9 Amongst Motorcycle spaces, parking increases notably in the weekday daytime period compared with all other times. This trend is repeated on a number of other parking restriction types including Loading Bays (set aside for businesses to load), Disabled spaces, City Car Club and Electric Charging spaces. The occupancy of these spaces increases during the periods of most commercial, business and commuter activity.
1.6.10 The number who park on Resident spaces peaks at 22,000 overnight in the weekday. The lowest number parked on Resident spaces was 17,000 on Sunday afternoon, which is when the overall number parked in the City peaked at 35,000 vehicles. This scale of parking outside of Resident spaces on Sunday appears to indicate that visitor parking at this time might possibly reach or even overtake that of the resident population.
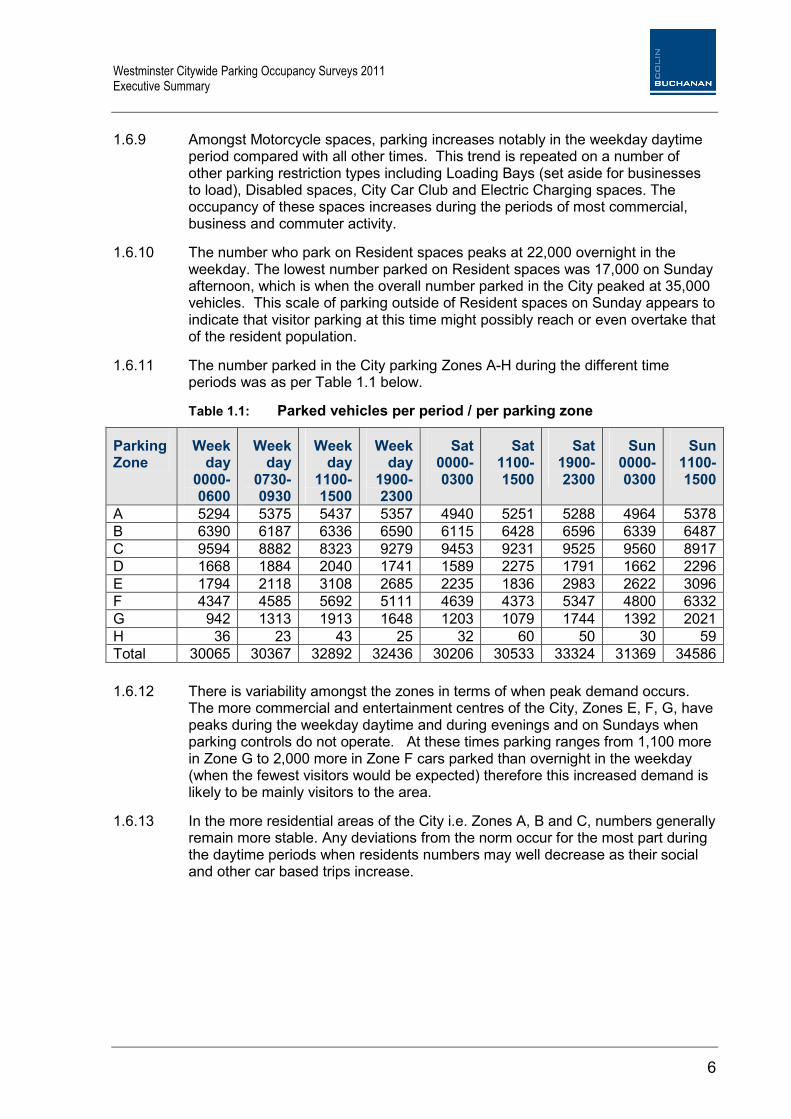
1.6.11 The number parked in the City parking Zones A-H during the different time periods was as per Table 1.1 below.
Table 1.1: Parked vehicles per period / per parking zone
Parking Zone
Weekday
0000-0600
Weekday
0730-0930
Weekday
1100-1500
Weekday
1900-2300
Sat 0000-0300
Sat 1100-1500
Sat 1900-2300
Sun 0000-0300
Sun 1100-1500
A 5294 5375 5437 5357 4940 5251 5288 4964 5378
B 6390 6187 6336 6590 6115 6428 6596 6339 6487
C 9594 8882 8323 9279 9453 9231 9525 9560 8917
D 1668 1884 2040 1741 1589 2275 1791 1662 2296
E 1794 2118 3108 2685 2235 1836 2983 2622 3096
F 4347 4585 5692 5111 4639 4373 5347 4800 6332
G 942 1313 1913 1648 1203 1079 1744 1392 2021
H 36 23 43 25 32 60 50 30 59
Total 30065 30367 32892 32436 30206 30533 33324 31369 34586
1.6.12 There is variability amongst the zones in terms of when peak demand occurs. The more commercial and entertainment centres of the City, Zones E, F, G, have peaks during the weekday daytime and during evenings and on Sundays when parking controls do not operate. At these times parking ranges from 1,100 more in Zone G to 2,000 more in Zone F cars parked than overnight in the weekday (when the fewest visitors would be expected) therefore this increased demand is likely to be mainly visitors to the area.
1.6.13 In the more residential areas of the City i.e. Zones A, B and C, numbers generally remain more stable. Any deviations from the norm occur for the most part during the daytime periods when residents numbers may well decrease as their social and other car based trips increase.

7
Westminster Citywide Parking Occupancy Surveys 2011 Executive Summary
1.7 An estimation of visitors and workers parking
1.7.1 This survey did not record resident permit holder parking compared with worker & visitor parking separately, only recording a snapshot of the number of cars who were parked on the various parking restriction types in the City during different periods of the day. However, an attempt at a very crude estimate of the numbers of workers & visitors parking in the City can be made from the information recorded using the following assumptions.
1.7.2 Residents can be considered as those who are parked in Resident and Disabled White Badge parking spaces (however a small proportion of these can be disabled students or workers who live outside of the City) as well as 65% of those in Shared Use spaces based on findings during historical parking surveys undertaken in the City (and a large proportion of those parked overnight on other restriction types who could be residents but have not purchased a permit). Visitors can be considered, predominantly, and for this purpose, as those parked on other restriction types.
1.7.3 Taking all this into account, our crude estimate shows that peak visitor parking in the City likely occurs during the weekday daytime period when most commercial activity happens (12,000 visitors). This is followed closely by periods outside the hours of control when charges do not apply; the Sunday daytime (11,500), the Saturday evening (9,000) followed closely by the weekday evening (7,500).
1.7.4 Simplistically, visitor parking and, therefore, demand for parking spaces is at it’s peak when the City is commercially at it’s most active – weekday during the working week, Saturday evenings, and Sunday during the day – when controls do not currently apply and weekday evenings – when visitors come to the City for leisure, entertainment and work-related purposes.
1.7.5 Based on these estimates the worker/visitor population could amount to approximately 25-40% of all parking in the City at these times. The parking occupancy survey findings indicate that visitor demand is concentrated around key retail and entertainment attractions - not evenly spread around the whole City - therefore certain locations are likely to be struggling to accommodate this scale of demand. This can lead to serious parking pressure and problematical parking and traffic conditions.
1.7.6 In some of these locations, mostly during periods outside of controlled times, the survey recorded excessive occupancy of both Resident and Shared Use parking spaces, for example in numerous parts of Zones B and F. In these areas there is likely unmet Resident demand resulting in residents overspill onto other types of available parking spaces, which further increases the pressure on available parking spaces in these areas. One consequence of high competition between residents and visitors for available parking spaces, is that resident permit holders might find themselves unable to park within an acceptable proximity of their residence.

8
Westminster Citywide Parking Occupancy Surveys 2011 Executive Summary
1.8 The occupancy of Resident parking spaces
1.8.1 In recent years the City Council has re-designated a number of previously Paid-for parking spaces, and yellow lines, into Resident and Shared Use spaces to reduce known increasing ‘pressure’ on Resident parking. In 2009 the City Council created an additional 1,013 Resident or Shared Use spaces. In the preceding years, to relieve parking pressure, the City regularly reviewed the existing hours of control amongst the parking zones and extended the hours into evenings and weekends where necessary.
1.8.2 However, in some areas both the parking consultation and the parking occupancy survey show that occupancy rates exceeding acceptable and convenient rates persist on Resident spaces, especially in the evenings and overnight.
1.8.3 The chart below shows the overnight occupancy amongst Resident spaces during the weekday overnight period (when numbers peak in all zones except E and G). Parking ‘stress’, occupancy over 80%, exists in four out of the eight zones, whilst Zone D is close to 80%.
Figure 1.4: Overnight occupancy % of Resident spaces
8386
8178
63
84
64
75
0
10
20
30
40
50
60
70
80
90
100
A B C D E F G H
Zone
Resident Spaces Occupancy (%)
1.8.4 As each of the parking Zones covers a wide area, and varying degrees of occupancy and parking pressure exist in different areas of these, it makes sense to analyse the occupancy amongst Resident spaces in the more localised Sub-zone areas (these operate different hours of control and/or charge different tariffs for parking that better reflect known local needs).

9
Westminster Citywide Parking Occupancy Surveys 2011 Executive Summary
1.8.5 The occupancy in these Sub-zones is shown in Table 2.1 below.
Table 1.2: Parking occupancy % on Resident space - Sub-zones by period
Sub-zone
Week day 0000-0600
Week day 0730-0930
Week day 1100-1500
W-day 1900-2300
Sat 0000-0300
Sat 1100-1500
Sat 1900-2300
Sun 0000-0300
Sun 1100-1500
A1 96 88 80 87 88 82 82 86 75
A2 69 71 70 65 64 59 57 58 58
A3 78 72 74 71 71 65 71 73 65
A4 69 66 68 69 67 55 57 59 63
B10 82 81 80 78 70 66 64 67 63
B11 92 87 88 81 86 84 73 82 66
B2 91 81 78 85 86 72 87 86 75
B3 86 81 79 80 84 72 74 79 68
B4 86 75 76 83 85 83 77 81 72
B5 94 88 85 88 90 83 91 91 81
B6 86 86 82 82 83 69 75 73 66
B7 69 73 85 71 61 66 67 66 60
BC1 82 87 89 81 83 87 79 82 73
C1 87 82 79 83 84 78 81 82 74
C2 70 58 52 66 70 59 65 68 58
CB1 80 79 73 79 80 82 73 77 73
D1 81 75 67 75 81 83 71 78 80
D4 77 75 75 70 69 61 67 65 71
E1 63 65 75 62 60 58 64 61 54
F1 82 78 74 75 79 67 69 73 62
F2 88 82 87 83 86 79 77 79 70
F3 70 75 81 74 73 73 69 74 64
F4 95 87 96 86 83 78 94 97 71
F5 94 90 92 90 93 87 88 92 78
F6 86 93 93 86 84 95 91 88 79
G1 64 66 71 67 65 57 64 65 58
G2
H1 75 75 50 50 50 50 75 75 100
1.8.6 Very high levels of parking ‘stress’, often over 90%, are evident in many of the local Sub-zone areas. All Sub-zones bar one recorded occupancy near to, or over, 80% during at least one of the survey periods.
1.8.7 Occupancy is found to be critically high in some Sub-zones of Zones A, B and F, potentially leading to unmet demand and residents overspill onto alternative parking spaces. This happens at the same time as many of these areas attract visitors to local attractions.
1.8.8 When resident permit holders do find themselves having to park on alternative spaces in the evening (such as Single Yellow Lines etc), they can face the inconvenience of having to try to find Resident spaces again later that evening, or in the morning, before the hours of control commence.
10
Westminster Citywide Parking Occupancy Surveys 2011 Executive Summary
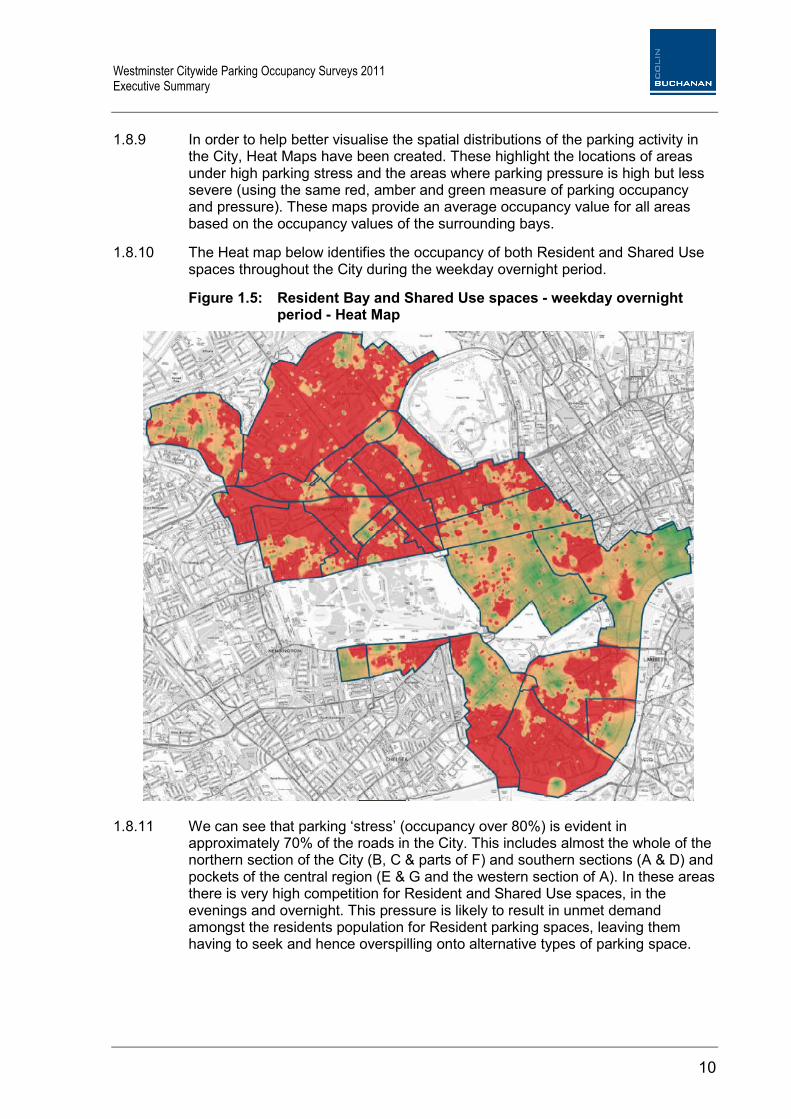
1.8.9 In order to help better visualise the spatial distributions of the parking activity in the City, Heat Maps have been created. These highlight the locations of areas under high parking stress and the areas where parking pressure is high but less severe (using the same red, amber and green measure of parking occupancy and pressure). These maps provide an average occupancy value for all areas based on the occupancy values of the surrounding bays.
1.8.10 The Heat map below identifies the occupancy of both Resident and Shared Use spaces throughout the City during the weekday overnight period.
Figure 1.5: Resident Bay and Shared Use spaces - weekday overnight period - Heat Map
1.8.11 We can see that parking ‘stress’ (occupancy over 80%) is evident in approximately 70% of the roads in the City. This includes almost the whole of the northern section of the City (B, C & parts of F) and southern sections (A & D) and pockets of the central region (E & G and the western section of A). In these areas there is very high competition for Resident and Shared Use spaces, in the evenings and overnight. This pressure is likely to result in unmet demand amongst the residents population for Resident parking spaces, leaving them having to seek and hence overspilling onto alternative types of parking space.

11
Westminster Citywide Parking Occupancy Surveys 2011 Executive Summary
1.9 The occupancy of Paid-for parking spaces
1.9.1 The movement toward innovation and new technology has led WCC to introduce cashless parking across the City, either in the form of credit and debit cards at on-street P&D machines, and more recently the use of payment by mobile phone. A parking card (parking voucher) allowing motorists to purchase scratch cards to pay for their parking was also introduced in 2008.
1.9.2 Table 1.3 below shows the occupancy of Paid-for parking spaces in each parking Zone during the survey periods.
Table 1.3: Parking occupancy % - Paid-for spaces per Zone
Zone
Weekday 0000-0600
Weekday 0730-0930
Weekday 1100-1500
Weekday 1900-2300
Sat 0000-0300
Sat 1100-1500
Sat 1900-2300
Sun 0000-0300
Sun 1100-1500
A 37 58 71 61 38 62 68 44 68
B 57 62 75 71 54 78 74 60 78
C 59 71 74 65 59 77 70 61 71
D 27 53 72 43 29 82 45 32 69
E 36 55 86 73 49 63 86 64 84
F 33 49 80 57 38 60 62 44 81
G 36 54 70 71 49 56 82 59 92
H 67 67 78 44 67 100 89 67 100
Total 41 57 77 64 46 67 71 53 78
1.9.3 Paid-for spaces are well utilised during the weekday daytime period, when controls operate in all zones, ranging from 70% occupancy in Zone G to the high of 86% in E. The survey recorded 4,570 vehicles parked on Paid-for parking in the City during this period.
1.9.4 Zones E, F and G also operate controls during Saturday daytime, however, occupancy is well down at this time compared with the weekday daytime (when peak commercial activity occurs) and ranged from between only 56% to 63%. In those zones that do not have controls on Saturday, or that operate partial half-day controls, there is a different trend and occupancy levels are more similar to or above that of the weekday daytime period.
1.9.5 On Sunday, outside of controls, the demand for Paid-for parking is back up to, or higher, in zones E, F and G than during the weekday daytime. Zones E and G also record high occupancy amongst Paid-for parking during both Weekday and Saturday evenings.

12
Westminster Citywide Parking Occupancy Surveys 2011 Executive Summary
1.9.6 The occupancy amongst Paid-for spaces in the more localised Sub-zone areas is shown in Table 1.4 below.
Table 1.4: Parking occupancy % – Paid-for spaces per Sub-zone
Sub-zone
Weekday 0000-0600
Weekday 0730-0930
Weekday 1100-1500
Weekday 1900-2300
Sat 0000-0300
Sat 1100-1500
Sat 1900-2300
Sun 0000-0300
Sun 1100-1500
A1 63 62 63 68 60 76 69 62 66
A2 27 59 78 54 27 65 67 38 61
A3 22 52 71 62 30 42 67 29 84
A4 5 49 60 86 9 16 77 30 98
B10 59 76 81 68 60 96 74 47 85
B11 48 59 75 69 50 83 69 57 63
B2 51 49 81 69 62 88 64 58 69
B3 56 59 75 75 52 86 83 64 90
B4 68 68 65 48 65 87 68 71 65
B5 64 74 76 74 53 36 55 60 86
B6 48 50 72 69 30 78 74 54 59
B7 55 47 78 76 53 51 77 55 83
BC1 68 73 70 62 64 83 75 66 68
C1 61 79 81 68 58 78 75 63 73
C2 54 48 54 56 58 69 53 54 63
CB1 65 72 78 63 72 89 89 65 78
D1 23 35 48 41 35 91 50 39 78
D4 27 55 75 43 28 81 44 31 68
E1 36 55 86 73 49 63 86 64 84
F1 47 64 70 75 36 38 70 42 68
F2 28 46 80 51 30 52 50 31 77
F3 26 50 83 55 35 68 65 45 88
F4 68 44 75 68 55 53 91 88 72
F5 67 56 85 76 82 81 78 51 89
F6 37 55 67 73 67 76 86 88 80
G1 36 54 70 71 49 56 81 59 92
G2 100 100 100 100 100 100 100 100 200
H1 67 67 78 44 67 100 89 67 100
1.9.7 Occupancy is over 70% in most Sub-zones during weekday daytime controls, including in all bar one of the Sub-zones in B and F.
1.9.8 On Sundays, occupancy was over 80% in close to half of all the Sub-zone areas, and the same during the Saturday daytime and Saturday evening periods.
1.9.9 The occupancy of paid-for space, in nearly all Sub-zones, is notably lower during the weekday and weekend overnight survey periods.
1.9.10 The following Heat Map represents Paid-for parking bay occupancy during the peak Sunday daytime period. We can see that large parts of the City, and some smaller clusters in other areas, are red, indicating particularly high levels of demand and pressure for this type of space in popular locations.

13
Westminster Citywide Parking Occupancy Surveys 2011 Executive Summary
1.9.11 This includes the central areas of zones E and G, and also in other areas that offer retail and other attractions, for example around Knightsbridge in Zone A and Victoria in Zone D, in Bayswater, Queensway and Paddington in Zone B, and along the boundaries of the Royal Parks.
Figure 1.6: Paid-for spaces occupancy – Sunday daytime period 11:00 – 15:00 – Heat Map
14
Westminster Citywide Parking Occupancy Surveys 2011 Executive Summary
1.10 The occupancy of Shared Use parking spaces
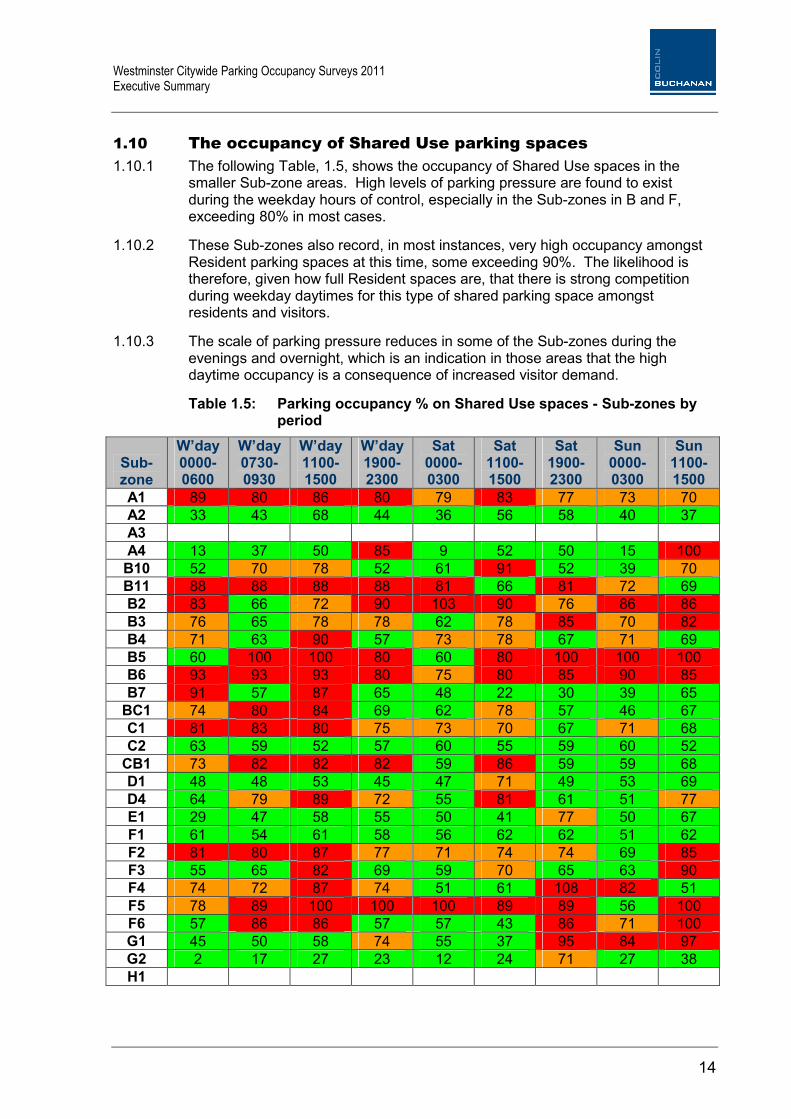
1.10.1 The following Table, 1.5, shows the occupancy of Shared Use spaces in the smaller Sub-zone areas. High levels of parking pressure are found to exist during the weekday hours of control, especially in the Sub-zones in B and F, exceeding 80% in most cases.
1.10.2 These Sub-zones also record, in most instances, very high occupancy amongst Resident parking spaces at this time, some exceeding 90%. The likelihood is therefore, given how full Resident spaces are, that there is strong competition during weekday daytimes for this type of shared parking space amongst residents and visitors.
1.10.3 The scale of parking pressure reduces in some of the Sub-zones during the evenings and overnight, which is an indication in those areas that the high daytime occupancy is a consequence of increased visitor demand.
Table 1.5: Parking occupancy % on Shared Use spaces - Sub-zones by period
Sub-zone
W’day 0000-0600
W’day 0730-0930
W’day 1100-1500
W’day 1900-2300
Sat 0000-0300
Sat 1100-1500
Sat 1900-2300
Sun 0000-0300
Sun 1100-1500
A1 89 80 86 80 79 83 77 73 70
A2 33 43 68 44 36 56 58 40 37
A3
A4 13 37 50 85 9 52 50 15 100
B10 52 70 78 52 61 91 52 39 70
B11 88 88 88 88 81 66 81 72 69
B2 83 66 72 90 103 90 76 86 86
B3 76 65 78 78 62 78 85 70 82
B4 71 63 90 57 73 78 67 71 69
B5 60 100 100 80 60 80 100 100 100
B6 93 93 93 80 75 80 85 90 85
B7 91 57 87 65 48 22 30 39 65
BC1 74 80 84 69 62 78 57 46 67
C1 81 83 80 75 73 70 67 71 68
C2 63 59 52 57 60 55 59 60 52
CB1 73 82 82 82 59 86 59 59 68
D1 48 48 53 45 47 71 49 53 69
D4 64 79 89 72 55 81 61 51 77
E1 29 47 58 55 50 41 77 50 67
F1 61 54 61 58 56 62 62 51 62
F2 81 80 87 77 71 74 74 69 85
F3 55 65 82 69 59 70 65 63 90
F4 74 72 87 74 51 61 108 82 51
F5 78 89 100 100 100 89 89 56 100
F6 57 86 86 57 57 43 86 71 100
G1 45 50 58 74 55 37 95 84 97
G2 2 17 27 23 12 24 71 27 38
H1
15
Westminster Citywide Parking Occupancy Surveys 2011 Executive Summary
1.11 Overview of survey findings
1.11.1 If the different types of parking regulation are considered, the peak periods of occupancy are;
� Resident spaces overnight during the week (when the majority of controls do not apply);
� Shared Use spaces on a weekday afternoon; when the additional visitor provision is at its greatest;
� Paid for spaces during the day on Sunday, when controls do not apply. � Single Yellow Lines also on the Sunday; and � Motorcycle spaces during the daytime in the week.
Resident Parking Spaces
1.11.2 Zones E and G show higher occupancy rates on Resident and White Badge Disabled spaces during the weekday compared with the overnight and the weekend periods. Elsewhere, the results indicate that high levels of localised parking stress exist amongst Resident parking spaces within the City Monday to Saturday (day and overnight). In the Weekday overnight period this exceeds 80% in 17 out of 26 parking Sub-zones. Demand on Sunday was less, with only three Sub-zones demonstrating occupancies over 80%.
Paid-for Parking spaces
1.11.3 Parking stress (exceeding 80%) was recorded at some Paid-for parking spaces, particularly outside the hours of parking control (e.g. Saturday and Sunday). The Paid-for spaces were well utilised throughout the City during weekday hours of control, over 70% occupancy on average for all zones. However, parking pressure was found in zones E & F at over 80% occupancy of this space. In zone F Shared Use spaces available to visitors also exceeded 80% full.
Shared Use Parking spaces
1.11.4 High levels of parking stress exist in the majority of zones B and F amongst Shared Use spaces in the weekday daytime, and also on occasion in other areas during certain periods (for example in zone G at the weekend). Outside of the weekday peak periods the Shared Use spaces are less well used, which may indicate that during the week there is increased demand from visitors.
Single Yellow lines
1.11.5 Parking at Single Yellow Lines increases significantly outside the hours of parking control, especially at the weekend, and most notably on Sundays, and is predominantly highly concentrated around popular retail and entertainment attractions. Visitors are found to park on Single Yellow Lines in these areas even when this is not really suitable for parking.
Visitor Parking estimates
1.11.6 The City attracts very large numbers of workers and visitors by car for commercial / business, leisure, shopping and entertainment purposes. The demand for parking space especially during the weekday daytime and evening, on Saturday evening, and on Sunday, is concentrated in the main retail and entertainment areas (Zones E, F and G).

16
Westminster Citywide Parking Occupancy Surveys 2011 Executive Summary
1.11.7 An estimate of visitor numbers indicates that during popular periods outside the hours of control this ranges from in the region of 7,000 (weekday evenings) to 12,000 vehicles (Sunday daytimes). However, this does not take account of those visitors who may also park at Resident spaces in locations where the controls cease at the same time as at other restrictions.
Motorcycle parking
1.11.8 Occupancy at Motorcycle spaces is low throughout the City, which indicates an unwillingness to pay or high take-up of free off-street provision.
1.12 Conclusions
1.12.1 In brief it is concluded that;
1.12.2 In a number of instances parking occupancy exceeds acceptable and convenient rates.
� The busiest periods of the day and week appear to be outside the current hours of parking control for most restriction types (during weekday evenings and especially Saturday and Sundays).
� Parking pressure exists in most of the city in the week, and on Saturday evenings, and on Sundays during the day, partly evidenced by the high use of yellow line parking.
� Occupancy rates at Paid-for spaces are high in the weekday throughout the City (especially in the more central and commercial areas). This implies motorists are comfortable using a cashless (card & mobile phone) form of paying.
� Irrespective of the increased number of spaces provided by WCC over the last few years, the percentage occupancy at Resident and Shared Use spaces in many cases remains above acceptable rates. Parking stress exists in both widespread and localised areas.
� Weekend parking occupancy (especially Sunday) now attracts as many (if not more) motorists looking for convenient parking to the City. However, there is less turnover due to free and unrestricted parking, possibly to the detriment of others looking for parking spaces.
� Charging for motorcycle parking appears to have deterred many from parking on-street.

Colin Buchanan20 Eastbourne TerraceLondon W2 6LGT 020 7053 1300E [email protected] colinbuchanan.com