weston 2006 (consolidated for sedar) - george weston … weston limited (“weston” or the...
TRANSCRIPT

George Weston Limited 2006 Annual Summary
George Weston Limited (“Weston” or the “Company”) is a Canadian public company founded in 1882 and through its operating subsidiaries constitutes one of North America’s largest food processing anddistribution groups. Weston has two reportable operating segments: Weston Foods and Loblaw CompaniesLimited (“Loblaw”). Weston Foods is primarily engaged in the baking and dairy industries within North America. Loblaw is Canada’s largest food distributor and a leading provider of general merchandise, drugstoreand financial products and services.
Weston seeks long term, stable growth in its operating segments through continuous capital investmentsupported by a strong balance sheet, thereby providing sustainable returns to its shareholders through a combination of common share price appreciation and dividends. In order to be successful in delivering long term value to shareholders and to fulfill its long term objectives of security and growth, Weston employsvarious operating strategies. Weston Foods concentrates on brand development, low operating costs and maintaining a broad customer base, with the objective of being the best provider of bakery solutions and fresh dairy products to its customers. Loblaw concentrates on food retailing, with the objective of providing Canadian consumers with the best in one-stop shopping for everyday household needs.
Weston is committed to creating value for its shareholders and participating along with its more than 155,000 employees in supporting the communities in which it operates.
Forward-Looking Statements This Annual Report, including the Annual Summary and the Financial Report, contains forward-looking statements which reflect management’s expectations and are contained in discussions regarding the Company’s objectives, plans, goals, aspirations, strategies, potential future growth, results of operations, performance and business prospects and opportunities. Forward-looking statements are typically, though not always, identified by words or phrases such as “anticipates”, “expects”, “believes”, “estimates”, “intends” and other similar expressions.
These forward-looking statements are not guarantees, but only predictions. Although the Company believes that these statements are based on information andassumptions which are current, reasonable and complete, these statements are necessarily subject to a number of factors that could cause actual results to varysignificantly from the estimates, projections and intentions. Such differences may be caused by factors which include, but are not limited to, changes in consumerspending, preferences and consumers’ nutritional and health related concerns, changes in the competitive environment, including changes in pricing and market strategiesof the Company or of its competitors and the entry of new competitors and expansion of current competitors, the availability and cost of raw materials and ingredients,fuels and utilities, the ability to realize anticipated cost savings and efficiencies, including those resulting from restructuring, inventory liquidation and other cost reductionand simplification initiatives, the ability to execute restructuring plans, implement strategies and introduce innovative products successfully and in a timely manner,changes in the markets for the inventory intended for liquidation and changes in the expected realizable value and costs associated with the liquidation, unanticipated,increased or decreased costs associated with the announced initiatives, including those related to compensation costs, the Company’s relationship with its employees,results of labour negotiations including the terms of future collective bargaining agreements, changes to the regulatory environment in which the Company operates now or in the future, the inherent uncertainty regarding the outcome of litigation or any dispute resolution initiative, changes in the Company’s tax liabilities, either throughchanges in tax laws or future assessments, performance of third-party service providers, public health events, the ability of the Company to attract and retain keyexecutives, the success rate of the Company in developing and introducing new products and entering new markets and supply and quality control issues with vendors.The calculation of the goodwill impairment charge described in this Annual Report involves the estimation of several variables, including but not limited to marketmultiples, projected future sales and earnings, capital investment, discount rates, terminal growth rates and the fair values of those assets and liabilities being valued. The Company cautions that this list of factors is not exhaustive.
The assumptions applied in making the forward-looking statements contained in this Annual Report include the following: economic conditions do not materially change from those expected, patterns of consumer spending and preferences are reasonably consistent with historical trends, no new significant competitors enter the Company’s market and neither the Company nor its existing competitors significantly increase their presence or change pricing or market strategies materially, the Company successfully offers new and innovative products and executes its strategies as planned, anticipated cost savings and efficiencies are realized as planned,continuing future restructuring activities are effectively executed in a timely manner, costs associated with the liquidation of inventory are not higher or lower than expected, the Company’s assumptions regarding average compensation costs and average years of service for employees affected by the simplification initiatives are materially correct, the Company does not significantly change its approach to its current restructuring activities, there is no material amount of excess inventoryin the Company’s supply chain, there are no material work stoppages and the performance of third-party service providers is in accordance with expectations.
These estimates and assumptions may change in the future due to uncertain competitive and economic market conditions or changes in business strategies. This list of factors are discussed in the Company’s materials filed with the Canadian securities regulatory authorities from time to time, including the Operating Risks and Risk Management and Financial Risks and Risk Management sections of the MD&A in the Financial Report.
Potential investors and other readers are urged to consider these factors carefully in evaluating these forward-looking statements and are cautioned not to place unduereliance on them. The forward-looking statements included in this Annual Report are made only as of the filing date of this Annual Report and the Company disclaims any obligation or intention to publicly update these forward-looking statements to reflect new information, future events or otherwise. In light of these risks, uncertaintiesand assumptions, the forward-looking events contained in these forward-looking statements may or may not occur. The Company cannot assure that projected results or events will be achieved.

Weston continues to focus ongrowth, innovation and flexibilitywithin a low cost operatingstructure in order to deliver superiorvalue. Although the past year hasbeen challenging, we believe thefuture holds much opportunity.Experience has taught us whatneeds to be done to strengthen ourleadership position. We know thatto be successful over the long term,we must deliver what our customersand consumers want, both todayand in the future.
Financial Highlights 2 Report to Shareholders 3 Weston Foods 6 Loblaw 10 Corporate Social Responsibility 14
Contributing to the Community 14 Corporate Governance 15 Corporate Directory 16 Shareholder and Corporate Information IBC
2 George Weston Limited 2006 Annual Summary
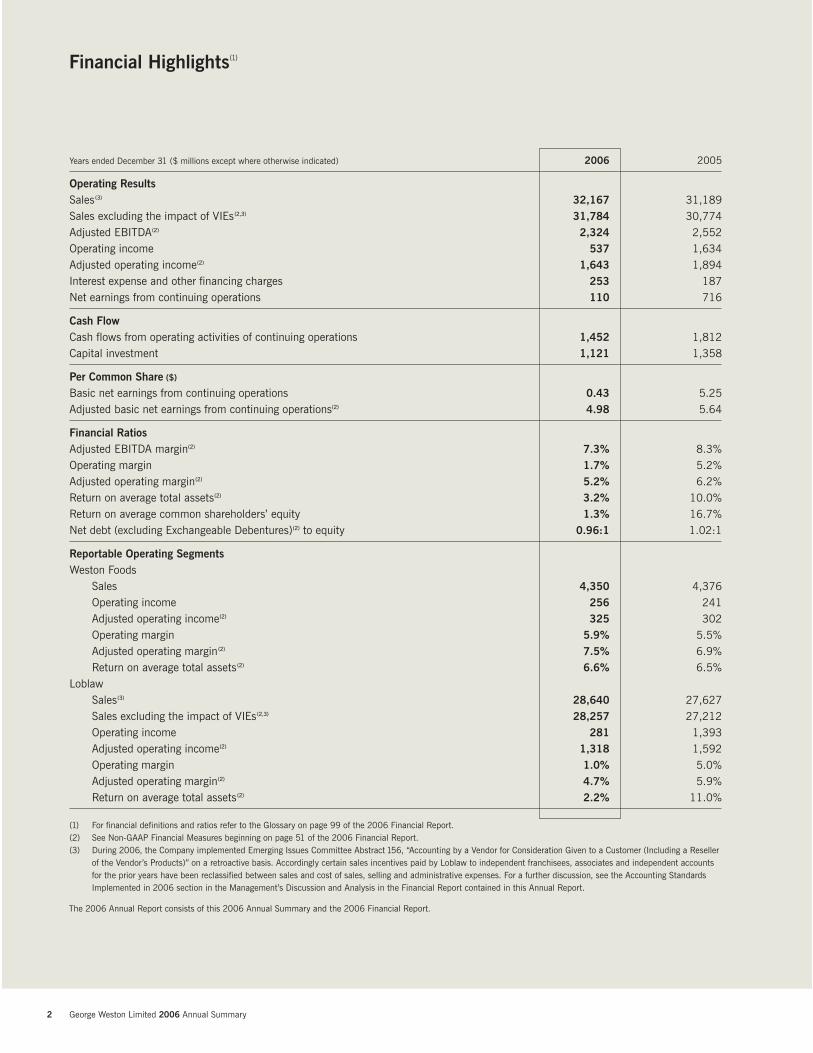
Years ended December 31 ($ millions except where otherwise indicated) 2006 2005
Operating ResultsSales (3) 32,167 31,189Sales excluding the impact of VIEs (2,3) 31,784 30,774Adjusted EBITDA(2) 2,324 2,552Operating income 537 1,634Adjusted operating income(2) 1,643 1,894Interest expense and other financing charges 253 187Net earnings from continuing operations 110 716
Cash FlowCash flows from operating activities of continuing operations 1,452 1,812Capital investment 1,121 1,358
Per Common Share ($)
Basic net earnings from continuing operations 0.43 5.25Adjusted basic net earnings from continuing operations(2) 4.98 5.64
Financial RatiosAdjusted EBITDA margin(2) 7.3% 8.3%Operating margin 1.7% 5.2%Adjusted operating margin(2) 5.2% 6.2%Return on average total assets(2) 3.2% 10.0%Return on average common shareholders’ equity 1.3% 16.7%Net debt (excluding Exchangeable Debentures)(2) to equity 0.96:1 1.02:1
Reportable Operating SegmentsWeston Foods
Sales 4,350 4,376Operating income 256 241Adjusted operating income(2) 325 302Operating margin 5.9% 5.5%Adjusted operating margin (2) 7.5% 6.9%Return on average total assets (2) 6.6% 6.5%
LoblawSales(3) 28,640 27,627Sales excluding the impact of VIEs (2,3) 28,257 27,212Operating income 281 1,393Adjusted operating income(2) 1,318 1,592Operating margin 1.0% 5.0%Adjusted operating margin(2) 4.7% 5.9%Return on average total assets (2) 2.2% 11.0%
(1) For financial definitions and ratios refer to the Glossary on page 99 of the 2006 Financial Report.(2) See Non-GAAP Financial Measures beginning on page 51 of the 2006 Financial Report.(3) During 2006, the Company implemented Emerging Issues Committee Abstract 156, “Accounting by a Vendor for Consideration Given to a Customer (Including a Reseller
of the Vendor’s Products)” on a retroactive basis. Accordingly certain sales incentives paid by Loblaw to independent franchisees, associates and independent accountsfor the prior years have been reclassified between sales and cost of sales, selling and administrative expenses. For a further discussion, see the Accounting StandardsImplemented in 2006 section in the Management’s Discussion and Analysis in the Financial Report contained in this Annual Report.
The 2006 Annual Report consists of this 2006 Annual Summary and the 2006 Financial Report.
Financial Highlights(1)
George Weston Limited 2006 Annual Summary 3
Report to Shareholders(1)
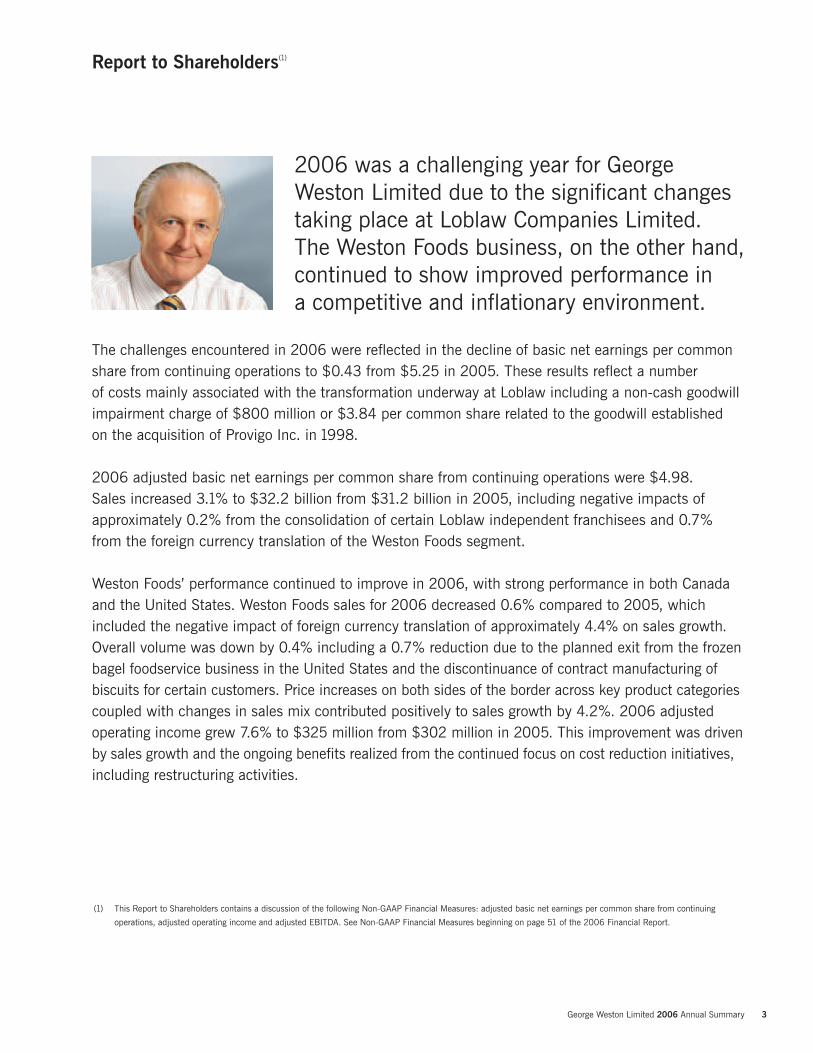
2006 was a challenging year for GeorgeWeston Limited due to the significant changestaking place at Loblaw Companies Limited. The Weston Foods business, on the other hand,continued to show improved performance in a competitive and inflationary environment.
(1) This Report to Shareholders contains a discussion of the following Non-GAAP Financial Measures: adjusted basic net earnings per common share from continuing
operations, adjusted operating income and adjusted EBITDA. See Non-GAAP Financial Measures beginning on page 51 of the 2006 Financial Report.
The challenges encountered in 2006 were reflected in the decline of basic net earnings per commonshare from continuing operations to $0.43 from $5.25 in 2005. These results reflect a number of costs mainly associated with the transformation underway at Loblaw including a non-cash goodwillimpairment charge of $800 million or $3.84 per common share related to the goodwill established on the acquisition of Provigo Inc. in 1998.
2006 adjusted basic net earnings per common share from continuing operations were $4.98. Sales increased 3.1% to $32.2 billion from $31.2 billion in 2005, including negative impacts ofapproximately 0.2% from the consolidation of certain Loblaw independent franchisees and 0.7%from the foreign currency translation of the Weston Foods segment.
Weston Foods’ performance continued to improve in 2006, with strong performance in both Canadaand the United States. Weston Foods sales for 2006 decreased 0.6% compared to 2005, whichincluded the negative impact of foreign currency translation of approximately 4.4% on sales growth.Overall volume was down by 0.4% including a 0.7% reduction due to the planned exit from the frozenbagel foodservice business in the United States and the discontinuance of contract manufacturing ofbiscuits for certain customers. Price increases on both sides of the border across key product categoriescoupled with changes in sales mix contributed positively to sales growth by 4.2%. 2006 adjustedoperating income grew 7.6% to $325 million from $302 million in 2005. This improvement was drivenby sales growth and the ongoing benefits realized from the continued focus on cost reduction initiatives,including restructuring activities.
4 George Weston Limited 2006 Annual Summary
Report to Shareholders(1)
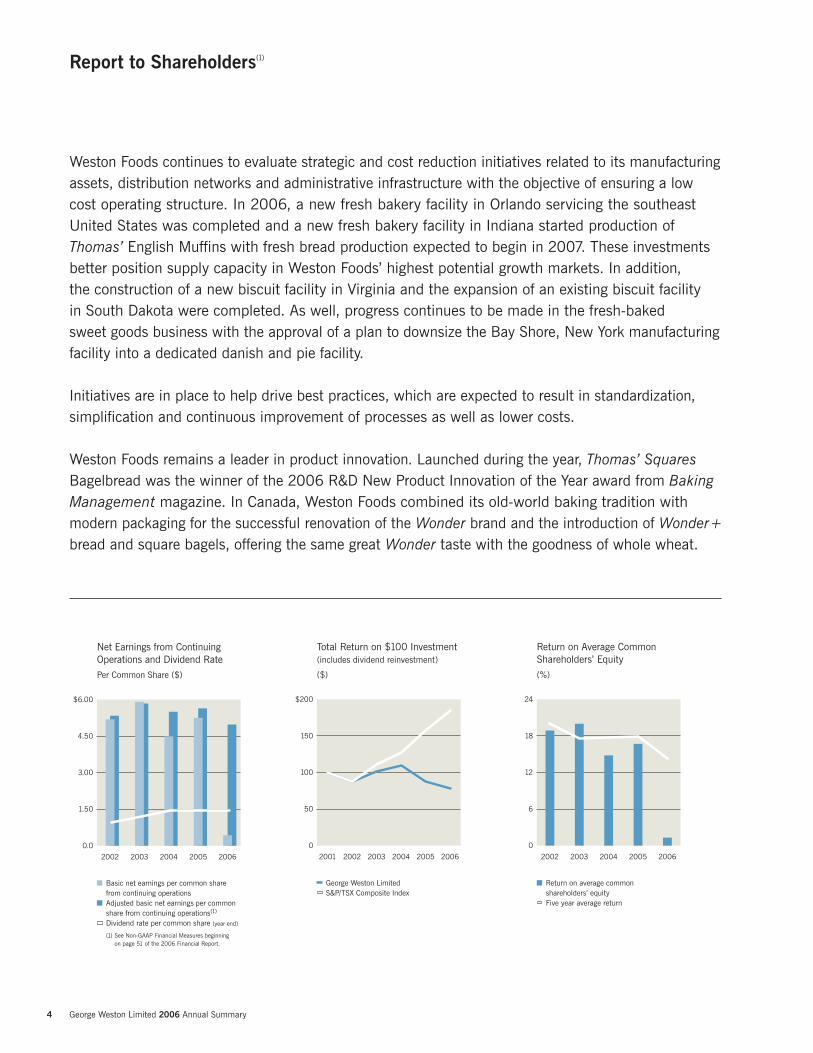
Basic net earnings per common sharefrom continuing operationsAdjusted basic net earnings per common share from continuing operations(1)
Dividend rate per common share (year end)
(1) See Non-GAAP Financial Measures beginning on page 51 of the 2006 Financial Report.
Net Earnings from Continuing Operations and Dividend Rate
Per Common Share ($)
200620052004200320020.0
1.50
3.00
4.50
$6.00
0
50
100
150
$200
Total Return on $100 Investment(includes dividend reinvestment)
($)
George Weston LimitedS&P/TSX Composite Index
200620052004200320022001 200620052004200320020
6
12
18
24
Return on average commonshareholders’ equityFive year average return
Return on Average CommonShareholders’ Equity
(%)
Weston Foods continues to evaluate strategic and cost reduction initiatives related to its manufacturingassets, distribution networks and administrative infrastructure with the objective of ensuring a lowcost operating structure. In 2006, a new fresh bakery facility in Orlando servicing the southeastUnited States was completed and a new fresh bakery facility in Indiana started production ofThomas’ English Muffins with fresh bread production expected to begin in 2007. These investmentsbetter position supply capacity in Weston Foods’ highest potential growth markets. In addition, the construction of a new biscuit facility in Virginia and the expansion of an existing biscuit facility in South Dakota were completed. As well, progress continues to be made in the fresh-baked sweet goods business with the approval of a plan to downsize the Bay Shore, New York manufacturingfacility into a dedicated danish and pie facility.
Initiatives are in place to help drive best practices, which are expected to result in standardization,simplification and continuous improvement of processes as well as lower costs.
Weston Foods remains a leader in product innovation. Launched during the year, Thomas’ SquaresBagelbread was the winner of the 2006 R&D New Product Innovation of the Year award from BakingManagement magazine. In Canada, Weston Foods combined its old-world baking tradition withmodern packaging for the successful renovation of the Wonder brand and the introduction of Wonder+bread and square bagels, offering the same great Wonder taste with the goodness of whole wheat.
George Weston Limited 2006 Annual Summary 5
W. Galen WestonChairman and President
Neilson’s® The Ultimate Chocolate Milk, with its unique “freshness bottle”, was also launchedsuccessfully during the year. These introductions were well received by consumers, delivered strongsales growth and helped Weston Foods gain market share.
Late 2006 marked the beginning of a period of significant change for Loblaw, including theappointment of a new team of senior executives. Loblaw’s own structure, with its history of mergersand acquisitions, had led over time to an organization more complex and less effective than it should have been. Based on the results of a 100 Day Review undertaken by management, certain changes were made to focus on the strategic long term objective of making Loblaw the best again.Loblaw is simplifying its organization by redesigning processes and structures to ensure that thebusiness becomes more efficient and agile. By concentrating on its strengths of great brands, greatstores and great people, Loblaw’s goal is to enhance value for all consumers and shareholders.Loblaw’s “Formula for Growth” defines its priorities while the 100 Day Review provides the roadmapfor achieving them.
As disclosed in the Loblaw Companies Limited Annual Report, sales for 2006 were $28.6 billioncompared to $27.6 billion in 2005, representing an improvement of 3.7%. Adjusted operating incomefor 2006 was $1.3 billion compared to $1.6 billion in 2005. Excluding the impact of necessary short term costs associated with one of the largest transformations in Canadian retail history, Loblawearned $1.9 billion in adjusted EBITDA.
While Weston Foods has been performing well, Loblaw continues to work through its transformationalchallenges. Loblaw enters 2007 with a new leadership team, a resolve to restore profitability and a plan for doing so. This plan, built on the three pillars of “Simplify, Innovate, Grow”, has one goal: to “Make Loblaw the Best Again”. Given the strength of Loblaw’s new team under the capableleadership of Galen G. Weston and their exciting new plans, I am confident both businesses are well positioned for the future. On behalf of the Board of Directors and shareholders, I thank our loyal customers for their support and our more than 155,000 employees for their dedication and commitment, particularly during these challenging times.
6 George Weston Limited 2006 Annual Summary
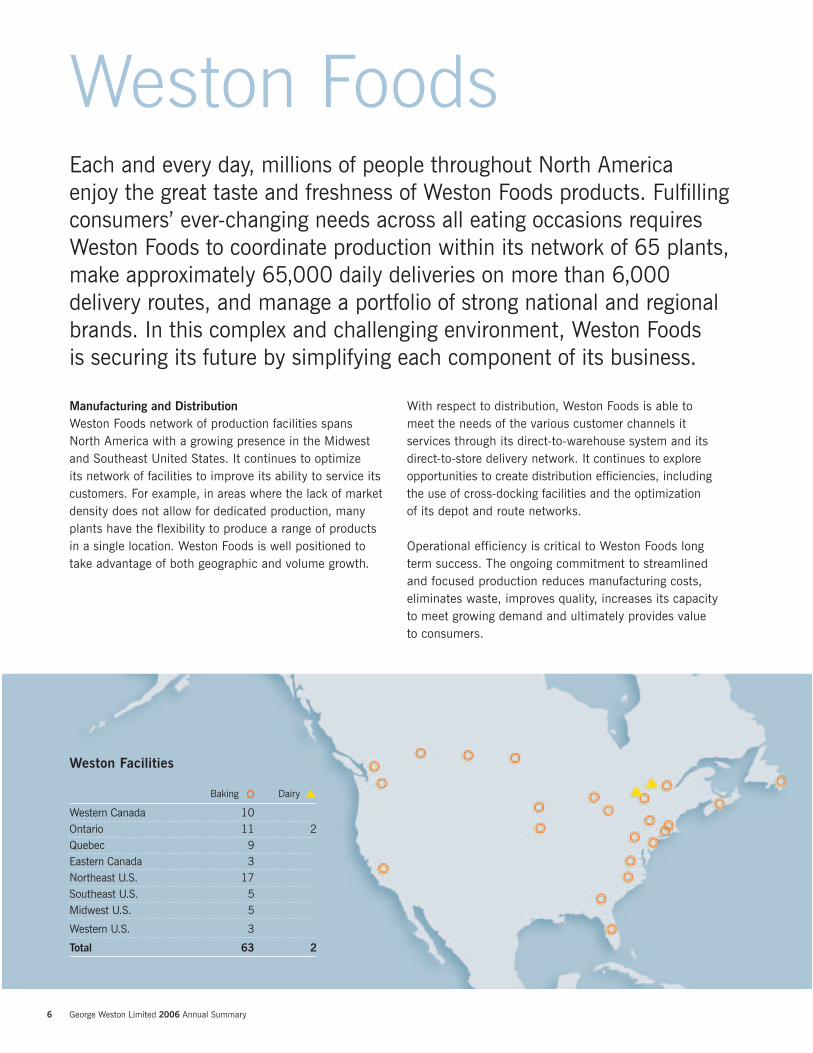
Baking Dairy
Western Canada 10Ontario 11 2Quebec 9Eastern Canada 3Northeast U.S. 17Southeast U.S. 5Midwest U.S. 5
Western U.S. 3
Total 63 2
Weston Facilities
Each and every day, millions of people throughout North America enjoy the great taste and freshness of Weston Foods products. Fulfillingconsumers’ ever-changing needs across all eating occasions requiresWeston Foods to coordinate production within its network of 65 plants,make approximately 65,000 daily deliveries on more than 6,000delivery routes, and manage a portfolio of strong national and regionalbrands. In this complex and challenging environment, Weston Foods is securing its future by simplifying each component of its business.
Manufacturing and DistributionWeston Foods network of production facilities spansNorth America with a growing presence in the Midwestand Southeast United States. It continues to optimize its network of facilities to improve its ability to service itscustomers. For example, in areas where the lack of marketdensity does not allow for dedicated production, manyplants have the flexibility to produce a range of productsin a single location. Weston Foods is well positioned totake advantage of both geographic and volume growth.
With respect to distribution, Weston Foods is able tomeet the needs of the various customer channels itservices through its direct-to-warehouse system and itsdirect-to-store delivery network. It continues to exploreopportunities to create distribution efficiencies, includingthe use of cross-docking facilities and the optimization of its depot and route networks.
Operational efficiency is critical to Weston Foods longterm success. The ongoing commitment to streamlinedand focused production reduces manufacturing costs,eliminates waste, improves quality, increases its capacityto meet growing demand and ultimately provides value to consumers.
Weston Foods
George Weston Limited 2006 Annual Summary 7
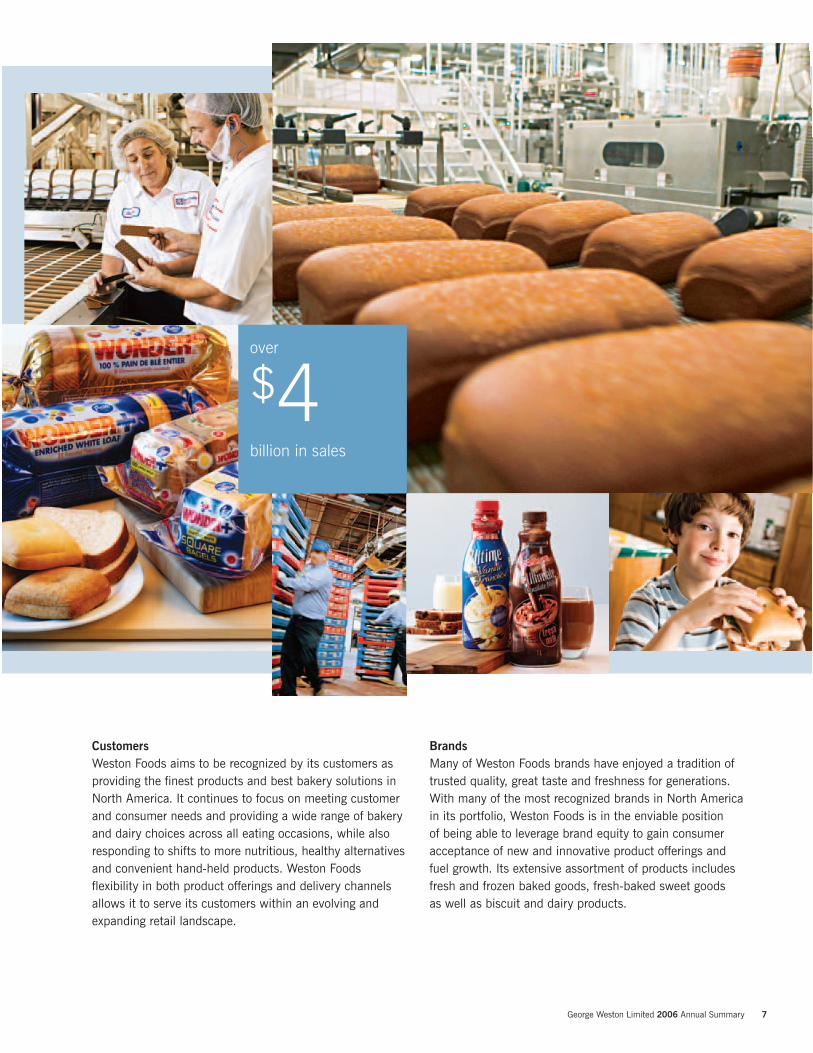
CustomersWeston Foods aims to be recognized by its customers asproviding the finest products and best bakery solutions inNorth America. It continues to focus on meeting customerand consumer needs and providing a wide range of bakeryand dairy choices across all eating occasions, while alsoresponding to shifts to more nutritious, healthy alternativesand convenient hand-held products. Weston Foodsflexibility in both product offerings and delivery channelsallows it to serve its customers within an evolving andexpanding retail landscape.
BrandsMany of Weston Foods brands have enjoyed a tradition oftrusted quality, great taste and freshness for generations.With many of the most recognized brands in North Americain its portfolio, Weston Foods is in the enviable position of being able to leverage brand equity to gain consumeracceptance of new and innovative product offerings andfuel growth. Its extensive assortment of products includesfresh and frozen baked goods, fresh-baked sweet goods as well as biscuit and dairy products.
over
$4billion in sales
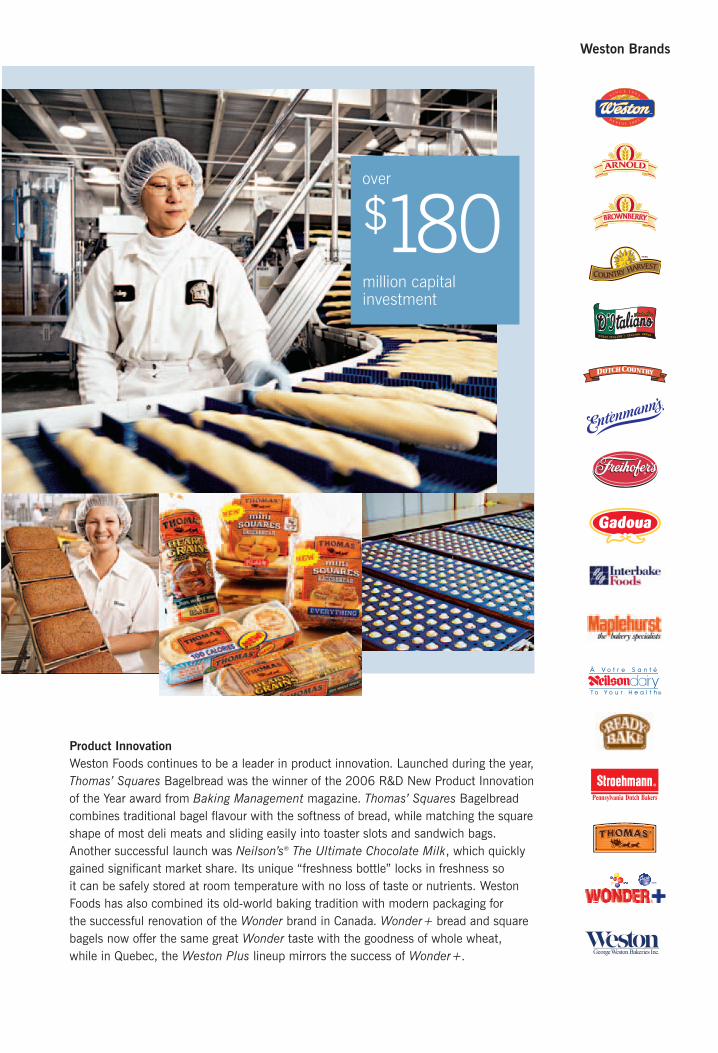
Weston Brands
®
®
Product InnovationWeston Foods continues to be a leader in product innovation. Launched during the year,Thomas’ Squares Bagelbread was the winner of the 2006 R&D New Product Innovationof the Year award from Baking Management magazine. Thomas’ Squares Bagelbreadcombines traditional bagel flavour with the softness of bread, while matching the squareshape of most deli meats and sliding easily into toaster slots and sandwich bags.Another successful launch was Neilson’s® The Ultimate Chocolate Milk, which quicklygained significant market share. Its unique “freshness bottle” locks in freshness so it can be safely stored at room temperature with no loss of taste or nutrients. WestonFoods has also combined its old-world baking tradition with modern packaging for the successful renovation of the Wonder brand in Canada. Wonder+ bread and squarebagels now offer the same great Wonder taste with the goodness of whole wheat, while in Quebec, the Weston Plus lineup mirrors the success of Wonder+.
over
$180million capitalinvestment
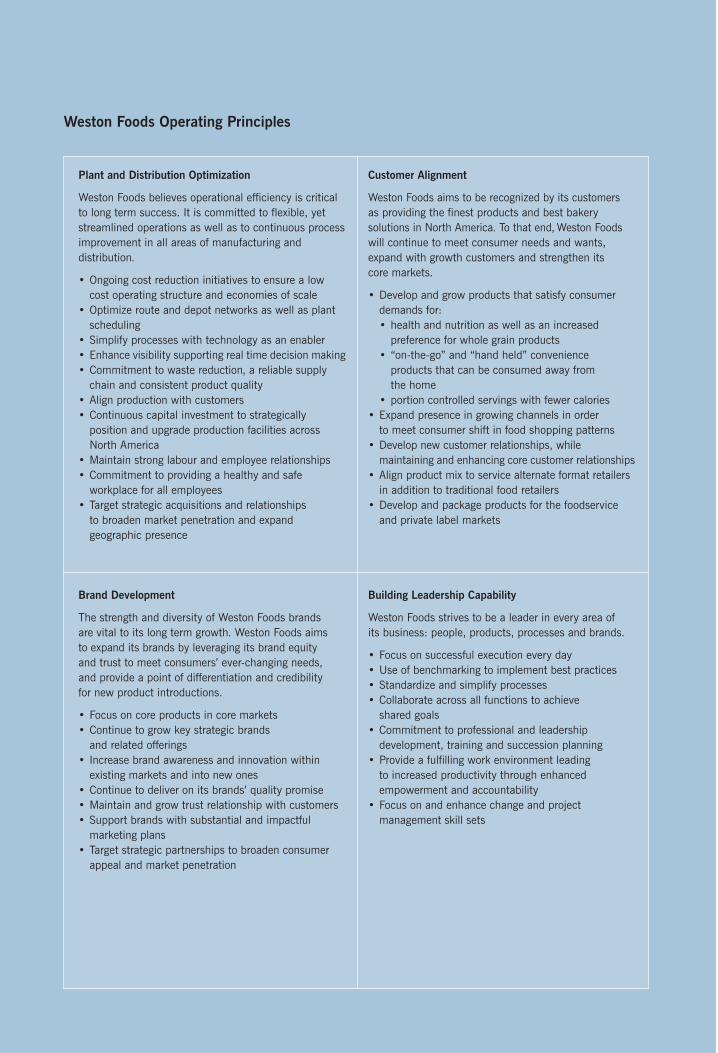
Weston Foods Operating Principles
Plant and Distribution Optimization
Weston Foods believes operational efficiency is criticalto long term success. It is committed to flexible, yetstreamlined operations as well as to continuous processimprovement in all areas of manufacturing anddistribution.
• Ongoing cost reduction initiatives to ensure a lowcost operating structure and economies of scale
• Optimize route and depot networks as well as plantscheduling
• Simplify processes with technology as an enabler• Enhance visibility supporting real time decision making• Commitment to waste reduction, a reliable supply
chain and consistent product quality• Align production with customers • Continuous capital investment to strategically
position and upgrade production facilities acrossNorth America
• Maintain strong labour and employee relationships• Commitment to providing a healthy and safe
workplace for all employees• Target strategic acquisitions and relationships
to broaden market penetration and expandgeographic presence
Brand Development
The strength and diversity of Weston Foods brands are vital to its long term growth. Weston Foods aims to expand its brands by leveraging its brand equity and trust to meet consumers’ ever-changing needs, and provide a point of differentiation and credibility for new product introductions.
• Focus on core products in core markets• Continue to grow key strategic brands
and related offerings• Increase brand awareness and innovation within
existing markets and into new ones• Continue to deliver on its brands’ quality promise• Maintain and grow trust relationship with customers• Support brands with substantial and impactful
marketing plans• Target strategic partnerships to broaden consumer
appeal and market penetration
Customer Alignment
Weston Foods aims to be recognized by its customers as providing the finest products and best bakerysolutions in North America. To that end, Weston Foodswill continue to meet consumer needs and wants,expand with growth customers and strengthen its core markets.
• Develop and grow products that satisfy consumerdemands for:• health and nutrition as well as an increased
preference for whole grain products• “on-the-go” and “hand held” convenience
products that can be consumed away from the home
• portion controlled servings with fewer calories• Expand presence in growing channels in order
to meet consumer shift in food shopping patterns• Develop new customer relationships, while
maintaining and enhancing core customer relationships• Align product mix to service alternate format retailers
in addition to traditional food retailers• Develop and package products for the foodservice
and private label markets
Building Leadership Capability
Weston Foods strives to be a leader in every area of its business: people, products, processes and brands.
• Focus on successful execution every day• Use of benchmarking to implement best practices• Standardize and simplify processes• Collaborate across all functions to achieve
shared goals• Commitment to professional and leadership
development, training and succession planning• Provide a fulfilling work environment leading
to increased productivity through enhancedempowerment and accountability
• Focus on and enhance change and projectmanagement skill sets
10 George Weston Limited 2006 Annual Summary
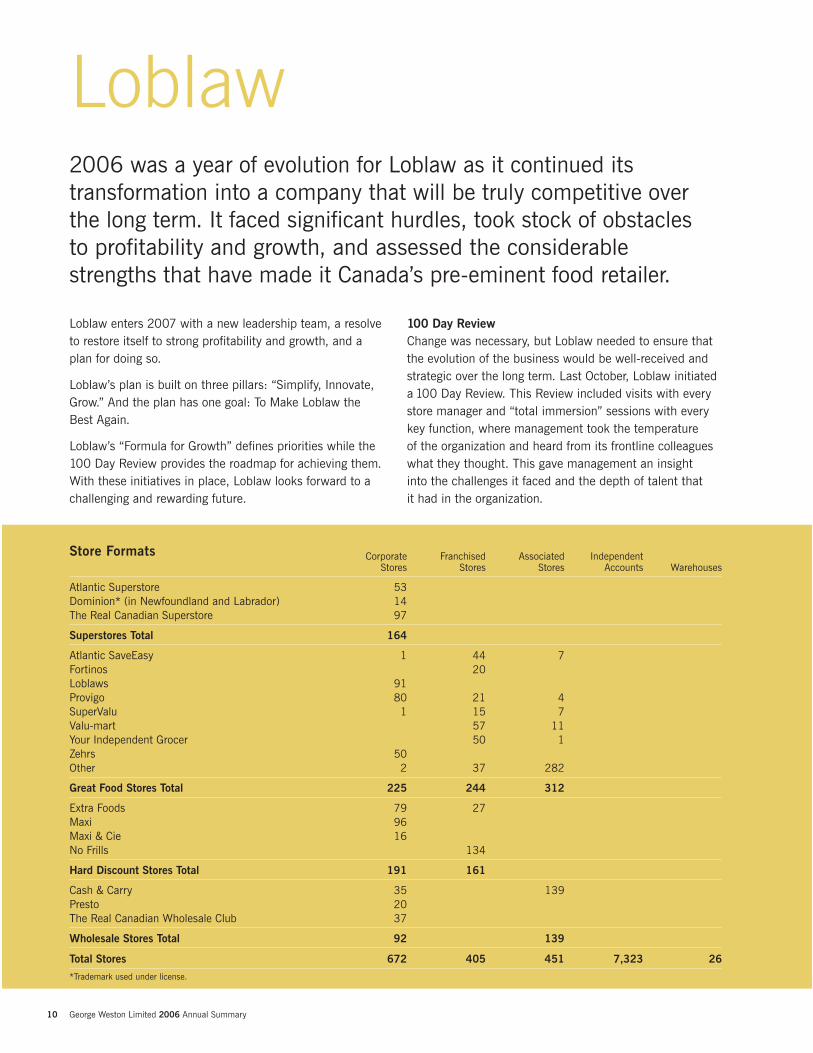
Corporate Franchised Associated Independent Stores Stores Stores Accounts Warehouses
Atlantic Superstore 53Dominion* (in Newfoundland and Labrador) 14The Real Canadian Superstore 97
Superstores Total 164
Atlantic SaveEasy 1 44 7Fortinos 20Loblaws 91Provigo 80 21 4SuperValu 1 15 7Valu-mart 57 11Your Independent Grocer 50 1Zehrs 50Other 2 37 282
Great Food Stores Total 225 244 312
Extra Foods 79 27Maxi 96Maxi & Cie 16No Frills 134
Hard Discount Stores Total 191 161
Cash & Carry 35 139Presto 20The Real Canadian Wholesale Club 37
Wholesale Stores Total 92 139
Total Stores 672 405 451 7,323 26
*Trademark used under license.
Loblaw
Store Formats
2006 was a year of evolution for Loblaw as it continued itstransformation into a company that will be truly competitive overthe long term. It faced significant hurdles, took stock of obstacles to profitability and growth, and assessed the considerable strengths that have made it Canada’s pre-eminent food retailer.
Loblaw enters 2007 with a new leadership team, a resolveto restore itself to strong profitability and growth, and aplan for doing so.
Loblaw’s plan is built on three pillars: “Simplify, Innovate,Grow.” And the plan has one goal: To Make Loblaw theBest Again.
Loblaw’s “Formula for Growth” defines priorities while the100 Day Review provides the roadmap for achieving them.With these initiatives in place, Loblaw looks forward to achallenging and rewarding future.
100 Day ReviewChange was necessary, but Loblaw needed to ensure thatthe evolution of the business would be well-received andstrategic over the long term. Last October, Loblaw initiateda 100 Day Review. This Review included visits with everystore manager and “total immersion” sessions with everykey function, where management took the temperature of the organization and heard from its frontline colleagueswhat they thought. This gave management an insight into the challenges it faced and the depth of talent that it had in the organization.
George Weston Limited 2006 Annual Summary 11
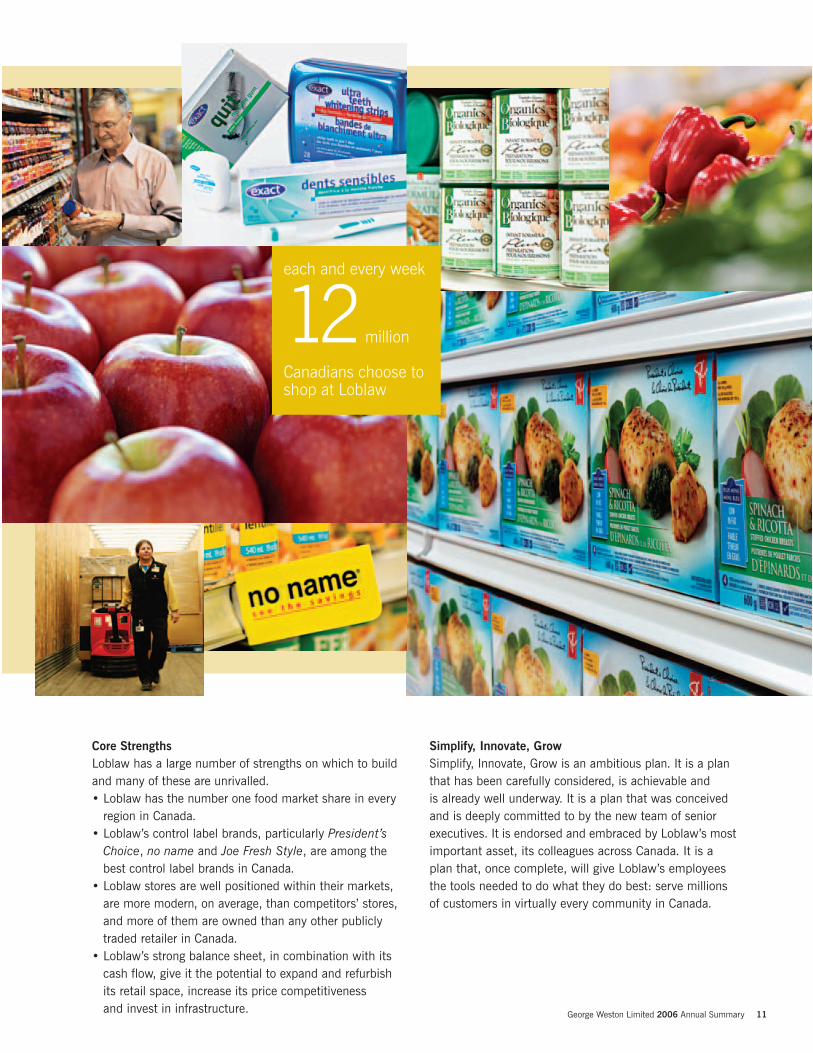
Core StrengthsLoblaw has a large number of strengths on which to buildand many of these are unrivalled. • Loblaw has the number one food market share in every
region in Canada.• Loblaw’s control label brands, particularly President’s
Choice, no name and Joe Fresh Style, are among thebest control label brands in Canada.
• Loblaw stores are well positioned within their markets,are more modern, on average, than competitors’ stores,and more of them are owned than any other publiclytraded retailer in Canada.
• Loblaw’s strong balance sheet, in combination with itscash flow, give it the potential to expand and refurbishits retail space, increase its price competitiveness and invest in infrastructure.
Simplify, Innovate, GrowSimplify, Innovate, Grow is an ambitious plan. It is a planthat has been carefully considered, is achievable and is already well underway. It is a plan that was conceivedand is deeply committed to by the new team of seniorexecutives. It is endorsed and embraced by Loblaw’s mostimportant asset, its colleagues across Canada. It is a plan that, once complete, will give Loblaw’s employees the tools needed to do what they do best: serve millions of customers in virtually every community in Canada.
each and every week
12Canadians choose toshop at Loblaw
million
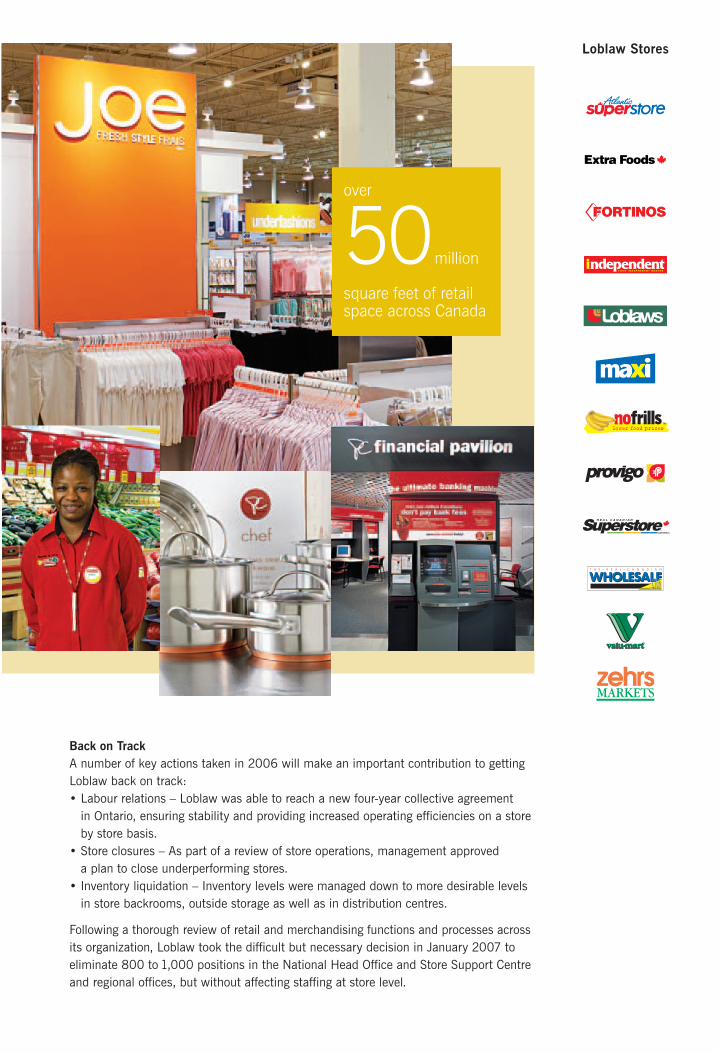
Loblaw Stores
MD
Back on TrackA number of key actions taken in 2006 will make an important contribution to gettingLoblaw back on track:• Labour relations – Loblaw was able to reach a new four-year collective agreement
in Ontario, ensuring stability and providing increased operating efficiencies on a storeby store basis.
• Store closures – As part of a review of store operations, management approved a plan to close underperforming stores.
• Inventory liquidation – Inventory levels were managed down to more desirable levelsin store backrooms, outside storage as well as in distribution centres.
Following a thorough review of retail and merchandising functions and processes acrossits organization, Loblaw took the difficult but necessary decision in January 2007 toeliminate 800 to 1,000 positions in the National Head Office and Store Support Centreand regional offices, but without affecting staffing at store level.
over
50square feet of retailspace across Canada
million
Simplify
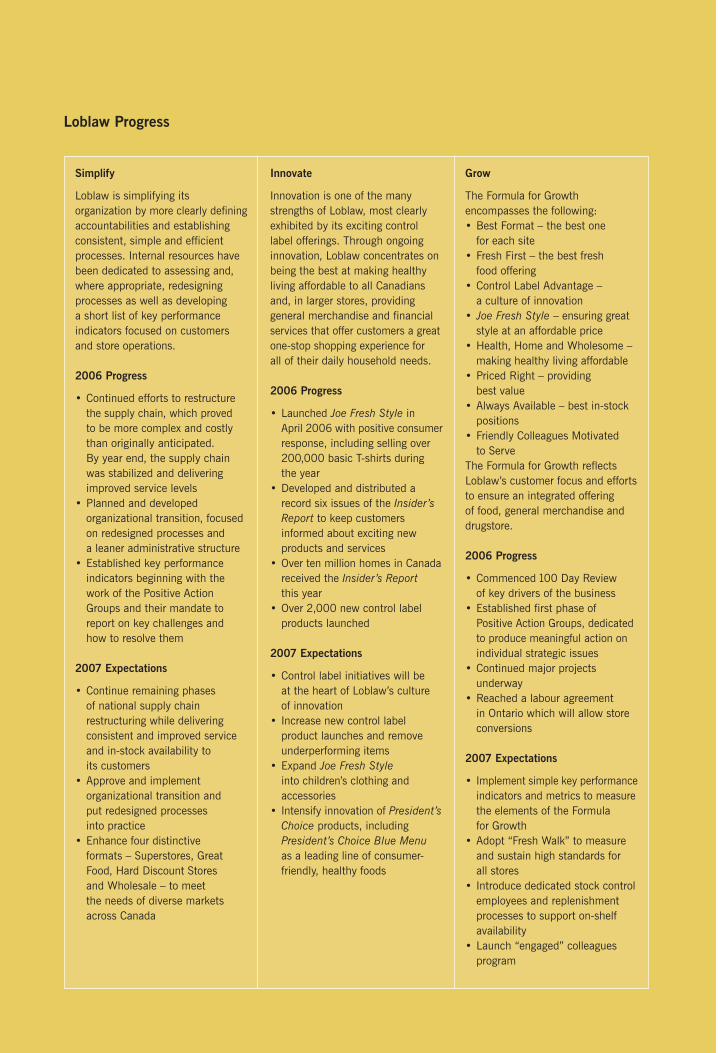
Loblaw is simplifying itsorganization by more clearly definingaccountabilities and establishingconsistent, simple and efficientprocesses. Internal resources havebeen dedicated to assessing and,where appropriate, redesigningprocesses as well as developing a short list of key performanceindicators focused on customersand store operations.
2006 Progress
• Continued efforts to restructurethe supply chain, which proved to be more complex and costlythan originally anticipated. By year end, the supply chainwas stabilized and deliveringimproved service levels
• Planned and developedorganizational transition, focusedon redesigned processes and a leaner administrative structure
• Established key performanceindicators beginning with thework of the Positive ActionGroups and their mandate toreport on key challenges and how to resolve them
2007 Expectations
• Continue remaining phases of national supply chainrestructuring while deliveringconsistent and improved serviceand in-stock availability to its customers
• Approve and implementorganizational transition and put redesigned processes into practice
• Enhance four distinctive formats – Superstores, GreatFood, Hard Discount Stores and Wholesale – to meet the needs of diverse marketsacross Canada
Innovate
Innovation is one of the manystrengths of Loblaw, most clearlyexhibited by its exciting controllabel offerings. Through ongoinginnovation, Loblaw concentrates onbeing the best at making healthyliving affordable to all Canadiansand, in larger stores, providinggeneral merchandise and financialservices that offer customers a greatone-stop shopping experience for all of their daily household needs.
2006 Progress
• Launched Joe Fresh Style in April 2006 with positive consumerresponse, including selling over200,000 basic T-shirts duringthe year
• Developed and distributed arecord six issues of the Insider’sReport to keep customersinformed about exciting newproducts and services
• Over ten million homes in Canadareceived the Insider’s Report this year
• Over 2,000 new control labelproducts launched
2007 Expectations
• Control label initiatives will be at the heart of Loblaw’s culture of innovation
• Increase new control labelproduct launches and removeunderperforming items
• Expand Joe Fresh Styleinto children’s clothing andaccessories
• Intensify innovation of President’sChoice products, includingPresident’s Choice Blue Menuas a leading line of consumer-friendly, healthy foods
Grow
The Formula for Growthencompasses the following: • Best Format – the best one
for each site• Fresh First – the best fresh
food offering• Control Label Advantage –
a culture of innovation• Joe Fresh Style – ensuring great
style at an affordable price• Health, Home and Wholesome –
making healthy living affordable• Priced Right – providing
best value• Always Available – best in-stock
positions• Friendly Colleagues Motivated
to Serve The Formula for Growth reflects Loblaw’s customer focus and effortsto ensure an integrated offering of food, general merchandise anddrugstore.
2006 Progress
• Commenced 100 Day Review of key drivers of the business
• Established first phase of Positive Action Groups, dedicatedto produce meaningful action onindividual strategic issues
• Continued major projectsunderway
• Reached a labour agreement in Ontario which will allow storeconversions
2007 Expectations
• Implement simple key performanceindicators and metrics to measurethe elements of the Formula for Growth
• Adopt “Fresh Walk” to measureand sustain high standards for all stores
• Introduce dedicated stock controlemployees and replenishmentprocesses to support on-shelfavailability
• Launch “engaged” colleaguesprogram
Loblaw Progress

14 George Weston Limited 2006 Annual Summary
Corporate Social Responsibility
Contributing to the Community
Consistent with the heritage and values of the Company, the grant makingprograms of George Weston Limited and its subsidiaries are focused onimproving the quality of life in the communities where its employees live and work.
As a member of the ImagineCaring Company program,Weston is committed tocontributing a minimum of1% of pre-tax profits tocharitable organizations in Canada and encouraging employee engagementwithin their communities.
Here are just a few of the ways that George Weston Limited and its affiliatessupport communities and people:
• George Weston Limited: Strategic donations this year have ranged fromfunding a community centre in the outskirts of Toronto that helps recentimmigrants to assimilate into their new country to providing assistance tooverburdened family caregivers caring for loved ones at home.
• Loblaw Companies Limited andPresident’s Choice Children’sCharity: This charity wasestablished to assist physicallyand developmentally challengedchildren and their families. To date it has raised in excess of $25 million and has helped over 4,250 Canadian families by removing some of the obstacles that make everyday living difficult.
• The W. Garfield Weston Foundation: A Canadian charitable foundationassociated with the Company, which grants in the fields of education andenvironment. In recent years, this has included support for the OntarioScience Centre in promoting current science, emerging technology and theissues underlying new discoveries through KidSpark and the Weston FamilyInnovation Centre.
George Weston Limited and its subsidiaries are committed to responsiblecorporate citizenship. This includes providing a safe workplace for employees,contributing to its local communities, respecting the environment, promotingfood health and safety, and offering products that provide meaningful choicesto consumers. Our commitment to the environment is demonstrated throughmeasures in such areas as environmental awareness management, energyefficiency, waste management and packaging. These commitments are instilledthroughout the organization and are overseen by the Environmental, Healthand Safety Committees of the George Weston Limited and Loblaw CompaniesLimited Boards of Directors and by the full Boards themselves.
The Committees review and monitor policies, procedures, practices andcompliance in these fields.
Initiatives in these areas are undertaken through a combination of fourapproaches – by the Company itself, in conjunction with other industrymembers, as part of industry-government partnerships, and in directcooperation with governments.
For more information on Corporate Social Responsibility, please visit theCompany’s website, www.weston.ca.
Ontario Science Centre – KidSpark, a learn-through-play space designedto ignite creativity and spark innovation skills in children.
George Weston Limited Group Donations by Category
Arts & Culture Heritage 1%
Conservation 1%
Miscellaneous
CommunityHealth Care/Medical Research
Education 3%
20%
10%
65%
weston.ca
weston.ca
George Weston Limited 2006 Annual Summary 15
Corporate Governance
Summary of Corporate Governance Practices
The Company’s Board of Directors (the “Board”) and management of GeorgeWeston Limited (the “Company”) believe that sound corporate governancepractices will contribute to effective management. The Company seeks to attainhigh standards of corporate governance and when appropriate, adopts “bestpractices” in developing its approach to corporate governance. The Company’sapproach to corporate governance is consistent with National Policy 58-201 –Corporate Governance Guidelines (the “Guidelines”). The Governance, HumanResource, Nominating and Compensation Committee (“Governance Committee”)regularly reviews its corporate governance practices and considers any changesnecessary to maintain the Company’s high standards of corporate governance.
Director IndependenceThe Board is comprised of a majority of independent directors. The GovernanceCommittee has reviewed each existing and proposed director’s factualcircumstances and relationships with the Company to determine whether he or she is independent within the meaning of the Guidelines. The Guidelinesprovide that a director is independent if he or she has no material relationshipwith the Company or its affiliates that would reasonably be expected tointerfere with the director’s independent judgment.
Board LeadershipMr. W. Galen Weston is Chairman of the Board. Mr. Weston has a significantcommon interest with other shareholders with respect to value creation, the well being of the Company, and the performance of its publicly listed securities.The Board has established a position description for the Chairman of the Board.The Board has appointed an independent director, Peter B.M. Eby, to serve as lead director and has developed a position description for the role.
Board Responsibilities and DutiesThe Board, directly and through its Committees, supervises the managementof the business and affairs of the Company with the goal of enhancing long term shareholder value. The Board reviews the Company’s direction, assignsresponsibility to management for achievement of the direction, develops and approves major policy decisions, delegates to management the authority andresponsibility for day-to-day affairs and reviews management’s performanceand effectiveness. The Board’s expectations of management are communicatedto management directly and through Committees of the Board.
The Board approves the Company’s corporate goals and objectives, operatingbudgets and strategies, which take into account the opportunities and risks of the business. Members of the Board attend an annual all-day strategysession with management to discuss and review the Company’s strategic plansand opportunities. In addition, management’s strengths and weaknesses arediscussed. Through the Audit Committee, the Board oversees the Company’srisk management framework and assesses and evaluates the integrity of theCompany’s internal controls and management information systems. Throughthe Governance Committee, the Board oversees succession planning andcompensation for senior management as well as members of the Board.
Ethical Business ConductsThe Company’s Code of Business Conduct (the “Code”) sets out the Company’slong-standing commitment of requiring adherence to high standards of ethicalconduct and business practices. The Code is reviewed annually to ensure it is current and reflects best practice in the area of ethical business conduct.Directors, officers and employees of the Company are required to comply with the Code and must acknowledge their commitment to abide by the Codeon a periodic basis. The Code is available on the Company’s website,www.weston.ca.
The Company has established an Ethics and Conduct Committee whichreviews all material breaches of the Code. The Ethics and Conduct Committeealso oversees implementation of the Code, educating employees regarding the Code, and reviews the Code annually to determine if it requires revision.
The Company encourages the reporting of unethical behaviour and hasestablished an Ethics Response Line, a toll-free number that any employee or director may use to report conduct which he or she feels violates the Code or otherwise constitutes fraud or unethical conduct. A fraud reportingprotocol has also been implemented to ensure that fraud is reported to senior management in a timely manner. In addition, the Audit Committee hasendorsed procedures for the receipt, retention and handling of complaintsregarding accounting, internal control or auditing matters. These proceduresare available on the Company’s website, www.weston.ca.
Board CommitteesThere are five Committees of the Board: Audit; Governance, Human Resource,Nominating and Compensation; Pension and Benefits; Environmental, Healthand Safety; and Executive.
The Audit Committee is comprised solely of independent directors. AllCommittees are comprised solely of non-management directors, in each case, with a majority of members being independent directors except for the Executive Committee. The Board believes that the composition of its Committees (with the exception of the Executive Committee) allows them to operate independently from management such that shareholders’interests are protected.
Each Committee has a formal mandate and a position description for the Chair established by the Board. Both the mandate and position description are reviewed annually. Copies of the Committees’ mandates are available on the Company’s website, www.weston.ca.
Other Corporate Governance Matters
Disclosure PolicyThe Board has reviewed and adopted a corporate Disclosure Policy to deal with the timely dissemination of all material information. A copy of theDisclosure Policy is available on the Company’s website, www.weston.ca. The Disclosure Policy, which is reviewed annually, establishes consistentguidance for determining what information is material and how it is to bedisclosed to avoid selective disclosure and to ensure wide dissemination. The Board, directly and through its Committees, reviews and approves thecontents of major disclosure documents, including unaudited interim andaudited annual consolidated financial statements, Management’s Discussionand Analysis, the Annual Information Form and the Management ProxyCircular. The Company seeks to communicate to its shareholders throughthese documents as well as by means of news releases, its website andinvestor relations meetings.
Disclosure CommitteeA Disclosure Committee comprised of senior management of the Companyoversees the Company’s disclosure process as outlined in the DisclosurePolicy. The Disclosure Committee’s mandate includes ensuring that effectivedisclosure controls and procedures are in place to allow the Company to satisfyall of its continuous disclosure obligations including certification requirements.The Disclosure Committee is also responsible for ensuring that the policies andprocedures contained in the Company’s Disclosure Policy are in compliance with regulatory requirements.
Additional InformationFor more information on corporate governance, please visit the Company’swebsite, www.weston.ca.
weston.ca
16 George Weston Limited 2006 Annual Summary
W. Galen Weston, O.C., B.A., LL.D. (1*)
Chairman and President of the Corporation; former Chairman, Loblaw Companies Limited;Chairman, Holt, Renfrew & Co., Limited, BrownThomas Group Limited and Selfridges & Co. Ltd.;President, The W. Garfield Weston Foundation;Director, Associated British Foods plc; Member,Advisory Board of Columbia University.
Allan L. LeightonDeputy Chairman of the Corporation, LoblawCompanies Limited and Selfridges & Co. Ltd.;Chairman, Royal Mail Group; former President andChief Executive Officer, Wal-Mart Europe; formerChief Executive, Asda Stores Ltd.; Director, Loblaw Companies Limited, BHS Ltd., BskyB plc,Selfridges & Co. Ltd., Holt, Renfrew & Co., Limitedand Brown Thomas Group Limited.
A. Charles Baillie, O.C., B.A., M.B.A., LL.D. (2*,3)
Retired Chairman, Toronto Dominion Bank; former Chairman & CEO, Toronto Dominion Bank;Director, Dana Corporation, Canadian NationalRailway Company and Telus Corporation;Chancellor, Queen’s University; President, ArtGallery of Ontario’s Board of Trustees.
Robert J. Dart, B.Comm., F.C.A.Vice Chairman and former President, WittingtonInvestments, Limited; former Senior Tax Partner, Price Waterhouse Canada; Director, Holt, Renfrew & Co., Limited and Brown Thomas Group Limited.
Peter B.M. Eby, B.Comm., M.B.A. (1,2,3*)
Former Vice Chairman and Director, Nesbitt BurnsInc.; former Executive, Nesbitt Burns Inc. and itspredecessor companies; former Chairman, OlympicTrust; Director, Leon’s Furniture Limited, Sixty SplitCorporation, TD Asset Management USA FundsInc., Provigo Inc. and R. Split II Corporation.
Phillip W. Farmer, B.Sc. (2,5)
Retired Chairman, President and Chief ExecutiveOfficer, Harris Corporation; former Chairman,Executive Committee of the ManufacturersAlliance; Director, Vulcan Materials Company,AuthenTec, Inc.; former Governor, AerospaceIndustries Association; Chairman, Board of Trusteesof the Florida Institute of Technology; formerMember of U.S. Secretary of Defense’s DefensePolicy Advisory Committee on Trade.
Anne L. Fraser, B.Sc., LL.D. (5*)
Education Consultant, University of Victoria;Associate, Faculties of Management, Education,Engineering, Law and Fine Arts, University ofCalgary; President, EnerG Enterprises Inc.; Director,Pier 21 Foundation and The Victoria Foundation.
Anthony R. Graham (1,3,4*)
President and Director, Wittington Investments,Limited; President and Chief Executive Officer,Sumarria Inc.; former Vice-Chairman and Directorof National Bank Financial; former SeniorExecutive Vice President and Managing Director,Lévesque Beaubien Geoffrion Inc.; Chairman and Director, President’s Choice Bank andGraymont Limited; Director, Loblaw CompaniesLimited, Brown Thomas Group Limited, Holt,Renfrew & Co., Limited, Power Corporation of Canada, Power Financial Corporation, Provigo Inc. and Selfridges & Co. Ltd.
Mark Hoffman, A.B., B.A., M.A., M.B.A. (4,5)
Chairman, Cambridge Research Group andGuinness Flight Venture Capital Trust plc; Director,Millipore Corporation, Advent InternationalCorporation, Hermes Focus Asset ManagementLimited, Glenhuron Bank Limited and Glenmaple Reinsurance Limited.
John C. Makinson, B.A., CBE (2)
Chairman and Chief Executive Officer, The PenguinGroup; former Group Finance Director, Pearsonplc; former Managing Director, Financial Timesnewspaper; Director, Pearson plc and Interactive Data Corporation Inc.
J. Robert S. Prichard, O.C., O.Ont., M.B.A., LL.M., LL.D. (3,4)
President and Chief Executive Officer and Director,Torstar Corporation; President Emeritus, Universityof Toronto; Director, Bank of Montreal, OnexCorporation, Four Seasons Hotels Inc. and TorontoCommunity Foundation; Chairman, the VisitingCommittee for Harvard Law School.
M.D. Wendy Rebanks, B.A. (4,5)
Treasurer, The W. Garfield Weston Foundation;Trustee, Toronto Art Centre; Honorary Trustee,American Museum Trustee Association and RoyalOntario Museum; Director, The Canadian MeritScholarship Foundation.
(1) Executive Committee(2) Audit Committee(3) Governance, Human Resource, Nominating
and Compensation Committee(4) Pension and Benefits Committee(5) Environmental, Health and
Safety Committee* Chairman of the Committee
W. Galen Weston, O.C. (66 and 35 years)Chairman and President
Allan L. Leighton (53 and 1 year)Deputy Chairman
Richard P. Mavrinac (54 and 24 years)(i)
Chief Financial Officer
Gordon A.M. Currie (48 and 2 years)Executive Vice President, General Counsel and Secretary
Robert A. Balcom (45 and 13 years)Senior Vice President, Assistant Secretary
Roy R. Conliffe (56 and 25 years)Senior Vice President, Labour Relations
Louise M. Lacchin (49 and 23 years)Senior Vice President, Finance
Robert G. Vaux (58 and 9 years)(i)
Senior Vice President, Corporate Development
Geoffrey H. Wilson (51 and 20 years)Senior Vice President, Financial Servicesand Investor Relations
Manny DiFilippo (47 and 15 years)Vice President, Risk Managementand Internal Audit Services
J. Bradley Holland (43 and 13 years)Vice President, Taxation
Michael N. Kimber (51 and 22 years)Vice President, Legal Counsel
Kirk W. Mondesire (46 and 21 years)Vice President, Corporate Systems
Lucy J. Paglione (47 and 23 years)Vice President, Pension and Benefits
Franca Smith (43 and 18 years)Vice President, Controller
Lisa R. Swartzman (36 and 13 years)Vice President, Treasurer
Ann Marie Yamamoto (46 and 20 years)Vice President, Systems Audit
Patrick MacDonell (37 and 11 years)Controller, Planning & Analysis
Marc Patenaude (34 and 6 years)Controller, Financial Reporting
Marian M. Burrows (52 and 28 years)Assistant Secretary
Walter H. Kraus (44 and 18 years)Senior Director, Environmental Affairs
Swavek A. Czapinski (32 and 8 years)Assistant Treasurer
M. Darryl Hanstead (32 and 8 years)Assistant Treasurer
Board of Directors
Corporate Officers (includes age and years of service)
Corporate Directory
(i) The Company announced that Mr. Mavrinac will be stepping down as Chief Financial Officer of the Company effective May 16, 2007, and will be replaced by Mr. Vaux.

Shareholder and Corporate Information
Executive OfficeGeorge Weston Limited22 St. Clair Avenue EastToronto, Canada M4T 2S7Tel: 416.922.2500Fax: 416.922.4395www.weston.ca
Stock Exchange Listing and SymbolsThe Company’s common and preferred shares are listed on the Toronto Stock Exchange and trade under the symbols: “WN”, “WN.PR.A”, “WN.PR.B”, “WN.PR.C”, “WN.PR.D” and “WN.PR.E”.
Common SharesAt year end 2006, there were 129,074,526 common shares outstanding, 1,018 registered common shareholders and48,371,678 common shares available for public trading.
The average 2006 daily trading volume of the Company’scommon shares was 107,421.
Preferred SharesAt year end 2006, there were 9,400,000 preferred shares Series I, 10,600,000 preferred shares Series II, 8,000,000preferred shares Series III, 8,000,000 preferred shares Series IV and 8,000,000 preferred shares Series V outstandingand 58 registered preferred shareholders. All outstandingpreferred shares were available for public trading.
The average 2006 daily trading volume of the Company’spreferred shares was:
Series I: 5,331Series II: 5,473Series III: 8,813Series IV: 5,968Series V: 23,386
Common Dividend PolicyIt is the Company’s policy to maintain a dividend payment equal to approximately 20% to 25% of the prior year’s adjusted basic net earnings per common share from continuing operations(1).
Common Dividend DatesThe declaration and payment of quarterly common dividends are made subject to approval by the Board of Directors. The anticipated record and payment dates for 2007 are:
Record Date Payment DateMarch 15 April 1June 15 July 1Sept. 15 Oct. 1Dec. 15 Jan. 1
Normal Course Issuer BidThe Company has a Normal Course Issuer Bid on the TorontoStock Exchange.
Value of Common SharesFor capital gains purposes, the valuation day (December 22,1971) cost base for the Company, adjusted for the 4 for 1 stock split (effective May 27, 1986) and the 3 for 1 stock split(effective May 8, 1998), is $1.50 per share. The value onFebruary 22, 1994 was $13.17 per share.
Registrar and Transfer AgentComputershare Investor Services Inc.100 University AvenueToronto, Canada M5J 2Y1Tel: 416.263.9200Toll Free Tel: 1.800.663.9097Fax: 416.263.9394Toll Free Fax: 1.888.453.0330
To change your address or eliminate multiple mailings, or for other shareholder account inquiries, please contactComputershare Investor Services Inc.
Independent AuditorsKPMG LLP
Chartered AccountantsToronto, Canada
Annual MeetingThe George Weston Limited Annual and Special Meeting of Shareholders will be held on Wednesday, May 16, 2007 at 11:00 a.m. at the Harbour Castle Convention Centre,Frontenac Ballroom, Toronto, Canada.
TrademarksGeorge Weston Limited and its subsidiaries own a number of trademarks. These trademarks are the exclusive property of George Weston Limited and its subsidiary companies.Trademarks where used in this report are in italics.
Investor RelationsShareholders, security analysts and investment professionalsshould direct their requests to Mr. Geoffrey H. Wilson, SeniorVice President, Financial Services and Investor Relations at theCompany’s Executive Office or by e-mail at [email protected].
Additional financial information has been filed electronically with various securities regulators in Canada through the System for Electronic Document Analysis and Retrieval (SEDAR).The Company holds an analyst call shortly following the releaseof its quarterly results. These calls are archived in the InvestorZone section of the Company’s website.
This Annual Report includes selected information on LoblawCompanies Limited, a 62%-owned public reporting subsidiarycompany with shares trading on the Toronto Stock Exchange.
Ce rapport est disponible en français.
This Annual Summary was printed in Canada on Cougar Opaque,manufactured totally chlorine-free with 10% post-consumer fibre,at a mill independently certified as meeting the procurementprovisions of the Sustainable Forestry Initiative® (SFI) standard.
Design and Coordination: Ove Design & Communications Ltd. www.ovedesign.com
Typesetting: Moveable Inc. www.moveable.com
Printing: Transcontinental Printing G.P.
(1) See Non-GAAP Financial Measures beginning on page 51 of the Financial Report.

www.weston.ca

George Weston Limited 2006 Financial Report
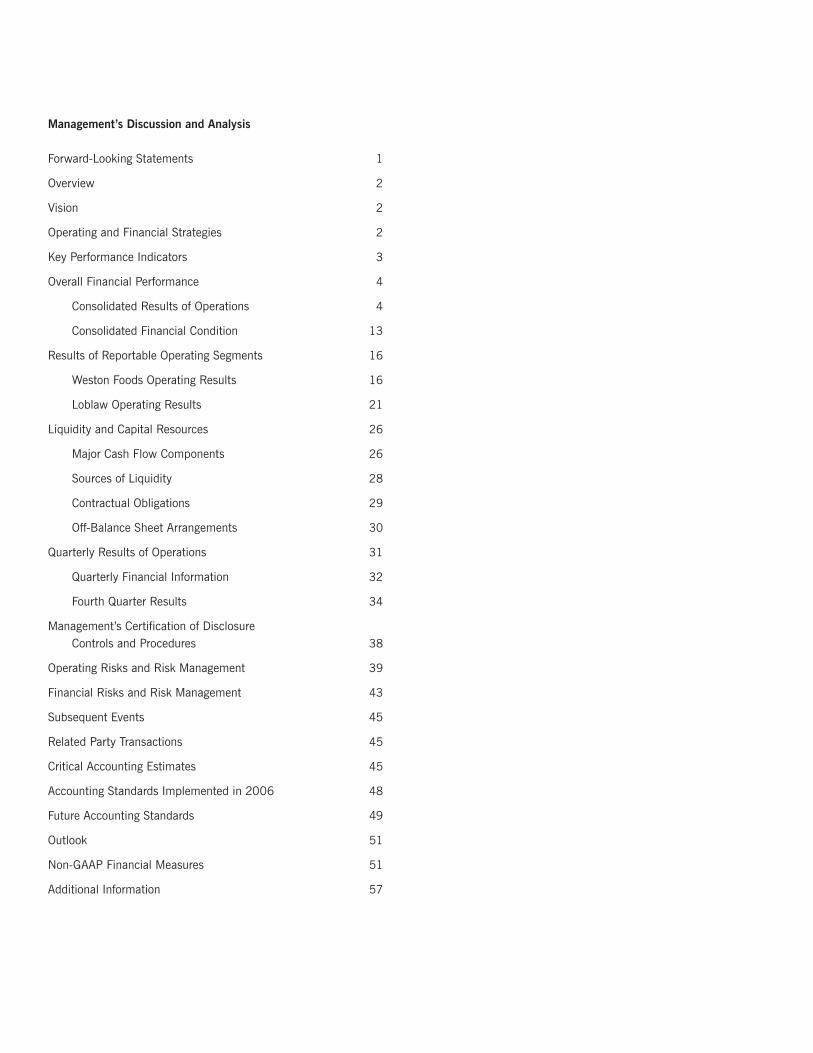
Management’s Discussion and Analysis
Forward-Looking Statements 1
Overview 2
Vision 2
Operating and Financial Strategies 2
Key Performance Indicators 3
Overall Financial Performance 4
Consolidated Results of Operations 4
Consolidated Financial Condition 13
Results of Reportable Operating Segments 16
Weston Foods Operating Results 16
Loblaw Operating Results 21
Liquidity and Capital Resources 26
Major Cash Flow Components 26
Sources of Liquidity 28
Contractual Obligations 29
Off-Balance Sheet Arrangements 30
Quarterly Results of Operations 31
Quarterly Financial Information 32
Fourth Quarter Results 34
Management’s Certification of DisclosureControls and Procedures 38
Operating Risks and Risk Management 39
Financial Risks and Risk Management 43
Subsequent Events 45
Related Party Transactions 45
Critical Accounting Estimates 45
Accounting Standards Implemented in 2006 48
Future Accounting Standards 49
Outlook 51
Non-GAAP Financial Measures 51
Additional Information 57
George Weston Limited 2006 Financial Report 1
The following Management’s Discussion and Analysis (“MD&A”) for George Weston Limited (“Weston”) and its subsidiaries (collectively,the “Company”) should be read in conjunction with the consolidated financial statements and the accompanying notes on pages 59 to 95 of this Financial Report. The consolidated financial statements and the accompanying notes have been prepared in accordancewith Canadian generally accepted accounting principles (“GAAP”) and are reported in Canadian dollars. These consolidated financialstatements include the accounts of George Weston Limited and its subsidiaries and variable interest entities (“VIEs”) that the Company is required to consolidate in accordance with Accounting Guideline 15, “Consolidation of Variable Interest Entities” (“AcG 15”). A Glossary of terms and ratios used throughout this Financial Report can be found on page 99. The information in this MD&A is current as of March 15, 2007, unless otherwise noted.
FORWARD-LOOKING STATEMENTS
This Annual Report, including the Annual Summary and this MD&A, contains forward-looking statements which reflect management’sexpectations and are contained in discussions regarding the Company’s objectives, plans, goals, aspirations, strategies, potential future growth, results of operations, performance and business prospects and opportunities. Forward-looking statements are typically,though not always, identified by words or phrases such as “anticipates”, “expects”, “believes”, “estimates”, “intends” and other similar expressions.
These forward-looking statements are not guarantees, but only predictions. Although the Company believes that these statements are based on information and assumptions, which are current, reasonable and complete, these statements are necessarily subject to a number of factors that could cause actual results to vary significantly from the estimates, projections and intentions. Such differencesmay be caused by factors which include, but are not limited to, changes in consumer spending, preferences and consumers’ nutritionaland health related concerns, changes in the competitive environment, including changes in pricing and market strategies of the Companyor of its competitors and the entry of new competitors and expansion of current competitors, the availability and cost of raw materials and ingredients, fuels and utilities, the ability to realize anticipated cost savings and efficiencies, including those resulting from restructuring,inventory liquidation and other cost reduction and simplification initiatives, the ability to execute restructuring plans, implement strategiesand introduce innovative products successfully and in a timely manner, changes in the markets for the inventory intended for liquidationand changes in the expected realizable value and costs associated with the liquidation, unanticipated, increased or decreased costsassociated with the announced initiatives, including those related to compensation costs, the Company’s relationship with its employees,results of labour negotiations including the terms of future collective bargaining agreements, changes to the regulatory environment inwhich the Company operates now or in the future, the inherent uncertainty regarding the outcome of litigation or any dispute resolutioninitiative, changes in the Company’s tax liabilities, either through changes in tax laws or future assessments, performance of third-partyservice providers, public health events, the ability of the Company to attract and retain key executives, the success rate of the Companyin developing and introducing new products and entering new markets and supply and quality control issues with vendors. The calculationof the goodwill impairment charge described in this MD&A involves the estimation of several variables, including but not limited to marketmultiples, projected future sales and earnings, capital investment, discount rates, terminal growth rates and the fair values of thoseassets and liabilities being valued. The Company cautions that this list of factors is not exhaustive.
The assumptions applied in making the forward-looking statements contained in this Annual Report, including this MD&A, include the following: economic conditions do not materially change from those expected, patterns of consumer spending and preferences arereasonably consistent with historical trends, no new significant competitors enter the Company’s market and neither the Company norits existing competitors significantly increase their presence or change pricing or market strategies materially, the Company successfullyoffers new and innovative products and executes its strategies as planned, anticipated cost savings and efficiencies are realized asplanned, continuing future restructuring activities are effectively executed in a timely manner, costs associated with the liquidation ofinventory are not higher or lower than expected, the Company’s assumptions regarding average compensation costs and average yearsof service for employees affected by the simplification initiatives are materially correct, the Company does not significantly change itsapproach to its current restructuring activities, there is no material amount of excess inventory in the Company’s supply chain, there are no material work stoppages and the performance of third-party service providers is in accordance with expectations.
These estimates and assumptions may change in the future due to uncertain competitive and economic market conditions or changes in business strategies. This list of factors and other risks and uncertainties are discussed in the Company’s materials filed with theCanadian securities regulatory authorities from time to time, including the Operating Risks and Risk Management and Financial Risksand Risk Management sections of this MD&A.
Management’s Discussion and Analysis
2 George Weston Limited 2006 Financial Report
Potential investors and other readers are urged to consider these factors carefully in evaluating these forward-looking statements and arecautioned not to place undue reliance on them. The forward-looking statements included in this Annual Report, including this MD&A,are made only as of the filing date of this Annual Report and the Company disclaims any obligation or intention to publicly update theseforward-looking statements to reflect new information, future events or otherwise. In light of these risks, uncertainties and assumptions,the forward-looking events contained in these forward-looking statements may or may not occur. The Company cannot assure thatprojected results or events will be achieved.
OVERVIEW
Weston is a Canadian public company, founded in 1882, and is one of North America’s largest food processing and distribution companies.Weston has two reportable operating segments: Weston Foods and Loblaw. The Weston Foods operating segment is primarily engagedin the baking and dairy industries within North America. The Loblaw operating segment, which is operated by Loblaw Companies Limitedand its subsidiaries, is Canada’s largest food distributor and a leading provider of general merchandise, drugstore, and financial productsand services.
VISION
Weston’s vision has been, and continues to be, centred on three main principles: growth, innovation and flexibility. Weston seeks longterm, stable growth in its operating segments, while accepting prudent operating risks through continuous capital investment supportedby a strong balance sheet, with the goal of providing sustainable returns to its shareholders through a combination of common shareprice appreciation and dividends.
The Company believes that to be successful over the long term, it must deliver on what its customers and consumers want, today and in the future. The Company encourages innovation in order to provide consumers with new products and convenient services at competitive prices that meet consumers’ everyday household needs.
Looking ahead, the Company plans to achieve these goals by focusing on its long term operating and financial strategies as discussed below.
OPERATING AND FINANCIAL STRATEGIES
In order to be successful in delivering long term value and to fulfill its long term objectives of security and growth, the Company employs various operating and financial strategies in order to achieve its long term vision. Each of the Company’s two reportableoperating segments has its own risk profile and operating risk management strategies.
Weston Foods’ long term operating strategies include: • customer alignment;• brand development including innovative new products to meet the nutritional and dietary concerns of consumers;• plant and distribution optimization including capital investment to strategically position facilities across North America
to support growth and enhance productivity and efficiencies;• ongoing cost reduction initiatives to ensure a low cost operating structure and economies of scale;• targeting strategic acquisitions and relationships to broaden market penetration and expand geographic presence; and• building leadership capability.
Under the principles of Simplify, Innovate, Grow, Loblaw employs various operating and financial strategies which guide Loblaw over the long term and represent a philosophy for the way in which it conducts its business. The new management team developed its Formula for Growth to define priorities for a three year renewal plan. In order to provide an integrated offering of food, generalmerchandise and drugstore, Loblaw’s Formula for Growth focuses on the following:• best format: truly distinctive formats meeting customers’ different needs;• fresh first: best fresh food offering;• control label advantage: leading in the development of unique, high quality control label products and services;• Joe Fresh Style: ensuring great style at an affordable price;• health, home and wholesome: making healthy living affordable; • priced right: providing best value;• always available: best in-stock positions; and• friendly colleagues motivated to serve.
Management’s Discussion and Analysis
Loblaw’s long term operating strategies are consistent with its Formula for Growth and continue to be as follows:• using the cash flow generated in its business to invest in its future;• owning its real estate, where possible, to maximize flexibility for product and business opportunities in the future;• using a multi-format approach to maximize market share over the longer term;• focusing on food but serving the consumer’s everyday household needs;• creating customer loyalty and enhancing price competitiveness through a superior control label program;• implementing and executing plans and programs flawlessly; and• constantly striving to improve its value proposition.
The Company’s financial strategies include:• maintaining a strong balance sheet;• minimizing the risks and costs of its operating and financing activities; and• maintaining liquidity and access to capital markets.
The Company’s Board of Directors (the “Board”) and senior management meet annually to review the strategic imperatives. These strategic imperatives, which generally span a three to five year timeframe, target specific issues in response to the Company’sperformance and changes in consumer needs and the competitive landscape.
The Company believes that if it successfully implements and executes its various strategic imperatives in support of its long termoperating and financial strategies, it will be well positioned to fulfill its vision of providing sustainable returns to its shareholders over the long term.
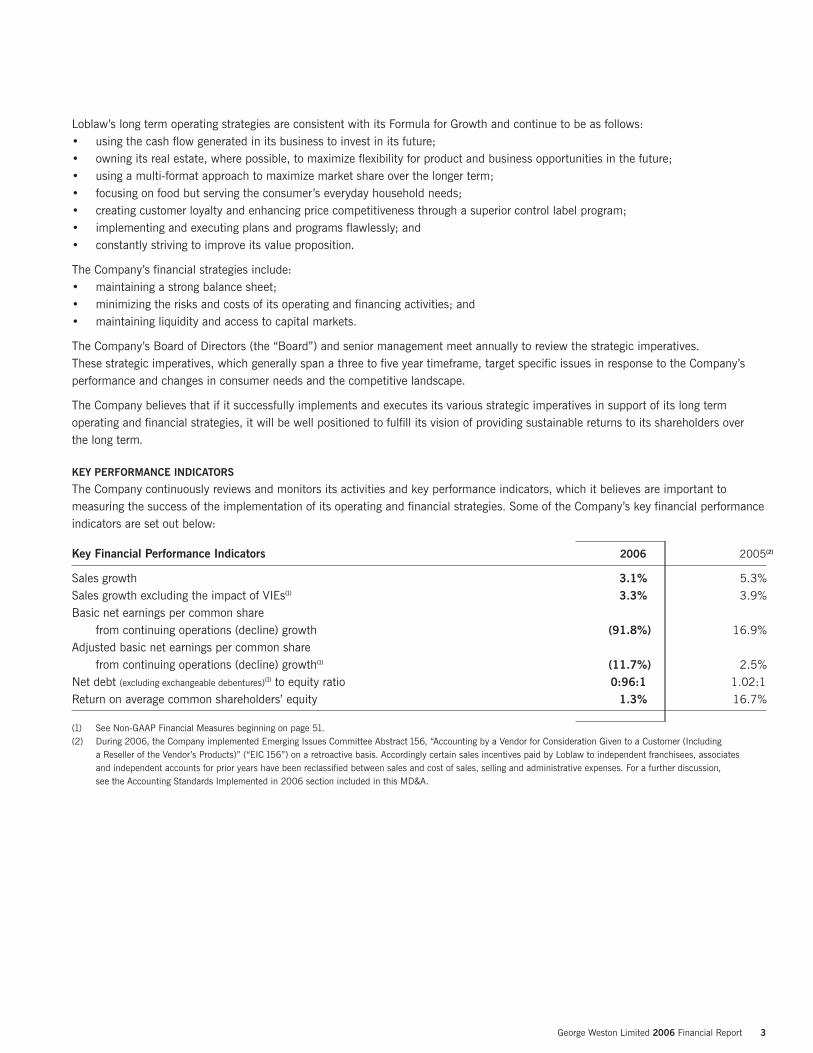
KEY PERFORMANCE INDICATORS
The Company continuously reviews and monitors its activities and key performance indicators, which it believes are important tomeasuring the success of the implementation of its operating and financial strategies. Some of the Company’s key financial performanceindicators are set out below:
Key Financial Performance Indicators 2006 2005(2)
Sales growth 3.1% 5.3%Sales growth excluding the impact of VIEs(1) 3.3% 3.9%Basic net earnings per common share
from continuing operations (decline) growth (91.8%) 16.9%Adjusted basic net earnings per common share
from continuing operations (decline) growth(1) (11.7%) 2.5%Net debt (excluding exchangeable debentures)(1) to equity ratio 0:96:1 1.02:1Return on average common shareholders’ equity 1.3% 16.7%
(1) See Non-GAAP Financial Measures beginning on page 51.(2) During 2006, the Company implemented Emerging Issues Committee Abstract 156, “Accounting by a Vendor for Consideration Given to a Customer (Including
a Reseller of the Vendor’s Products)” (“EIC 156”) on a retroactive basis. Accordingly certain sales incentives paid by Loblaw to independent franchisees, associates and independent accounts for prior years have been reclassified between sales and cost of sales, selling and administrative expenses. For a further discussion, see the Accounting Standards Implemented in 2006 section included in this MD&A.
George Weston Limited 2006 Financial Report 3

4 George Weston Limited 2006 Financial Report
In addition, other operating performance indicators include but are not limited to: same-store sales growth, operating and administrativecost management, new product development, customer service ratings, product return rates, production waste, production efficienciesand market share.
OVERALL FINANCIAL PERFORMANCE
CONSOLIDATED RESULTS OF OPERATIONS
($ millions except where otherwise indicated) 2006 2005(2) 2004(2)
Sales $ 32,167 $ 31,189 $ 29,619Sales excluding the impact of VIEs(1) $ 31,784 $ 30,774 $ 29,619Operating income $ 537 $ 1,634 $ 1,782Adjusted operating income(1) $ 1,643 $ 1,894 $ 1,901Interest expense and other financing charges $ 253 $ 187 $ 438Net earnings from continuing operations $ 110 $ 716 $ 606Net earnings $ 121 $ 698 $ 428Basic net earnings per common share
from continuing operations ($) $ 0.43 $ 5.25 $ 4.49Adjusted basic net earnings per common share
from continuing operations ($)(1) $ 4.98 $ 5.64 $ 5.50Basic net earnings per common share ($) $ 0.52 $ 5.11 $ 3.11
(1) See Non-GAAP Financial Measures beginning on page 51.(2) During 2006, the Company implemented EIC 156 on a retroactive basis. Accordingly certain sales incentives paid by Loblaw to independent franchisees, associates
and independent accounts for prior years have been reclassified between sales and cost of sales, selling and administrative expenses. For a further discussion, see the Accounting Standards Implemented in 2006 section included in this MD&A.
Sales and Sales Growth Excluding the Impact of VIEs(1)
($ millions except where otherwise indicated) 2006 2005(2) 2004(2)
Total sales $ 32,167 $ 31,189 $ 29,619Less: Sales attributable to the consolidation of VIEs 383 415
Sales excluding the impact of VIEs(1) $ 31,784 $ 30,774 $ 29,619
Total sales growth 3.1% 5.3%Less: Impact on sales growth attributable to the consolidation of VIEs (0.2%) 1.4%
Sales growth excluding the impact of VIEs(1) 3.3% 3.9%
(1) See Non-GAAP Financial Measures beginning on page 51.(2) During 2006, the Company implemented EIC 156 on a retroactive basis. Accordingly certain sales incentives paid by Loblaw to independent franchisees, associates
and independent accounts for prior years have been reclassified between sales and cost of sales, selling and administrative expenses. For a further discussion, see the Accounting Standards Implemented in 2006 section included in this MD&A.
Management’s Discussion and Analysis
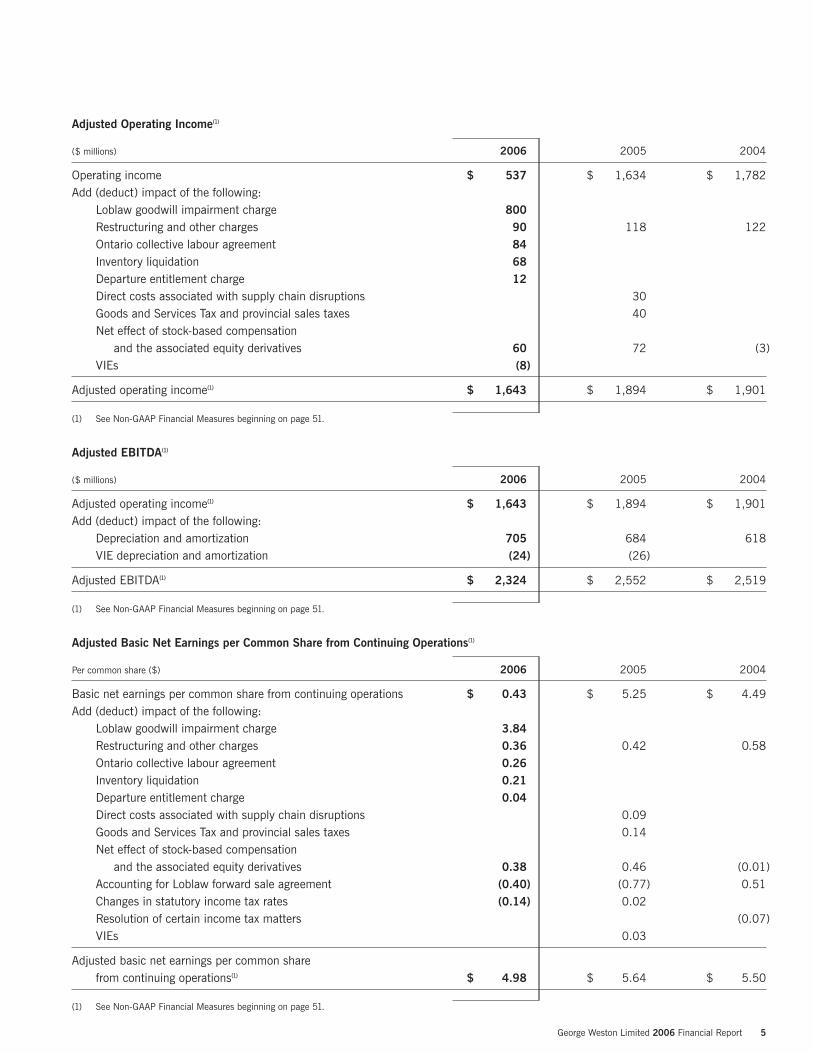
Adjusted Operating Income(1)
($ millions) 2006 2005 2004
Operating income $ 537 $ 1,634 $ 1,782Add (deduct) impact of the following:
Loblaw goodwill impairment charge 800Restructuring and other charges 90 118 122Ontario collective labour agreement 84Inventory liquidation 68Departure entitlement charge 12Direct costs associated with supply chain disruptions 30Goods and Services Tax and provincial sales taxes 40Net effect of stock-based compensation
and the associated equity derivatives 60 72 (3)VIEs (8)
Adjusted operating income(1) $ 1,643 $ 1,894 $ 1,901
(1) See Non-GAAP Financial Measures beginning on page 51.
Adjusted EBITDA(1)
($ millions) 2006 2005 2004
Adjusted operating income(1) $ 1,643 $ 1,894 $ 1,901Add (deduct) impact of the following:
Depreciation and amortization 705 684 618VIE depreciation and amortization (24) (26)
Adjusted EBITDA(1) $ 2,324 $ 2,552 $ 2,519
(1) See Non-GAAP Financial Measures beginning on page 51.
Adjusted Basic Net Earnings per Common Share from Continuing Operations(1)
Per common share ($) 2006 2005 2004
Basic net earnings per common share from continuing operations $ 0.43 $ 5.25 $ 4.49Add (deduct) impact of the following:
Loblaw goodwill impairment charge 3.84Restructuring and other charges 0.36 0.42 0.58Ontario collective labour agreement 0.26Inventory liquidation 0.21Departure entitlement charge 0.04Direct costs associated with supply chain disruptions 0.09Goods and Services Tax and provincial sales taxes 0.14Net effect of stock-based compensation
and the associated equity derivatives 0.38 0.46 (0.01)Accounting for Loblaw forward sale agreement (0.40) (0.77) 0.51Changes in statutory income tax rates (0.14) 0.02Resolution of certain income tax matters (0.07)VIEs 0.03
Adjusted basic net earnings per common sharefrom continuing operations(1) $ 4.98 $ 5.64 $ 5.50
(1) See Non-GAAP Financial Measures beginning on page 51.
George Weston Limited 2006 Financial Report 5
6 George Weston Limited 2006 Financial Report
Consolidated 2006 results reflect the transformational changes being undertaken by both the Weston Foods and Loblaw operatingsegments in order to position the businesses for strong growth in the future.
Baking industry conditions have changed significantly over the past several years and the Company’s North American baking operationshave faced a challenging marketplace impacted by changing consumer eating preferences and food shopping patterns, as well ascontinued inflationary cost pressures. The Company continued to respond to these challenging conditions and execute on opportunitiesto improve the long term competitive position of its North American baking operations, which has resulted in further restructuring and other charges taken by the Company during 2006.
Results for the Loblaw operating segment in 2006 were affected by the short term costs associated with one of the largest transformationsin Loblaw’s history. The past year saw a number of significant changes in the leadership of Loblaw with the appointment of a new seniorleadership team in the offices of Executive Chairman, Chief Merchandising Officer, Chief Operating Officer and Chief Financial Officer.The need for this transformative process was driven by Loblaw’s recent uncharacteristically poor financial performance, its assessmentof a fast-changing retail environment and a strategic review, undertaken by the new senior leadership of Loblaw, of processes, structureand key drivers of its operations. This strategic review highlighted both core strengths and issues to be addressed. The core strengthsinclude a strong market share, control label products and a strong store network. A number of issues facing Loblaw includedunacceptable levels of on-shelf availability, the need to strengthen price positioning, insufficiently distinctive formats, a complexorganizational structure with inconsistent procedures and standards which lacked clear accountabilities and insufficient focus on the customer. In response to these findings, Loblaw embarked on planning and developing an organizational transition which focuses on redesigning processes, a leaner administrative structure and a comprehensive strategy designed to fortify its competitive position and maintain its leadership role in meeting the food and everyday household needs of Canadian consumers. In pursuit of this strategy,Loblaw is refocusing the business around the three principles of Simplify, Innovate, Grow and took decisive action in 2006 to initiatetangible change. These steps include: (i) simplifying the organization by more clearly defining accountabilities, eliminating duplicationand establishing consistent, simple and efficient processes; (ii) supporting innovation based on the belief that providing customers with new products and convenient services at competitive prices and stimulating shopping environments is critical to its success; and(iii) developing a Formula for Growth as previously described. Additional steps taken in 2006 include the negotiation of a new four-yearcollective agreement with members of certain Ontario locals of the United Food and Commercial Workers union (“UFCW”), the liquidation of certain general merchandise inventory and the closure of certain underperforming stores. Changes in 2005 included the restructuring of Loblaw’s supply chain network, the reorganizations involving its merchandising, procurement and operations groups,the establishment of a new National Head Office and Store Support Centre in Brampton, Ontario, which opened in 2005, and therelocation of general merchandise operations from Calgary, Alberta to the new National Head Office. During 2005, Loblaw encounteredchallenges during the execution of planned changes to its systems, supply chain and general merchandise areas, including certain supplychain systems conversions which were initiated as part of the creation of a national information technology platform and the start-up ofa new third-party owned and operated general merchandise warehouse and distribution centre for eastern Canada which handles generalmerchandise and certain drugstore products, primarily health and beauty care products. These challenges disrupted the flow of inventoryto Loblaw’s stores and caused Loblaw to incur additional operating costs and reduced overall sales as product availability impactedconsumers at the store level. During 2006, Loblaw continued to feel the effects from these changes. However, progress continued to be made in reducing the impact of the supply chain disruptions as follows:• the third-party owned and operated general merchandise warehouse and distribution centre for eastern Canada posted slight
productivity improvements and achieved improved service levels;• six additional systems conversions were completed during the year with minimal disruption to continuing operations as part
of the move to a national systems platform;• food service levels continued at expected levels during 2006 and service levels for drugstore improved; and• service levels for general merchandise showed signs of stability and improvement, and while slower than anticipated,
progress has been made.
Management’s Discussion and Analysis
George Weston Limited 2006 Financial Report 7
The following discussion summarizes the factors and trends that have impacted the Company’s financial performance over the past two fiscal years.
In 2006, consolidated sales increased 3.1% to $32.2 billion from $31.2 billion in 2005. Sales growth for 2006 included a negativeimpact of approximately 0.2% from the consolidation of certain Loblaw independent franchisees as required by AcG 15. Sales excludingthe impact of VIEs(1) increased 3.3% or $1.0 billion over the prior year. In 2005, consolidated sales increased 5.3% from $29.6 billion in 2004. Sales growth for 2005 included a positive impact of approximately 1.4% from the consolidation of certain Loblaw independentfranchisees. The 2006 consolidated net earnings from continuing operations decreased $606 million, or 84.6%, to $110 million from $716 million in 2005. In 2005, consolidated net earnings from continuing operations increased $110 million, or 18.2%, from $606 million in 2004. Consolidated net earnings decreased $577 million, or 82.7%, to $121 million in 2006 from $698 million in 2005. In 2005, consolidated net earnings increased $270 million, or 63.1%, from $428 million in 2004.
The 2006 basic net earnings per common share from continuing operations of $0.43 decreased 91.8% in line with the decrease inconsolidated net earnings from continuing operations. The 2006 basic net earnings per common share of $0.52 also decreased by89.8% compared to $5.11 in 2005. Both decreases were primarily due to a non-cash Loblaw goodwill impairment charge recorded in 2006 related to the goodwill established on the Loblaw acquisition of Provigo Inc. in 1998.
The Company’s consolidated financial statements are expressed in Canadian dollars but a significant portion of its Weston Foods businessoccurs in United States dollars through its investment in self-sustaining foreign operations in the United States (“U.S. net investment”).Changes in the exchange rate for the United States dollar affect the Company’s sales, net earnings and the value of the Company’s assetsand liabilities on its consolidated balance sheet, either positively or negatively, as a result of translating the U.S. net investment intoCanadian dollars. In 2006 and 2005, due to the appreciation in the Canadian dollar relative to the United States dollar during the year on a weighted average basis, sales and net earnings growth were negatively impacted as a result of foreign currency translation. At year end 2006, due to the slight decline of the Canadian dollar relative to the United States dollar from year end 2005, the value ofthe Company’s net assets was positively impacted as a result of foreign currency translation. At year end 2005, due to the strengtheningof the Canadian dollar relative to the United States dollar from year end 2004, the value of the Company’s net assets was negativelyimpacted as a result of foreign currency translation.
Over the past two years, the Weston Foods baking operations have operated in a challenging marketplace impacted by changingconsumer eating preferences and food shopping patterns as well as continued inflationary cost pressures. Changing consumer eatingpreferences, including a focus on health and diet, challenged Weston Foods sales growth of traditional white flour based products, inparticular white bread and fresh-baked sweet goods. In addition, consumer shopping patterns and Weston Foods sales growth continueto shift toward alternate format retail channels over traditional, conventional supermarket formats. Product rationalization and theplanned exit of certain less profitable products have negatively impacted sales with competitive activity remaining strong across allcategories, particularly in biscuit and frozen bakery sales. These continuing trends are more fully discussed under Weston Foodsoperating results in the Results of Reportable Operating Segments section of this MD&A.
During this two-year period, Weston Foods sales have been positively impacted by its focus on:• penetrating new sales channels, particularly with alternate format retail channels;• strong sales growth in the whole grain and higher-priced premium product categories;• new private label business; and• the development and introduction of new and expanded convenience and health related product offerings, including
“on-the-go” individual portioned products, enhanced whole grain and whole wheat offerings as well as Omega-3, no cholesterol, reduced fat, no trans fat and organic products.
In 2006, Weston Foods achieved sales price increases across many of its product categories. These increases helped to partiallymitigate the impact of the continued cost inflation experienced across the baking industry. Over the last two years, Weston Foods hascontinued to restructure its asset base to reduce costs and operate more efficiently. Management continues to evaluate strategic andcost reduction initiatives related to its manufacturing assets, distribution networks and administrative infrastructure with the objective of ensuring a low cost operating structure.
(1) See Non-GAAP Financial Measures beginning on page 51.
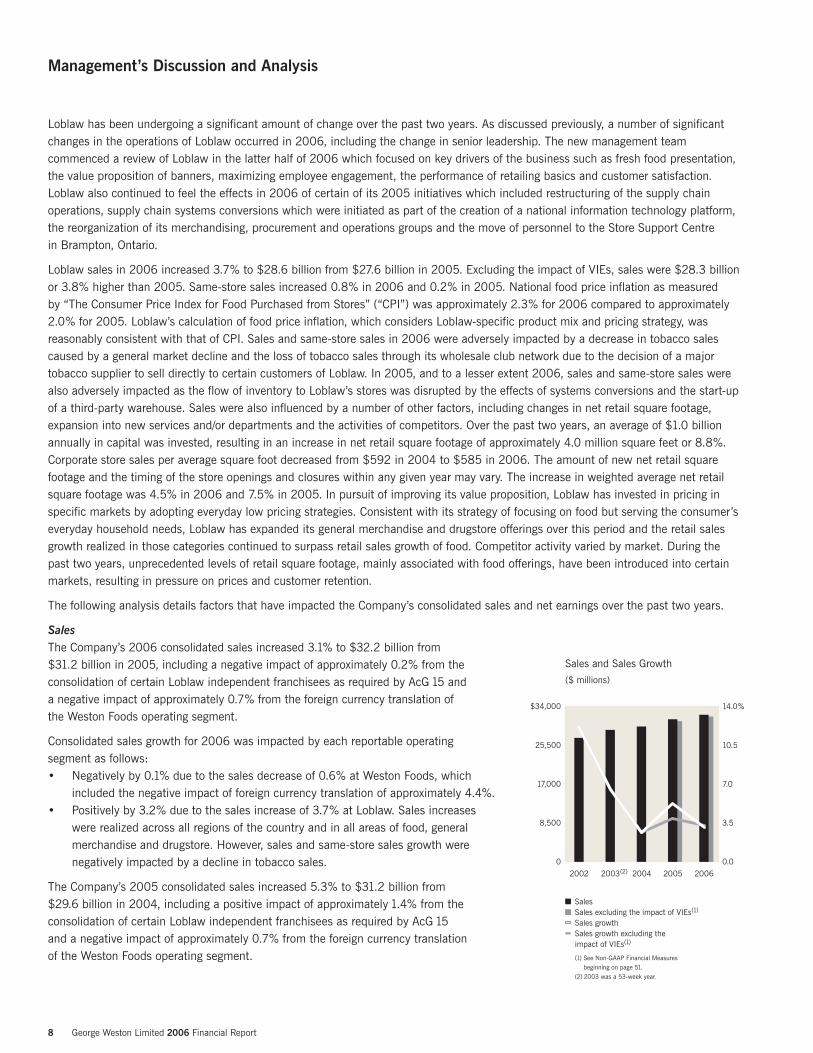
Loblaw has been undergoing a significant amount of change over the past two years. As discussed previously, a number of significantchanges in the operations of Loblaw occurred in 2006, including the change in senior leadership. The new management teamcommenced a review of Loblaw in the latter half of 2006 which focused on key drivers of the business such as fresh food presentation,the value proposition of banners, maximizing employee engagement, the performance of retailing basics and customer satisfaction.Loblaw also continued to feel the effects in 2006 of certain of its 2005 initiatives which included restructuring of the supply chainoperations, supply chain systems conversions which were initiated as part of the creation of a national information technology platform,the reorganization of its merchandising, procurement and operations groups and the move of personnel to the Store Support Centre in Brampton, Ontario.
Loblaw sales in 2006 increased 3.7% to $28.6 billion from $27.6 billion in 2005. Excluding the impact of VIEs, sales were $28.3 billionor 3.8% higher than 2005. Same-store sales increased 0.8% in 2006 and 0.2% in 2005. National food price inflation as measured by “The Consumer Price Index for Food Purchased from Stores” (“CPI”) was approximately 2.3% for 2006 compared to approximately2.0% for 2005. Loblaw’s calculation of food price inflation, which considers Loblaw-specific product mix and pricing strategy, wasreasonably consistent with that of CPI. Sales and same-store sales in 2006 were adversely impacted by a decrease in tobacco salescaused by a general market decline and the loss of tobacco sales through its wholesale club network due to the decision of a majortobacco supplier to sell directly to certain customers of Loblaw. In 2005, and to a lesser extent 2006, sales and same-store sales werealso adversely impacted as the flow of inventory to Loblaw’s stores was disrupted by the effects of systems conversions and the start-upof a third-party warehouse. Sales were also influenced by a number of other factors, including changes in net retail square footage,expansion into new services and/or departments and the activities of competitors. Over the past two years, an average of $1.0 billionannually in capital was invested, resulting in an increase in net retail square footage of approximately 4.0 million square feet or 8.8%.Corporate store sales per average square foot decreased from $592 in 2004 to $585 in 2006. The amount of new net retail squarefootage and the timing of the store openings and closures within any given year may vary. The increase in weighted average net retailsquare footage was 4.5% in 2006 and 7.5% in 2005. In pursuit of improving its value proposition, Loblaw has invested in pricing inspecific markets by adopting everyday low pricing strategies. Consistent with its strategy of focusing on food but serving the consumer’severyday household needs, Loblaw has expanded its general merchandise and drugstore offerings over this period and the retail salesgrowth realized in those categories continued to surpass retail sales growth of food. Competitor activity varied by market. During thepast two years, unprecedented levels of retail square footage, mainly associated with food offerings, have been introduced into certainmarkets, resulting in pressure on prices and customer retention.
The following analysis details factors that have impacted the Company’s consolidated sales and net earnings over the past two years.
Sales The Company’s 2006 consolidated sales increased 3.1% to $32.2 billion from $31.2 billion in 2005, including a negative impact of approximately 0.2% from theconsolidation of certain Loblaw independent franchisees as required by AcG 15 anda negative impact of approximately 0.7% from the foreign currency translation of the Weston Foods operating segment.
Consolidated sales growth for 2006 was impacted by each reportable operating segment as follows: • Negatively by 0.1% due to the sales decrease of 0.6% at Weston Foods, which
included the negative impact of foreign currency translation of approximately 4.4%.• Positively by 3.2% due to the sales increase of 3.7% at Loblaw. Sales increases
were realized across all regions of the country and in all areas of food, generalmerchandise and drugstore. However, sales and same-store sales growth werenegatively impacted by a decline in tobacco sales.
The Company’s 2005 consolidated sales increased 5.3% to $31.2 billion from $29.6 billion in 2004, including a positive impact of approximately 1.4% from theconsolidation of certain Loblaw independent franchisees as required by AcG 15 and a negative impact of approximately 0.7% from the foreign currency translationof the Weston Foods operating segment.
8 George Weston Limited 2006 Financial Report
Management’s Discussion and Analysis
200620052003(2)2002
Sales and Sales Growth
($ millions)
SalesSales excluding the impact of VIEs(1)
Sales growthSales growth excluding the impact of VIEs(1)
(1) See Non-GAAP Financial Measures beginning on page 51.(2) 2003 was a 53-week year.
0
8,500
17,000
25,500
$34,000
0.0
3.5
7.0
10.5
14.0%
2004
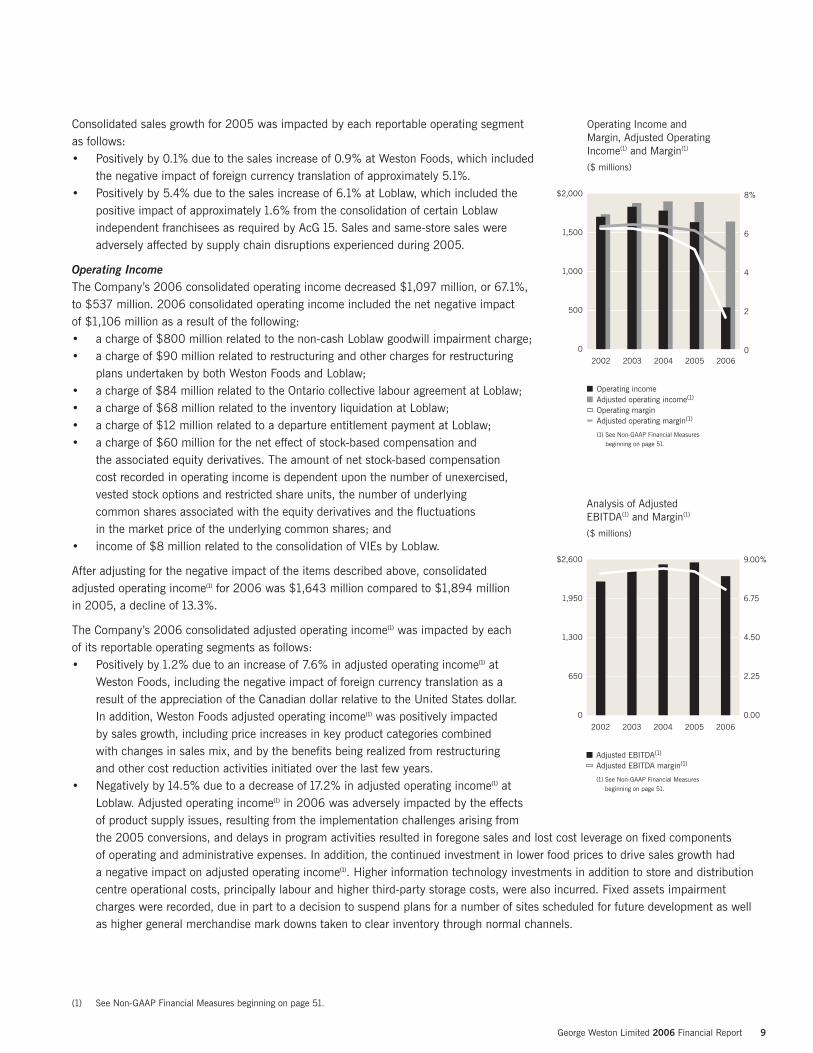
George Weston Limited 2006 Financial Report 9
Consolidated sales growth for 2005 was impacted by each reportable operating segmentas follows:• Positively by 0.1% due to the sales increase of 0.9% at Weston Foods, which included
the negative impact of foreign currency translation of approximately 5.1%.• Positively by 5.4% due to the sales increase of 6.1% at Loblaw, which included the
positive impact of approximately 1.6% from the consolidation of certain Loblawindependent franchisees as required by AcG 15. Sales and same-store sales wereadversely affected by supply chain disruptions experienced during 2005.
Operating IncomeThe Company’s 2006 consolidated operating income decreased $1,097 million, or 67.1%,to $537 million. 2006 consolidated operating income included the net negative impact of $1,106 million as a result of the following:• a charge of $800 million related to the non-cash Loblaw goodwill impairment charge;• a charge of $90 million related to restructuring and other charges for restructuring
plans undertaken by both Weston Foods and Loblaw; • a charge of $84 million related to the Ontario collective labour agreement at Loblaw;• a charge of $68 million related to the inventory liquidation at Loblaw;• a charge of $12 million related to a departure entitlement payment at Loblaw;• a charge of $60 million for the net effect of stock-based compensation and
the associated equity derivatives. The amount of net stock-based compensation cost recorded in operating income is dependent upon the number of unexercised,vested stock options and restricted share units, the number of underlying common shares associated with the equity derivatives and the fluctuations in the market price of the underlying common shares; and
• income of $8 million related to the consolidation of VIEs by Loblaw.
After adjusting for the negative impact of the items described above, consolidated adjusted operating income(1) for 2006 was $1,643 million compared to $1,894 million in 2005, a decline of 13.3%.
The Company’s 2006 consolidated adjusted operating income(1) was impacted by each of its reportable operating segments as follows:• Positively by 1.2% due to an increase of 7.6% in adjusted operating income(1) at
Weston Foods, including the negative impact of foreign currency translation as aresult of the appreciation of the Canadian dollar relative to the United States dollar. In addition, Weston Foods adjusted operating income(1) was positively impacted by sales growth, including price increases in key product categories combined with changes in sales mix, and by the benefits being realized from restructuring and other cost reduction activities initiated over the last few years.
• Negatively by 14.5% due to a decrease of 17.2% in adjusted operating income(1) atLoblaw. Adjusted operating income(1) in 2006 was adversely impacted by the effectsof product supply issues, resulting from the implementation challenges arising fromthe 2005 conversions, and delays in program activities resulted in foregone sales and lost cost leverage on fixed components of operating and administrative expenses. In addition, the continued investment in lower food prices to drive sales growth had a negative impact on adjusted operating income(1). Higher information technology investments in addition to store and distributioncentre operational costs, principally labour and higher third-party storage costs, were also incurred. Fixed assets impairmentcharges were recorded, due in part to a decision to suspend plans for a number of sites scheduled for future development as wellas higher general merchandise mark downs taken to clear inventory through normal channels.
(1) See Non-GAAP Financial Measures beginning on page 51.
20062005200420032002
Operating Income and Margin, Adjusted Operating Income(1) and Margin(1)
($ millions)
Operating incomeAdjusted operating income(1)
Operating marginAdjusted operating margin(1)
(1) See Non-GAAP Financial Measures beginning on page 51.
0
500
1,000
1,500
$2,000
0
2
4
6
8%
200620052004200320020
650
1,300
1,950
$2,600
0.00
2.25
4.50
6.75
9.00%
Adjusted EBITDA(1)
Adjusted EBITDA margin(1)
(1) See Non-GAAP Financial Measures beginning on page 51.
Analysis of Adjusted EBITDA(1) and Margin(1)
($ millions)
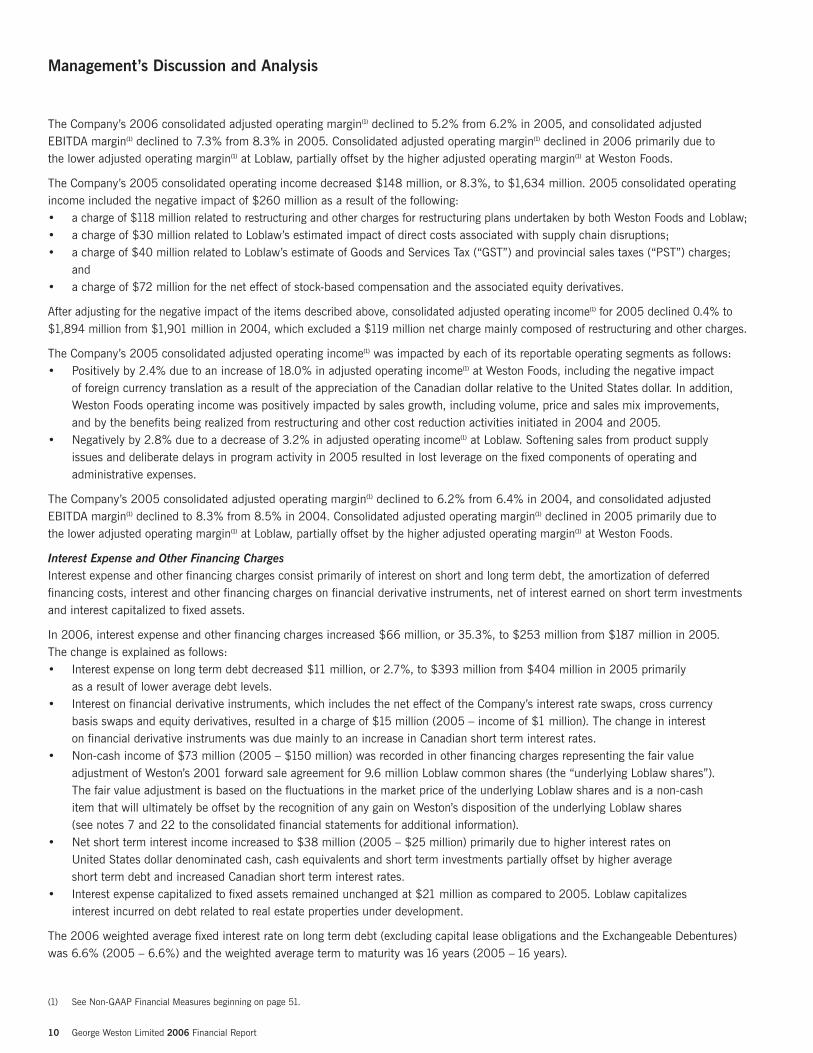
10 George Weston Limited 2006 Financial Report
Management’s Discussion and Analysis
The Company’s 2006 consolidated adjusted operating margin(1) declined to 5.2% from 6.2% in 2005, and consolidated adjustedEBITDA margin(1) declined to 7.3% from 8.3% in 2005. Consolidated adjusted operating margin(1) declined in 2006 primarily due to the lower adjusted operating margin(1) at Loblaw, partially offset by the higher adjusted operating margin(1) at Weston Foods.
The Company’s 2005 consolidated operating income decreased $148 million, or 8.3%, to $1,634 million. 2005 consolidated operatingincome included the negative impact of $260 million as a result of the following:• a charge of $118 million related to restructuring and other charges for restructuring plans undertaken by both Weston Foods and Loblaw;• a charge of $30 million related to Loblaw’s estimated impact of direct costs associated with supply chain disruptions;• a charge of $40 million related to Loblaw’s estimate of Goods and Services Tax (“GST”) and provincial sales taxes (“PST”) charges;
and• a charge of $72 million for the net effect of stock-based compensation and the associated equity derivatives.
After adjusting for the negative impact of the items described above, consolidated adjusted operating income(1) for 2005 declined 0.4% to$1,894 million from $1,901 million in 2004, which excluded a $119 million net charge mainly composed of restructuring and other charges.
The Company’s 2005 consolidated adjusted operating income(1) was impacted by each of its reportable operating segments as follows:• Positively by 2.4% due to an increase of 18.0% in adjusted operating income(1) at Weston Foods, including the negative impact
of foreign currency translation as a result of the appreciation of the Canadian dollar relative to the United States dollar. In addition,Weston Foods operating income was positively impacted by sales growth, including volume, price and sales mix improvements, and by the benefits being realized from restructuring and other cost reduction activities initiated in 2004 and 2005.
• Negatively by 2.8% due to a decrease of 3.2% in adjusted operating income(1) at Loblaw. Softening sales from product supplyissues and deliberate delays in program activity in 2005 resulted in lost leverage on the fixed components of operating andadministrative expenses.
The Company’s 2005 consolidated adjusted operating margin(1) declined to 6.2% from 6.4% in 2004, and consolidated adjustedEBITDA margin(1) declined to 8.3% from 8.5% in 2004. Consolidated adjusted operating margin(1) declined in 2005 primarily due to the lower adjusted operating margin(1) at Loblaw, partially offset by the higher adjusted operating margin(1) at Weston Foods.
Interest Expense and Other Financing ChargesInterest expense and other financing charges consist primarily of interest on short and long term debt, the amortization of deferredfinancing costs, interest and other financing charges on financial derivative instruments, net of interest earned on short term investmentsand interest capitalized to fixed assets.
In 2006, interest expense and other financing charges increased $66 million, or 35.3%, to $253 million from $187 million in 2005.The change is explained as follows:• Interest expense on long term debt decreased $11 million, or 2.7%, to $393 million from $404 million in 2005 primarily
as a result of lower average debt levels.• Interest on financial derivative instruments, which includes the net effect of the Company’s interest rate swaps, cross currency
basis swaps and equity derivatives, resulted in a charge of $15 million (2005 – income of $1 million). The change in interest on financial derivative instruments was due mainly to an increase in Canadian short term interest rates.
• Non-cash income of $73 million (2005 – $150 million) was recorded in other financing charges representing the fair valueadjustment of Weston’s 2001 forward sale agreement for 9.6 million Loblaw common shares (the “underlying Loblaw shares”). The fair value adjustment is based on the fluctuations in the market price of the underlying Loblaw shares and is a non-cash item that will ultimately be offset by the recognition of any gain on Weston’s disposition of the underlying Loblaw shares (see notes 7 and 22 to the consolidated financial statements for additional information).
• Net short term interest income increased to $38 million (2005 – $25 million) primarily due to higher interest rates on United States dollar denominated cash, cash equivalents and short term investments partially offset by higher average short term debt and increased Canadian short term interest rates.
• Interest expense capitalized to fixed assets remained unchanged at $21 million as compared to 2005. Loblaw capitalizes interest incurred on debt related to real estate properties under development.
The 2006 weighted average fixed interest rate on long term debt (excluding capital lease obligations and the Exchangeable Debentures)was 6.6% (2005 – 6.6%) and the weighted average term to maturity was 16 years (2005 – 16 years).
(1) See Non-GAAP Financial Measures beginning on page 51.
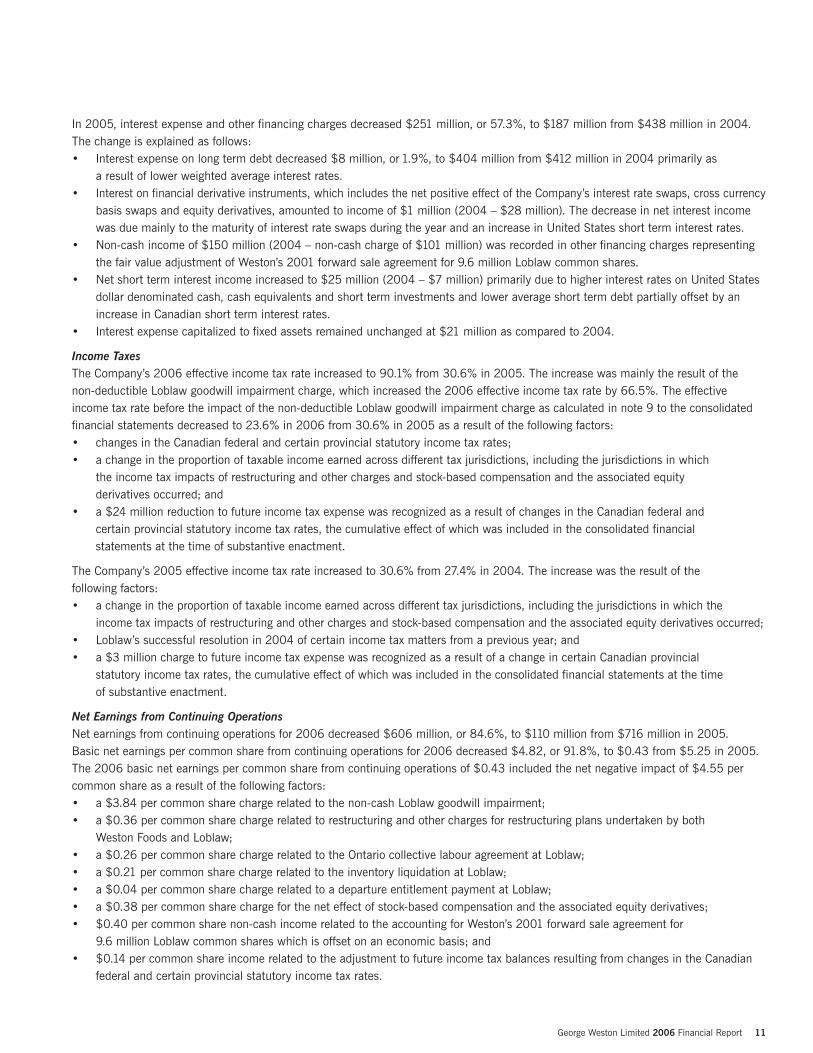
George Weston Limited 2006 Financial Report 11
In 2005, interest expense and other financing charges decreased $251 million, or 57.3%, to $187 million from $438 million in 2004.The change is explained as follows:• Interest expense on long term debt decreased $8 million, or 1.9%, to $404 million from $412 million in 2004 primarily as
a result of lower weighted average interest rates.• Interest on financial derivative instruments, which includes the net positive effect of the Company’s interest rate swaps, cross currency
basis swaps and equity derivatives, amounted to income of $1 million (2004 – $28 million). The decrease in net interest incomewas due mainly to the maturity of interest rate swaps during the year and an increase in United States short term interest rates.
• Non-cash income of $150 million (2004 – non-cash charge of $101 million) was recorded in other financing charges representingthe fair value adjustment of Weston’s 2001 forward sale agreement for 9.6 million Loblaw common shares.
• Net short term interest income increased to $25 million (2004 – $7 million) primarily due to higher interest rates on United Statesdollar denominated cash, cash equivalents and short term investments and lower average short term debt partially offset by anincrease in Canadian short term interest rates.
• Interest expense capitalized to fixed assets remained unchanged at $21 million as compared to 2004.
Income Taxes The Company’s 2006 effective income tax rate increased to 90.1% from 30.6% in 2005. The increase was mainly the result of the non-deductible Loblaw goodwill impairment charge, which increased the 2006 effective income tax rate by 66.5%. The effectiveincome tax rate before the impact of the non-deductible Loblaw goodwill impairment charge as calculated in note 9 to the consolidatedfinancial statements decreased to 23.6% in 2006 from 30.6% in 2005 as a result of the following factors: • changes in the Canadian federal and certain provincial statutory income tax rates;• a change in the proportion of taxable income earned across different tax jurisdictions, including the jurisdictions in which
the income tax impacts of restructuring and other charges and stock-based compensation and the associated equity derivatives occurred; and
• a $24 million reduction to future income tax expense was recognized as a result of changes in the Canadian federal and certain provincial statutory income tax rates, the cumulative effect of which was included in the consolidated financial statements at the time of substantive enactment.
The Company’s 2005 effective income tax rate increased to 30.6% from 27.4% in 2004. The increase was the result of the following factors: • a change in the proportion of taxable income earned across different tax jurisdictions, including the jurisdictions in which the
income tax impacts of restructuring and other charges and stock-based compensation and the associated equity derivatives occurred;• Loblaw’s successful resolution in 2004 of certain income tax matters from a previous year; and• a $3 million charge to future income tax expense was recognized as a result of a change in certain Canadian provincial
statutory income tax rates, the cumulative effect of which was included in the consolidated financial statements at the timeof substantive enactment.
Net Earnings from Continuing OperationsNet earnings from continuing operations for 2006 decreased $606 million, or 84.6%, to $110 million from $716 million in 2005. Basic net earnings per common share from continuing operations for 2006 decreased $4.82, or 91.8%, to $0.43 from $5.25 in 2005.The 2006 basic net earnings per common share from continuing operations of $0.43 included the net negative impact of $4.55 percommon share as a result of the following factors: • a $3.84 per common share charge related to the non-cash Loblaw goodwill impairment;• a $0.36 per common share charge related to restructuring and other charges for restructuring plans undertaken by both
Weston Foods and Loblaw;• a $0.26 per common share charge related to the Ontario collective labour agreement at Loblaw;• a $0.21 per common share charge related to the inventory liquidation at Loblaw;• a $0.04 per common share charge related to a departure entitlement payment at Loblaw;• a $0.38 per common share charge for the net effect of stock-based compensation and the associated equity derivatives;• $0.40 per common share non-cash income related to the accounting for Weston’s 2001 forward sale agreement for
9.6 million Loblaw common shares which is offset on an economic basis; and• $0.14 per common share income related to the adjustment to future income tax balances resulting from changes in the Canadian
federal and certain provincial statutory income tax rates.

After adjusting for the above noted items, Weston’s 2006 adjusted basic net earnings per common share from continuing operations(1)
decreased 11.7% to $4.98 when compared to $5.64 in 2005, which is adjusted as outlined below.
Net earnings from continuing operations for 2005 increased $110 million, or 18.2%, to $716 million from $606 million in 2004.Basic net earnings per common share from continuing operations for 2005 increased $0.76, or 16.9%, to $5.25 from $4.49 in 2004.The 2005 basic net earnings per common share from continuing operations of $5.25 included the net negative impact of $0.39 percommon share as a result of the following factors: • a $0.42 per common share charge related to restructuring and other charges for restructuring plans undertaken by both
Weston Foods and Loblaw;• a $0.09 per common share charge related to Loblaw’s estimated impact of direct costs associated with supply chain disruptions; • a $0.14 per common share charge related to Loblaw’s estimate of GST and PST charges;• a $0.46 per common share charge for the net effect of stock-based compensation and the associated equity derivatives;• $0.77 per common share non-cash income related to the accounting for Weston’s 2001 forward sale agreement for 9.6 million
Loblaw common shares;• a $0.02 per common share charge related to the adjustment to future income tax balances resulting from changes in statutory
income tax rates in certain Canadian provinces; and• a $0.03 per common share charge related to the consolidation of VIEs by Loblaw.
After adjusting for the above noted items, Weston’s 2005 adjusted basic net earnings per common share from continuing operations(1)
was $5.64. This result compares to 2004 adjusted basic net earnings per common share from continuing operations(1) of $5.50 whichwas adjusted for the net negative impact of the impairment of fixed assets and intangible assets associated with the Weston FoodsEntenmann’s operation in the United States, restructuring and other charges, stock-based compensation and the associated equityderivatives, accounting for Weston’s 2001 forward sale agreement for 9.6 million Loblaw common shares and the Loblaw resolution of certain income tax matters from a previous year. Adjusted basic net earnings per common share from continuing operations(1)
for 2005 increased 2.5% compared to 2004.
Discontinued Operations The gain from discontinued operations in 2006 was $11 million compared to a loss of $18 million in 2005. The gain from discontinuedoperations in 2006 is primarily related to the final adjustment to the proceeds associated with the previously completed sale of theremaining discontinued Fisheries operations.
In 2006, the Company reached an agreement to settle claims against it relating to certain alleged misrepresentations and warrantiesarising from the sale of the Company’s forest products business in 1998, including tax related representations and warranties dealingwith years prior to 1998. The Company did not admit any wrongdoing or liability in connection with the settlement. The net impact of this settlement agreement was reflected in the 2005 loss from discontinued operations.
The loss from discontinued operations in 2005 was $18 million compared to a loss of $178 million in 2004. During 2005, the Companycompleted the sales of the remaining discontinued Fisheries operations. As a result of these sales, the Company recorded an after-taxloss of $24 million as a loss from discontinued operations during 2005. The loss from discontinued operations in 2004 of $178 millionrelated to the impairment of assets and the loss on the sale of the operations in Chile in 2004.
For additional information, see note 11 to the consolidated financial statements.
Net Earnings Changes in the Company’s net earnings over the past two years were impacted by the factors described above. The new accountingstandards implemented in 2006 and the resulting impact on the financial position and results of operations are outlined in the AccountingStandards Implemented in 2006 section of this MD&A. The following standards were implemented in 2005:• AcG 15, “Consolidation of Variable Interest Entities”;• EIC Abstract 150, “Determining Whether an Arrangement Contains a Lease”; and• EIC Abstract 154, “Accounting for Pre-Existing Relationships Between the Parties of a Business Combination”.
Changes in minority interest did not have a significant impact on the Company’s net earnings growth rates over the past two years as Weston’s ownership of Loblaw has not changed significantly over this period.
12 George Weston Limited 2006 Financial Report
Management’s Discussion and Analysis
(1) See Non-GAAP Financial Measures beginning on page 51.
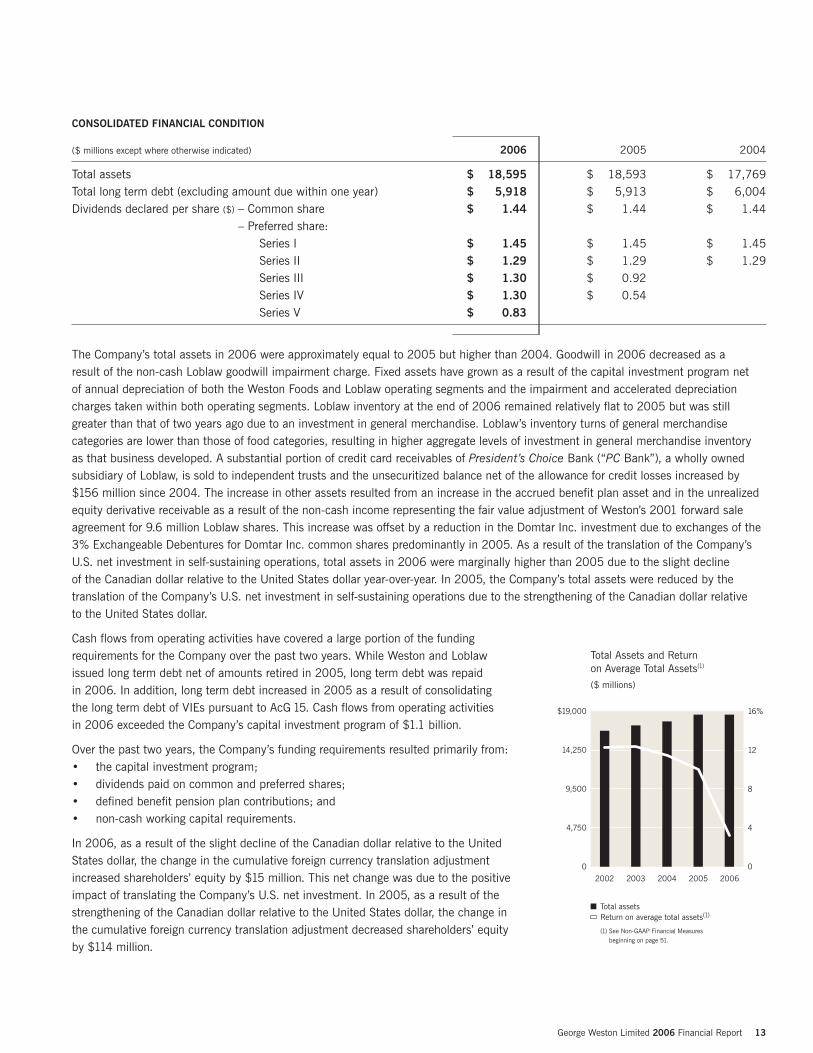
George Weston Limited 2006 Financial Report 13
CONSOLIDATED FINANCIAL CONDITION
($ millions except where otherwise indicated) 2006 2005 2004
Total assets $ 18,595 $ 18,593 $ 17,769Total long term debt (excluding amount due within one year) $ 5,918 $ 5,913 $ 6,004Dividends declared per share ($) – Common share $ 1.44 $ 1.44 $ 1.44
– Preferred share:Series I $ 1.45 $ 1.45 $ 1.45Series II $ 1.29 $ 1.29 $ 1.29Series III $ 1.30 $ 0.92Series IV $ 1.30 $ 0.54Series V $ 0.83
The Company’s total assets in 2006 were approximately equal to 2005 but higher than 2004. Goodwill in 2006 decreased as a result of the non-cash Loblaw goodwill impairment charge. Fixed assets have grown as a result of the capital investment program net of annual depreciation of both the Weston Foods and Loblaw operating segments and the impairment and accelerated depreciationcharges taken within both operating segments. Loblaw inventory at the end of 2006 remained relatively flat to 2005 but was stillgreater than that of two years ago due to an investment in general merchandise. Loblaw’s inventory turns of general merchandisecategories are lower than those of food categories, resulting in higher aggregate levels of investment in general merchandise inventoryas that business developed. A substantial portion of credit card receivables of President’s Choice Bank (“PC Bank”), a wholly ownedsubsidiary of Loblaw, is sold to independent trusts and the unsecuritized balance net of the allowance for credit losses increased by$156 million since 2004. The increase in other assets resulted from an increase in the accrued benefit plan asset and in the unrealizedequity derivative receivable as a result of the non-cash income representing the fair value adjustment of Weston’s 2001 forward saleagreement for 9.6 million Loblaw shares. This increase was offset by a reduction in the Domtar Inc. investment due to exchanges of the3% Exchangeable Debentures for Domtar Inc. common shares predominantly in 2005. As a result of the translation of the Company’sU.S. net investment in self-sustaining operations, total assets in 2006 were marginally higher than 2005 due to the slight decline of the Canadian dollar relative to the United States dollar year-over-year. In 2005, the Company’s total assets were reduced by thetranslation of the Company’s U.S. net investment in self-sustaining operations due to the strengthening of the Canadian dollar relative to the United States dollar.
Cash flows from operating activities have covered a large portion of the fundingrequirements for the Company over the past two years. While Weston and Loblawissued long term debt net of amounts retired in 2005, long term debt was repaid in 2006. In addition, long term debt increased in 2005 as a result of consolidating the long term debt of VIEs pursuant to AcG 15. Cash flows from operating activities in 2006 exceeded the Company’s capital investment program of $1.1 billion.
Over the past two years, the Company’s funding requirements resulted primarily from:• the capital investment program;• dividends paid on common and preferred shares;• defined benefit pension plan contributions; and• non-cash working capital requirements.
In 2006, as a result of the slight decline of the Canadian dollar relative to the UnitedStates dollar, the change in the cumulative foreign currency translation adjustmentincreased shareholders’ equity by $15 million. This net change was due to the positiveimpact of translating the Company’s U.S. net investment. In 2005, as a result of thestrengthening of the Canadian dollar relative to the United States dollar, the change inthe cumulative foreign currency translation adjustment decreased shareholders’ equityby $114 million.
200620052004200320020
4,750
9,500
14,250
$19,000
0
4
8
12
16%
Total assetsReturn on average total assets(1)
(1) See Non-GAAP Financial Measures beginning on page 51.
Total Assets and Return on Average Total Assets(1)
($ millions)
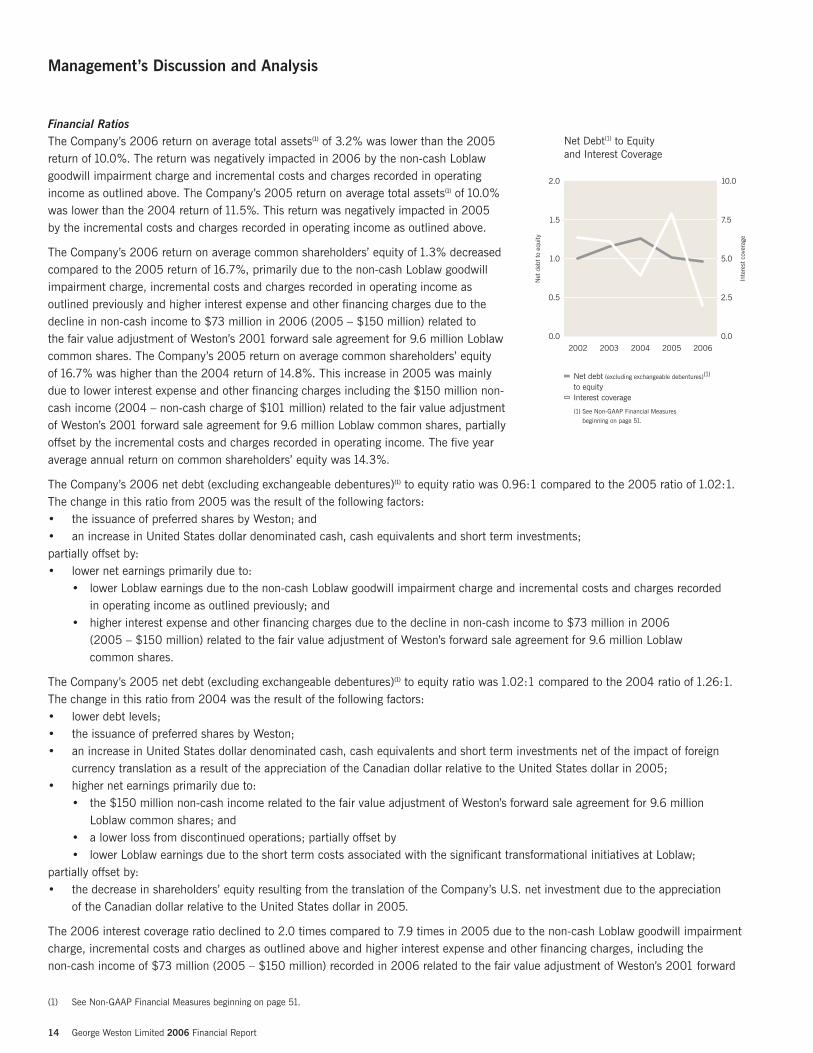
14 George Weston Limited 2006 Financial Report
Management’s Discussion and Analysis
Financial Ratios The Company’s 2006 return on average total assets(1) of 3.2% was lower than the 2005return of 10.0%. The return was negatively impacted in 2006 by the non-cash Loblawgoodwill impairment charge and incremental costs and charges recorded in operatingincome as outlined above. The Company’s 2005 return on average total assets(1) of 10.0%was lower than the 2004 return of 11.5%. This return was negatively impacted in 2005 by the incremental costs and charges recorded in operating income as outlined above.
The Company’s 2006 return on average common shareholders’ equity of 1.3% decreasedcompared to the 2005 return of 16.7%, primarily due to the non-cash Loblaw goodwillimpairment charge, incremental costs and charges recorded in operating income asoutlined previously and higher interest expense and other financing charges due to thedecline in non-cash income to $73 million in 2006 (2005 – $150 million) related to the fair value adjustment of Weston’s 2001 forward sale agreement for 9.6 million Loblawcommon shares. The Company’s 2005 return on average common shareholders’ equity of 16.7% was higher than the 2004 return of 14.8%. This increase in 2005 was mainlydue to lower interest expense and other financing charges including the $150 million non-cash income (2004 – non-cash charge of $101 million) related to the fair value adjustmentof Weston’s 2001 forward sale agreement for 9.6 million Loblaw common shares, partiallyoffset by the incremental costs and charges recorded in operating income. The five year average annual return on common shareholders’ equity was 14.3%.
The Company’s 2006 net debt (excluding exchangeable debentures)(1) to equity ratio was 0.96:1 compared to the 2005 ratio of 1.02:1.The change in this ratio from 2005 was the result of the following factors:• the issuance of preferred shares by Weston; and• an increase in United States dollar denominated cash, cash equivalents and short term investments;partially offset by:• lower net earnings primarily due to:
• lower Loblaw earnings due to the non-cash Loblaw goodwill impairment charge and incremental costs and charges recorded in operating income as outlined previously; and
• higher interest expense and other financing charges due to the decline in non-cash income to $73 million in 2006 (2005 – $150 million) related to the fair value adjustment of Weston’s forward sale agreement for 9.6 million Loblaw common shares.
The Company’s 2005 net debt (excluding exchangeable debentures)(1) to equity ratio was 1.02:1 compared to the 2004 ratio of 1.26:1.The change in this ratio from 2004 was the result of the following factors:• lower debt levels;• the issuance of preferred shares by Weston;• an increase in United States dollar denominated cash, cash equivalents and short term investments net of the impact of foreign
currency translation as a result of the appreciation of the Canadian dollar relative to the United States dollar in 2005;• higher net earnings primarily due to:
• the $150 million non-cash income related to the fair value adjustment of Weston’s forward sale agreement for 9.6 millionLoblaw common shares; and
• a lower loss from discontinued operations; partially offset by• lower Loblaw earnings due to the short term costs associated with the significant transformational initiatives at Loblaw;
partially offset by:• the decrease in shareholders’ equity resulting from the translation of the Company’s U.S. net investment due to the appreciation
of the Canadian dollar relative to the United States dollar in 2005.
The 2006 interest coverage ratio declined to 2.0 times compared to 7.9 times in 2005 due to the non-cash Loblaw goodwill impairmentcharge, incremental costs and charges as outlined above and higher interest expense and other financing charges, including the non-cash income of $73 million (2005 – $150 million) recorded in 2006 related to the fair value adjustment of Weston’s 2001 forward
(1) See Non-GAAP Financial Measures beginning on page 51.
200620052004200320020.0
0.5
1.0
1.5
2.0
Net debt (excluding exchangeable debentures)(1)
to equityInterest coverage
(1) See Non-GAAP Financial Measures beginning on page 51.
Net Debt(1) to Equity and Interest Coverage
Net
deb
t to
equ
ity
Inte
rest
cov
erag
e
0.0
2.5
5.0
7.5
10.0
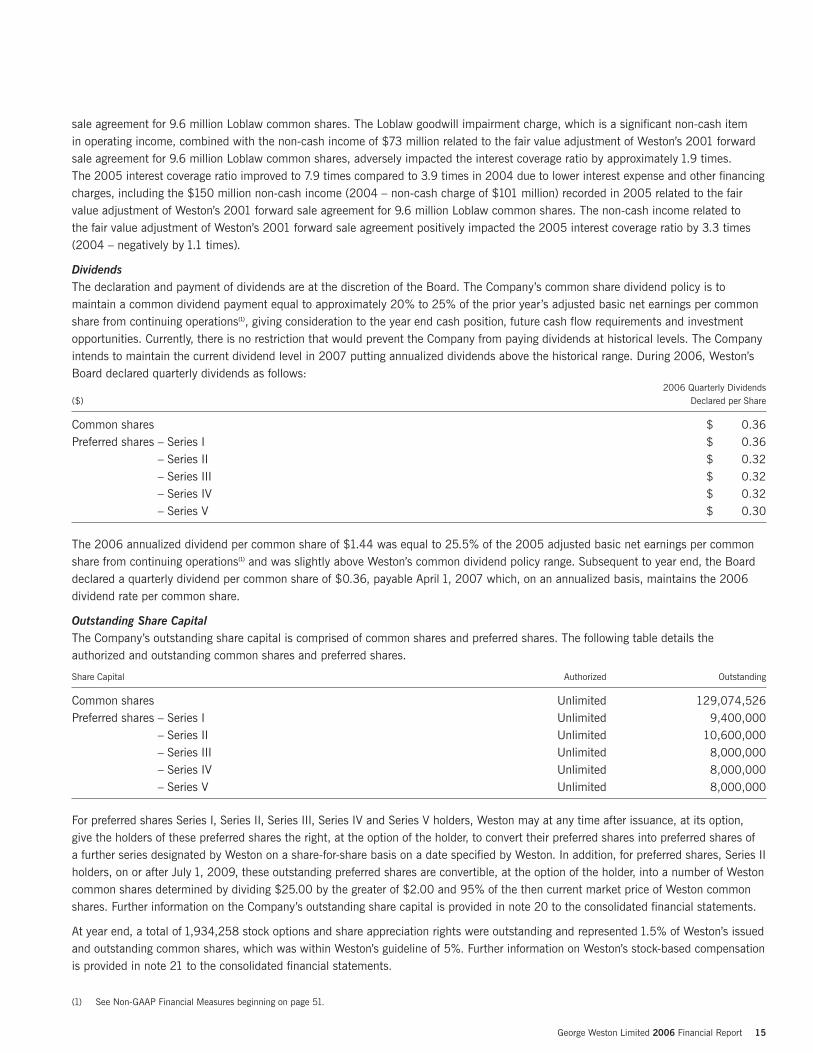
George Weston Limited 2006 Financial Report 15
sale agreement for 9.6 million Loblaw common shares. The Loblaw goodwill impairment charge, which is a significant non-cash item in operating income, combined with the non-cash income of $73 million related to the fair value adjustment of Weston’s 2001 forwardsale agreement for 9.6 million Loblaw common shares, adversely impacted the interest coverage ratio by approximately 1.9 times. The 2005 interest coverage ratio improved to 7.9 times compared to 3.9 times in 2004 due to lower interest expense and other financingcharges, including the $150 million non-cash income (2004 – non-cash charge of $101 million) recorded in 2005 related to the fairvalue adjustment of Weston’s 2001 forward sale agreement for 9.6 million Loblaw common shares. The non-cash income related to the fair value adjustment of Weston’s 2001 forward sale agreement positively impacted the 2005 interest coverage ratio by 3.3 times(2004 – negatively by 1.1 times).
Dividends The declaration and payment of dividends are at the discretion of the Board. The Company’s common share dividend policy is tomaintain a common dividend payment equal to approximately 20% to 25% of the prior year’s adjusted basic net earnings per commonshare from continuing operations(1), giving consideration to the year end cash position, future cash flow requirements and investmentopportunities. Currently, there is no restriction that would prevent the Company from paying dividends at historical levels. The Companyintends to maintain the current dividend level in 2007 putting annualized dividends above the historical range. During 2006, Weston’sBoard declared quarterly dividends as follows:
2006 Quarterly Dividends($) Declared per Share
Common shares $ 0.36Preferred shares – Series I $ 0.36
– Series II $ 0.32– Series III $ 0.32– Series IV $ 0.32– Series V $ 0.30
The 2006 annualized dividend per common share of $1.44 was equal to 25.5% of the 2005 adjusted basic net earnings per commonshare from continuing operations(1) and was slightly above Weston’s common dividend policy range. Subsequent to year end, the Boarddeclared a quarterly dividend per common share of $0.36, payable April 1, 2007 which, on an annualized basis, maintains the 2006dividend rate per common share.
Outstanding Share Capital The Company’s outstanding share capital is comprised of common shares and preferred shares. The following table details theauthorized and outstanding common shares and preferred shares.
Share Capital Authorized Outstanding
Common shares Unlimited 129,074,526Preferred shares – Series I Unlimited 9,400,000
– Series II Unlimited 10,600,000– Series III Unlimited 8,000,000– Series IV Unlimited 8,000,000– Series V Unlimited 8,000,000
For preferred shares Series I, Series II, Series III, Series IV and Series V holders, Weston may at any time after issuance, at its option,give the holders of these preferred shares the right, at the option of the holder, to convert their preferred shares into preferred shares of a further series designated by Weston on a share-for-share basis on a date specified by Weston. In addition, for preferred shares, Series IIholders, on or after July 1, 2009, these outstanding preferred shares are convertible, at the option of the holder, into a number of Westoncommon shares determined by dividing $25.00 by the greater of $2.00 and 95% of the then current market price of Weston commonshares. Further information on the Company’s outstanding share capital is provided in note 20 to the consolidated financial statements.
At year end, a total of 1,934,258 stock options and share appreciation rights were outstanding and represented 1.5% of Weston’s issuedand outstanding common shares, which was within Weston’s guideline of 5%. Further information on Weston’s stock-based compensationis provided in note 21 to the consolidated financial statements.
(1) See Non-GAAP Financial Measures beginning on page 51.
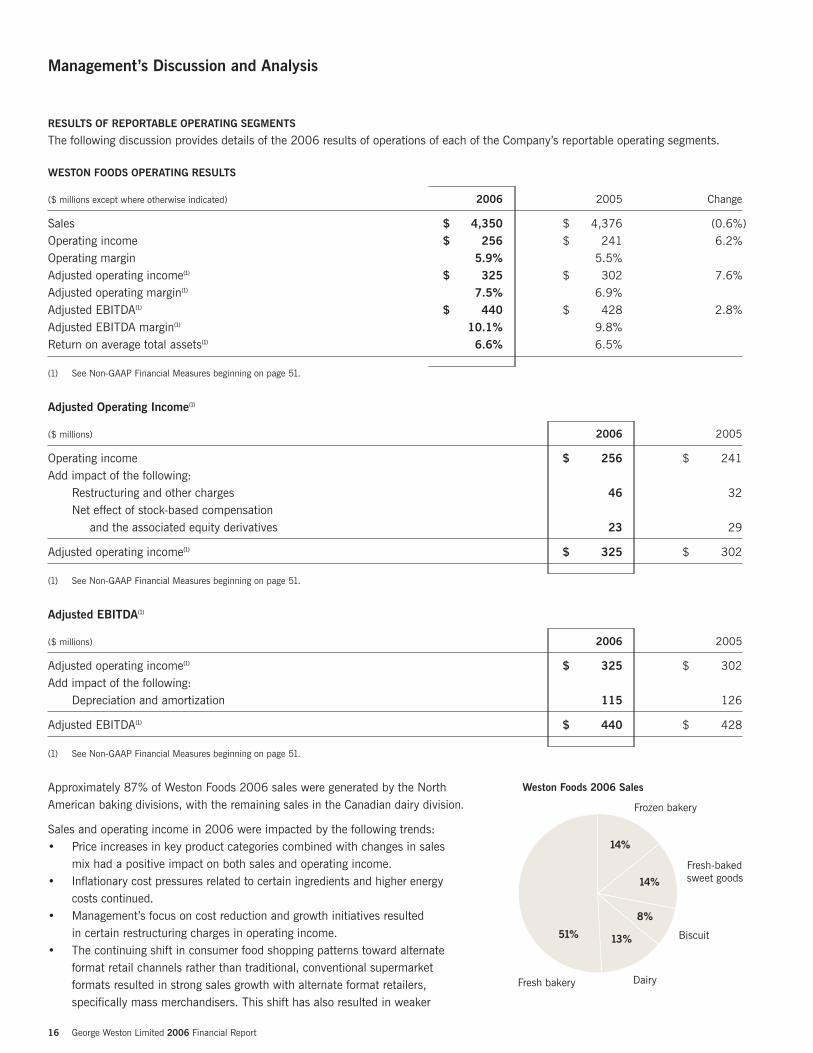
16 George Weston Limited 2006 Financial Report
Management’s Discussion and Analysis
RESULTS OF REPORTABLE OPERATING SEGMENTS
The following discussion provides details of the 2006 results of operations of each of the Company’s reportable operating segments.
WESTON FOODS OPERATING RESULTS
($ millions except where otherwise indicated) 2006 2005 Change
Sales $ 4,350 $ 4,376 (0.6%)Operating income $ 256 $ 241 6.2%Operating margin 5.9% 5.5%Adjusted operating income(1) $ 325 $ 302 7.6%Adjusted operating margin(1) 7.5% 6.9%Adjusted EBITDA(1) $ 440 $ 428 2.8%Adjusted EBITDA margin(1) 10.1% 9.8%Return on average total assets(1) 6.6% 6.5%
(1) See Non-GAAP Financial Measures beginning on page 51.
Adjusted Operating Income(1)
($ millions) 2006 2005
Operating income $ 256 $ 241Add impact of the following:
Restructuring and other charges 46 32Net effect of stock-based compensation
and the associated equity derivatives 23 29
Adjusted operating income(1) $ 325 $ 302
(1) See Non-GAAP Financial Measures beginning on page 51.
Adjusted EBITDA(1)
($ millions) 2006 2005
Adjusted operating income(1) $ 325 $ 302Add impact of the following:
Depreciation and amortization 115 126
Adjusted EBITDA(1) $ 440 $ 428
(1) See Non-GAAP Financial Measures beginning on page 51.
Approximately 87% of Weston Foods 2006 sales were generated by the NorthAmerican baking divisions, with the remaining sales in the Canadian dairy division.
Sales and operating income in 2006 were impacted by the following trends:• Price increases in key product categories combined with changes in sales
mix had a positive impact on both sales and operating income.• Inflationary cost pressures related to certain ingredients and higher energy
costs continued.• Management’s focus on cost reduction and growth initiatives resulted
in certain restructuring charges in operating income.• The continuing shift in consumer food shopping patterns toward alternate
format retail channels rather than traditional, conventional supermarket formats resulted in strong sales growth with alternate format retailers, specifically mass merchandisers. This shift has also resulted in weaker
Weston Foods 2006 Sales
Biscuit
Frozen bakery
Fresh-baked sweet goods
Fresh bakery Dairy
8%
13%
14%
14%
51%
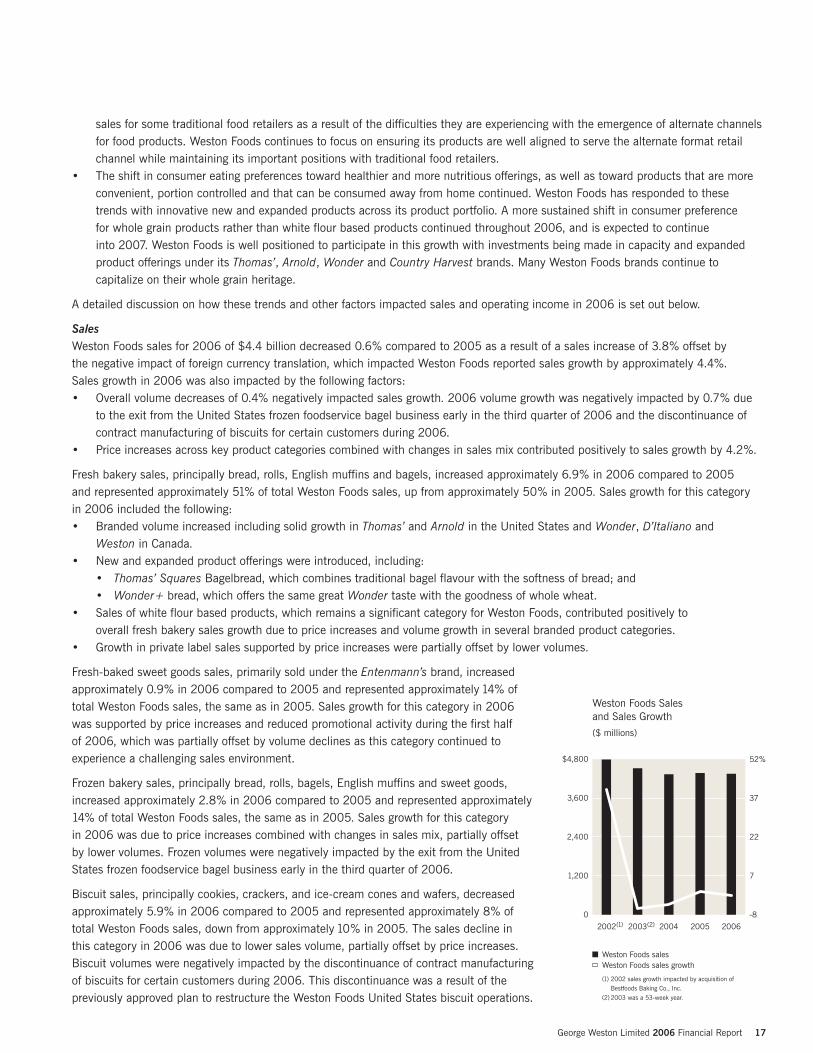
George Weston Limited 2006 Financial Report 17
sales for some traditional food retailers as a result of the difficulties they are experiencing with the emergence of alternate channelsfor food products. Weston Foods continues to focus on ensuring its products are well aligned to serve the alternate format retailchannel while maintaining its important positions with traditional food retailers.
• The shift in consumer eating preferences toward healthier and more nutritious offerings, as well as toward products that are moreconvenient, portion controlled and that can be consumed away from home continued. Weston Foods has responded to these trends with innovative new and expanded products across its product portfolio. A more sustained shift in consumer preference for whole grain products rather than white flour based products continued throughout 2006, and is expected to continue into 2007. Weston Foods is well positioned to participate in this growth with investments being made in capacity and expandedproduct offerings under its Thomas’, Arnold, Wonder and Country Harvest brands. Many Weston Foods brands continue tocapitalize on their whole grain heritage.
A detailed discussion on how these trends and other factors impacted sales and operating income in 2006 is set out below.
SalesWeston Foods sales for 2006 of $4.4 billion decreased 0.6% compared to 2005 as a result of a sales increase of 3.8% offset by the negative impact of foreign currency translation, which impacted Weston Foods reported sales growth by approximately 4.4%. Sales growth in 2006 was also impacted by the following factors:• Overall volume decreases of 0.4% negatively impacted sales growth. 2006 volume growth was negatively impacted by 0.7% due
to the exit from the United States frozen foodservice bagel business early in the third quarter of 2006 and the discontinuance ofcontract manufacturing of biscuits for certain customers during 2006.
• Price increases across key product categories combined with changes in sales mix contributed positively to sales growth by 4.2%.
Fresh bakery sales, principally bread, rolls, English muffins and bagels, increased approximately 6.9% in 2006 compared to 2005 and represented approximately 51% of total Weston Foods sales, up from approximately 50% in 2005. Sales growth for this category in 2006 included the following:• Branded volume increased including solid growth in Thomas’ and Arnold in the United States and Wonder, D’Italiano and
Weston in Canada.• New and expanded product offerings were introduced, including:
• Thomas’ Squares Bagelbread, which combines traditional bagel flavour with the softness of bread; and• Wonder+ bread, which offers the same great Wonder taste with the goodness of whole wheat.
• Sales of white flour based products, which remains a significant category for Weston Foods, contributed positively to overall fresh bakery sales growth due to price increases and volume growth in several branded product categories.
• Growth in private label sales supported by price increases were partially offset by lower volumes.
Fresh-baked sweet goods sales, primarily sold under the Entenmann’s brand, increased approximately 0.9% in 2006 compared to 2005 and represented approximately 14% oftotal Weston Foods sales, the same as in 2005. Sales growth for this category in 2006 was supported by price increases and reduced promotional activity during the first half of 2006, which was partially offset by volume declines as this category continued toexperience a challenging sales environment.
Frozen bakery sales, principally bread, rolls, bagels, English muffins and sweet goods,increased approximately 2.8% in 2006 compared to 2005 and represented approximately14% of total Weston Foods sales, the same as in 2005. Sales growth for this category in 2006 was due to price increases combined with changes in sales mix, partially offsetby lower volumes. Frozen volumes were negatively impacted by the exit from the UnitedStates frozen foodservice bagel business early in the third quarter of 2006.
Biscuit sales, principally cookies, crackers, and ice-cream cones and wafers, decreasedapproximately 5.9% in 2006 compared to 2005 and represented approximately 8% of total Weston Foods sales, down from approximately 10% in 2005. The sales decline in this category in 2006 was due to lower sales volume, partially offset by price increases.Biscuit volumes were negatively impacted by the discontinuance of contract manufacturingof biscuits for certain customers during 2006. This discontinuance was a result of thepreviously approved plan to restructure the Weston Foods United States biscuit operations.
2006200520042003(2)2002(1)0
1,200
2,400
3,600
$4,800
-8
7
22
37
52%
Weston Foods Sales and Sales Growth
($ millions)
Weston Foods salesWeston Foods sales growth
(1) 2002 sales growth impacted by acquisition of Bestfoods Baking Co., Inc.(2) 2003 was a 53-week year.
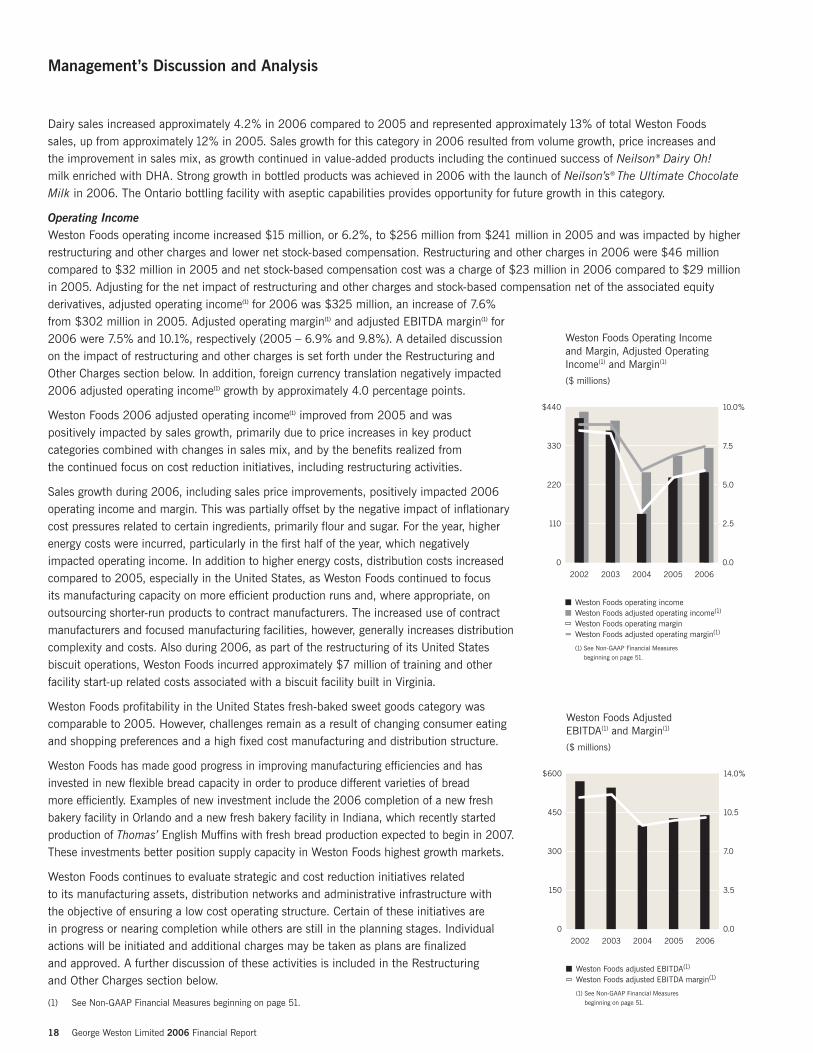
18 George Weston Limited 2006 Financial Report
Management’s Discussion and Analysis
Dairy sales increased approximately 4.2% in 2006 compared to 2005 and represented approximately 13% of total Weston Foods sales, up from approximately 12% in 2005. Sales growth for this category in 2006 resulted from volume growth, price increases and the improvement in sales mix, as growth continued in value-added products including the continued success of Neilson® Dairy Oh!milk enriched with DHA. Strong growth in bottled products was achieved in 2006 with the launch of Neilson’s® The Ultimate ChocolateMilk in 2006. The Ontario bottling facility with aseptic capabilities provides opportunity for future growth in this category.
Operating IncomeWeston Foods operating income increased $15 million, or 6.2%, to $256 million from $241 million in 2005 and was impacted by higherrestructuring and other charges and lower net stock-based compensation. Restructuring and other charges in 2006 were $46 millioncompared to $32 million in 2005 and net stock-based compensation cost was a charge of $23 million in 2006 compared to $29 millionin 2005. Adjusting for the net impact of restructuring and other charges and stock-based compensation net of the associated equityderivatives, adjusted operating income(1) for 2006 was $325 million, an increase of 7.6%from $302 million in 2005. Adjusted operating margin(1) and adjusted EBITDA margin(1) for2006 were 7.5% and 10.1%, respectively (2005 – 6.9% and 9.8%). A detailed discussionon the impact of restructuring and other charges is set forth under the Restructuring andOther Charges section below. In addition, foreign currency translation negatively impacted2006 adjusted operating income(1) growth by approximately 4.0 percentage points.
Weston Foods 2006 adjusted operating income(1) improved from 2005 and was positively impacted by sales growth, primarily due to price increases in key productcategories combined with changes in sales mix, and by the benefits realized from the continued focus on cost reduction initiatives, including restructuring activities.
Sales growth during 2006, including sales price improvements, positively impacted 2006operating income and margin. This was partially offset by the negative impact of inflationarycost pressures related to certain ingredients, primarily flour and sugar. For the year, higherenergy costs were incurred, particularly in the first half of the year, which negativelyimpacted operating income. In addition to higher energy costs, distribution costs increasedcompared to 2005, especially in the United States, as Weston Foods continued to focus its manufacturing capacity on more efficient production runs and, where appropriate, onoutsourcing shorter-run products to contract manufacturers. The increased use of contractmanufacturers and focused manufacturing facilities, however, generally increases distributioncomplexity and costs. Also during 2006, as part of the restructuring of its United Statesbiscuit operations, Weston Foods incurred approximately $7 million of training and otherfacility start-up related costs associated with a biscuit facility built in Virginia.
Weston Foods profitability in the United States fresh-baked sweet goods category wascomparable to 2005. However, challenges remain as a result of changing consumer eatingand shopping preferences and a high fixed cost manufacturing and distribution structure.
Weston Foods has made good progress in improving manufacturing efficiencies and hasinvested in new flexible bread capacity in order to produce different varieties of bread more efficiently. Examples of new investment include the 2006 completion of a new freshbakery facility in Orlando and a new fresh bakery facility in Indiana, which recently startedproduction of Thomas’ English Muffins with fresh bread production expected to begin in 2007.These investments better position supply capacity in Weston Foods highest growth markets.
Weston Foods continues to evaluate strategic and cost reduction initiatives related to its manufacturing assets, distribution networks and administrative infrastructure with the objective of ensuring a low cost operating structure. Certain of these initiatives are in progress or nearing completion while others are still in the planning stages. Individualactions will be initiated and additional charges may be taken as plans are finalized and approved. A further discussion of these activities is included in the Restructuring and Other Charges section below.
(1) See Non-GAAP Financial Measures beginning on page 51.
20062005200420032002
Weston Foods Operating Income and Margin, Adjusted Operating Income(1) and Margin(1)
($ millions)
Weston Foods operating incomeWeston Foods adjusted operating income(1)
Weston Foods operating marginWeston Foods adjusted operating margin(1)
(1) See Non-GAAP Financial Measures beginning on page 51.
0
110
220
330
$440
0.0
2.5
5.0
7.5
10.0%
20062005200420032002
Weston Foods Adjusted EBITDA(1) and Margin(1)
($ millions)
Weston Foods adjusted EBITDA(1)
Weston Foods adjusted EBITDA margin(1)
(1) See Non-GAAP Financial Measures beginning on page 51.
0
150
300
450
$600
0.0
3.5
7.0
10.5
14.0%
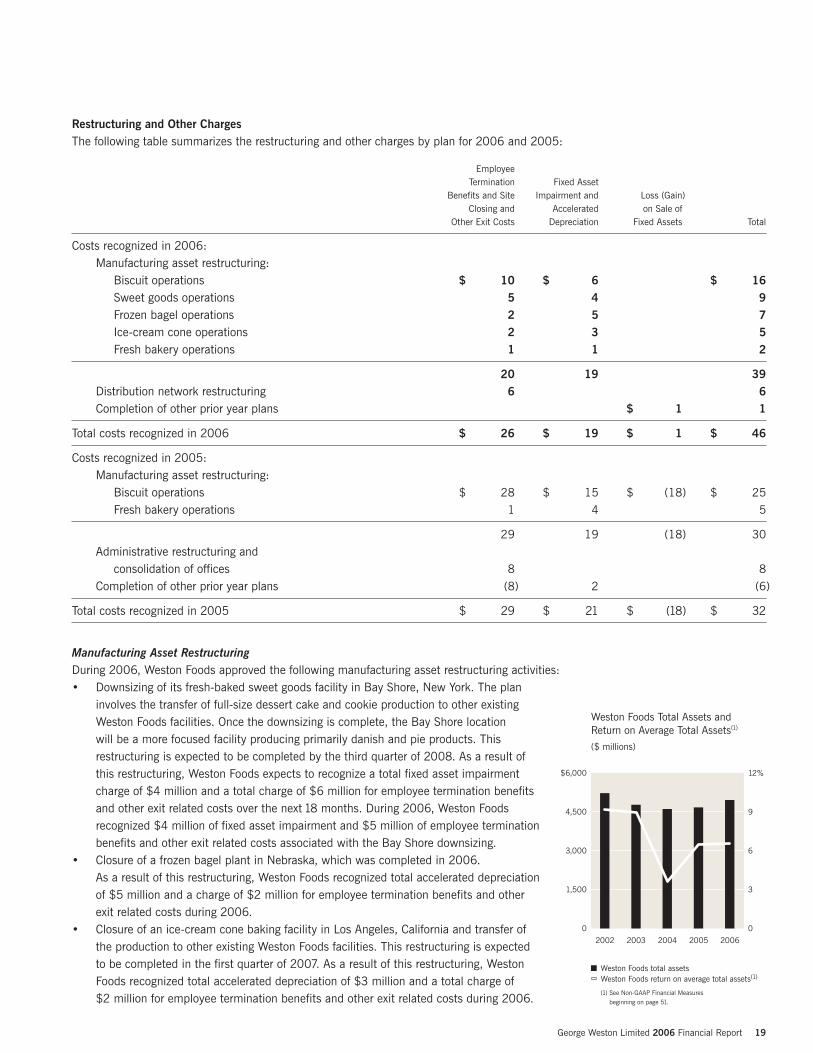
George Weston Limited 2006 Financial Report 19
Restructuring and Other ChargesThe following table summarizes the restructuring and other charges by plan for 2006 and 2005:
EmployeeTermination Fixed Asset
Benefits and Site Impairment and Loss (Gain)Closing and Accelerated on Sale of
Other Exit Costs Depreciation Fixed Assets Total
Costs recognized in 2006:Manufacturing asset restructuring:
Biscuit operations $ 10 $ 6 $ 16Sweet goods operations 5 4 9Frozen bagel operations 2 5 7Ice-cream cone operations 2 3 5Fresh bakery operations 1 1 2
20 19 39Distribution network restructuring 6 6Completion of other prior year plans $ 1 1
Total costs recognized in 2006 $ 26 $ 19 $ 1 $ 46
Costs recognized in 2005:Manufacturing asset restructuring:
Biscuit operations $ 28 $ 15 $ (18) $ 25Fresh bakery operations 1 4 5
29 19 (18) 30Administrative restructuring and
consolidation of offices 8 8Completion of other prior year plans (8) 2 (6)
Total costs recognized in 2005 $ 29 $ 21 $ (18) $ 32
Manufacturing Asset RestructuringDuring 2006, Weston Foods approved the following manufacturing asset restructuring activities:• Downsizing of its fresh-baked sweet goods facility in Bay Shore, New York. The plan
involves the transfer of full-size dessert cake and cookie production to other existingWeston Foods facilities. Once the downsizing is complete, the Bay Shore location will be a more focused facility producing primarily danish and pie products. Thisrestructuring is expected to be completed by the third quarter of 2008. As a result ofthis restructuring, Weston Foods expects to recognize a total fixed asset impairmentcharge of $4 million and a total charge of $6 million for employee termination benefitsand other exit related costs over the next 18 months. During 2006, Weston Foodsrecognized $4 million of fixed asset impairment and $5 million of employee terminationbenefits and other exit related costs associated with the Bay Shore downsizing.
• Closure of a frozen bagel plant in Nebraska, which was completed in 2006. As a result of this restructuring, Weston Foods recognized total accelerated depreciationof $5 million and a charge of $2 million for employee termination benefits and otherexit related costs during 2006.
• Closure of an ice-cream cone baking facility in Los Angeles, California and transfer ofthe production to other existing Weston Foods facilities. This restructuring is expectedto be completed in the first quarter of 2007. As a result of this restructuring, WestonFoods recognized total accelerated depreciation of $3 million and a total charge of $2 million for employee termination benefits and other exit related costs during 2006.
20062005200420032002
Weston Foods Total Assets and Return on Average Total Assets(1)
($ millions)
Weston Foods total assetsWeston Foods return on average total assets(1)
(1) See Non-GAAP Financial Measures beginning on page 51.
0
1,500
3,000
4,500
$6,000
0
3
6
9
12%
20 George Weston Limited 2006 Financial Report
Management’s Discussion and Analysis
• Closure of a fresh bakery manufacturing facility in Quebec. This manufacturing facility closure is expected to be completed by theend of 2007. During 2006, Weston Foods recognized $1 million of accelerated depreciation and $1 million of employee terminationbenefits and other exit related costs. In addition, Weston Foods expects to recognize an additional $1 million of other exit relatedcosts in 2007.
During 2005, Weston Foods approved a plan to restructure its United States biscuit operations. This plan included the closure of two biscuit facilities located in Elizabeth, New Jersey and Richmond, Virginia by the end of 2006 with the majority of the productionrelocated to a new facility in Virginia and an existing Weston Foods facility already operating in South Dakota. The sale and lease-backof these two facilities was completed in 2005. All manufacturing activities ceased in the Elizabeth, New Jersey and Richmond, Virginiafacilities by the end of 2006. During 2006, Weston Foods recognized $6 million (2005 – $15 million) of accelerated depreciation, $10 million (2005 – $28 million) of employee termination benefits and other exit related costs and in 2005 a gain of $18 million relatedto the sale and lease-back of the two facilities. At the end of 2006, total charges of $21 million of accelerated depreciation and $38 million of employee termination benefits and other exit related costs have been recognized on a cumulative basis over 2005 and 2006 related to this restructuring plan.
Also in 2005, Weston Foods made further progress on its objective of simplifying and removing costs from its existing fresh bakerymanufacturing processes and approved plans to exit certain bread and roll manufacturing lines in the United States. All productionassociated with these lines was transferred to other Weston Foods manufacturing facilities or third-party producers by the end of 2005.As a result of this decision, Weston Foods recognized in 2005, $4 million of accelerated depreciation and $1 million of employeetermination benefits and other exit related costs related to this restructuring plan.
Subsequent to year end 2006, Weston Foods approved a plan to exit certain bread and roll manufacturing lines in the Southeast United States. All production associated with these lines will be transferred to third-party producers or other Weston Foodsmanufacturing facilities. As a result of this decision, Weston Foods expects to recognize approximately $5 million of accelerateddepreciation and $1 million of employee termination benefits and other exit related costs in the first quarter of 2007.
Distribution Network RestructuringDuring 2006, Weston Foods approved a plan to restructure a portion of its distribution network in Quebec. As a result of this restructuring,Weston Foods expects to recognize a total charge of $7 million for employee termination benefits and other exit related costs and isexpected to be completed by the end of 2007. During 2006, Weston Foods recognized a charge of $6 million for employee terminationbenefits and other exit related costs pursuant to this plan.
Administrative Restructuring and Consolidation of OfficesDuring 2005, Weston Foods approved plans to consolidate, relocate and restructure certain of its administrative offices within North America, which resulted in an $8 million restructuring charge in that year.
Completion of Other Prior Year PlansDuring 2006, Weston Foods recognized a loss on the sale of fixed assets of $1 million related to a restructuring plan approved prior to 2006.
During 2005, Weston Foods recognized restructuring income of $8 million, primarily related to the reversal of accruals no longerrequired and a charge for accelerated depreciation of $2 million related to restructuring plans approved prior to 2005.
Further information on Weston Foods restructuring and other charges is provided in note 4 to the consolidated financial statements.
In 2007, Weston Foods expects to experience improvements in sales and adjusted operating income(1), on a year-over-year basis, as a result of improvements in volume and pricing and as the benefits of restructuring and cost reduction activities continue to be realized.Operating margins are expected to continue to be pressured by underlying cost inflation.
(1) See Non-GAAP Financial Measures beginning on page 51.

George Weston Limited 2006 Financial Report 21
LOBLAW OPERATING RESULTS
($ millions except where otherwise indicated) 2006 2005(2) Change
Sales $ 28,640 $ 27,627 3.7%Sales excluding the impact of VIEs(1) $ 28,257 $ 27,212 3.8%Operating income $ 281 $ 1,393 (79.8%)Operating margin 1.0% 5.0%Adjusted operating income(1) $ 1,318 $ 1,592 (17.2%)Adjusted operating margin(1) 4.7% 5.9%Adjusted EBITDA(1) $ 1,884 $ 2,124 (11.3%)Adjusted EBITDA margin(1) 6.7% 7.8%Return on average total assets(1) 2.2% 11.0%
(1) See Non-GAAP Financial Measures beginning on page 51.(2) During 2006, the Company implemented EIC 156 on a retroactive basis. Accordingly certain sales incentives paid by Loblaw to independent franchisees, associates
and independent accounts for prior years have been reclassified between sales and cost of sales, selling and administrative expenses. For a further discussion, see the Accounting Standards Implemented in 2006 section included in this MD&A.
Sales and Sales Growth Excluding the Impact of VIEs(1)
($ millions except where otherwise indicated) 2006 2005(2)
Total sales $ 28,640 $ 27,627Less: Sales attributable to the consolidation of VIEs 383 415
Sales excluding the impact of VIEs(1) $ 28,257 $ 27,212
Total sales growth 3.7%Less: Impact on sales growth attributable to the consolidation of VIEs (0.1%)
Sales growth excluding the impact of VIEs(1) 3.8%
(1) See Non-GAAP Financial Measures beginning on page 51.(2) During 2006, the Company implemented EIC 156 on a retroactive basis. Accordingly certain sales incentives paid by Loblaw to independent franchisees, associates
and independent accounts for prior years have been reclassified between sales and cost of sales, selling and administrative expenses. For a further discussion, see the Accounting Standards Implemented in 2006 section included in this MD&A.
Adjusted Operating Income(1)
($ millions) 2006 2005
Operating income $ 281 $ 1,393Add (deduct) impact of the following:
Goodwill impairment charge 800Restructuring and other charges 44 86Ontario collective labour agreement 84Inventory liquidation 68Departure entitlement charge 12Direct costs associated with supply chain disruptions 30Goods and Services Tax and provincial sales taxes 40Net effect of stock-based compensation and the associated equity derivatives 37 43VIEs (8)
Adjusted operating income(1) $ 1,318 $ 1,592
(1) See Non-GAAP Financial Measures beginning on page 51.
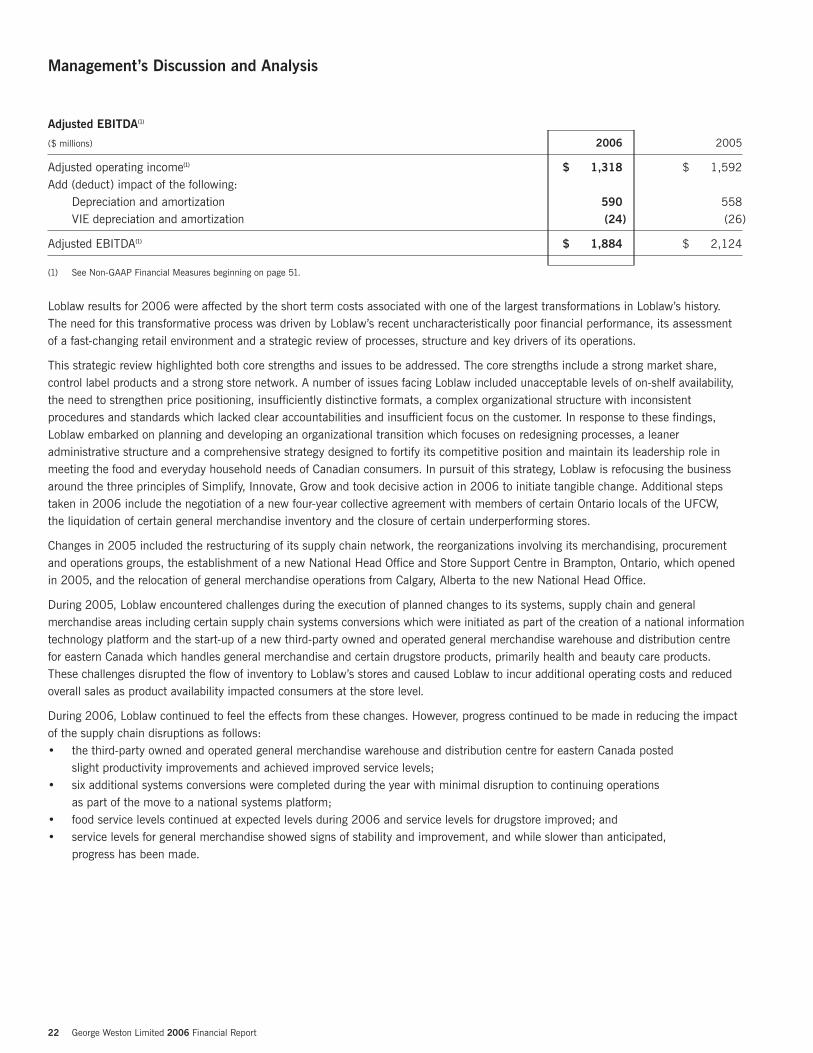
22 George Weston Limited 2006 Financial Report
Management’s Discussion and Analysis
Adjusted EBITDA(1)
($ millions) 2006 2005
Adjusted operating income(1) $ 1,318 $ 1,592Add (deduct) impact of the following:
Depreciation and amortization 590 558VIE depreciation and amortization (24) (26)
Adjusted EBITDA(1) $ 1,884 $ 2,124
(1) See Non-GAAP Financial Measures beginning on page 51.
Loblaw results for 2006 were affected by the short term costs associated with one of the largest transformations in Loblaw’s history.The need for this transformative process was driven by Loblaw’s recent uncharacteristically poor financial performance, its assessmentof a fast-changing retail environment and a strategic review of processes, structure and key drivers of its operations.
This strategic review highlighted both core strengths and issues to be addressed. The core strengths include a strong market share,control label products and a strong store network. A number of issues facing Loblaw included unacceptable levels of on-shelf availability,the need to strengthen price positioning, insufficiently distinctive formats, a complex organizational structure with inconsistentprocedures and standards which lacked clear accountabilities and insufficient focus on the customer. In response to these findings,Loblaw embarked on planning and developing an organizational transition which focuses on redesigning processes, a leaneradministrative structure and a comprehensive strategy designed to fortify its competitive position and maintain its leadership role inmeeting the food and everyday household needs of Canadian consumers. In pursuit of this strategy, Loblaw is refocusing the businessaround the three principles of Simplify, Innovate, Grow and took decisive action in 2006 to initiate tangible change. Additional stepstaken in 2006 include the negotiation of a new four-year collective agreement with members of certain Ontario locals of the UFCW, the liquidation of certain general merchandise inventory and the closure of certain underperforming stores.
Changes in 2005 included the restructuring of its supply chain network, the reorganizations involving its merchandising, procurementand operations groups, the establishment of a new National Head Office and Store Support Centre in Brampton, Ontario, which openedin 2005, and the relocation of general merchandise operations from Calgary, Alberta to the new National Head Office.
During 2005, Loblaw encountered challenges during the execution of planned changes to its systems, supply chain and generalmerchandise areas including certain supply chain systems conversions which were initiated as part of the creation of a national informationtechnology platform and the start-up of a new third-party owned and operated general merchandise warehouse and distribution centrefor eastern Canada which handles general merchandise and certain drugstore products, primarily health and beauty care products. These challenges disrupted the flow of inventory to Loblaw’s stores and caused Loblaw to incur additional operating costs and reducedoverall sales as product availability impacted consumers at the store level.
During 2006, Loblaw continued to feel the effects from these changes. However, progress continued to be made in reducing the impactof the supply chain disruptions as follows:• the third-party owned and operated general merchandise warehouse and distribution centre for eastern Canada posted
slight productivity improvements and achieved improved service levels;• six additional systems conversions were completed during the year with minimal disruption to continuing operations
as part of the move to a national systems platform;• food service levels continued at expected levels during 2006 and service levels for drugstore improved; and• service levels for general merchandise showed signs of stability and improvement, and while slower than anticipated,
progress has been made.
George Weston Limited 2006 Financial Report 23
Sales Full year sales in 2006 increased 3.7% to $28.6 billion from $27.6 billion last year,including a decrease of 0.1% or $32 million in sales relating to the consolidation of certainindependent franchisees as required by AcG 15. In 2006, sales excluding the impact ofVIEs(1) increased by $1 billion or 3.8% over last year.
The following factors further explain the major components in the change in sales over the prior year: • food, general merchandise and drugstore sales posted gains over the prior year
across all regions of the country;• significant sales growth from the Real Canadian Superstore program in Ontario; • same-store sales growth of approximately 0.8% compared to 0.2% in 2005; • a decline in tobacco sales negatively impacted sales and same-store sales by
approximately 1.2%; • national food price inflation as measured by CPI was approximately 2.3% for the
year, compared to approximately 2.0% for 2005 with variances by region; Loblaw’scalculation of food price inflation, which considers Loblaw-specific product mix andpricing strategy, was reasonably consistent with that of CPI;
• an increase in net retail square footage of 1.2 million square feet or 2.5% due to thenet effect of the opening of 37 new corporate and franchised stores and the closureof 33 stores inclusive of stores which underwent conversions and major expansions;
• sales per corporate store increased to $33 million in 2006 from $32 million in 2005 reflecting the introduction of larger stores which are expected to becomeultimately more productive; and
• sales per average square foot of corporate stores of $585 in 2006 increased from $579 in 2005 as a result of an increase in sales which outpaced the increase in net retail square footage.
Sales of control label products for 2006 amounted to $6.2 billion compared to $5.9 billion in 2005. Control label penetration, which is measured as control label retail sales as a percentage of total retail sales, was 22.9% for 2006, compared to 22.4% for 2005.Loblaw introduced over 2,000 new control label products in 2006, including 1,400 new general merchandise products. Loblaw’s controllabel program, which includes President’s Choice, PC, President’s Choice Organics, President’s Choice Blue Menu, President’s ChoiceMini Chefs, no name, Joe Fresh Style, Club Pack, President’s Choice GREEN, EXACT, Teddy’s Choice and Life@Home, providesadditional sales growth potential.
Loblaw expects that the following initiatives, coupled with continued focus on value-for-money, promotions and advertising whereappropriate, will generate continued sales growth over the next few years: • focus on on-shelf availability of product through an enhancement of customer focus and supply chain, and stronger
store processes; • restoring innovation as a competitive advantage both for control label products as well as unique environments
in each retail format;• refining three distinctive retail formats: Superstore, Great Food and Hard Discount, and making the Real Canadian Superstore
the key platform for growth;• increasing the number of stores carrying the Joe Fresh Style apparel offering;• emphasizing a fresh first focus by raising presentation and quality standards; and• training of employees to ensure they are focused on meeting customer needs.
200620052004
Loblaw Sales and Sales Growth
($ millions)
Loblaw salesLoblaw sales excluding the impact of VIEs(1)
Loblaw sales growthLoblaw sales growth excluding the impact of VIEs(1)
(1) See Non-GAAP Financial Measures beginning on page 51.(2) 2003 was a 53-week year.
0
7,500
15,000
22,500
$30,000
0.0
2.5
5.0
7.5
10.0%
2002 2003(2)
(1) See Non-GAAP Financial Measures beginning on page 51.

24 George Weston Limited 2006 Financial Report
Management’s Discussion and Analysis
Operating IncomeLoblaw operating income for 2006 decreased $1,112 million, or 79.8%, to $281 million resulting in a decline in operating margin to1.0% in 2006 from 5.0% in 2005. Operating income in both 2006 and 2005 was adversely affected by a number of specific items as outlined below:• A non-cash goodwill impairment charge of $800 million related to the goodwill established on the acquisition of Provigo Inc.
in 1998 was recorded in 2006. The determination that the fair value of goodwill was less than its carrying value resulted from a decline in market multiples, both from an industry and Loblaw perspective, and a reduction of fair value as determined using thediscounted cash flow methodology, incorporating both current Loblaw and market assumptions, which in combination resulted inthe goodwill impairment. This non-cash goodwill impairment charge recorded in 2006 is expected to be adjusted if necessary in the first half of 2007. Loblaw expects no income tax deduction from this charge. A further discussion regarding the non-cashgoodwill impairment charge can be found in the Critical Accounting Estimates section of this MD&A.
• During 2006, members of certain Ontario locals of the UFCW ratified a new four-year collective agreement which enables Loblaw to convert 44 stores in Ontario to theReal Canadian Superstore banner or food stores with equivalent labour economics,and the flexibility to invest in additional store labour where appropriate. As a result of securing this agreement, Loblaw recognized a one-time charge of $84 million in 2006, including a $36 million amount due to a multi-employer pension plan and a payment of $38 million which was due upon ratification. Loblaw expects thisagreement to generate future economic benefits and to provide increased operatingefficiencies, on a store by store basis, in a critical era of intensifying competition.
• As part of management’s review of inventory levels, certain excess inventory,primarily general merchandise was identified. Management’s decision to proceedwith the liquidation of this inventory resulted in a $68 million charge in 2006reflecting the write-down of inventory to expected net recoverable values net of theassociated costs of facilitating the disposition incurred to date. In addition, higherthan normal mark downs in the range of $15 million to $20 million were taken inorder to clear some of this excess inventory through stores particularly in the lastquarter of the year.
• A $12 million charge relating to the departure of John A. Lederer from the position ofPresident and Director of Loblaw was recorded in 2006. An additional $10 million waspaid pursuant to various incentive plans, the majority of which was previously accrued.
• A charge of $37 million (2005 – $43 million) was recorded in 2006 for the neteffect of stock-based compensation and the associated equity forwards.
• Income of $8 million (2005 – nil) from the consolidation of VIEs was recognized in 2006.
Included in restructuring and other charges of $44 million (2005 – $86 million) withinoperating income were the following:• As part of its assessment of store operations, management of Loblaw approved and
communicated a plan in 2006 to close 19 underperforming Quebec stores, mainlywithin the Provigo banner, and 8 stores in the Atlantic region. This resulted in a charge in 2006 of $29 million for fixed asset impairment and other costs arising from these store closures and employee termination costs. In addition, as a result of the loss of tobacco sales following the decision by a major tobacco supplier to selldirectly to certain customers of Loblaw, a review of the impact on the Cash & Carryand wholesale club network was undertaken. In 2006, management approved andcommunicated a formal plan to close 24 wholesale outlets which were impacted mostsignificantly by this change. This initiative resulted in a charge of $6 million in 2006for fixed asset impairment and other costs arising from these closures and employeetermination costs. These closures are expected to be completed during 2007.
20062005200420032002
Loblaw Operating Income and Margin, Adjusted Operating Income(1) and Margin(1)
($ millions)
Loblaw operating incomeLoblaw adjusted operating income(1)
Loblaw operating marginLoblaw adjusted operating margin(1)
(1) See Non-GAAP Financial Measures beginning on page 51.
0
450
900
1,350
$1,800
0.00
2.25
4.50
6.75
9.00%
20062005200420032002
Loblaw Adjusted EBITDA(1) and Margin(1)
($ millions)
Loblaw adjusted EBITDA(1)
Loblaw adjusted EBITDA margin(1)
(1) See Non-GAAP Financial Measures beginning on page 51.
0
550
1,100
1,650
$2,200
0.0
2.5
5.0
7.5
10.0%
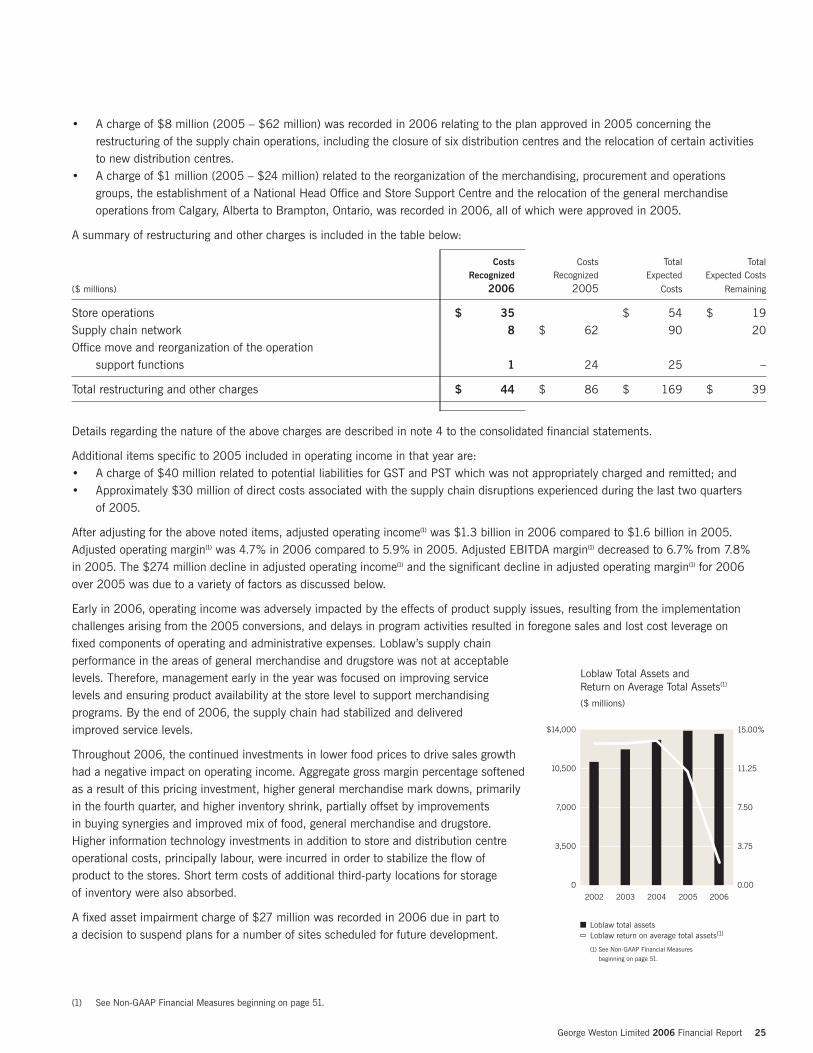
George Weston Limited 2006 Financial Report 25
• A charge of $8 million (2005 – $62 million) was recorded in 2006 relating to the plan approved in 2005 concerning therestructuring of the supply chain operations, including the closure of six distribution centres and the relocation of certain activitiesto new distribution centres.
• A charge of $1 million (2005 – $24 million) related to the reorganization of the merchandising, procurement and operationsgroups, the establishment of a National Head Office and Store Support Centre and the relocation of the general merchandiseoperations from Calgary, Alberta to Brampton, Ontario, was recorded in 2006, all of which were approved in 2005.
A summary of restructuring and other charges is included in the table below:
Costs Costs Total TotalRecognized Recognized Expected Expected Costs
($ millions) 2006 2005 Costs Remaining
Store operations $ 35 $ 54 $ 19Supply chain network 8 $ 62 90 20Office move and reorganization of the operation
support functions 1 24 25 –
Total restructuring and other charges $ 44 $ 86 $ 169 $ 39
Details regarding the nature of the above charges are described in note 4 to the consolidated financial statements.
Additional items specific to 2005 included in operating income in that year are:• A charge of $40 million related to potential liabilities for GST and PST which was not appropriately charged and remitted; and• Approximately $30 million of direct costs associated with the supply chain disruptions experienced during the last two quarters
of 2005.
After adjusting for the above noted items, adjusted operating income(1) was $1.3 billion in 2006 compared to $1.6 billion in 2005.Adjusted operating margin(1) was 4.7% in 2006 compared to 5.9% in 2005. Adjusted EBITDA margin(1) decreased to 6.7% from 7.8% in 2005. The $274 million decline in adjusted operating income(1) and the significant decline in adjusted operating margin(1) for 2006over 2005 was due to a variety of factors as discussed below.
Early in 2006, operating income was adversely impacted by the effects of product supply issues, resulting from the implementationchallenges arising from the 2005 conversions, and delays in program activities resulted in foregone sales and lost cost leverage on fixed components of operating and administrative expenses. Loblaw’s supply chainperformance in the areas of general merchandise and drugstore was not at acceptablelevels. Therefore, management early in the year was focused on improving service levels and ensuring product availability at the store level to support merchandisingprograms. By the end of 2006, the supply chain had stabilized and delivered improved service levels.
Throughout 2006, the continued investments in lower food prices to drive sales growthhad a negative impact on operating income. Aggregate gross margin percentage softenedas a result of this pricing investment, higher general merchandise mark downs, primarilyin the fourth quarter, and higher inventory shrink, partially offset by improvements in buying synergies and improved mix of food, general merchandise and drugstore. Higher information technology investments in addition to store and distribution centreoperational costs, principally labour, were incurred in order to stabilize the flow ofproduct to the stores. Short term costs of additional third-party locations for storage of inventory were also absorbed.
A fixed asset impairment charge of $27 million was recorded in 2006 due in part to a decision to suspend plans for a number of sites scheduled for future development.
(1) See Non-GAAP Financial Measures beginning on page 51.
20062005200420032002
Loblaw Total Assets and Return on Average Total Assets(1)
($ millions)
Loblaw total assetsLoblaw return on average total assets(1)
(1) See Non-GAAP Financial Measures beginning on page 51.
0
3,500
7,000
10,500
$14,000
0.00
3.75
7.50
11.25
15.00%
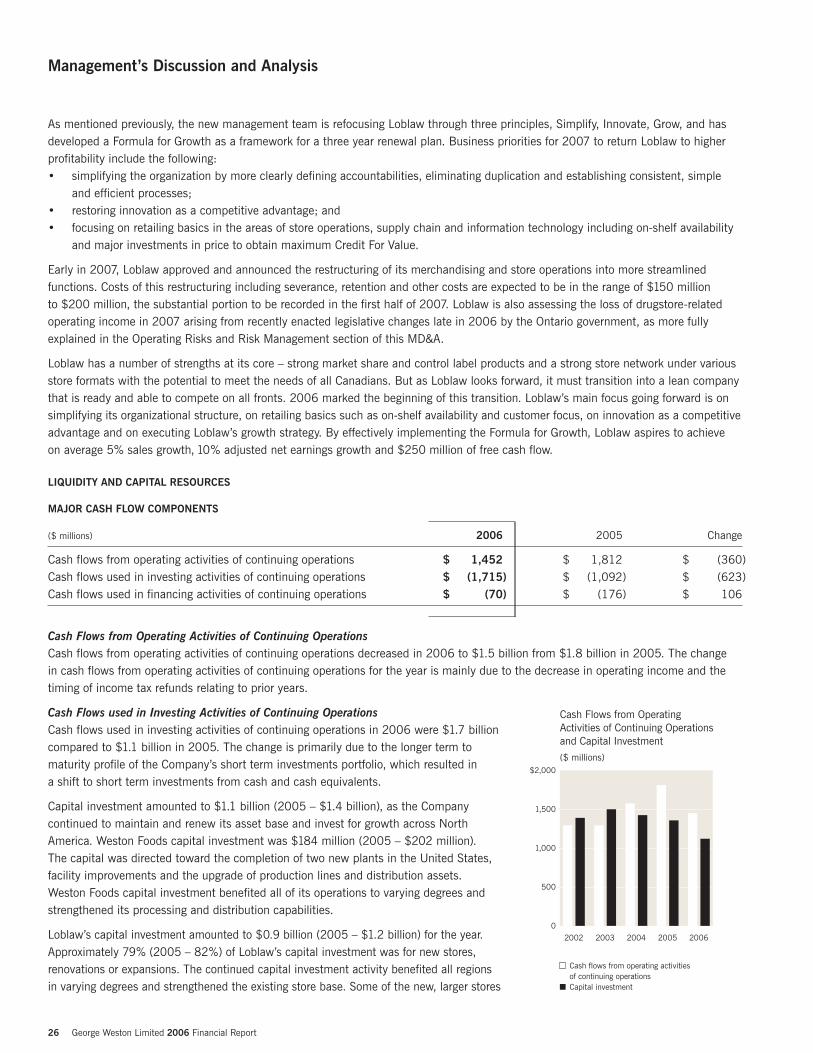
26 George Weston Limited 2006 Financial Report
Management’s Discussion and Analysis
As mentioned previously, the new management team is refocusing Loblaw through three principles, Simplify, Innovate, Grow, and hasdeveloped a Formula for Growth as a framework for a three year renewal plan. Business priorities for 2007 to return Loblaw to higherprofitability include the following:• simplifying the organization by more clearly defining accountabilities, eliminating duplication and establishing consistent, simple
and efficient processes;• restoring innovation as a competitive advantage; and• focusing on retailing basics in the areas of store operations, supply chain and information technology including on-shelf availability
and major investments in price to obtain maximum Credit For Value.
Early in 2007, Loblaw approved and announced the restructuring of its merchandising and store operations into more streamlinedfunctions. Costs of this restructuring including severance, retention and other costs are expected to be in the range of $150 million to $200 million, the substantial portion to be recorded in the first half of 2007. Loblaw is also assessing the loss of drugstore-relatedoperating income in 2007 arising from recently enacted legislative changes late in 2006 by the Ontario government, as more fullyexplained in the Operating Risks and Risk Management section of this MD&A.
Loblaw has a number of strengths at its core – strong market share and control label products and a strong store network under variousstore formats with the potential to meet the needs of all Canadians. But as Loblaw looks forward, it must transition into a lean companythat is ready and able to compete on all fronts. 2006 marked the beginning of this transition. Loblaw’s main focus going forward is onsimplifying its organizational structure, on retailing basics such as on-shelf availability and customer focus, on innovation as a competitiveadvantage and on executing Loblaw’s growth strategy. By effectively implementing the Formula for Growth, Loblaw aspires to achieve on average 5% sales growth, 10% adjusted net earnings growth and $250 million of free cash flow.
LIQUIDITY AND CAPITAL RESOURCES
MAJOR CASH FLOW COMPONENTS
($ millions) 2006 2005 Change
Cash flows from operating activities of continuing operations $ 1,452 $ 1,812 $ (360)Cash flows used in investing activities of continuing operations $ (1,715) $ (1,092) $ (623)Cash flows used in financing activities of continuing operations $ (70) $ (176) $ 106
Cash Flows from Operating Activities of Continuing Operations Cash flows from operating activities of continuing operations decreased in 2006 to $1.5 billion from $1.8 billion in 2005. The changein cash flows from operating activities of continuing operations for the year is mainly due to the decrease in operating income and thetiming of income tax refunds relating to prior years.
Cash Flows used in Investing Activities of Continuing Operations Cash flows used in investing activities of continuing operations in 2006 were $1.7 billioncompared to $1.1 billion in 2005. The change is primarily due to the longer term tomaturity profile of the Company’s short term investments portfolio, which resulted in a shift to short term investments from cash and cash equivalents.
Capital investment amounted to $1.1 billion (2005 – $1.4 billion), as the Companycontinued to maintain and renew its asset base and invest for growth across NorthAmerica. Weston Foods capital investment was $184 million (2005 – $202 million). The capital was directed toward the completion of two new plants in the United States,facility improvements and the upgrade of production lines and distribution assets. Weston Foods capital investment benefited all of its operations to varying degrees andstrengthened its processing and distribution capabilities.
Loblaw’s capital investment amounted to $0.9 billion (2005 – $1.2 billion) for the year.Approximately 79% (2005 – 82%) of Loblaw’s capital investment was for new stores,renovations or expansions. The continued capital investment activity benefited all regions in varying degrees and strengthened the existing store base. Some of the new, larger stores
200620052004200320020
500
1,000
1,500
$2,000
Cash flows from operating activitiesof continuing operationsCapital investment
Cash Flows from Operating Activities of Continuing Operations and Capital Investment
($ millions)
George Weston Limited 2006 Financial Report 27
replaced older, smaller, less efficient stores that did not offer the broad range of products and services demanded by today’s consumer. The remaining 21% (2005 – 18%) of the capital investment was for the warehouse and distribution network, information systems andother infrastructure required to support store growth. Loblaw’s levels of capital investment in 2007 are expected to be lower than inprevious years as a result of Loblaw’s desire to fully prove store format economics before building new stores. Loblaw’s 2006 corporateand franchised store capital investment program, which includes the impact of store openings and closures, resulted in an increase in net retail square footage of 2.5% over 2005. During 2006, 37 (2005 – 69) new corporate and franchised stores were opened and 147(2005 – 77) underwent renovation or minor expansion. The 37 new stores, net of 33 (2005 – 57) store closures, added 1.2 million squarefeet of retail space (2005 – 2.8 million). The 2006 average corporate store size increased 2.3% to 57,400 square feet (2005 – 56,100)and the average franchised store size increased 1.1% to 27,400 square feet (2005 – 27,100).
During 2006, the Company also generated $116 million (2005 – $170 million) from fixed asset sales. 2005 included proceeds of $47 million from the sale of two Weston Foods biscuit facilities.
Cash Flows used in Financing Activities of Continuing Operations Cash flows used in financing activities of continuing operations were $70 million in 2006 compared to $176 million in 2005.
During 2006, Weston and Loblaw completed the following financing activities:• Weston issued $40 million of Series B Debentures;• Loblaw repaid $125 million of Series 1996 Provigo Inc. Debenture;• Weston repaid $200 million of Medium Term Notes (“MTN”);• commercial paper increased $340 million; and• Weston issued 8.0 million preferred shares, Series V for total proceeds of $194 million.
During 2005, Weston and Loblaw completed the following financing activities:• Loblaw issued $300 million of MTN;• Weston issued $36 million of Series B Debentures;• Loblaw repaid $200 million of MTN;• commercial paper decreased $342 million;• Weston issued 8.0 million preferred shares, Series III for total proceeds of $194 million;• Weston issued 8.0 million preferred shares, Series IV for total proceeds of $195 million; and• Loblaw purchased for cancellation 226,100 of its common shares for $16 million, pursuant to its its Normal Course
Issuer Bid (“NCIB”).
See notes 8, 18 and 20 to the consolidated financial statements for the terms and details of the debt and share capital transactions.
Weston intends to renew its NCIB to purchase on the Toronto Stock Exchange or enter into equity derivatives to purchase up to 5% ofits common shares outstanding.
During 2005, Weston’s 2003 Base Shelf Prospectus expired and a new base shelf prospectus under which it may issue preferred sharesand MTN in an aggregate amount not to exceed $1 billion was filed. During 2005, Loblaw’s 2003 Base Shelf Prospectus expired and a new base shelf prospectus allowing the issue of up to $1 billion of aggregate MTN was filed.
The following tables present the amounts of preferred shares and MTN available to issue under the Weston and Loblaw programs:
Weston Preferred Shares and Medium Term Notes ProgramBase Shelf
Prospectus dated($ millions) April 11, 2005
Preferred shares and MTN issue limit $ 1,000Preferred shares, Series III issued in 2005 200Preferred shares, Series IV issued in 2005 200Preferred shares, Series V issued in 2006 200
MTN capacity available, year end 2006 $ 400

28 George Weston Limited 2006 Financial Report
Management’s Discussion and Analysis
Loblaw Medium Term Notes ProgramBase Shelf Base Shelf
Prospectus dated Prospectus dated($ millions) June 20, 2005 May 12, 2003
MTN issue limit $ 1,000 $ 1,000MTN issued in 2003 455MTN issued in 2004 200MTN issued in 2005 300
MTN issue expired $ 45
MTN capacity available, year end 2006 $ 1,000
SOURCES OF LIQUIDITY
The Company can obtain short term financing through a combination of cash generated from operating activities, cash, cash equivalents,short term investments, bank indebtedness and commercial paper programs. Weston’s cash, cash equivalents and short term investments,as well as $268 million in uncommitted credit facilities and $300 million in committed credit facilities extended by several banks,support Weston’s $500 million commercial paper program. Loblaw’s cash, cash equivalents and short term investments, as well as$845 million in uncommitted operating lines of credit extended by several banks, support its $1.2 billion commercial paper program.Weston’s and Loblaw’s commercial paper borrowings generally mature less than 90 days from the date of issuance, although the term can be up to 364 days.
Securitization of credit card receivables provides PC Bank with an additional source of funds for the operation of its business. Under PC Bank’s securitization program, a portion of the total interest in the credit card receivables is sold to independent trusts. In 2006, PC Bank restructured its credit card securitization program and Eagle Credit Card Trust (“Eagle”), a previously establishedindependent trust, issued $500 million of five year senior notes and subordinated notes due 2011 at a weighted average rate of 4.5%. The restructuring of the portfolio yielded a nominal net loss. PC Bank securitized an aggregate $240 million of credit cardreceivables during 2006 (2005 – $225 million). Information on PC Bank’s credit card receivables and securitization is provided in notes 1 and 13 to the consolidated financial statements and in the Off-Balance Sheet Arrangements section of this MD&A.
The Company obtains its long term financing primarily through MTN and preferred share programs. The Company intends to refinanceexisting long term debt as it matures.
In the normal course of business, the Company enters into certain arrangements, such as providing comfort letters to third-party lendersin connection with financing activities of certain franchisees, with no recourse liability to the Company. In addition, the Companyestablishes standby letters of credit used in connection with certain obligations related to the financing program for Loblaw’s independentfranchisees, securitization of PC Bank’s credit card receivables, real estate transactions and benefit programs. At year end, the aggregategross potential liability related to the Company’s standby letters of credit was approximately $552 million (2005 – $547 million), against which the Company had $615 million (2005 – $632 million) in credit facilities available to draw on.
It is the intention of Loblaw to enter into a committed credit facility expected to be extended by several banks in the amount of $500 million for general corporate purposes and to support Loblaw’s commercial paper program.
The Company has the following sources from which it can fund its 2007 cash requirements: cash flows generated from operatingactivities, cash, cash equivalents, short term investments, bank indebtedness, commercial paper programs, preferred shares and MTNprograms, and additional credit card receivable securitizations from future growth in the PC Bank credit card operations.
During the fourth quarter of 2006, the Company’s long term corporate credit and preferred share ratings were downgraded by Standard& Poor’s (“S&P”) to “BBB+” from “A-”, and to “P-2 (low)” from “P-2”, respectively and the commercial paper rating was confirmed at“A-1 (low)”. The Company was removed from CreditWatch with negative implications and the outlook was changed to “stable”.
During the third quarter of 2006, Loblaw’s MTN and debentures were downgraded by Dominion Bond Rating Service (“DBRS”) to “A” from “A (high)” and the commercial paper rating was confirmed at “R-1 (low)”. In both cases the trend was changed to “stable” from“negative”. During the fourth quarter of 2006, Loblaw’s long term credit and commercial paper ratings were downgraded by S&P to “A-” from “A” and to “A-1 (low)” from “A-1 (mid)”, respectively. Loblaw was removed from CreditWatch with negative implications andthe outlook was changed to “stable”.
Subsequent to year end, DBRS placed the Company’s MTN, debentures, commercial paper and preferred share ratings Under Reviewwith negative implications; and S&P placed the Company’s long term corporate credit, commercial paper and preferred share ratings on CreditWatch with negative implications.
Also subsequent to year end, DBRS placed Loblaw’s MTN and debentures Under Review with negative implications and at the sametime, confirmed Loblaw’s commercial paper rating at its current level with a “stable” trend; and S&P placed Loblaw’s long termcorporate credit and commercial paper ratings on CreditWatch with negative implications.
Although a further rating decline will increase borrowing costs, the Company and Loblaw anticipate no difficulty in obtaining externalfinancing based on past experience and the expectation of stable market conditions.
The Company’s current credit ratings are outlined in the table below: Dominion Bond Standard &
Credit Ratings (Canadian Standards) Rating Service Poor’s
Commercial paper R-1 (low) A-1 (low)Medium term notes A (low) BBB+Exchangeable debentures BBB (high)Preferred shares Pfd-2 (low) P-2 (low)Other notes and debentures A (low) BBB+
The rating organizations listed above base their credit ratings on quantitative and qualitative considerations. These credit ratings areintended to give an indication of the risk that Weston will not fulfill its obligations in a timely manner.
CONTRACTUAL OBLIGATIONS
The following illustrates certain of the Company’s significant contractual obligations and discusses other obligations as at December 31, 2006:
Summary of Contractual ObligationsPayments due by year
($ millions) 2007 2008 2009 2010 2011 Thereafter Total
Long term debt(including capitallease obligations) $ 27 $ 420 $ 398 $ 319 $ 669 $ 4,290 $ 6,123
Operating leases(1) 225 205 176 151 128 758 1,643Contracts for purchase
of real property and capital investment projects(2) 153 4 4 161
Purchase obligations(3) 921 671 568 568 565 365 3,658
Total contractual obligations $ 1,326 $ 1,300 $ 1,146 $ 1,038 $ 1,362 $ 5,413 $ 11,585
(1) Represents the minimum or base rents payable. Amounts are not offset by any expected sub-lease income.(2) These obligations include agreements for the purchase of real property. These agreements may contain conditions that may or may not be satisfied. If the conditions
are not satisfied, it is possible the Company will no longer have the obligation to proceed with the transaction.(3) These include material contractual obligations to purchase goods or services where the contract prescribes fixed or minimum volumes to be purchased or payments to
be made within a fixed period of time for a set or variable price. While estimates of anticipated financial commitments were made for the purpose of this disclosure, the amount of actual payments may vary. The purchase obligations do not include purchase orders issued in the ordinary course of business for goods which are meant for resale, nor do they include any contracts which may be terminated on relatively short notice or with insignificant cost or liability to the Company. Also excluded arepurchase obligations related to commodities or commodity-like goods for which a market for resale exists. The Company believes such excluded contracts do not have a material impact on its liquidity.
George Weston Limited 2006 Financial Report 29

30 George Weston Limited 2006 Financial Report
At year end, the Company had other long term liabilities which included accrued benefit plan liability, future income tax liability, stock-based compensation liability, accrued insurance liability and an equity derivative liability. These long term liabilities have not beenincluded in the table above for the following reasons:• future payments of accrued benefit plan liability, principally post-retirement benefits, depend on when and if retirees submit claims;• future payments of income taxes depend on the levels of taxable earnings and income tax rates;• future payments of the share appreciation value on employee stock options depend on whether employees exercise their stock
options, the market prices of Weston and Loblaw common shares on the exercise date and the manner in which they exercise those stock options;
• future payments of restricted share units depend on the market prices of Weston’s and Loblaw’s common shares;• future payments of insurance claims can extend over several years and depend on the timing of anticipated settlements and results
of litigation; and• future payments relating to the settlement of the equity forward obligation based on 9.6 million Loblaw common shares which
matures in 2031 (see note 22 to the consolidated financial statements) will depend on the market price of Loblaw common sharesat the time of maturity; further, the market value of the 9.6 million Loblaw common shares that Weston has used to secure thisobligation exceeds the amount owing under the forward contract, and a portion of the proceeds from a future sale of these sharesmay be used to satisfy the obligation under this forward contract upon termination or maturity.
OFF-BALANCE SHEET ARRANGEMENTS
In the normal course of business, the Company enters into the following off-balance sheet arrangements:• standby letters of credit used in connection with certain obligations mainly related to real estate transactions and benefit
programs, the aggregate gross potential liability of which is approximately $221 million (2005 – $143 million);• the securitization of a portion of PC Bank’s credit card receivables through independent trusts;• a standby letter of credit to an independent funding trust which provides loans to Loblaw’s independent franchisees
for their purchase of inventory and fixed assets;• guarantees; and• financial derivative instruments in the form of interest rate swaps.
Guarantees The Company has entered into various guarantee agreements, including standby letters of credit in relation to the securitization of PC Bank’s credit card receivables and in relation to third-party financing made available to the Company’s independent franchisees andobligations to indemnify third parties in connection with leases, business dispositions and other transactions in the normal course of the Company’s business. For a detailed description of the Company’s guarantees, see note 24 to the consolidated financial statements.
Securitization of Credit Card Receivables Loblaw, through PC Bank, securitizes credit card receivables through an independent trust administered by a major Canadian charteredbank and through Eagle, also an independent trust. In these securitizations, PC Bank sells a portion of its credit card receivables tothe trusts in exchange for cash. The trusts fund these purchases by issuing debt securities in the form of asset-backed commercialpaper (“ABCP”) and asset-backed term notes respectively, to third-party investors. The securitizations are accounted for as asset salesonly when PC Bank transfers control of the transferred assets and receives consideration other than beneficial interests in the transferredassets. All transactions between the trusts and PC Bank have been, and are expected to continue to be, accounted for as sales ascontemplated by Canadian GAAP, specifically Accounting Guideline (“AcG”) 12, “Transfers of Receivables”. As PC Bank does not controlor exercise any measure of influence over the trusts, the financial results of the trusts have not been included in the Company’sconsolidated financial statements.
When PC Bank sells credit card receivables to the trusts, it no longer has access to the receivables but continues to maintain credit card customer account relationships and servicing obligations. PC Bank does not receive a servicing fee from the trusts for its servicingobligations and accordingly, a servicing obligation is recorded. When a sale occurs, PC Bank retains rights to future cash flows afterobligations to the investors in the trusts have been met, which is considered to be a retained interest. The ABCP issuing trust’s recourseto PC Bank’s assets is limited to PC Bank’s retained interests and is further supported through a standby letter of credit provided by a major Canadian chartered bank for 9% (2005 – 9%) of the securitized amount. This standby letter of credit could be drawn upon inthe event of a major decline in the income flow from or in the value of the securitized credit card receivables. Loblaw has agreed toreimburse the issuing bank for any amount drawn on the standby letter of credit. Loblaw believes that the likelihood of this occurrenceis remote. The subordinated notes issued by Eagle provide credit support to those notes which are more senior. The carrying value of
Management’s Discussion and Analysis
George Weston Limited 2006 Financial Report 31
the retained interests is periodically reviewed and when a decline in value is identified that is other than temporary, the carrying value is written down to fair value.
As at year end 2006, the total amount of securitized credit card receivables outstanding which PC Bank continues to service was $1.25 billion (2005 – $1.01 billion) and the associated retained interests amounted to $5 million (2005 – $5 million). The standby letter of credit supporting a portion of these securitized receivables amounted to approximately $68 million (2005 – $91 million). During 2006, PC Bank received income of $116 million (2005 – $106 million) in securitization revenue from the independent trustsrelating to the securitized credit card receivables. In the absence of securitization, Loblaw would be required to raise alternativefinancing by issuing debt or equity instruments. Further disclosure regarding this arrangement is provided in notes 13 and 24 to the consolidated financial statements.
Independent Funding Trust Independent franchisees of Loblaw may obtain financing through a structure involving independent trusts, which were created to provide loans to the independent franchisees to facilitate their purchase of inventory and fixed assets, consisting mainly of fixturing and equipment. These trusts are administered by a major Canadian chartered bank. The independent funding trust within thestructure finances its activities through the issuance of short term ABCP to third-party investors. The total amount of loans issued toLoblaw’s independent franchisees outstanding as of year end 2006 was $419 million (2005 – $420 million) including $124 million(2005 – $126 million) of loans payable of VIEs consolidated by the Company in 2006. Based on a formula, Loblaw has agreed toprovide credit enhancement in the form of a standby letter of credit for the benefit of the independent funding trust equal to approximately10% of the principal amount of the loans outstanding at any point in time, $44 million (2005 – $42 million) as of year end 2006. This credit enhancement allows the independent funding trust to provide favourable financing terms to Loblaw’s independent franchisees.In the event that an independent franchisee defaults on its loan and Loblaw has not, within a specified time period, assumed the loan, or the default is not otherwise remedied, the independent funding trust may assign the loan to Loblaw and draw upon this standby letterof credit. Loblaw has agreed to reimburse the issuing bank for any amount drawn on the standby letter of credit. No amount has everbeen drawn on the standby letter of credit. Loblaw believes it would be able to fully recover from the independent franchisee any amountsit had reimbursed to the issuing bank. Neither the independent funding trust nor Loblaw can voluntarily terminate the agreement prior to December 2009, and following that date only upon six months’ prior notice. Automatic termination of the agreement can only occur if specific, predetermined events occur and are not remedied within the time periods required including a credit rating downgrade of Loblaw below a long term credit rating of A(low) issued by DBRS. If the arrangement is terminated, the independent franchiseeswould be required to replace the loans provided by the independent funding trust with alternative financing. Loblaw is under nocontractual obligation to provide funding to independent franchisees under such circumstances. In accordance with Canadian GAAP, the financial statements of the independent funding trust are not consolidated with those of the Company.
Derivative Instruments The Company uses off-balance sheet financial derivative instruments to manage its exposure to changes in interest rates. For a detaileddescription of the Company’s off-balance sheet derivative instruments and the related accounting policies, see notes 1 and 22 to theconsolidated financial statements.
During 2005, Weston terminated its interest rate swaps with a notional value of $200 million which were designated as a fair valuehedge of the $200 million of 5.05% MTN due 2014. The gain realized on the termination of these swaps of $5 million, was deferredand is being recognized over the remaining term of the initial hedge and recognized in interest expense and other financing charges.
QUARTERLY RESULTS OF OPERATIONS
The 52-week reporting cycle followed by the Company is divided into four quarters of 12 weeks each except for the third quarter, which is 16 weeks in duration. The following is a summary of selected consolidated financial information derived from the Company’sunaudited interim consolidated financial statements for each of the eight most recently completed quarters. This information wasprepared in accordance with Canadian GAAP and is reported in Canadian dollars.
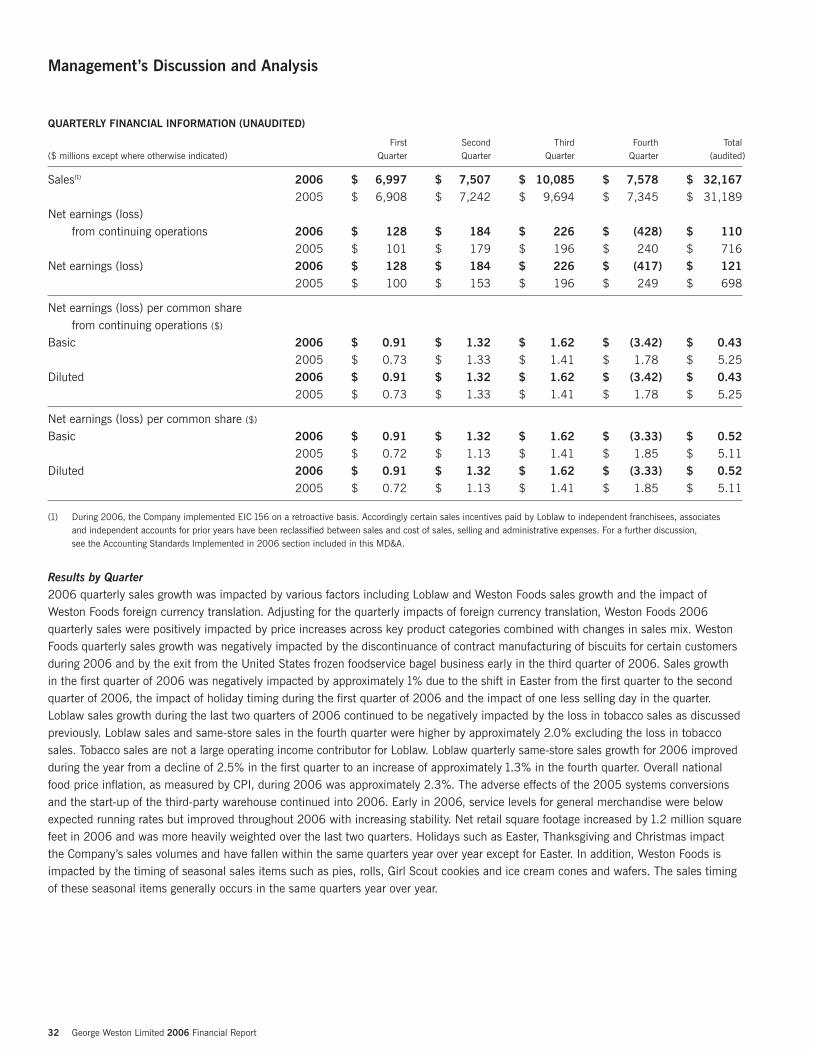
32 George Weston Limited 2006 Financial Report
Management’s Discussion and Analysis
QUARTERLY FINANCIAL INFORMATION (UNAUDITED)
First Second Third Fourth Total($ millions except where otherwise indicated) Quarter Quarter Quarter Quarter (audited)
Sales(1) 2006 $ 6,997 $ 7,507 $ 10,085 $ 7,578 $ 32,1672005 $ 6,908 $ 7,242 $ 9,694 $ 7,345 $ 31,189
Net earnings (loss) from continuing operations 2006 $ 128 $ 184 $ 226 $ (428) $ 110
2005 $ 101 $ 179 $ 196 $ 240 $ 716Net earnings (loss) 2006 $ 128 $ 184 $ 226 $ (417) $ 121
2005 $ 100 $ 153 $ 196 $ 249 $ 698
Net earnings (loss) per common sharefrom continuing operations ($)
Basic 2006 $ 0.91 $ 1.32 $ 1.62 $ (3.42) $ 0.432005 $ 0.73 $ 1.33 $ 1.41 $ 1.78 $ 5.25
Diluted 2006 $ 0.91 $ 1.32 $ 1.62 $ (3.42) $ 0.432005 $ 0.73 $ 1.33 $ 1.41 $ 1.78 $ 5.25
Net earnings (loss) per common share ($)
Basic 2006 $ 0.91 $ 1.32 $ 1.62 $ (3.33) $ 0.522005 $ 0.72 $ 1.13 $ 1.41 $ 1.85 $ 5.11
Diluted 2006 $ 0.91 $ 1.32 $ 1.62 $ (3.33) $ 0.522005 $ 0.72 $ 1.13 $ 1.41 $ 1.85 $ 5.11
(1) During 2006, the Company implemented EIC 156 on a retroactive basis. Accordingly certain sales incentives paid by Loblaw to independent franchisees, associates and independent accounts for prior years have been reclassified between sales and cost of sales, selling and administrative expenses. For a further discussion, see the Accounting Standards Implemented in 2006 section included in this MD&A.
Results by Quarter 2006 quarterly sales growth was impacted by various factors including Loblaw and Weston Foods sales growth and the impact ofWeston Foods foreign currency translation. Adjusting for the quarterly impacts of foreign currency translation, Weston Foods 2006quarterly sales were positively impacted by price increases across key product categories combined with changes in sales mix. WestonFoods quarterly sales growth was negatively impacted by the discontinuance of contract manufacturing of biscuits for certain customersduring 2006 and by the exit from the United States frozen foodservice bagel business early in the third quarter of 2006. Sales growth in the first quarter of 2006 was negatively impacted by approximately 1% due to the shift in Easter from the first quarter to the secondquarter of 2006, the impact of holiday timing during the first quarter of 2006 and the impact of one less selling day in the quarter.Loblaw sales growth during the last two quarters of 2006 continued to be negatively impacted by the loss in tobacco sales as discussedpreviously. Loblaw sales and same-store sales in the fourth quarter were higher by approximately 2.0% excluding the loss in tobaccosales. Tobacco sales are not a large operating income contributor for Loblaw. Loblaw quarterly same-store sales growth for 2006 improvedduring the year from a decline of 2.5% in the first quarter to an increase of approximately 1.3% in the fourth quarter. Overall nationalfood price inflation, as measured by CPI, during 2006 was approximately 2.3%. The adverse effects of the 2005 systems conversionsand the start-up of the third-party warehouse continued into 2006. Early in 2006, service levels for general merchandise were belowexpected running rates but improved throughout 2006 with increasing stability. Net retail square footage increased by 1.2 million squarefeet in 2006 and was more heavily weighted over the last two quarters. Holidays such as Easter, Thanksgiving and Christmas impactthe Company’s sales volumes and have fallen within the same quarters year over year except for Easter. In addition, Weston Foods isimpacted by the timing of seasonal sales items such as pies, rolls, Girl Scout cookies and ice cream cones and wafers. The sales timingof these seasonal items generally occurs in the same quarters year over year.
George Weston Limited 2006 Financial Report 33
Quarter-to-quarter variability in consolidated operating income was also caused by the following, all of which have beendiscussed previously: • restructuring and other charges incurred by Weston Foods and Loblaw;• fluctuations in stock-based compensation net of the impact of the associated equity derivatives as a result of changes
in the market price of Weston’s and Loblaw’s common shares;• non-cash Loblaw goodwill impairment charge;• Loblaw’s charge related to the Ontario collective labour agreement;• Loblaw’s charge related to inventory liquidation;• a departure entitlement payment at Loblaw;• costs associated with Loblaw’s supply chain disruptions; and• Loblaw charges related to Goods and Services Tax and provincial sales taxes in 2005.
2006 quarterly adjusted operating income(1) was negatively impacted by lower adjusted operating margins(1) at Loblaw partially offset by higher adjusted operating margins(1) at Weston Foods. The improvement in Weston Foods adjusted operating margin(1) was primarilydue to sales growth, including price increases combined with changes in sales mix, and by the benefits realized from the restructuringand other cost reduction activities initiated over the last few years. Loblaw’s quarterly adjusted operating income(1) was impacted by various factors. Softening sales in the first quarter of 2006 from continued product supply issues and deliberate delays in programactivities resulted in lost leverage on the fixed components in administrative and operating expenses. In the second, third and fourthquarters, higher store and distribution centre operational costs were incurred to stabilize the flow of product to the stores and additionalstorage costs were absorbed to quicken the supply chain stabilization process. Loblaw’s fourth quarter performance reflects the adverseimpact on operating income of the following:• higher inventory shrink of approximately $35 million and higher store labour costs of approximately $20 million;• an investment of approximately 0.5% in food pricing, resulting in an impact of approximately $30 million;• higher general merchandise mark downs in the range of $15 million to $20 million to clear inventory through retail stores;• a fixed asset impairment charge of $24 million due in part to a decision to suspend plans for a number of sites scheduled
for future development; and• incremental supply chain costs and information technology investments of approximately $15 million.
Investments in the form of lower food prices continue to be made in specific markets in support of Loblaw’s business strategy to grow sales levels.
Interest expense and other financing charges incurred on a quarterly basis in 2006 as compared to the prior year were generally impactedby decreases in average borrowing levels outstanding and higher short term interest income, offset by the negative impact of interest on financial derivative instruments as a result of an increase in Canadian short term interest rates. In addition, interest expense and otherfinancing charges included non-cash income or a non-cash charge relating to the accounting for Weston’s 2001 forward sale agreementfor 9.6 million Loblaw common shares which fluctuates as the market price of Loblaw common shares changes.
The change in the quarterly effective income tax rate for 2006 over 2005 was primarily due to changes in the Canadian federal andcertain provincial statutory income tax rates and a change in the proportion of taxable income earned in each tax jurisdiction in whichthe Company operated, including the jurisdiction in which the income tax impact of restructuring and other charges and stock-basedcompensation and the associated equity derivatives occurred. During the fourth quarter, the effective income tax rate was impacted bythe non-deductible Loblaw goodwill impairment charge. In addition, during the second quarter of 2006, the Company recognized a $24 million reduction to future income tax expense due to the cumulative effects of changes in Canadian federal and certain provincialstatutory income tax rates on future income tax assets and liabilities, which were included in the consolidated financial statements atthe time of substantive enactment.
The results of discontinued operations reflect the benefit of final adjustments to the proceeds associated with the prior year’s completedsale of the Fisheries operations in 2006, an income tax recovery in the fourth quarter of 2005 and the loss from the sales of theremaining Fisheries operations in the second quarter of 2005.
Net earnings were impacted by all the items described above.
(1) See Non-GAAP Financial Measures beginning on page 51.
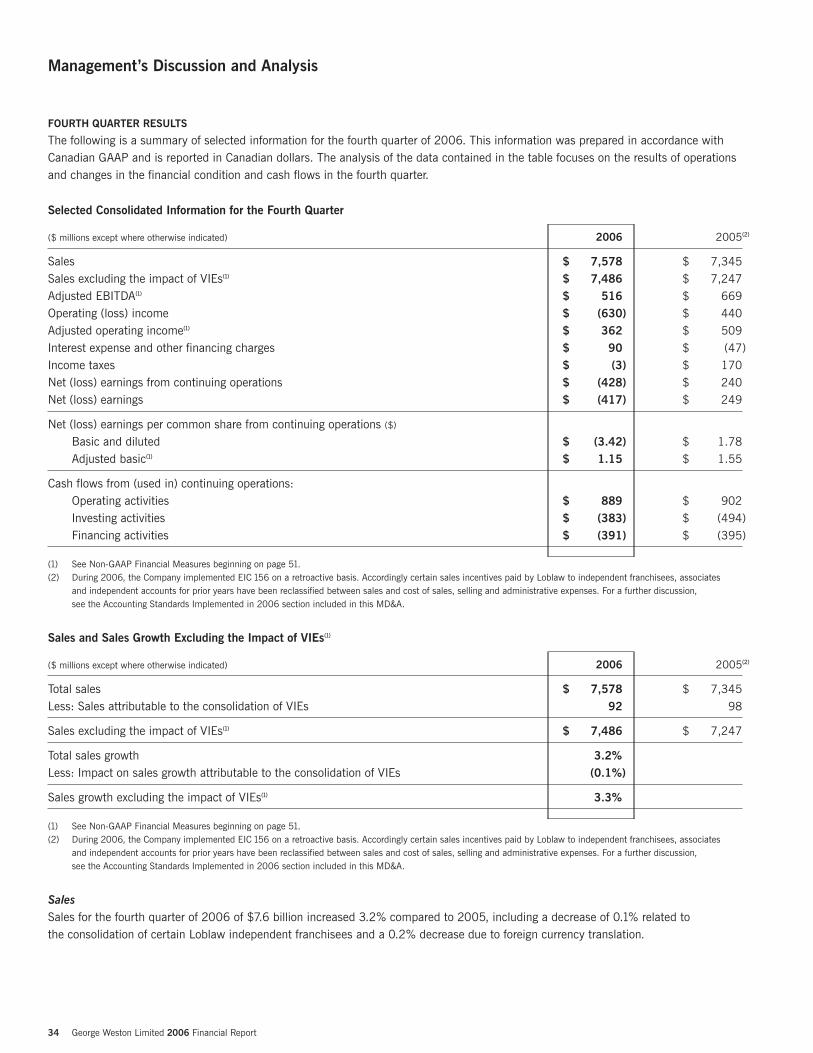
34 George Weston Limited 2006 Financial Report
Management’s Discussion and Analysis
FOURTH QUARTER RESULTS
The following is a summary of selected information for the fourth quarter of 2006. This information was prepared in accordance withCanadian GAAP and is reported in Canadian dollars. The analysis of the data contained in the table focuses on the results of operationsand changes in the financial condition and cash flows in the fourth quarter.
Selected Consolidated Information for the Fourth Quarter
($ millions except where otherwise indicated) 2006 2005(2)
Sales $ 7,578 $ 7,345Sales excluding the impact of VIEs(1) $ 7,486 $ 7,247Adjusted EBITDA(1) $ 516 $ 669Operating (loss) income $ (630) $ 440Adjusted operating income(1) $ 362 $ 509Interest expense and other financing charges $ 90 $ (47)Income taxes $ (3) $ 170Net (loss) earnings from continuing operations $ (428) $ 240Net (loss) earnings $ (417) $ 249
Net (loss) earnings per common share from continuing operations ($)
Basic and diluted $ (3.42) $ 1.78Adjusted basic(1) $ 1.15 $ 1.55
Cash flows from (used in) continuing operations:Operating activities $ 889 $ 902Investing activities $ (383) $ (494)Financing activities $ (391) $ (395)
(1) See Non-GAAP Financial Measures beginning on page 51.(2) During 2006, the Company implemented EIC 156 on a retroactive basis. Accordingly certain sales incentives paid by Loblaw to independent franchisees, associates
and independent accounts for prior years have been reclassified between sales and cost of sales, selling and administrative expenses. For a further discussion, see the Accounting Standards Implemented in 2006 section included in this MD&A.
Sales and Sales Growth Excluding the Impact of VIEs(1)
($ millions except where otherwise indicated) 2006 2005(2)
Total sales $ 7,578 $ 7,345Less: Sales attributable to the consolidation of VIEs 92 98
Sales excluding the impact of VIEs(1) $ 7,486 $ 7,247
Total sales growth 3.2%Less: Impact on sales growth attributable to the consolidation of VIEs (0.1%)
Sales growth excluding the impact of VIEs(1) 3.3%
(1) See Non-GAAP Financial Measures beginning on page 51.(2) During 2006, the Company implemented EIC 156 on a retroactive basis. Accordingly certain sales incentives paid by Loblaw to independent franchisees, associates
and independent accounts for prior years have been reclassified between sales and cost of sales, selling and administrative expenses. For a further discussion, see the Accounting Standards Implemented in 2006 section included in this MD&A.
Sales Sales for the fourth quarter of 2006 of $7.6 billion increased 3.2% compared to 2005, including a decrease of 0.1% related to the consolidation of certain Loblaw independent franchisees and a 0.2% decrease due to foreign currency translation.
George Weston Limited 2006 Financial Report 35
Operating (Loss) Income Operating loss of $630 million for the fourth quarter of 2006 declined compared to income of $440 million in 2005. Fourth quarteroperating income included a $800 million charge for the non-cash Loblaw goodwill impairment charge, a $51 million (2005 – $7 million)charge for restructuring and other charges, an $84 million charge related to Loblaw’s Ontario collective labour agreement, a $68 millioncharge related to Loblaw’s inventory liquidation and income of $11 million (2005 – charge of $48 million) related to net stock-basedcompensation net of the impact of the associated equity derivatives. In addition, operating income for the fourth quarter of 2005 includeda $10 million charge related to Loblaw’s estimated impact of direct costs associated with supply chain disruptions and a negative $4 million VIE impact. Adjusting for the net negative impact of these items, consolidated adjusted operating income(1) for the fourthquarter of 2006 was $362 million compared to $509 million in 2005, a decline of 28.9%. Consolidated adjusted operating margin(1)
for the fourth quarter of 2006 was 4.8% compared to 7.0% in 2005.
Interest Expense and Other Financing Charges Interest expense and other financing charges for the fourth quarter of 2006 increased to $90 million from interest income of $47 millionin 2005. The increase of $137 million in interest expense and other financing charges was primarily as a result of the non-cash chargeof $17 million (2005 – non-cash income of $122 million), reflecting the accounting for Weston’s 2001 forward sale agreement for 9.6 million Loblaw common shares.
Income Taxes The effective income tax rate for the fourth quarter of 2006 was 0.4% compared to 34.9% in 2005. This significant change in theeffective income tax rate was due to the non-cash Loblaw goodwill impairment charge recorded in the quarter which is non-deductiblefor income tax purposes. In addition, the effective income tax rate was impacted due to the change in the proportion of taxable income earned across the different tax jurisdictions in which the Company operated, including the jurisdictions in which the income tax impact of restructuring and other charges and stock-based compensation and the associated equity derivatives occurred.
Net (Loss) Earnings from Continuing Operations Net loss from continuing operations for the fourth quarter of 2006 was $428 million compared to net earnings from continuingoperations of $240 million in 2005. Basic net loss per common share from continuing operations for the fourth quarter of 2006 was$3.42 compared to basic net earnings per common share from continuing operations of $1.78 in 2005. Basic net loss per commonshare from continuing operations included the net negative impact of $4.57 per common share for the fourth quarter as a result of thefollowing factors:• a $3.84 per common share charge related to the non-cash Loblaw goodwill impairment;• a $0.20 per common share charge related to restructuring and other charges for restructuring plans undertaken by both
Weston Foods and Loblaw;• a $0.26 per common share charge related to the Ontario collective labour agreement at Loblaw;• a $0.21 per common share charge related to the inventory liquidation at Loblaw;• a $0.09 per common share non-cash charge related to the accounting for Weston’s 2001 forward sale agreement for
9.6 million Loblaw common shares which is offset on an economic basis; and• $0.03 per common share income for the net effect of stock-based compensation and the associated equity derivatives.
After adjusting for the above noted items, Weston’s 2006 adjusted basic net earnings per common share from continuing operations(1)
was $1.15 for the fourth quarter. These results compare to 2005 adjusted basic net earnings per common share from continuingoperations(1) of $1.55, which were adjusted for the net negative impact of restructuring and other charges, Loblaw’s direct costs associatedwith supply chain disruptions, stock-based compensation and the associated equity derivatives, the accounting for Weston’s 2001forward sale agreement for 9.6 million Loblaw common shares, changes in statutory income tax rates in certain Canadian provinces and the consolidation of VIEs by Loblaw. Adjusted basic net earnings per common share from continuing operations(1) for the fourthquarter of 2006 decreased 25.8% compared to 2005.
Discontinued Operations The gain from discontinued operations for the fourth quarter of 2006 was $11 million compared to $9 million in 2005. The 2006 gainfrom discontinued operations is primarily related to final adjustments to the proceeds associated with the previously completed sale ofthe remaining Fisheries operations in 2005.
(1) See Non-GAAP Financial Measures beginning on page 51.
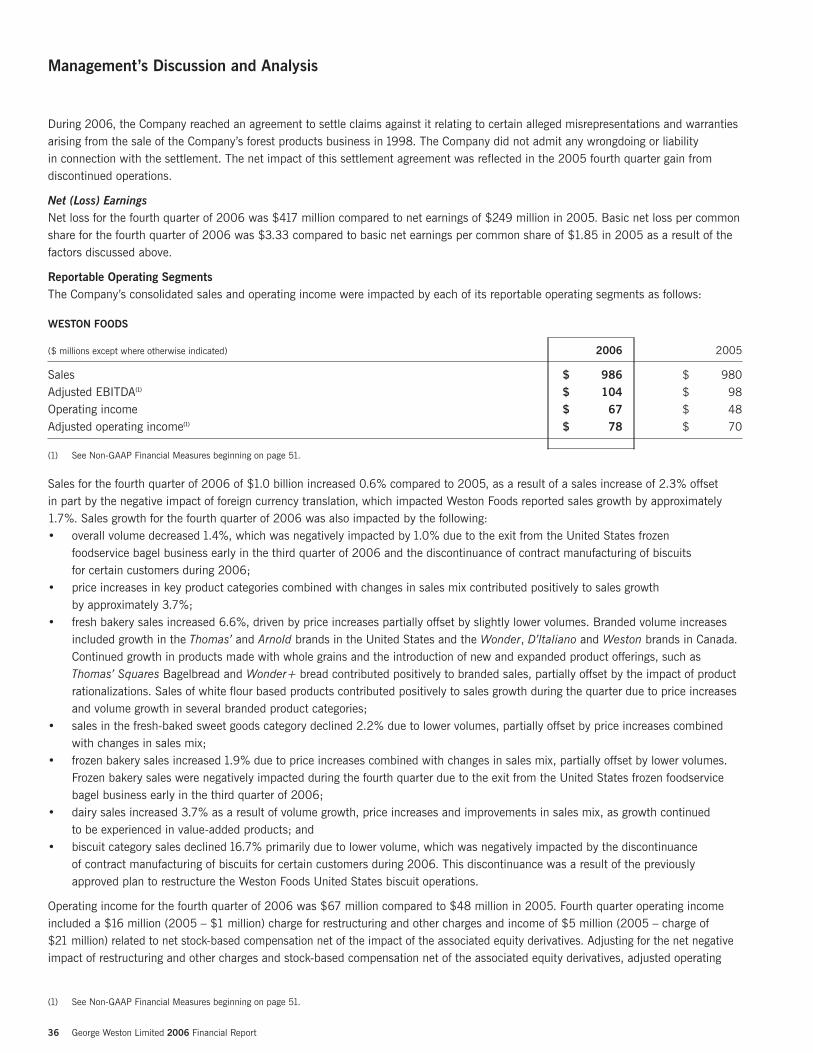
36 George Weston Limited 2006 Financial Report
Management’s Discussion and Analysis
During 2006, the Company reached an agreement to settle claims against it relating to certain alleged misrepresentations and warrantiesarising from the sale of the Company’s forest products business in 1998. The Company did not admit any wrongdoing or liability in connection with the settlement. The net impact of this settlement agreement was reflected in the 2005 fourth quarter gain fromdiscontinued operations.
Net (Loss) Earnings Net loss for the fourth quarter of 2006 was $417 million compared to net earnings of $249 million in 2005. Basic net loss per commonshare for the fourth quarter of 2006 was $3.33 compared to basic net earnings per common share of $1.85 in 2005 as a result of thefactors discussed above.
Reportable Operating SegmentsThe Company’s consolidated sales and operating income were impacted by each of its reportable operating segments as follows:
WESTON FOODS
($ millions except where otherwise indicated) 2006 2005
Sales $ 986 $ 980Adjusted EBITDA(1) $ 104 $ 98Operating income $ 67 $ 48Adjusted operating income(1) $ 78 $ 70
(1) See Non-GAAP Financial Measures beginning on page 51.
Sales for the fourth quarter of 2006 of $1.0 billion increased 0.6% compared to 2005, as a result of a sales increase of 2.3% offset in part by the negative impact of foreign currency translation, which impacted Weston Foods reported sales growth by approximately1.7%. Sales growth for the fourth quarter of 2006 was also impacted by the following:• overall volume decreased 1.4%, which was negatively impacted by 1.0% due to the exit from the United States frozen
foodservice bagel business early in the third quarter of 2006 and the discontinuance of contract manufacturing of biscuits for certain customers during 2006;
• price increases in key product categories combined with changes in sales mix contributed positively to sales growth by approximately 3.7%;
• fresh bakery sales increased 6.6%, driven by price increases partially offset by slightly lower volumes. Branded volume increasesincluded growth in the Thomas’ and Arnold brands in the United States and the Wonder, D’Italiano and Weston brands in Canada.Continued growth in products made with whole grains and the introduction of new and expanded product offerings, such asThomas’ Squares Bagelbread and Wonder+ bread contributed positively to branded sales, partially offset by the impact of productrationalizations. Sales of white flour based products contributed positively to sales growth during the quarter due to price increasesand volume growth in several branded product categories;
• sales in the fresh-baked sweet goods category declined 2.2% due to lower volumes, partially offset by price increases combinedwith changes in sales mix;
• frozen bakery sales increased 1.9% due to price increases combined with changes in sales mix, partially offset by lower volumes.Frozen bakery sales were negatively impacted during the fourth quarter due to the exit from the United States frozen foodservicebagel business early in the third quarter of 2006;
• dairy sales increased 3.7% as a result of volume growth, price increases and improvements in sales mix, as growth continued to be experienced in value-added products; and
• biscuit category sales declined 16.7% primarily due to lower volume, which was negatively impacted by the discontinuance of contract manufacturing of biscuits for certain customers during 2006. This discontinuance was a result of the previouslyapproved plan to restructure the Weston Foods United States biscuit operations.
Operating income for the fourth quarter of 2006 was $67 million compared to $48 million in 2005. Fourth quarter operating incomeincluded a $16 million (2005 – $1 million) charge for restructuring and other charges and income of $5 million (2005 – charge of $21 million) related to net stock-based compensation net of the impact of the associated equity derivatives. Adjusting for the net negativeimpact of restructuring and other charges and stock-based compensation net of the associated equity derivatives, adjusted operating
(1) See Non-GAAP Financial Measures beginning on page 51.
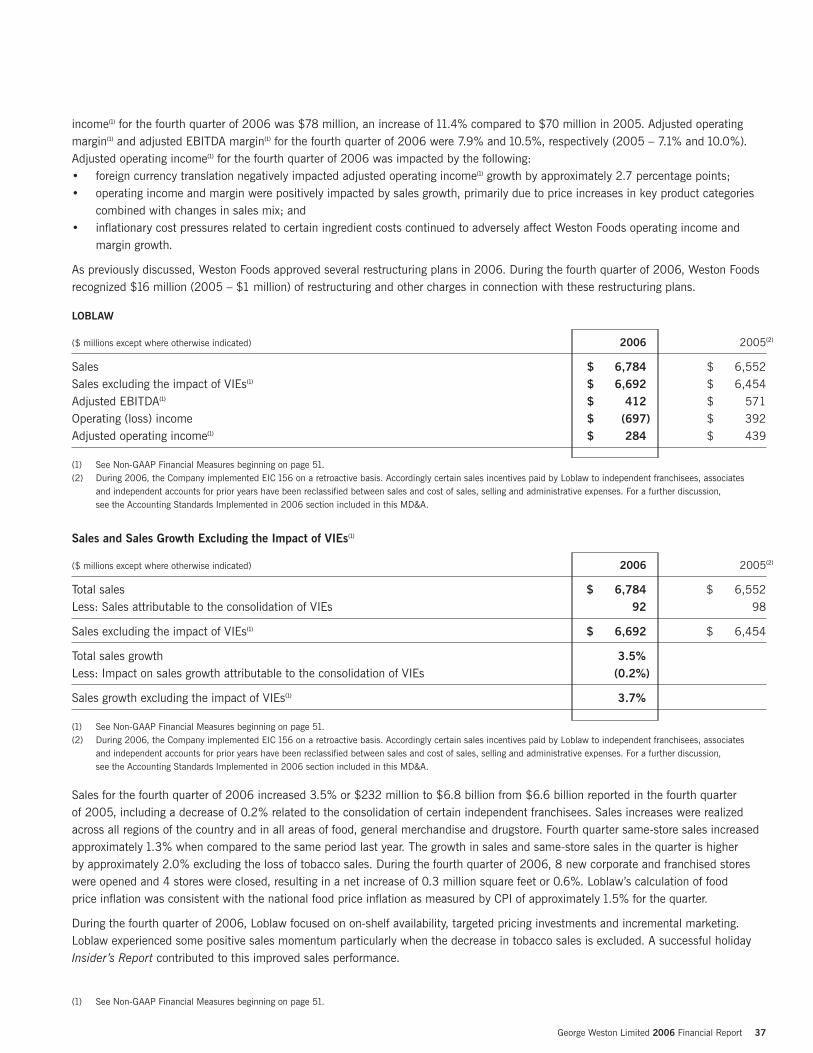
George Weston Limited 2006 Financial Report 37
income(1) for the fourth quarter of 2006 was $78 million, an increase of 11.4% compared to $70 million in 2005. Adjusted operatingmargin(1) and adjusted EBITDA margin(1) for the fourth quarter of 2006 were 7.9% and 10.5%, respectively (2005 – 7.1% and 10.0%).Adjusted operating income(1) for the fourth quarter of 2006 was impacted by the following:• foreign currency translation negatively impacted adjusted operating income(1) growth by approximately 2.7 percentage points;• operating income and margin were positively impacted by sales growth, primarily due to price increases in key product categories
combined with changes in sales mix; and• inflationary cost pressures related to certain ingredient costs continued to adversely affect Weston Foods operating income and
margin growth.
As previously discussed, Weston Foods approved several restructuring plans in 2006. During the fourth quarter of 2006, Weston Foodsrecognized $16 million (2005 – $1 million) of restructuring and other charges in connection with these restructuring plans.
LOBLAW
($ millions except where otherwise indicated) 2006 2005(2)
Sales $ 6,784 $ 6,552Sales excluding the impact of VIEs(1) $ 6,692 $ 6,454Adjusted EBITDA(1) $ 412 $ 571Operating (loss) income $ (697) $ 392Adjusted operating income(1) $ 284 $ 439
(1) See Non-GAAP Financial Measures beginning on page 51.(2) During 2006, the Company implemented EIC 156 on a retroactive basis. Accordingly certain sales incentives paid by Loblaw to independent franchisees, associates
and independent accounts for prior years have been reclassified between sales and cost of sales, selling and administrative expenses. For a further discussion, see the Accounting Standards Implemented in 2006 section included in this MD&A.
Sales and Sales Growth Excluding the Impact of VIEs(1)
($ millions except where otherwise indicated) 2006 2005(2)
Total sales $ 6,784 $ 6,552Less: Sales attributable to the consolidation of VIEs 92 98
Sales excluding the impact of VIEs(1) $ 6,692 $ 6,454
Total sales growth 3.5%Less: Impact on sales growth attributable to the consolidation of VIEs (0.2%)
Sales growth excluding the impact of VIEs(1) 3.7%
(1) See Non-GAAP Financial Measures beginning on page 51.(2) During 2006, the Company implemented EIC 156 on a retroactive basis. Accordingly certain sales incentives paid by Loblaw to independent franchisees, associates
and independent accounts for prior years have been reclassified between sales and cost of sales, selling and administrative expenses. For a further discussion, see the Accounting Standards Implemented in 2006 section included in this MD&A.
Sales for the fourth quarter of 2006 increased 3.5% or $232 million to $6.8 billion from $6.6 billion reported in the fourth quarter of 2005, including a decrease of 0.2% related to the consolidation of certain independent franchisees. Sales increases were realizedacross all regions of the country and in all areas of food, general merchandise and drugstore. Fourth quarter same-store sales increasedapproximately 1.3% when compared to the same period last year. The growth in sales and same-store sales in the quarter is higher by approximately 2.0% excluding the loss of tobacco sales. During the fourth quarter of 2006, 8 new corporate and franchised storeswere opened and 4 stores were closed, resulting in a net increase of 0.3 million square feet or 0.6%. Loblaw’s calculation of food price inflation was consistent with the national food price inflation as measured by CPI of approximately 1.5% for the quarter.
During the fourth quarter of 2006, Loblaw focused on on-shelf availability, targeted pricing investments and incremental marketing.Loblaw experienced some positive sales momentum particularly when the decrease in tobacco sales is excluded. A successful holidayInsider’s Report contributed to this improved sales performance.
(1) See Non-GAAP Financial Measures beginning on page 51.
38 George Weston Limited 2006 Financial Report
Management’s Discussion and Analysis
Operating income for the fourth quarter of 2006 decreased $1,089 million from the fourth quarter of 2005 to an operating loss of $697 million and operating margin declined to (10.3)% from 6.0% in the comparable period of 2005 due to the effects of the chargesdescribed below, all of which have been previously detailed in the Loblaw Operating Results section of this MD&A:• A non-cash goodwill impairment charge of $800 million related to the goodwill established on the acquisition of Provigo Inc. in 1998;• A one-time charge of $84 million in the fourth quarter related to the ratification of a new four-year collective agreement with
members of certain Ontario locals of the UFCW;• A charge of $68 million in connection with the liquidation process for selected general merchandise inventory reflecting the
expected inventory value through liquidation as well as the associated costs of facilitating the disposition incurred to date; and• A charge of $35 million recorded upon management’s approval and announcement of its plans to close 19 underperforming
stores in Quebec, mainly within the Provigo banner, 8 stores in the Atlantic region, and 24 wholesale outlets. These closures are expected to result in total costs of $54 million.
Adjusted operating income(1) in the fourth quarter of 2006 was $284 million compared to $439 million in 2005, resulting in adjustedoperating margins(1) of 4.2% and 6.8% respectively. During the fourth quarter of 2006, Loblaw continued to incur higher than anticipatedstore and distribution centre operational costs, particularly in higher inventory shrinkage and labour of approximately $35 million andapproximately $20 million, respectively. Investments in lower food prices continued into the fourth quarter with an approximate 0.5%investment in food pricing, which resulted in an adverse impact to operating income of approximately $30 million when compared to the same period last year. As Loblaw continued to manage its inventory levels down to more desirable levels in store backrooms,outside storage and distribution centres, some success was realized in the fourth quarter from the focused clearance pricing of certaincategories resulting in higher general merchandise mark downs in the range of $15 million to $20 million from the clearance ofinventory through retail stores. Incremental supply chain costs and information technology investments of approximately $15 millionwere also absorbed in the fourth quarter.
Adjusted EBITDA(1) and EBITDA margin(1) for the fourth quarter were $412 million and 6.2%, respectively. For the comparable period of 2005, adjusted EBITDA(1) and EBITDA margin(1) were $571 million and 8.8%, respectively.
Liquidity and Capital ResourcesCash flows from operating activities of continuing operations Fourth quarter cash flows from operating activities of continuing operations were $889 million in 2006 compared to $902 million in the comparable period of 2005.
Cash flows used in investing activities of continuing operations Fourth quarter 2006 cash flows used in investing activities of continuing operations were $383 million in 2006 compared to $494 million in 2005. Capital investment for the fourth quarter amounted to $307 million (2005 – $390 million).
Cash flows used in financing activities of continuing operations Fourth quarter 2006 cash flows used in financing activities of continuing operations were $391 million in 2006 compared to $395 million in 2005.
MANAGEMENT’S CERTIFICATION OF DISCLOSURE CONTROLS AND PROCEDURES
Management is responsible for designing disclosure controls and procedures to provide reasonable assurance that all material informationrelating to the Company and its subsidiaries is gathered and reported to senior management on a timely basis so that appropriatedecisions can be made regarding public disclosure. As required by Multilateral Instrument 52-109 (Certification of Disclosure in Issuers’Annual and Interim Filings) of the Canadian Securities Administrators, the Chairman & President and the Chief Financial Officer (“CFO”)have evaluated the effectiveness of such disclosure controls and procedures and have concluded that the Company’s disclosure controlsand procedures are effective as at December 31, 2006.
(1) See Non-GAAP Financial Measures beginning on page 51.
OPERATING RISKS AND RISK MANAGEMENT
Each year, the Company performs an Enterprise Risk Assessment (“ERA”), which identifies the key risks facing the Company andevaluates the risk management effectiveness for each of these risks. The assessment is primarily carried out through interviews with senior management, who assess the potential impact of risks and the likelihood that a negative impact will occur. The results of the ERA are used to prioritize risk management activities, allocate resources effectively and inform overall business direction. The Audit Committee receives a report on the ERA.
A description of the risks and risk management strategies identified by the ERA is included in the operational risks discussed below, any of which has the potential to negatively affect financial performance. The Company has operating and risk management strategiesand insurance programs, which help to mitigate the potential financial impact of these operating risks.
Industry and Competitive Environment The North American food processing and retail industries are evolving and operate in increasingly competitive markets. Consumers’ needs drive changes in the industries, which are impacted by changing demographic and economic trends such as changesin disposable income, ethnic diversity, nutritional awareness and time availability. Customer satisfaction is central to the Company’sbusiness. Over the past several years, consumers have demanded more choice, value and convenience. If the Company is ineffective in responding to these demands or ineffective in executing its strategies, its financial performance could be negatively impacted.
The Company reviews and monitors operating plans and results, including market share in its reportable operating segments. When necessary, the segments will modify their operating strategies, including relocating production facilities or stores, closingunderperforming stores, reviewing pricing and adjusting product offerings, brand positioning and/or marketing programs to take intoaccount competitive activity. A significant competitive advantage the Company has developed is its brands. Both segments focus on brand development and building upon their core brand equity. Weston Foods’ brands provide it with a strategic advantage over its competitors. Its premium and mainstream brands provide Weston Foods with strong core brands and product lines that enhanceconsumer loyalty, trusted as they are for quality, great taste and freshness. Loblaw’s control label program represents a significantcompetitive advantage because it enhances customer loyalty by offering superior value and provides some protection against national brand pricing strategies.
As a result of the difficult sales environment being experienced by United States traditional food retailers, coupled with the continuingcost pressures being experienced by the industry, Weston Foods anticipates that competitive business restructuring will continue in2007. Although the outcome and the impact, if any, on the Company’s consolidated financial results from this anticipated restructuringis uncertain, Weston Foods will closely monitor the United States food retail market and, if required, adjust its strategies and programsas necessary.
Loblaw faces increasing competition from many types of non-traditional competitors, such as mass merchandisers, warehouse clubs,drugstores, limited assortment stores, discount stores, convenience stores and specialty stores, all of which continue to increase theirofferings of products typically associated with traditional supermarkets. Loblaw is also subject to competitive pressures from newentrants into the marketplace and from the expansion of existing competitors, particularly those expanding into the grocery market.These competitors may have extensive resources, which will allow them to compete effectively with Loblaw in the long term.
Increased competition could adversely affect the Company’s ability to achieve its objectives. The Company’s inability to competeeffectively with its current or any future competitors could result in, among other things, lessening of market share and lower pricing in response to competitors’ pricing activities. Accordingly, the Company’s competitive position and financial performance could benegatively impacted. The Company may not always achieve the expected cost savings and other benefits of these initiatives, whichcould negatively impact the Company’s financial performance.
Change Management2006 was a year of significant change for Loblaw. The change in Loblaw senior management will be followed by changes to itsstructures and business processes. While these changes are expected to bring benefits to Loblaw in the form of a more agile andconsumer-focused business, success is dependent on management effectively implementing these changes. Ineffective changemanagement may result in disruptions to the operations of the business or affect its ability to implement and achieve its strategicobjectives, due to a lack of clear accountabilities, or cause employees to act in a manner which is inconsistent with its objectives. Any of these events could negatively impact the Company’s performance.
George Weston Limited 2006 Financial Report 39
40 George Weston Limited 2006 Financial Report
Management’s Discussion and Analysis
Food Safety and Public Health The Company is subject to potential liabilities connected with its business operations, including potential exposures associated withproduct defects, food safety and product handling. Such liabilities may arise in relation to the manufacturing, preparation, storage,distribution and display of products and, with respect to the Company’s control label and contract manufactured products, in relation to the production, packaging and design of products.
A majority of the Company’s sales are generated from food products and the Company could be vulnerable in the event of a significant outbreak of food-borne illness or increased public health concerns in connection with certain food products. Such an eventcould negatively affect the Company’s financial performance. Procedures are in place to manage such events, should they occur. These procedures identify risks, provide clear communication to employees and consumers and are aimed at ensuring that potentiallyharmful products are expeditiously removed from inventory. The ability of these procedures to address such events is dependent on their successful execution. Food safety related liability exposures are insured by the Company’s insurance program. In addition, theCompany has food safety procedures and programs, which address safe food handling and preparation standards. The Companyendeavours to employ best practices for the storage and distribution of food products and also actively supports consumer awarenessof safe food handling and consumption.
The Company strives to ensure its brands and Loblaw’s control label products have informative nutritional labelling so that today’shealth conscious consumer can make informed choices.
Information TechnologyIn order to support the current and future requirements of the business in an efficient, cost effective and well-controlled manner, theCompany is reliant on information technology systems. These have been assessed by management to need significant upgrading in order to act as an enabler for the business to achieve its operating objectives. These systems are essential in providing managementwith the appropriate information for decision making, including its key performance indicators. Change management risk and otherassociated risks will arise from the various information technology projects which will be undertaken to upgrade existing systems andintroduce new systems to effectively manage the business going forward. Failure by the Company to appropriately invest in informationtechnology or failure to implement information technology infrastructure in a timely or effective manner may negatively impact theCompany’s financial performance.
Labour A significant portion of the Company’s workforce is unionized. Renegotiating collective agreements might result in work stoppages orslowdowns, which could negatively affect the Company’s financial performance, depending on their nature and duration. The Companyis willing to accept the short term costs of labour disruption in order to negotiate competitive labour costs and operating conditions for the longer term. Significant labour negotiations took place across the Company in 2006 as 108 collective agreements expired and 78 collective agreements were successfully negotiated which represented a combination of agreements expiring in 2006, those carriedover from prior years and those negotiated early. In 2007, 105 collective agreements affecting approximately 22,500 employees willexpire, with the single largest agreement covering approximately 8,600 employees. The Company will also continue to negotiate the 67 collective agreements carried over from 2004 to 2006. The Company has good relations with its employees and unions and, althoughit is possible, does not anticipate any unusual difficulties in renegotiating these agreements.
Several of the Company’s competitors operate in a non-union environment. These competitors may benefit from lower labour costs and more favourable operating efficiencies, making it more difficult for the Company to compete.
Commodity Prices Weston Foods operating results are directly impacted by fluctuations in the price of commodities such as wheat, flour, sugar, vegetable oil, cocoa, natural gas and fuel. Increases in the price of these commodities could adversely affect the Company’s financial performance. In order to minimize the effect of these fluctuations on current operating results and to lessen the resulting uncertainty of future financial results, the Company hedges a portion of its anticipated commodity purchases. As at year end 2006, Weston Foods had entered into commodity future contracts that mitigate price fluctuations on some commodities for approximately 6 months, onaverage, into 2007.
Employee Future Benefit Contributions Although the Company’s registered funded defined benefit pension plans are currently adequately funded and returns on defined benefit pension plan assets are in line with expectations, there is no assurance that this will continue. An extended period of depressedcapital markets and low interest rates could require the Company to make contributions to its registered funded defined benefit pensionplans in excess of those currently contemplated, which in turn could have a negative effect on its financial performance.
During 2006, the Company contributed $125 million (2005 – $103 million) to its registered funded defined benefit pension plans.During 2007, the Company expects to contribute approximately $93 million to these plans. This estimate may vary subject to thecompletion of actuarial valuations, market performance and regulatory requirements. The Company also expects to make contributionsin 2007 to defined contribution pension plans and multi-employer pension plans, as well as benefit payments to the beneficiaries of the unfunded defined benefit pension and other benefit plans.
Multi-Employer Pension PlansIn addition to the Company-sponsored pension plans, the Company participates in various multi-employer pension plans, providingpension benefits in which approximately 41% (2005 – 40%) of employees of the Company and of its independent franchiseesparticipate. The administration of these plans and the investment of their assets are legally controlled by boards of independent trusteesgenerally consisting of an equal number of union and employer representatives. In some circumstances, the Company may have a representative on the board of trustees of these multi-employer pension plans. The Company’s responsibility to make contributions to these plans is limited by the amounts established pursuant to its collective agreements. Pension cost for these plans is recognized as contributions are due.
Subsequent to year end 2006, the Company was served with an action brought by certain beneficiaries of a multi-employer pension plan in the Superior Court of Ontario. In their claim against the employers and the trustees of the multi-employer pension plan, theplaintiffs claim that assets of the multi-employer pension plan have been mismanaged. Loblaw is one of the employers affected bythe action. One billion dollars of damages are claimed in the action against a total of 17 defendants. In addition, the plaintiffs are seeking to have a representative defendant appointed for the employers of all the members of the multi-employer pension plan. The action isframed as a representative action on behalf of all of the beneficiaries of the multi-employer pension plan. The action is at a very earlystage and the Company intends to vigorously defend it. Statements of Defence have not yet been filed.
During 2006, the trustees of a multi-employer pension plan (including an employee who was appointed by the Company) were chargedunder the Pension Benefits Act (Ontario) by the Superintendent of Financial Services with failure to administer various investments madeby the trustees in a manner consistent with the legislation. It is not anticipated that the trial relating to these charges will be scheduledbefore February 2008.
Third-Party Service Providers Certain aspects of the Company’s business are significantly affected by third parties. Although appropriate contractual arrangements are put in place with these third parties, the Company has no direct influence over how such third parties are managed. It is possiblethat negative events affecting these third parties could in turn negatively impact the Company’s operations and its financial performance.
A large portion of Loblaw’s case-ready meat products are produced by a third party which operates facilities dedicated to Loblaw.
In addition, certain of Weston Foods products and Loblaw’s control label products, which are among the most recognized brands inCanada, are manufactured under contract by third-party vendors, and in order to preserve the brands’ equity, these vendors are held tohigh standards of quality. Loblaw also uses third-party logistic services including those in connection with a dedicated warehouse anddistribution centre in Pickering, Ontario and third-party common carriers. Any disruption in these services could interrupt the delivery of merchandise to the stores and therefore could negatively impact sales.
President’s Choice Financial banking services are provided by a major Canadian chartered bank. PC Bank uses third-party serviceproviders to process credit card transactions, operate call centres and monitor credit and fraud for the President’s Choice FinancialMasterCard®. In order to minimize operating risk, PC Bank and Loblaw actively manage and monitor their relationship with all third-party service providers. PC Bank has developed a vendor management policy, approved by its Board of Directors, and hasestablished a vendor management team that provides its Board with regular reports on vendor management and risk assessment.PC Financial home and auto insurance products are provided by companies within the Aviva Canada group, the Canadian subsidiary of a major international property and casualty insurance provider.
George Weston Limited 2006 Financial Report 41
42 George Weston Limited 2006 Financial Report
Management’s Discussion and Analysis
Real Estate The availability and conditions affecting the acquisition and development of real estate properties may impact Loblaw’s ability to execute its planned real estate program on schedule and therefore, its ability to achieve its sales targets. Real estate development plans may be contingent on successful negotiation of labour agreements with respect to same-site expansion or redevelopment. As Loblaw continues to offer general merchandise, on-time execution of the real estate program becomes increasingly important due to significantly longer lead times required for ordering this merchandise. Delays in execution could lead to inventory management issues.Loblaw maintains a significant portfolio of owned retail real estate and, whenever practical, pursues a strategy of purchasing sites forfuture store locations. This enhances Loblaw’s operating flexibility by allowing it to introduce new departments and services that couldbe precluded under operating leases. At year end 2006, Loblaw owned 72% (2005 – 72%) of its corporate store square footage.
Seasonality The Company’s operations as they relate to food, specifically inventory levels, sales volumes and sales mix, are impacted to somedegree by certain holiday periods throughout the year. Both of the Company’s reportable operating segments continuously monitor the impact holidays may have on their operations and adjust inventory levels and production and delivery schedules as required. As Loblaw expands the breadth of its general merchandise offering, it may increase the number of seasonal products offered and its operations may therefore be subject to more seasonal fluctuations.
Excess InventoryAs Loblaw continues to offer general merchandise, it is possible that certain merchandising programs will result in excess inventory that cannot be sold profitably through Loblaw’s stores. Excess inventory may result in mark downs, shrink or the need to liquidate the inventory, all of which may negatively impact the Company’s financial performance. In addition, Loblaw’s current inventory managementinfrastructure, including its information technology systems, is not efficient in its tracking of inventory through all stages of the supply chain.Loblaw has implemented procedures and information technology workarounds which provide management with the ability to adequatelydetect and quantify excess and obsolete inventory. Loblaw expects to implement new systems in this area to address this risk.
Employee Development and Retention Effective employee development and succession planning are essential to sustaining the growth and success of the Company. The Company continues to focus on the development of employees at all levels and across all regions. The degree to whichthe Company is not effective in developing its employees and establishing appropriate succession planning processes could lead to a lack of requisite knowledge, skills and experience which could, in turn, affect its ability to execute its strategies, efficiently run its operations and meet its goals for financial performance.
The tight labour market in Western Canada has created unique challenges to effectively operate manufacturing facilities, stores anddistribution centres thereby affecting the Company’s ability to meet its business objectives. The Company has implemented targetedprograms to attract the appropriate calibre of employees in a very competitive environment.
Subsequent to year end 2006, Loblaw has announced a reorganization of some of its functions and an associated reduction of between800 and 1,000 store support and regional office employees. These actions, if not properly executed, will impact Loblaw’s ability toexecute its strategies going forward. These actions will require Loblaw to address employee engagement in the process and ensure that key employees remain empowered to effectively execute Loblaw’s strategies.
Utility and Fuel Prices The Company is a significant consumer of electricity, other utilities and fuel. Unanticipated cost increases in these items could negativelyaffect the Company’s financial performance. The Company has entered into contracts with suppliers to fix the price of a portion of its future variable costs associated with electricity and natural gas, and financial contracts to fix a portion of variable costs associated with heating oil requirements for 2007.
Insurance The Company limits its exposure to risk through a combination of appropriate levels of self-insurance and the purchase of variousinsurance coverages, including an integrated insurance program. The Company’s insurance program is based on various lines and limits of coverage, which provide the appropriate level of retained and insured risks. Insurance is arranged on a multi-year basiswith reliable, financially stable insurance companies as rated by A.M. Best Company, Inc. The Company combines comprehensive risk management programs and the active management of claims handling and litigation processes by using internal professionals and external technical expertise to reduce and manage the risk it retains.
George Weston Limited 2006 Financial Report 43
Environmental, Health and Safety The Company has environmental, health and workplace safety programs in place and has established policies and procedures aimed at ensuring compliance with applicable legislative requirements. To this end, the Company employs environmental risk assessments andaudits using internal and external resources together with employee awareness programs throughout its operating locations.
The Company endeavours to be socially and environmentally responsible, and recognizes that the competitive pressures for economicgrowth and cost efficiency must be integrated with sound environmental stewardship and ecological considerations. Environmentalprotection requirements do not and are not expected to have a material effect on the Company’s financial performance.
The Environmental, Health and Safety Committee of the Board receives regular reporting from management, addressing current andpotential future issues, identifying new regulatory concerns and related communication efforts. The Company’s dedicated EnvironmentalAffairs staff work closely with the operations to help ensure that corporate requirements are met.
Ethical Business Conduct Any failure of the Company to adhere to its policies, the law or ethical business practices could significantly affect its reputation and brands and could therefore, negatively impact the Company’s financial performance. The Company has adopted a Code of BusinessConduct which employees and directors of the Company are required to acknowledge and agree to on a regular basis. The Companyhas in place an Ethics and Business Conduct Committee, which monitors compliance with the Code of Business Conduct and determineshow the Company can best ensure it is conducting its business in an ethical manner. Loblaw has also adopted a Vendor Code ofConduct, which outlines its ethical expectations to its vendor community in a number of areas, including social responsibility.
Legal, Taxation and Accounting Changes to any of the laws, rules, regulations or policies related to the Company’s business, including the production, processing,preparation, distribution, packaging and labelling of its products could have an adverse impact on its financial and operationalperformance. In the course of complying with such changes, the Company may incur significant costs. Failure by the Company to fullycomply with applicable laws, rules, regulations and policies may subject it to civil or regulatory actions or proceedings, including fines,assessments, injunctions, recalls or seizures, which may have an adverse effect on the Company’s financial results.
During 2006, the Government of Ontario passed a new law which prohibits the receipt of rebates paid by manufacturers to pharmaciesin respect of interchangeable products and products listed in Ontario’s Formulary. Pharmacies are permitted to accept only limiteddefined professional allowances to be used in compliance with a new Code of Conduct. As a result of this recently enacted legislation,drugstore-related operating income could decrease although Loblaw is attempting to mitigate some of the impact of these changes. It is possible that similar legislation could be implemented in other provinces, which could have a further negative impact.
There can be no assurance that the tax laws and regulations in the jurisdictions affecting the Company will not be changed in a mannerwhich could adversely affect the Company. New accounting pronouncements introduced by appropriate authoritative bodies may alsoimpact the Company’s financial results.
Holding Company Structure Weston is a holding company. As such, it does not carry on all of its business directly but does so through its subsidiaries. It has no major source of income or assets of its own, other than the interests it has in its subsidiaries, which are all separate legal entities.Weston is therefore financially dependent on dividends and other distributions it receives from its subsidiaries.
FINANCIAL RISKS AND RISK MANAGEMENT
In the normal course of business, the Company is exposed to financial risks that have the potential to negatively affect its financial performance, including financial risks related to changes in interest rates, foreign currency exchange rates and the marketprices of Weston and Loblaw common shares. The Company is also exposed to credit and counterparty risks on certain of its financial instruments. These risks and the actions taken to minimize them are discussed below.
Derivative Instruments The Company uses over-the-counter financial derivative instruments, specifically cross currency basis swaps, interest rate swaps, equityforwards and swaps, and commodity futures and options, to minimize the risks and costs associated with its financing activities, stock-based compensation plans and future purchases of commodities. The Company maintains treasury centres that operate underpolicies and guidelines approved by the Board, covering funding, investing, equity, foreign currency exchange and interest ratemanagement. The Company’s policies and guidelines prevent it from using any derivative instrument for trading or speculative purposes.See notes 1 and 22 to the consolidated financial statements for additional information on the Company’s derivative instruments.
44 George Weston Limited 2006 Financial Report
Management’s Discussion and Analysis
Foreign Currency Exchange Rate The Company enters into currency derivative agreements to manage its current and anticipated exposure to fluctuations in foreigncurrency exchange rates. Loblaw’s cross currency basis swaps are transactions in which floating interest payments and principal in United States dollars are exchanged against the receipt of floating interest payments and principal in Canadian dollars. These crosscurrency basis swaps limit Loblaw’s exposure to foreign currency exchange rate fluctuations on a portion of its United States dollardenominated assets, principally cash, cash equivalents and short term investments.
Interest Rate The Company enters into interest rate swaps to manage its current and anticipated exposure to fluctuations in interest rates and marketliquidity. Interest rate swaps are transactions in which the Company exchanges interest flows with a counterparty on a specified notionalamount for a predetermined period based on agreed-upon fixed and floating interest rates. Notional amounts are not exchanged. The Company monitors market conditions and the impact of interest rate fluctuations on its fixed and floating interest rate exposure mix on an ongoing basis.
Common Share Market Price The Company enters into equity derivative agreements to manage its exposure to fluctuations in its stock-based compensation cost as a result of changes in the market prices of Weston and Loblaw common shares. These equity derivative agreements change in value as the market prices of the underlying common shares change, which effectively results in a partial offset to fluctuations in theCompany’s stock-based compensation cost. The partial offset between the Company’s stock-based compensation cost and the equityderivatives exists as long as the market prices of Weston and Loblaw common shares exceed the exercise price of employee stockoptions. The amount of net stock-based compensation cost recorded in operating income is dependent upon the number of unexercised,vested stock options and restricted share units relative to the number of underlying common shares on the equity derivatives and thefluctuations in the market price of the underlying common shares. As at year end 2006, 1,912,293 Weston stock options and shareappreciation rights and 4,068,646 Loblaw stock options had exercise prices which were greater than the respective market price ofWeston and Loblaw common shares at year end. The fair value of Weston’s equity forward sale agreement based on 9.6 million Loblawcommon shares is based on fluctuations in the market price of Loblaw common shares, and is a non-cash item that will ultimately be offset by the recognition of any gain on Weston’s disposition of the 9.6 million Loblaw common shares.
Counterparty Over-the-counter financial derivative instruments are subject to counterparty risk. Counterparty risk arises from the possibility thatmarket changes may affect a counterparty’s position unfavourably and that the counterparty defaults on its obligations to the Company.The Company has sought to minimize potential counterparty risk and losses by conducting transactions for its derivative agreementswith counterparties that have at minimum a long term “A” credit rating from a recognized credit rating agency and by placing risk adjustedlimits on its exposure to any single counterparty for its financial derivative agreements. The Company has internal policies, controls and reporting processes, which require ongoing assessment and corrective action, if necessary, with respect to its derivative transactions.In addition, principal amounts on cross currency basis swaps and equity forwards are each netted by agreement and there is noexposure to loss of the original notional principal amounts on the interest rate swaps and equity forwards and swaps.
Credit The Company’s exposure to credit risk relates to the Company’s cash equivalents and short term investments, Weston Foods trade accounts receivables and Loblaw’s credit card receivables and accounts receivable from independent franchisees, associates and independent accounts. Credit risk associated with the Company’s cash equivalents and short term investments results from the possibility that a counterparty may default on the repayment of a security. This risk is mitigated by the established policies and guidelines that require issuers of permissible investments to have at minimum a long term “A” credit rating from a recognized credit rating agency and that specify minimum and maximum exposures to specific issuers.
Weston Foods performs ongoing credit evaluations of new and existing customers’ financial condition and reviews the collectibility of its trade accounts receivables in order to mitigate any possible credit losses.
Loblaw’s exposure to credit risk relates to PC Bank’s credit card receivables. PC Bank manages the President’s Choice FinancialMasterCard®. PC Bank grants credit to its customers on President’s Choice Financial MasterCard® with the intention of increasing the loyalty of those customers and Loblaw profitability. Credit risk results from the potential for loss due to those customers defaultingon their payment obligations. In order to minimize the associated credit risk, PC Bank employs stringent credit scoring techniques,actively monitors the credit card portfolio and reviews techniques and technology that can improve the effectiveness of its collectionprocess. In addition, these receivables are dispersed among a large, diversified group of credit card customers. Loblaw also has
George Weston Limited 2006 Financial Report 45
accounts receivable from its independent franchisees, associates and independent accounts, mainly as a result of sales to these customers. Loblaw actively monitors the balances on an ongoing basis and collects funds from its independent franchisees on a frequent basis in accordance with terms specified in the applicable agreements.
SUBSEQUENT EVENTS
On March 7, 2007, pursuant to a transaction whereby Domtar Inc. (“Domtar”) was combined with the fine paper business ofWeyerhauser Inc., Domtar common shares were exchanged for an equal number of either non-voting exchangeable shares of Domtar(Canada) Paper Inc. or common shares of Domtar Corporation (the “New Domtar”), a Delaware corporation.
After March 7, 2007, the holders of Weston’s 3% Exchangeable Debentures (“Debentures”) are entitled to exchange their Debentures for common shares of New Domtar on the basis of 95.2381 common shares of New Domtar for each one thousand dollar principalamount of Debentures. Weston’s obligation on the exchange or redemption of these Debentures can be satisfied by delivery of a cashamount equivalent to the current market price of the common shares of New Domtar at such time, the common shares of New Domtar or any combination thereof.
In addition, the Share Purchase Agreement governing the June 1998 sale by Weston of E.B. Eddy Limited and E.B. Eddy Paper, Inc. toDomtar (the “SPA”) contains a price adjustment clause. The SPA provides, subject to certain exceptions, that if any person subsequentlyacquired more than 50% of the outstanding voting shares of Domtar, the price adjustment clause applies. Weston believes that a priceadjustment in the amount of $110 million is payable and Weston has demanded payment of such amount from Domtar. Domtar’s positionis that the purchase price adjustment does not apply because of the application of an exception contained in the SPA. Weston intendsto pursue its legal rights pursuant to the SPA.
In addition, as previously discussed in the Loblaw Operating Results section of this MD&A, Loblaw approved and announced, earlyin 2007, the restructuring of its merchandising and store operations.
RELATED PARTY TRANSACTIONS
Weston’s majority shareholder, Wittington Investments, Limited (“Wittington”), and its affiliates are related parties. Weston, in the normal course of business, has routine transactions with these related parties, including the rental of office space at market prices from Wittington. Rental payments amounted to approximately $6 million in 2006 (2005 – $5 million). In addition, Loblaw purchasedfrom Wittington a property designated for future development for consideration of $8 million, which was prepaid in accordance with a former ground lease between the parties. It is Weston’s policy to conduct all transactions and settle balances with related parties onnormal trade terms and conditions. For a detailed description of the Company’s related party transactions, see note 25 to theconsolidated financial statements.
From time to time, the Company and Wittington may make elections that are permitted or required under applicable income tax legislationwith respect to affiliated corporations and, as a result, may enter into agreements in that regard. These elections and accompanyingagreements do not have any material impact on the Company.
CRITICAL ACCOUNTING ESTIMATES
The preparation of financial statements in accordance with Canadian GAAP requires management to make estimates and assumptions that affect the reported amounts and disclosures made in the consolidated financial statements and accompanying notes.Management continually evaluates the estimates and assumptions it uses. These estimates and assumptions are based on management’shistorical experience, best knowledge of current events and conditions and activities that the Company may undertake in the future.Actual results could differ from these estimates. The estimates and assumptions described in this section depend upon subjective or complex judgments about matters that may be uncertain and changes in these estimates and assumptions could materially impact the consolidated financial statements.
Inventories Certain Loblaw retail store inventories are stated at the lower of cost and estimated net realizable value less normal gross profit margin.Loblaw is required to make significant estimation or judgment in the determination of (i) discount factors used to convert inventory to cost after a physical count at retail has been completed and (ii) estimated inventory losses, or shrinkage, occurring between the lastphysical inventory count and the balance sheet date.
Inventories counted at retail are converted to cost by applying a discount factor to retail selling prices. This discount factor is determined at a category or department level, is calculated in relation to historical gross margins and is reviewed on a regular basis
46 George Weston Limited 2006 Financial Report
for reasonableness. Inventory shrinkage, which is calculated as a percentage of sales, is evaluated throughout the year and provides for estimated inventory shortages from the last physical count to the balance sheet date. To the extent that actual losses experiencedvary from those estimated, both inventories and operating income may be impacted.
During 2006, Loblaw decided to proceed with the liquidation of certain inventory, consisting primarily of general merchandise. A charge of $68 million was recorded in 2006 in connection with this liquidation process. Significant estimation or judgment wasrequired in the determination of what is considered excess inventory, estimated recovery values and discounted cost of retail store inventories.
Changes or differences in these estimates may result in changes to inventories on the consolidated balance sheet and a charge or credit to operating income in the consolidated statement of earnings.
Employee Future Benefits The cost and accrued benefit plan obligations of the Company’s defined benefit pension plans and other benefit plans are accrued based on actuarial valuations which are dependent on assumptions determined by management. These assumptions include the discount rate, the expected long term rate of return on plan assets, the expected growth rate of health care costs, the rate of compensation increase, retirement ages and mortality rates. These assumptions are reviewed annually by management and the Company’s actuaries.
The discount rate, the expected long term rate of return on plan assets and the expected growth rate in health care costs are the three most significant assumptions.
The discount rates are based on market interest rates, as at the Company’s measurement date of September 30 on a portfolio ofCorporate AA bonds with terms to maturity that, on average, match the terms of the accrued benefit plan obligations. The discount rates used to determine the 2006 net cost for defined benefit pension and other benefit plans were 5.3% and 5.3% respectively on a weighted average basis, compared to 6.2% and 6.1% respectively in 2005. The discount rates used to determine the net 2007defined benefit pension and other benefit plans costs decreased to 5.0% and 5.0%, respectively in Canada and increased to 5.75% and 5.75%, respectively in the United States.
The expected long term rate of return on plan assets is based on current market conditions, the asset mix, the active management of defined benefit pension plan assets and on historical returns. The Company’s defined benefit pension plan assets had a 10 yearannualized return of 8.8% as at the 2006 measurement date. The actual annual returns within this 10 year period varied with marketconditions. The Company has assumed a 7.75% expected long term rate of return on plan assets in Canada and 8.0% on plan assets in the United States in calculating its defined benefit pension plans cost for 2007.
The expected growth rate in health care costs for 2006 was based on external data and the Company’s historical trends for health care costs, and in 2007 initial growth rates will be relatively consistent with that of 2006.
Since the three key assumptions discussed above are forward-looking and long term in nature, they are subject to uncertainty andactual results may differ. In accordance with Canadian GAAP, differences between actual experience and the assumptions, as well as the impact of changes in the assumptions, are accumulated as unamortized net actuarial gains and losses and amortized over futureperiods, affecting the recognized cost of defined benefit pension plans and other benefit plans and the accrued benefit plan obligation in future periods. While the Company believes that its assumptions are appropriate, significant differences in actual experience or significant changes in the Company’s assumptions may materially affect its defined benefit pension plans and other benefit plansaccrued benefit plan obligations and future costs.
Additional information regarding the Company’s pension and other benefit plans, including a sensitivity analysis for changes in key assumptions, is provided in note 17 to the consolidated financial statements and in the Employee Future Benefit Contributionsdiscussion in the Operating Risks and Risk Management section of this MD&A.
Goodwill and Indefinite Life Intangible Assets Goodwill is not amortized and is assessed for impairment at the reporting unit level at least annually. Any potential goodwill impairmentis identified by comparing the fair value of a reporting unit to its carrying value. If the fair value of the reporting unit exceeds its carryingvalue, goodwill is considered not to be impaired. If the carrying value of the reporting unit exceeds its fair value, a more detailedgoodwill impairment assessment must be undertaken. A goodwill impairment charge is recognized to the extent that, at the reportingunit level, the carrying value of goodwill exceeds the implied fair value. Fair value of goodwill is estimated in the same manner asgoodwill is determined at the date of acquisition in a business acquisition, that is, the excess of the fair value of the reporting unit
Management’s Discussion and Analysis
George Weston Limited 2006 Financial Report 47
over the fair value of the identifiable net assets of the reporting unit. Any goodwill impairment will result in a reduction in the carryingvalue of goodwill on the consolidated balance sheet and in the recognition of a non-cash impairment charge in operating income in the consolidated statement of earnings.
The Company determines the fair value of its reporting units using a discounted cash flow model corroborated by other valuationtechniques such as market multiples. The process of determining these fair values requires management to make estimates andassumptions of a long term nature including, but not limited to, projected future sales, earnings and capital investment, discount ratesand terminal growth rates. Projected future sales, earnings and capital investment are consistent with strategic plans presented to the Board. Discount rates are based on an industry weighted average cost of capital. These estimates and assumptions may change in the future due to uncertain competitive and economic market conditions or changes in business strategies.
In 2006, Loblaw performed the annual goodwill impairment test and it was determined that the carrying value of the goodwill establishedon the acquisition of Provigo Inc. in 1998 exceeded its respective fair value. As a result, Loblaw recorded in operating income a non-cashgoodwill impairment charge of $800 million relating to this goodwill, which was within its previously disclosed range of $600 million to $900 million. Loblaw expects no income tax deduction from this non-cash goodwill impairment charge. The determination that thefair value of goodwill was less than its carrying value resulted from a decline in market multiples, both from an industry and Loblawperspective, and a reduction of fair value as determined using the discounted cash flow methodology, incorporating both current Loblawand market assumptions, which in combination resulted in the goodwill impairment. This non-cash goodwill impairment charge isexpected to be adjusted if necessary in the first half of 2007 and may result in a charge or credit to operating income in the consolidatedstatement of earnings and in the carrying value of goodwill on the balance sheet.
Intangible assets with indefinite lives, primarily consisting of certain Weston Foods trademarks and brand names, are assessed forimpairment at least annually. Any potential intangible asset impairment is identified by comparing the fair value of the indefinite lifeintangible asset to its carrying value. If the fair value of the intangible asset exceeds its carrying value, the intangible asset is considerednot to be impaired. If the carrying value of the intangible asset exceeds its fair value, impairment is identified as the difference betweenthe fair value and the carrying value and will result in a reduction in the carrying value of the intangible assets on the consolidatedbalance sheet and in the recognition of a non-cash impairment charge in operating income in the consolidated statement of earnings.
The Company determines the fair value of its trademarks and brand names by using the “Relief from Royalty Method”, a discountedcash flow model. The process of determining the fair values requires management to make assumptions of a long term nature regardingprojected future sales, terminal growth rates, royalty rates and discount rates. Projected future sales are consistent with strategic planspresented to Weston’s Board and discount rates are based on an industry after-tax cost of equity. These estimates and assumptions maychange in the future due to uncertain competitive and economic market conditions or changes in business strategies.
During the fourth quarter of 2006, Weston Foods performed the annual goodwill and indefinite life intangible assets impairment testsand it was determined that the fair value of each reporting unit and indefinite life intangible asset exceeded its respective carrying value.Therefore, no impairment of goodwill or indefinite life intangible assets was identified.
Income Taxes Future income tax assets and liabilities are recognized for the future income tax consequences attributable to temporary differencesbetween the financial statement carrying values of assets and liabilities and their respective income tax bases. Future income tax assetsor liabilities are measured using enacted or substantively enacted income tax rates expected to apply to taxable income in the years in which those temporary differences are expected to be recovered or settled. The calculation of current and future income taxesrequires management to make estimates and assumptions and to exercise judgment regarding the financial statement carrying values of assets and liabilities which are subject to accounting estimates inherent in those balances, the interpretation of income tax legislationacross various jurisdictions, expectations about future operating results and the timing of reversal of temporary differences and possibleaudits of tax filings by the regulatory authorities. Management believes it has adequately provided for income taxes based on currentavailable information.
On an ongoing basis, future income tax assets are reviewed to determine if a valuation allowance is required and if it is deemed more likelythan not that the future income tax assets will not be realized based on taxable income projections, a valuation allowance is recorded.
Changes or differences in these estimates or assumptions may result in changes to the current or future income tax balances on theconsolidated balance sheet, a charge or credit to income tax expense in the consolidated statement of earnings and may result in cashpayments or receipts.
48 George Weston Limited 2006 Financial Report
Management’s Discussion and Analysis
Fixed Assets Fixed assets to be held and used are reviewed for impairment annually and when events or circumstances indicate that their carryingvalue exceeds the sum of the undiscounted cash flows expected from their use and eventual disposition. An impairment loss is measuredas the amount by which the fixed assets carrying value exceeds the fair value. As discussed in notes 4 and 15 to the consolidatedfinancial statements, the Company reviewed certain fixed assets for impairment in the Weston Foods and Loblaw operating segmentsdue to circumstances that indicated that their carrying values may not be recovered. Factors that most significantly influence theimpairment assessments and calculations are estimates of future cash flows. The Company uses its internal plans in estimating futurecash flows. These plans reflect the Company’s current best estimate of future cash flows but may change in the future due to uncertaincompetitive and economic market conditions or changes in business strategies. Changes or differences in these estimates may result in changes to fixed assets on the consolidated balance sheet and a charge to operating income on the statement of earnings.
Goods and Services Tax and Provincial Sales TaxesDuring 2005, Loblaw recorded a charge relating to an audit and proposed assessment by the Canada Revenue Agency relating to GST on certain products sold on which GST was not appropriately charged and remitted. In light of this proposed assessment,the Company assessed and estimated the potential liabilities for GST and PST in other areas of its operations for various periods.Accordingly, a charge of $40 million was recorded in operating income in 2005. Approximately $1 million was paid in 2006 (2005 – $15 million) and approximately $24 million remains accrued as at year end 2006. The ultimate remaining amount paid will depend on the outcome of audits performed by or settlements reached with the various tax authorities, and therefore may differ from this estimate. Management will continue to assess the remaining accrual as progress towards resolution with the various tax authorities is made and will adjust the remaining accrual accordingly. Changes in this accrual may result in a charge or credit tooperating income in the consolidated statement of earnings.
ACCOUNTING STANDARDS IMPLEMENTED IN 2006
During the year, the Company implemented the following accounting standards issued by the Canadian Institute of Chartered Accountants:• Section 3831, “Non-Monetary Transactions”, issued in June 2005, replaces Section 3830 of the same name. The revised
standard addresses the measurement and disclosure of non-monetary transactions and defines when an exchange of assets ismeasured at fair value and when it is measured at the carrying amount. The criterion for the measurement of a non-monetarytransaction at fair value is based on whether the non-monetary transaction has commercial substance rather than the culminationof the earnings process under Section 3830. The revised standard is applied to non-monetary transactions initiated in periodsbeginning after January 1, 2006. The adoption of these new recommendations, on a prospective basis, did not have a materialimpact on the Company’s consolidated financial statements.
• EIC Abstract 156, “Accounting by a Vendor for Consideration Given to a Customer (Including a Reseller of the Vendor’s Products)”, issued in September 2005, addresses cash consideration, including sales incentives, given by a vendor to a customer.This consideration is presumed to be a reduction of the selling price of the vendor’s products and should therefore be classified as a reduction of sales in the vendor’s statement of earnings.
Prior to the implementation of EIC 156, Loblaw recorded certain sales incentives paid to independent franchisees, associates andindependent accounts in costs of sales, selling and administrative expenses on the statement of earnings. Accordingly, the implementationof EIC 156, on a retroactive basis, resulted in a reduction in both sales and cost of sales, selling and administrative expenses as follows:
First Quarter Second Quarter Third Quarter Fourth Quarter Total(12 weeks) (12 weeks) (16 weeks) (12 weeks) (52 weeks)
($ millions) 2005 2004 2005 2004 2005 2004 2005 2004 2005 2004
Sales as previously reported $ 6,972 $ 6,551 $ 7,273 $ 6,915 $ 9,737 $ 9,260 $ 7,381 $ 7,072 $31,363 $29,798Sales after reclassification $ 6,908 $ 6,496 $ 7,242 $ 6,882 $ 9,694 $ 9,215 $ 7,345 $ 7,026 $31,189 $29,619
Reclassification between sales and cost of sales, selling and administrative expenses $ 64 $ 55 $ 31 $ 33 $ 43 $ 45 $ 36 $ 46 $ 174 $ 179
George Weston Limited 2006 Financial Report 49
As reclassifications, these changes did not impact net earnings from continuing operations. Operating margins, adjusted operatingmargins(1) and adjusted EBITDA margins(1) for prior years have also been recalculated and updated, if applicable, as a result of the change in sales.
• EIC Abstract 157, “Implicit Variable Interest under AcG 15”, issued in October 2005, provides new guidance and clarification to the recommendations in AcG 15 with respect to all implicit variable interests held by an enterprise or its related parties. The guidance addresses how implicit variable interests should be included in the assessment as to whether the entity is theprimary beneficiary of the VIE. An implicit variable interest is an interest that indirectly absorbs or receives the variability of the entity. The adoption of these recommendations in the first quarter of 2006 did not have a material impact on the Company’sconsolidated financial statements.
• EIC Abstract 159, “Conditional Asset Retirement Obligations”, issued in December 2005, provides guidance on the recognition and measurement of a conditional asset retirement obligation and further clarifies the requirements under Section 3110, “Asset Requirement Obligations” such that a conditional asset retirement obligation should be recognized at fair value when the obligation to perform the asset retirement activity is unconditional even though uncertainty exists about the timing and/ormethod of settlement. These recommendations were adopted retroactively for the second quarter of 2006 and did not have a material impact on the Company’s consolidated financial statements.
• EIC Abstract 162, “Stock-Based Compensation for Employees Eligible to Retire before the Vesting Date”, issued in July 2006,requires that stock-based compensation granted to employees eligible to retire should be expensed at the time of grant. Weston’s and Loblaw’s stock-based compensation plans do not continue to vest after retirement, and therefore the adoption of this abstract did not have an impact on the Company’s consolidated financial statements.
FUTURE ACCOUNTING STANDARDS
The Company closely monitors new accounting standards to assess the impact, if any, on its consolidated financial statements. In 2007, the Company will be reviewing the implications of the following standards and implementing the recommendations as required:• The Accounting Standards Board continues to work towards the transition from Canadian GAAP to International Financial Reporting
Standards over a five-year period. After this transitional period, Canadian GAAP will cease to exist as a separate, distinct basis of financial reporting. The Company continues to closely monitor the changes resulting from this transition in preparation for the convergence.
Section 3855, “Financial Instruments – Recognition and Measurement”, Section 3865, “Hedges”, Section 1530, “ComprehensiveIncome”, Section 3861, “Financial Instruments – Disclosures and Presentation”, and Section 3251, “Equity”, issued in April 2005:• Section 3855, “Financial Instruments – Recognition and Measurement”, establishes guidance for recognizing and measuring financial
assets, financial liabilities and non-financial derivatives. The standard requires that financial instruments within scope, includingderivatives, be included on the Company’s balance sheet and measured, either at fair value or, in limited circumstances, at cost or amortized cost. All financial instruments must be classified into a defined category, namely, held-to-maturity investments,held-for-trading financial assets or financial liabilities, loans and receivables, available-for-sale financial assets, and other financialliabilities. This classification will determine how each instrument is measured and how gains and losses are recognized. Held-for-trading financial assets and financial liabilities are measured at fair value with gains and losses recognized in net income.Financial assets held-to-maturity, loans and receivables and financial liabilities, other than those held-for-trading, are measured at amortized cost using the effective interest method of amortization. Available-for-sale financial assets are measured at fair value,with unrealized gains and losses including changes in foreign exchange rates being recognized in other comprehensive income, a new section of shareholders’ equity. Investments in equity instruments classified as available-for-sale that do not have a quotedmarket price in an active market can be measured at cost. The recommendations further define derivatives to include non-financialderivatives and embedded derivatives, which meet certain criteria. All derivatives must be classified as held-for-trading unless they are designated in a hedging relationship.
• Section 3865, “Hedges”, replaces AcG 13, “Hedging Relationships” and the guidance formerly in Section 1650, “Foreign CurrencyTranslation” will be replaced by Section 1651 of the same name, such that foreign exchange gains or losses on available-for-salefinancial assets be accounted for in other comprehensive income instead of net earnings. The requirements for identification,designation and documentation of hedging relationships remain unchanged. The new guidance addresses the accounting treatmentof qualifying hedging relationships and the necessary disclosures. The standard defines three specific hedging relationships,namely, fair value hedges, cash flow hedges, and hedges of a net investment in self-sustaining foreign operations, and defines
(1) See Non-GAAP Financial Measures beginning on page 51.
50 George Weston Limited 2006 Financial Report
Management’s Discussion and Analysis
how the accounting should be performed. Changes in the fair value of hedging derivatives in a fair value hedge are offset in the consolidated statement of earnings against the change in fair value of the asset, liability or cash flow being hedged. In cash flow hedges, the changes in fair value are recorded in other comprehensive income, a new section of shareholders’ equity. To the extent the change in fair value of the derivative is not completely offset by the change in fair value of the item it is hedging,the ineffective portion of the hedging relationship is recorded immediately in the consolidated statement of earnings.
• Section 1530, “Comprehensive Income”, introduces a statement of comprehensive income, which will be included in the interimand annual financial statements. Comprehensive income is comprised of net income and other comprehensive income, andrepresents the change in equity during a period from transactions and other events with non-owner sources. Other comprehensiveincome will include unrealized gains and losses on financial assets that are classified as available-for-sale and changes in fair value of the effective portion of cash flow hedges.
• Section 3861, “Financial Instruments – Disclosure and Presentation”, replaces Section 3860 of the same name, and addresses the presentation and disclosure of financial instruments and non-financial derivatives. The main features of these newrecommendations revise the requirements to provide accounting policy disclosures and provide new requirements for disclosure on fair value.
• Section 3251, “Equity”, replaces Section 3250, “Surplus” and establishes standards for the presentation of equity and changes in equity during the reporting period and requires that an enterprise present separately equity components and changes in equityarising from (i) net income; (ii) other comprehensive income; (iii) other changes in retained earnings; (iv) changes in contributedsurplus; (v) changes in share capital; and (vi) changes in reserves.
These standards are effective for interim and annual financial statements for fiscal years beginning on or after October 1, 2006.Consequently, the Company will implement them in the first quarter of 2007. The transitional adjustments resulting from thesestandards will be recognized in the opening balances of retained earnings and other comprehensive income as appropriate. The Company is determining the impact of these changes based on the transitional guidance within these sections. Prior periods will not be restated.
• Section 1506, “Accounting Changes”, issued in July 2006, revises current standards on changes in accounting policy, estimates or errors. An entity is permitted to change an accounting policy only when it results in financial statements that provide reliable and more relevant information or results from a requirement under a primary source of Canadian GAAP. The guidance also addresses how to account for a change in accounting policy, estimate or corrections of errors, and establishes enhanceddisclosures about their effects on the financial statements. These recommendations are effective for fiscal years beginning on or after January 1, 2007. The Company will implement these recommendations as required on a prospective basis.
• Section 3862, “Financial Instruments – Disclosure” and Section 3863, “Financial Instruments – Presentation”, both issued in December 2006, revise the current standards on financial instrument disclosure and presentation, and place an increasedemphasis on disclosures regarding the risks associated with both recognized and unrecognized financial instruments and how these risks are managed. Section 3863 establishes standards for presentation of financial instruments and non-financialderivatives and provides additional guidance with classification of financial instruments, from the perspective of the issuer, between liabilities and equity. These recommendations are effective for fiscal years beginning on or after October 1, 2007 and therefore the Company will implement them in the first quarter of 2008.
• Section 1535, “Capital Disclosures”, issued in December 2006, establishes guidelines for the disclosure of information regarding a company’s capital and how it is managed. Enhanced disclosure with respect to the objectives, policies and processes formanaging capital and quantitative disclosures about what a company regards as capital are required. These recommendations are effective for fiscal years beginning on or after October 1, 2007 and therefore the Company will implement them in the firstquarter of 2008.
• EIC Abstract 163, “Determining the variability to be considered in applying AcG 15”, issued in September 2006, addresses how to assess whether arrangements should be treated as variable interests or considered as creators of variability by a reportingenterprise in applying AcG 15. This abstract is effective for fiscal years beginning on or after January 1, 2007. The Company willimplement these recommendations as required on a prospective basis. The Company does not expect the adoption of this abstractto have a material impact on the consolidated financial statements.
OUTLOOK
The outlook for the consolidated results of George Weston Limited for 2007 reflects the underlying results of its operating segments as discussed below. The consolidated results continue to reflect the changes undertaken by both the Weston Foods and Loblawoperating businesses in order to position them for strong growth in the future.
In 2007, Weston Foods expects to experience improvements in sales and adjusted operating income(1), on a year-over-year basis, as a result of improvements in volume and pricing and as the benefits of restructuring and cost reduction activities continue to be realized.Operating margins are expected to continue to be pressured by underlying cost inflation.
Loblaw has a number of strengths at its core – strong market share and control label products and a strong store network under various store formats with the potential to meet the needs of all Canadians. But as Loblaw looks forward, it must transition into a lean company that is ready and able to compete on all fronts. 2006 marked the beginning of this transition. Loblaw’s main focusgoing forward is on simplifying its organizational structure, on retailing basics such as on-shelf availability and customer focus, on innovation as a competitive advantage and on executing Loblaw’s growth strategy.
This outlook should be read in conjunction with the Forward-Looking Statements section of the MD&A on page 1.
NON-GAAP FINANCIAL MEASURES
The Company reports its financial results in accordance with Canadian GAAP. However, the Company has included certain non-GAAPfinancial measures and ratios, which it believes provide useful information to both management and readers of this Annual Report,including this Financial Report, in measuring the financial performance and financial condition of the Company for the reasons set out below. These measures do not have a standardized meaning prescribed by Canadian GAAP and, therefore, may not be comparableto similarly titled measures presented by other publicly traded companies, nor should they be construed as an alternative to otherfinancial measures determined in accordance with Canadian GAAP.
Sales and Sales Growth Excluding the Impact of VIEs These financial measures exclude the impact on sales from the consolidation by the Company of certain Loblaw independent franchiseeswhich resulted from the implementation of AcG 15 retroactively without restatement effective January 1, 2005. This impact on sales is excluded because the Company believes this allows for a more effective analysis of the operating performance of the Company.Both the current and comparative measures reflect the retroactive implementation of EIC 156. A reconciliation of the financial measuresto the Canadian GAAP financial measures is included in the tables “Sales and Sales Growth Excluding the Impact of VIEs” included onpages 4, 21, 34 and 37 of this MD&A.
George Weston Limited 2006 Financial Report 51
(1) See Non-GAAP Financial Measures beginning on page 51.
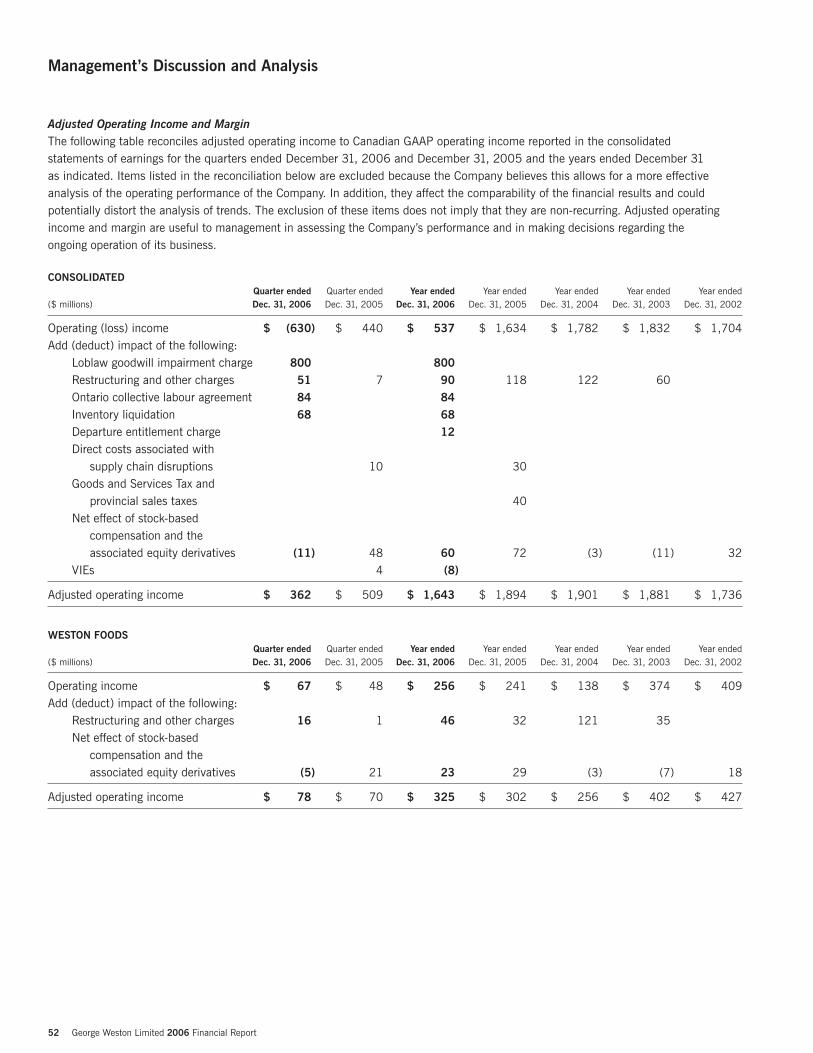
52 George Weston Limited 2006 Financial Report
Management’s Discussion and Analysis
Adjusted Operating Income and Margin The following table reconciles adjusted operating income to Canadian GAAP operating income reported in the consolidated statements of earnings for the quarters ended December 31, 2006 and December 31, 2005 and the years ended December 31 as indicated. Items listed in the reconciliation below are excluded because the Company believes this allows for a more effective analysis of the operating performance of the Company. In addition, they affect the comparability of the financial results and couldpotentially distort the analysis of trends. The exclusion of these items does not imply that they are non-recurring. Adjusted operatingincome and margin are useful to management in assessing the Company’s performance and in making decisions regarding the ongoing operation of its business.
CONSOLIDATEDQuarter ended Quarter ended Year ended Year ended Year ended Year ended Year ended
($ millions) Dec. 31, 2006 Dec. 31, 2005 Dec. 31, 2006 Dec. 31, 2005 Dec. 31, 2004 Dec. 31, 2003 Dec. 31, 2002
Operating (loss) income $ (630) $ 440 $ 537 $ 1,634 $ 1,782 $ 1,832 $ 1,704Add (deduct) impact of the following:
Loblaw goodwill impairment charge 800 800Restructuring and other charges 51 7 90 118 122 60Ontario collective labour agreement 84 84Inventory liquidation 68 68Departure entitlement charge 12Direct costs associated with
supply chain disruptions 10 30Goods and Services Tax and
provincial sales taxes 40Net effect of stock-based
compensation and theassociated equity derivatives (11) 48 60 72 (3) (11) 32
VIEs 4 (8)
Adjusted operating income $ 362 $ 509 $ 1,643 $ 1,894 $ 1,901 $ 1,881 $ 1,736
WESTON FOODSQuarter ended Quarter ended Year ended Year ended Year ended Year ended Year ended
($ millions) Dec. 31, 2006 Dec. 31, 2005 Dec. 31, 2006 Dec. 31, 2005 Dec. 31, 2004 Dec. 31, 2003 Dec. 31, 2002
Operating income $ 67 $ 48 $ 256 $ 241 $ 138 $ 374 $ 409Add (deduct) impact of the following:
Restructuring and other charges 16 1 46 32 121 35Net effect of stock-based
compensation and theassociated equity derivatives (5) 21 23 29 (3) (7) 18
Adjusted operating income $ 78 $ 70 $ 325 $ 302 $ 256 $ 402 $ 427
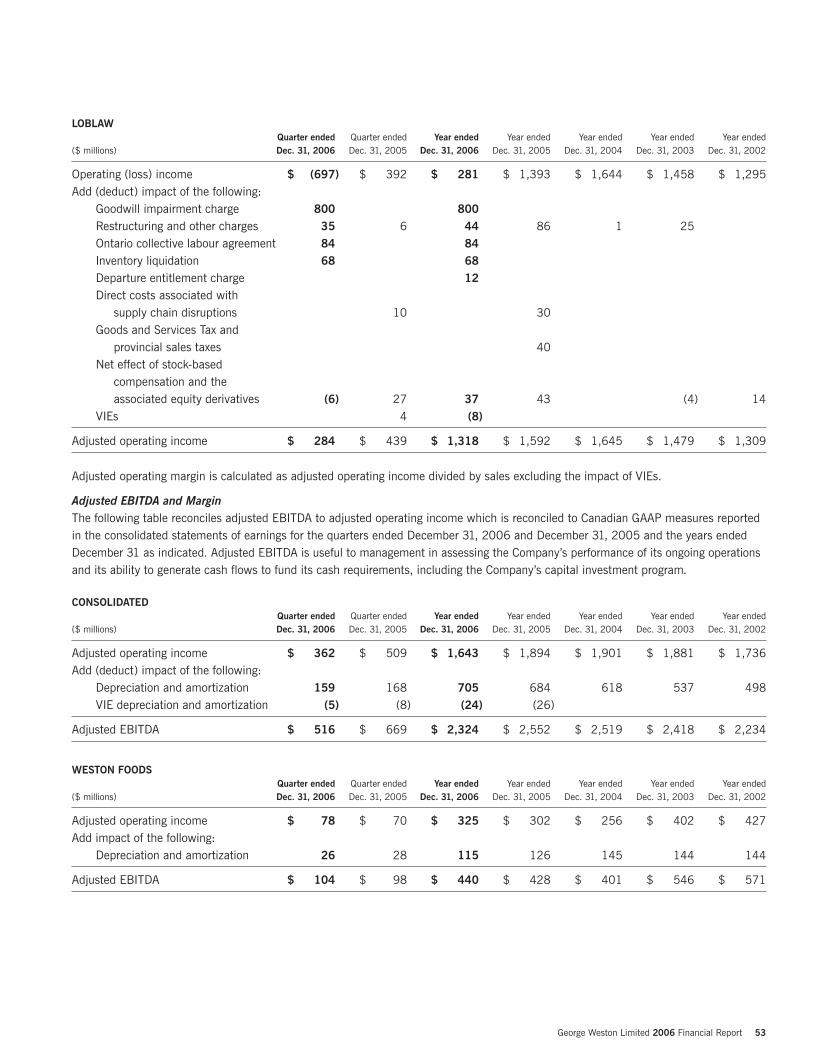
LOBLAWQuarter ended Quarter ended Year ended Year ended Year ended Year ended Year ended
($ millions) Dec. 31, 2006 Dec. 31, 2005 Dec. 31, 2006 Dec. 31, 2005 Dec. 31, 2004 Dec. 31, 2003 Dec. 31, 2002
Operating (loss) income $ (697) $ 392 $ 281 $ 1,393 $ 1,644 $ 1,458 $ 1,295Add (deduct) impact of the following:
Goodwill impairment charge 800 800Restructuring and other charges 35 6 44 86 1 25Ontario collective labour agreement 84 84Inventory liquidation 68 68Departure entitlement charge 12Direct costs associated with
supply chain disruptions 10 30Goods and Services Tax and
provincial sales taxes 40Net effect of stock-based
compensation and theassociated equity derivatives (6) 27 37 43 (4) 14
VIEs 4 (8)
Adjusted operating income $ 284 $ 439 $ 1,318 $ 1,592 $ 1,645 $ 1,479 $ 1,309
Adjusted operating margin is calculated as adjusted operating income divided by sales excluding the impact of VIEs.
Adjusted EBITDA and Margin The following table reconciles adjusted EBITDA to adjusted operating income which is reconciled to Canadian GAAP measures reportedin the consolidated statements of earnings for the quarters ended December 31, 2006 and December 31, 2005 and the years endedDecember 31 as indicated. Adjusted EBITDA is useful to management in assessing the Company’s performance of its ongoing operationsand its ability to generate cash flows to fund its cash requirements, including the Company’s capital investment program.
CONSOLIDATED Quarter ended Quarter ended Year ended Year ended Year ended Year ended Year ended
($ millions) Dec. 31, 2006 Dec. 31, 2005 Dec. 31, 2006 Dec. 31, 2005 Dec. 31, 2004 Dec. 31, 2003 Dec. 31, 2002
Adjusted operating income $ 362 $ 509 $ 1,643 $ 1,894 $ 1,901 $ 1,881 $ 1,736Add (deduct) impact of the following:
Depreciation and amortization 159 168 705 684 618 537 498VIE depreciation and amortization (5) (8) (24) (26)
Adjusted EBITDA $ 516 $ 669 $ 2,324 $ 2,552 $ 2,519 $ 2,418 $ 2,234
WESTON FOODSQuarter ended Quarter ended Year ended Year ended Year ended Year ended Year ended
($ millions) Dec. 31, 2006 Dec. 31, 2005 Dec. 31, 2006 Dec. 31, 2005 Dec. 31, 2004 Dec. 31, 2003 Dec. 31, 2002
Adjusted operating income $ 78 $ 70 $ 325 $ 302 $ 256 $ 402 $ 427Add impact of the following:
Depreciation and amortization 26 28 115 126 145 144 144
Adjusted EBITDA $ 104 $ 98 $ 440 $ 428 $ 401 $ 546 $ 571
George Weston Limited 2006 Financial Report 53
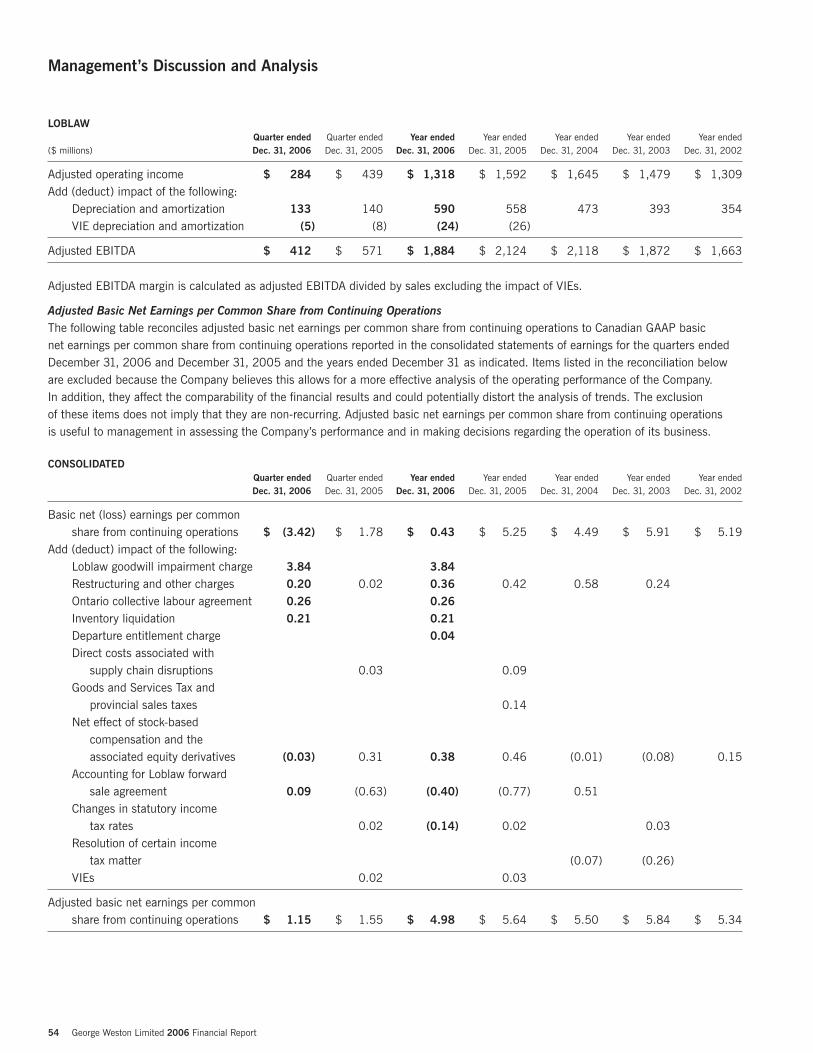
54 George Weston Limited 2006 Financial Report
Management’s Discussion and Analysis
LOBLAWQuarter ended Quarter ended Year ended Year ended Year ended Year ended Year ended
($ millions) Dec. 31, 2006 Dec. 31, 2005 Dec. 31, 2006 Dec. 31, 2005 Dec. 31, 2004 Dec. 31, 2003 Dec. 31, 2002
Adjusted operating income $ 284 $ 439 $ 1,318 $ 1,592 $ 1,645 $ 1,479 $ 1,309Add (deduct) impact of the following:
Depreciation and amortization 133 140 590 558 473 393 354VIE depreciation and amortization (5) (8) (24) (26)
Adjusted EBITDA $ 412 $ 571 $ 1,884 $ 2,124 $ 2,118 $ 1,872 $ 1,663
Adjusted EBITDA margin is calculated as adjusted EBITDA divided by sales excluding the impact of VIEs.
Adjusted Basic Net Earnings per Common Share from Continuing Operations The following table reconciles adjusted basic net earnings per common share from continuing operations to Canadian GAAP basic net earnings per common share from continuing operations reported in the consolidated statements of earnings for the quarters endedDecember 31, 2006 and December 31, 2005 and the years ended December 31 as indicated. Items listed in the reconciliation beloware excluded because the Company believes this allows for a more effective analysis of the operating performance of the Company. In addition, they affect the comparability of the financial results and could potentially distort the analysis of trends. The exclusion of these items does not imply that they are non-recurring. Adjusted basic net earnings per common share from continuing operations is useful to management in assessing the Company’s performance and in making decisions regarding the operation of its business.
CONSOLIDATEDQuarter ended Quarter ended Year ended Year ended Year ended Year ended Year endedDec. 31, 2006 Dec. 31, 2005 Dec. 31, 2006 Dec. 31, 2005 Dec. 31, 2004 Dec. 31, 2003 Dec. 31, 2002
Basic net (loss) earnings per common share from continuing operations $ (3.42) $ 1.78 $ 0.43 $ 5.25 $ 4.49 $ 5.91 $ 5.19
Add (deduct) impact of the following:Loblaw goodwill impairment charge 3.84 3.84Restructuring and other charges 0.20 0.02 0.36 0.42 0.58 0.24Ontario collective labour agreement 0.26 0.26Inventory liquidation 0.21 0.21Departure entitlement charge 0.04Direct costs associated with
supply chain disruptions 0.03 0.09Goods and Services Tax and
provincial sales taxes 0.14Net effect of stock-based
compensation and theassociated equity derivatives (0.03) 0.31 0.38 0.46 (0.01) (0.08) 0.15
Accounting for Loblaw forwardsale agreement 0.09 (0.63) (0.40) (0.77) 0.51
Changes in statutory incometax rates 0.02 (0.14) 0.02 0.03
Resolution of certain incometax matter (0.07) (0.26)
VIEs 0.02 0.03
Adjusted basic net earnings per commonshare from continuing operations $ 1.15 $ 1.55 $ 4.98 $ 5.64 $ 5.50 $ 5.84 $ 5.34
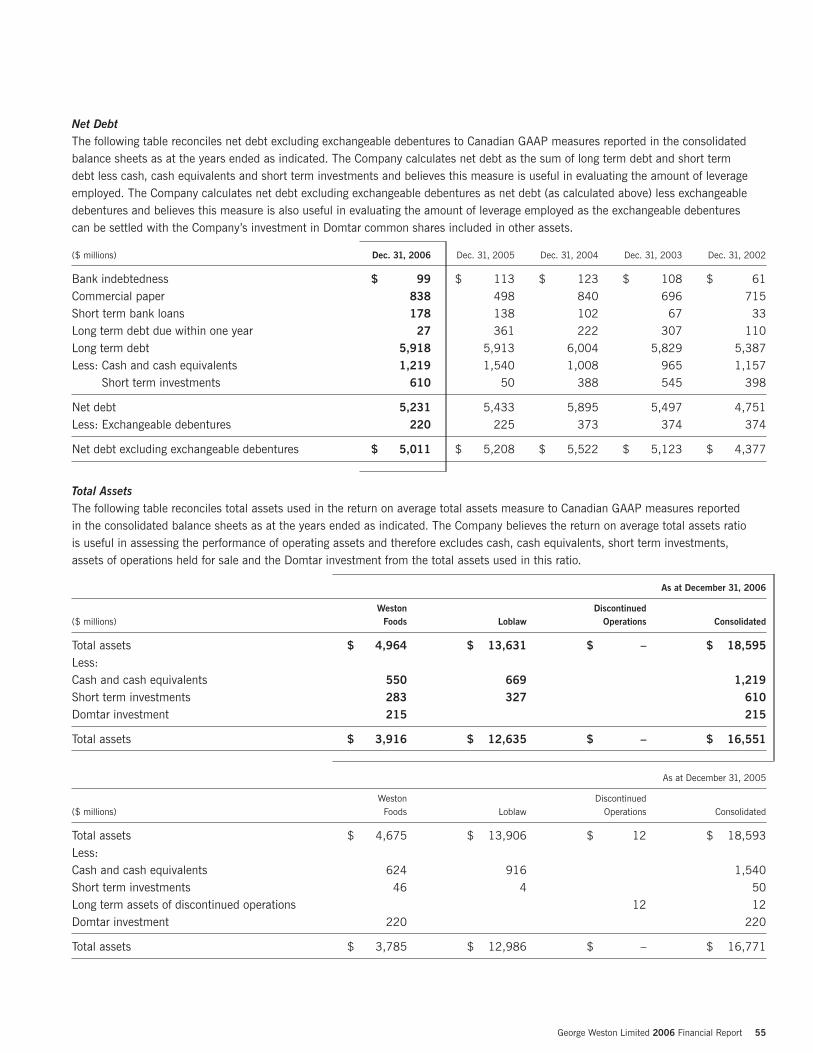
George Weston Limited 2006 Financial Report 55
Net DebtThe following table reconciles net debt excluding exchangeable debentures to Canadian GAAP measures reported in the consolidatedbalance sheets as at the years ended as indicated. The Company calculates net debt as the sum of long term debt and short term debt less cash, cash equivalents and short term investments and believes this measure is useful in evaluating the amount of leverageemployed. The Company calculates net debt excluding exchangeable debentures as net debt (as calculated above) less exchangeabledebentures and believes this measure is also useful in evaluating the amount of leverage employed as the exchangeable debentures can be settled with the Company’s investment in Domtar common shares included in other assets.
($ millions) Dec. 31, 2006 Dec. 31, 2005 Dec. 31, 2004 Dec. 31, 2003 Dec. 31, 2002
Bank indebtedness $ 99 $ 113 $ 123 $ 108 $ 61Commercial paper 838 498 840 696 715Short term bank loans 178 138 102 67 33Long term debt due within one year 27 361 222 307 110Long term debt 5,918 5,913 6,004 5,829 5,387Less: Cash and cash equivalents 1,219 1,540 1,008 965 1,157
Short term investments 610 50 388 545 398
Net debt 5,231 5,433 5,895 5,497 4,751Less: Exchangeable debentures 220 225 373 374 374
Net debt excluding exchangeable debentures $ 5,011 $ 5,208 $ 5,522 $ 5,123 $ 4,377
Total Assets The following table reconciles total assets used in the return on average total assets measure to Canadian GAAP measures reported in the consolidated balance sheets as at the years ended as indicated. The Company believes the return on average total assets ratio is useful in assessing the performance of operating assets and therefore excludes cash, cash equivalents, short term investments, assets of operations held for sale and the Domtar investment from the total assets used in this ratio.
As at December 31, 2006
Weston Discontinued($ millions) Foods Loblaw Operations Consolidated
Total assets $ 4,964 $ 13,631 $ – $ 18,595Less:Cash and cash equivalents 550 669 1,219Short term investments 283 327 610Domtar investment 215 215
Total assets $ 3,916 $ 12,635 $ – $ 16,551
As at December 31, 2005
Weston Discontinued($ millions) Foods Loblaw Operations Consolidated
Total assets $ 4,675 $ 13,906 $ 12 $ 18,593Less:Cash and cash equivalents 624 916 1,540Short term investments 46 4 50Long term assets of discontinued operations 12 12Domtar investment 220 220
Total assets $ 3,785 $ 12,986 $ – $ 16,771
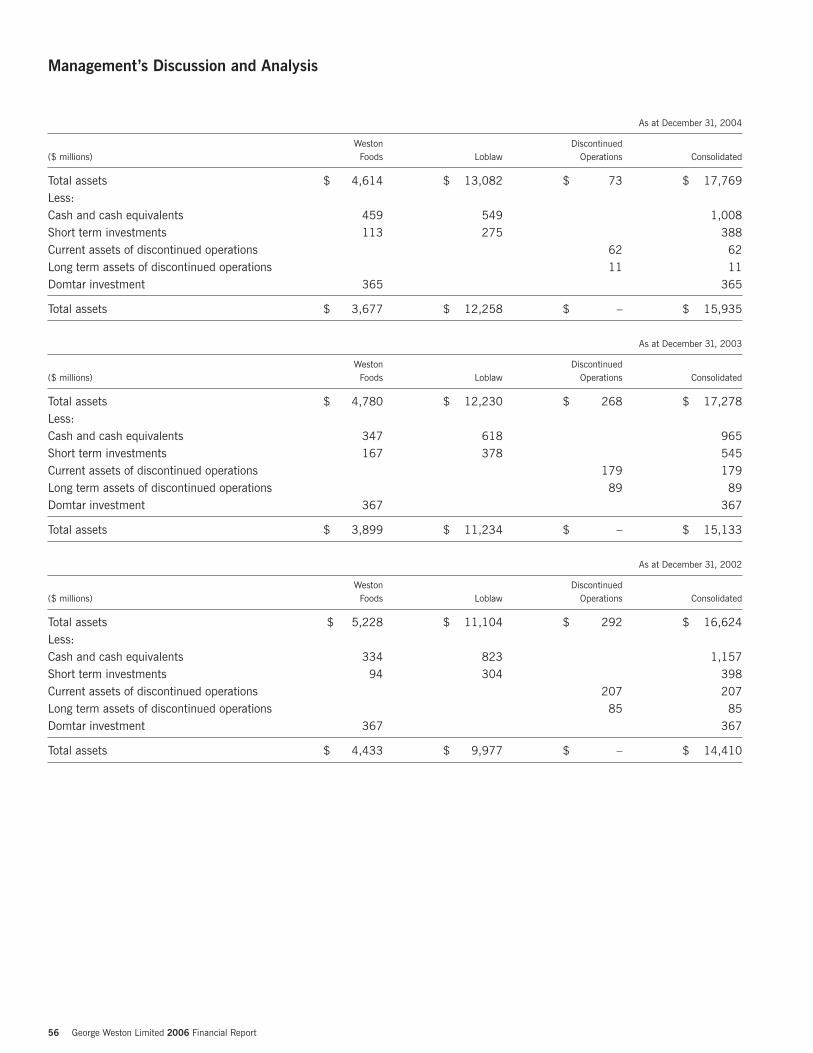
56 George Weston Limited 2006 Financial Report
As at December 31, 2004
Weston Discontinued($ millions) Foods Loblaw Operations Consolidated
Total assets $ 4,614 $ 13,082 $ 73 $ 17,769Less:Cash and cash equivalents 459 549 1,008Short term investments 113 275 388Current assets of discontinued operations 62 62Long term assets of discontinued operations 11 11Domtar investment 365 365
Total assets $ 3,677 $ 12,258 $ – $ 15,935
As at December 31, 2003
Weston Discontinued($ millions) Foods Loblaw Operations Consolidated
Total assets $ 4,780 $ 12,230 $ 268 $ 17,278Less:Cash and cash equivalents 347 618 965Short term investments 167 378 545Current assets of discontinued operations 179 179Long term assets of discontinued operations 89 89Domtar investment 367 367
Total assets $ 3,899 $ 11,234 $ – $ 15,133
As at December 31, 2002
Weston Discontinued($ millions) Foods Loblaw Operations Consolidated
Total assets $ 5,228 $ 11,104 $ 292 $ 16,624Less:Cash and cash equivalents 334 823 1,157Short term investments 94 304 398Current assets of discontinued operations 207 207Long term assets of discontinued operations 85 85Domtar investment 367 367
Total assets $ 4,433 $ 9,977 $ – $ 14,410
Management’s Discussion and Analysis
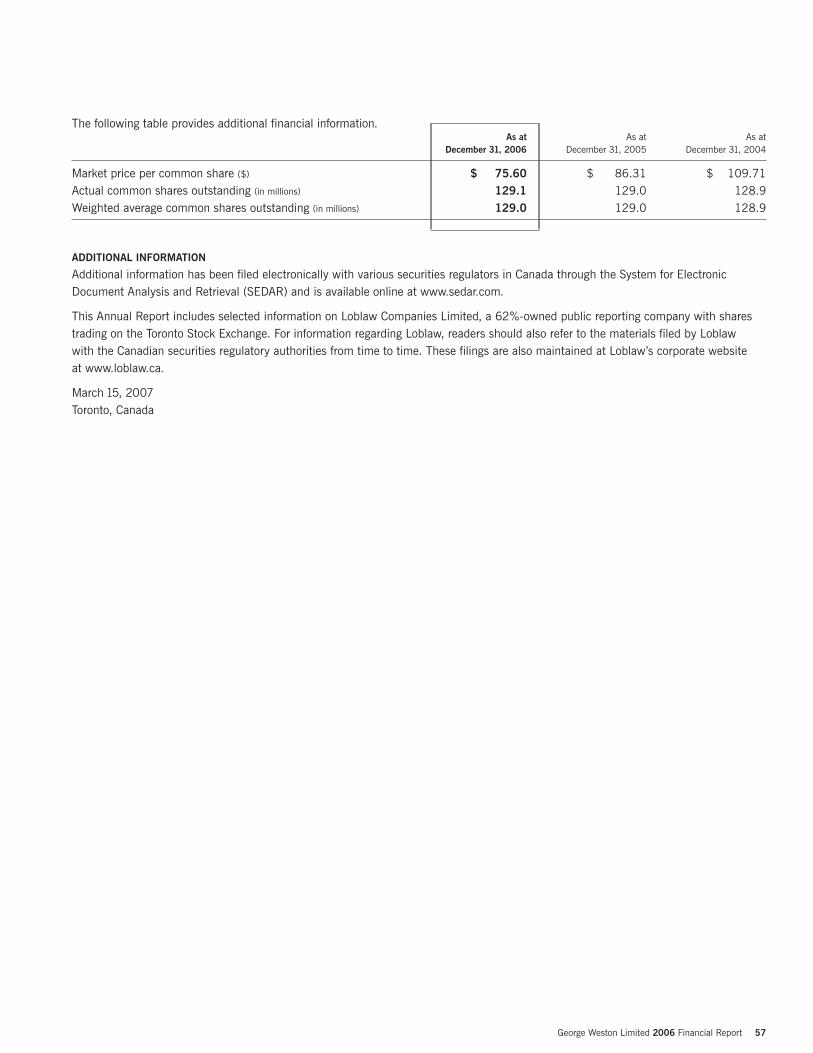
The following table provides additional financial information.As at As at As at
December 31, 2006 December 31, 2005 December 31, 2004
Market price per common share ($) $ 75.60 $ 86.31 $ 109.71Actual common shares outstanding (in millions) 129.1 129.0 128.9Weighted average common shares outstanding (in millions) 129.0 129.0 128.9
ADDITIONAL INFORMATION
Additional information has been filed electronically with various securities regulators in Canada through the System for ElectronicDocument Analysis and Retrieval (SEDAR) and is available online at www.sedar.com.
This Annual Report includes selected information on Loblaw Companies Limited, a 62%-owned public reporting company with sharestrading on the Toronto Stock Exchange. For information regarding Loblaw, readers should also refer to the materials filed by Loblaw with the Canadian securities regulatory authorities from time to time. These filings are also maintained at Loblaw’s corporate website at www.loblaw.ca.
March 15, 2007Toronto, Canada
George Weston Limited 2006 Financial Report 57
58 George Weston Limited 2006 Financial Report
Financial Results
Management’s Statement of Responsibility for Financial Reporting 59
Independent Auditors’ Report 60
Consolidated Statements of Earnings 61
Consolidated Statements of Retained Earnings 61
Consolidated Balance Sheets 62
Consolidated Cash Flow Statements 63
Notes to the Consolidated Financial Statements 64
Note 1. Summary of Significant Accounting Policies 64
Note 2. Implementation of New Accounting Standards 68
Note 3. Goodwill and Intangible Assets 70
Note 4. Restructuring and Other Charges 71
Note 5. Goods and Services Tax and Provincial Sales Taxes 73
Note 6. Collective Agreement 73
Note 7. Interest Expense and Other Financing Charges 73
Note 8. Business Acquisitions 74
Note 9. Income Taxes 74
Note 10. Basic and Diluted Net Earnings per Common Share from Continuing Operations 75
Note 11. Discontinued Operations 76
Note 12. Cash, Cash Equivalents and Short Term Investments 76
Note 13. Credit Card Receivables 77
Note 14. Inventory Liquidation 78
Note 15. Fixed Assets 78
Note 16. Other Assets 78
Note 17. Employee Future Benefits 79
Note 18. Long Term Debt 84
Note 19. Other Liabilities 86
Note 20. Share Capital 86
Note 21. Stock-Based Compensation 88
Note 22. Financial Instruments 90
Note 23. Cumulative Foreign Currency Translation Adjustment 92
Note 24. Contingencies, Commitments and Guarantees 93
Note 25. Related Party Transactions 94
Note 26. Subsequent Events 94
Note 27. Segment Information 94
Five Year Summary 96
Glossary 99

Management’s Statement of Responsibility for Financial Reporting
The management of George Weston Limited is responsible for the preparation, presentation and integrity of the accompanyingconsolidated financial statements, Management’s Discussion and Analysis and all other information in the Annual Report. This responsibility includes the selection and consistent application of appropriate accounting principles and methods in addition to making the judgments and estimates necessary to prepare the consolidated financial statements in accordance with Canadiangenerally accepted accounting principles. It also includes ensuring that the financial information presented elsewhere in the AnnualReport is consistent with that in the consolidated financial statements.
To provide reasonable assurance that assets are safeguarded and that relevant and reliable financial information is produced,management is required to design a system of internal controls and certify as to the design effectiveness of internal controls overfinancial reporting. Internal auditors, who are employees of the Company, review and evaluate internal controls on management’s behalf. KPMG LLP, whose report follows, were appointed as independent auditors by a vote of the Company’s shareholders to audit the consolidated financial statements.
The Board of Directors, acting through an Audit Committee comprised solely of directors who are independent of the Company, isresponsible for determining that management fulfills its responsibilities in the preparation of the consolidated financial statements and the financial control of operations. The Audit Committee recommends the independent auditors for appointment by the shareholders. The Audit Committee meets regularly with senior and financial management, internal auditors and the independent auditors to discussinternal controls, auditing activities and financial reporting matters. The independent auditors and internal auditors have unrestrictedaccess to the Audit Committee. These consolidated financial statements and Management’s Discussion and Analysis have been approvedby the Board of Directors for inclusion in the Annual Report based on the review and recommendation of the Audit Committee.
W. Galen Weston Richard P. MavrinacChairman and President Chief Financial Officer
Toronto, CanadaMarch 15, 2007
George Weston Limited 2006 Financial Report 59
To the Shareholders of George Weston Limited:We have audited the consolidated balance sheets of George Weston Limited as at December 31, 2006 and 2005 and the consolidatedstatements of earnings, retained earnings and cash flow for the years then ended. These consolidated financial statements are theresponsibility of the Company’s management. Our responsibility is to express an opinion on these consolidated financial statementsbased on our audits.
We conducted our audits in accordance with Canadian generally accepted auditing standards. Those standards require that we plan and perform an audit to obtain reasonable assurance whether the consolidated financial statements are free of material misstatement.An audit includes examining, on a test basis, evidence supporting the amounts and disclosures in the consolidated financial statements. An audit also includes assessing the accounting principles used and significant estimates made by management, as well as evaluatingthe overall consolidated financial statement presentation.
In our opinion, these consolidated financial statements present fairly, in all material respects, the financial position of the Company as at December 31, 2006 and 2005 and the results of its operations and its cash flow for the years then ended in accordance withCanadian generally accepted accounting principles.
Chartered Accountants Toronto, CanadaMarch 15, 2007
60 George Weston Limited 2006 Financial Report
Independent Auditors’ Report
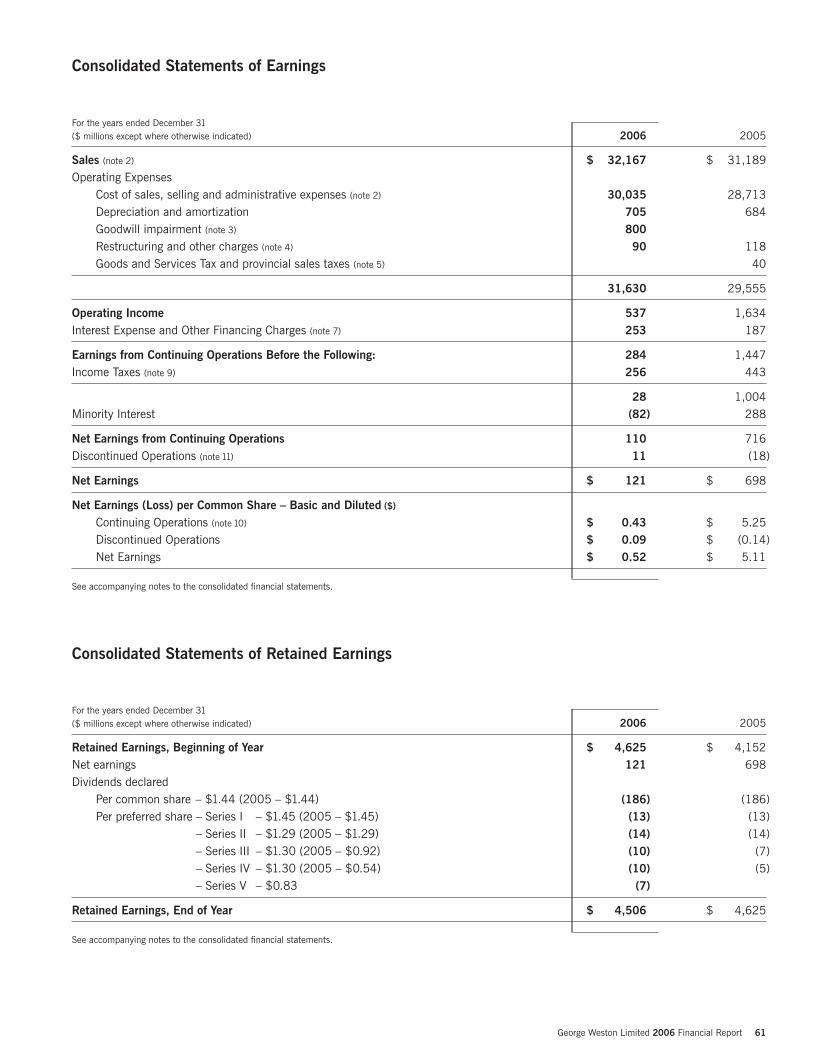
Consolidated Statements of Retained Earnings
For the years ended December 31($ millions except where otherwise indicated) 2006 2005
Retained Earnings, Beginning of Year $ 4,625 $ 4,152Net earnings 121 698Dividends declared
Per common share – $1.44 (2005 – $1.44) (186) (186)Per preferred share – Series I – $1.45 (2005 – $1.45) (13) (13)
– Series II – $1.29 (2005 – $1.29) (14) (14)– Series III – $1.30 (2005 – $0.92) (10) (7)– Series IV – $1.30 (2005 – $0.54) (10) (5)– Series V – $0.83 (7)
Retained Earnings, End of Year $ 4,506 $ 4,625
See accompanying notes to the consolidated financial statements.
Consolidated Statements of Earnings
For the years ended December 31($ millions except where otherwise indicated) 2006 2005
Sales (note 2) $ 32,167 $ 31,189Operating Expenses
Cost of sales, selling and administrative expenses (note 2) 30,035 28,713Depreciation and amortization 705 684Goodwill impairment (note 3) 800Restructuring and other charges (note 4) 90 118Goods and Services Tax and provincial sales taxes (note 5) 40
31,630 29,555
Operating Income 537 1,634Interest Expense and Other Financing Charges (note 7) 253 187
Earnings from Continuing Operations Before the Following: 284 1,447Income Taxes (note 9) 256 443
28 1,004Minority Interest (82) 288
Net Earnings from Continuing Operations 110 716Discontinued Operations (note 11) 11 (18)
Net Earnings $ 121 $ 698
Net Earnings (Loss) per Common Share – Basic and Diluted ($)
Continuing Operations (note 10) $ 0.43 $ 5.25Discontinued Operations $ 0.09 $ (0.14)Net Earnings $ 0.52 $ 5.11
See accompanying notes to the consolidated financial statements.
George Weston Limited 2006 Financial Report 61

62 George Weston Limited 2006 Financial Report
Consolidated Balance Sheets
As at December 31($ millions) 2006 2005
ASSETS
Current AssetsCash and cash equivalents (note 12) $ 1,219 $ 1,540Short term investments (note 12) 610 50Accounts receivable (note 13) 1,007 933Inventories (note 14) 2,187 2,173Income taxes 80 5Future income taxes (note 9) 151 134Prepaid expenses and other assets 59 53
Total Current Assets 5,313 4,888Fixed Assets (note 15) 9,219 8,916Goodwill and Intangible Assets (note 3) 2,536 3,367Future Income Taxes (note 9) 68 89Other Assets (note 16) 1,459 1,321Long Term Assets of Discontinued Operations (note 11) 12
Total Assets $ 18,595 $ 18,593
LIABILITIES
Current LiabilitiesBank indebtedness $ 99 $ 113Commercial paper 838 498Accounts payable and accrued liabilities 3,196 3,263Short term bank loans (note 18) 178 138Long term debt due within one year (note 18) 27 361Current liabilities of discontinued operations (note 11) 4 10
Total Current Liabilities 4,342 4,383Long Term Debt (note 18) 5,918 5,913Future Income Taxes (note 9) 366 343Other Liabilities (note 19) 668 580Minority Interest 2,088 2,255
Total Liabilities 13,382 13,474
SHAREHOLDERS’ EQUITY
Share Capital (notes 20 & 21) 1,210 1,012Retained Earnings 4,506 4,625Cumulative Foreign Currency Translation Adjustment (note 23) (503) (518)
Total Shareholders’ Equity 5,213 5,119
Total Liabilities and Shareholders’ Equity $ 18,595 $ 18,593
See accompanying notes to the consolidated financial statements.
Approved on behalf of the Board
W. Galen Weston A. Charles BaillieDirector Director
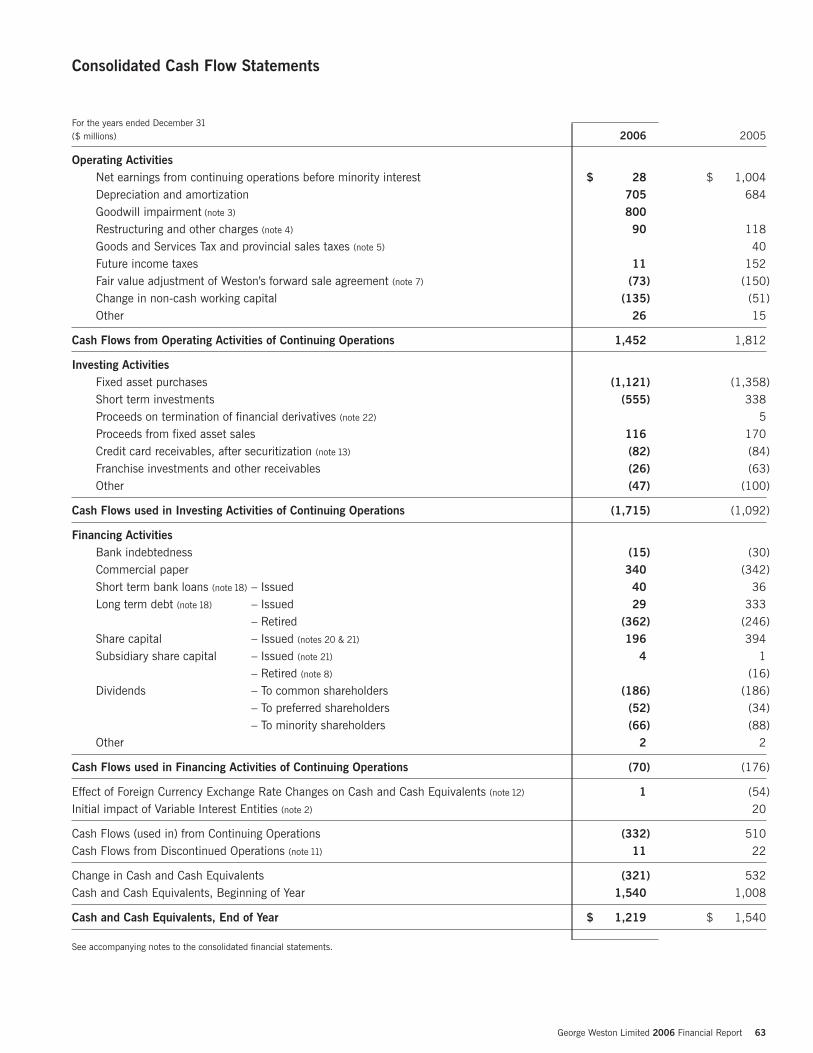
Consolidated Cash Flow Statements
For the years ended December 31($ millions) 2006 2005
Operating ActivitiesNet earnings from continuing operations before minority interest $ 28 $ 1,004Depreciation and amortization 705 684Goodwill impairment (note 3) 800Restructuring and other charges (note 4) 90 118Goods and Services Tax and provincial sales taxes (note 5) 40Future income taxes 11 152Fair value adjustment of Weston’s forward sale agreement (note 7) (73) (150)Change in non-cash working capital (135) (51)Other 26 15
Cash Flows from Operating Activities of Continuing Operations 1,452 1,812
Investing ActivitiesFixed asset purchases (1,121) (1,358)Short term investments (555) 338Proceeds on termination of financial derivatives (note 22) 5Proceeds from fixed asset sales 116 170Credit card receivables, after securitization (note 13) (82) (84)Franchise investments and other receivables (26) (63)Other (47) (100)
Cash Flows used in Investing Activities of Continuing Operations (1,715) (1,092)
Financing ActivitiesBank indebtedness (15) (30)Commercial paper 340 (342)Short term bank loans (note 18) – Issued 40 36Long term debt (note 18) – Issued 29 333
– Retired (362) (246)Share capital – Issued (notes 20 & 21) 196 394Subsidiary share capital – Issued (note 21) 4 1
– Retired (note 8) (16)Dividends – To common shareholders (186) (186)
– To preferred shareholders (52) (34)– To minority shareholders (66) (88)
Other 2 2
Cash Flows used in Financing Activities of Continuing Operations (70) (176)
Effect of Foreign Currency Exchange Rate Changes on Cash and Cash Equivalents (note 12) 1 (54)Initial impact of Variable Interest Entities (note 2) 20
Cash Flows (used in) from Continuing Operations (332) 510Cash Flows from Discontinued Operations (note 11) 11 22
Change in Cash and Cash Equivalents (321) 532Cash and Cash Equivalents, Beginning of Year 1,540 1,008
Cash and Cash Equivalents, End of Year $ 1,219 $ 1,540
See accompanying notes to the consolidated financial statements.
George Weston Limited 2006 Financial Report 63
64 George Weston Limited 2006 Financial Report
Notes to the Consolidated Financial Statements
December 31, 2006($ millions except where otherwise indicated)
1. SUMMARY OF SIGNIFICANT ACCOUNTING POLICIES
The consolidated financial statements were prepared in accordance with Canadian generally accepted accounting principles (“GAAP”)and are reported in Canadian dollars.
Basis of ConsolidationThe consolidated financial statements include the accounts of George Weston Limited (“Weston”) and its subsidiaries (collectivelyreferred to as the “Company”) with provision for minority interest. Weston’s interest in the voting share capital of its subsidiaries is 100% except for Loblaw Companies Limited (“Loblaw”), which is 61.9% (2005 – 61.9%). In addition, the Company consolidatesvariable interest entities (“VIEs”) that are subject to control on a basis other than through ownership of a majority of voting interest (see note 2).
Fiscal YearThe Company’s year end is December 31. Sales and related activities are reported on a fiscal year ending on the Saturday closest to December 31. As a result, the Company’s fiscal year with respect to sales and related activities is usually 52 weeks in duration but does include a 53rd week every five to six years. Each of the years ended December 31, 2006 and December 31, 2005contained 52 weeks.
Revenue RecognitionWeston Foods recognizes sales upon delivery of its products to customers net of applicable reductions for discounts and allowances.Loblaw sales include revenues, net of estimated returns, from customers through corporate stores operated by Loblaw and independentfranchisee stores that are consolidated by Loblaw pursuant to Accounting Guideline 15, “Consolidation of Variable Interest Entities”,(“AcG 15”). In addition, sales include sales to and service fees from associated stores and independent account customers and franchisedstores excluding VIE stores. Loblaw recognizes revenue at the time the sale is made to its customers.
Earnings per Share (“EPS”) Basic EPS is calculated by dividing the net earnings available to common shareholders by the weighted average number of commonshares outstanding during the year. Diluted EPS is calculated using the treasury stock method, which assumes that all outstanding stockoptions with an exercise price below the average market price during the year are exercised and the assumed proceeds are used topurchase Weston’s common shares at the average market price during the year.
Cash, Cash Equivalents and Bank IndebtednessCash balances which the Company has the ability and intent to offset are used to reduce reported bank indebtedness. Cash equivalentsare highly liquid investments with a maturity of 90 days or less.
Short Term Investments Short term investments are carried at the lower of cost or quoted market value and consist primarily of United States governmentsecurities, commercial paper and bank deposits.
Credit Card ReceivablesThe Company, through President’s Choice Bank (“PC Bank”), a wholly owned subsidiary of Loblaw, has credit card receivables that are stated net of an allowance for credit losses. Credit card receivables, if contractually past due, are not classified as impaired but arefully written off on the earlier of when payments are contractually 180 days in arrears or when the likelihood of collection is consideredremote. Interest income on credit card receivables is recorded on an accrual basis and is recognized in operating income.
Allowance for Credit LossesPC Bank maintains an allowance for probable credit losses on aggregate exposures for which losses cannot be determined on an item-by-item basis. The allowance is based upon a statistical analysis of past performance, the level of allowance already in place and management’s judgment. The allowance for credit losses is deducted from the credit card receivables balance. The net credit loss experience for the year is recognized in operating income.
SecuritizationPC Bank securitizes credit card receivables through the sale of a portion of the total interest in these receivables to independent trustsand does not exercise any control over the trusts’ management, administration or assets. The credit card receivables are removed from the consolidated balance sheet when PC Bank has surrendered control and are considered sold for accounting purposes pursuant
to Accounting Guideline 12, “Transfers of Receivables”. When PC Bank sells credit card receivables in a securitization transaction, it has a retained interest in the securitized receivables represented by the rights to future cash flows after obligations to investors havebeen met. Although PC Bank remains responsible for servicing all credit card receivables, it does not receive additional compensationfor servicing those credit card receivables sold to the trusts and accordingly a service liability is recorded. Gains or losses on the sale of these receivables depends, in part, on the previous carrying amount of receivables involved in the securitization, allocated between the receivables sold and the retained interest, based on their relative fair values at the date of securitization. When quoted market valuesare not available, the fair values are determined using management’s best estimate of the net present value of expected future cash flows using key assumptions for monthly payment rates, weighted average life, expected annual credit losses and discount rates. Any gainor loss on a sale is recognized in operating income at the time of the securitization. The carrying value of retained interests is periodicallyreviewed and when a decline in value is identified that is other than temporary, the carrying value is written down to fair value.
Vendor AllowancesThe Company receives allowances from certain of its vendors whose products it purchases for resale. These allowances are received for a variety of buying and/or merchandising activities, including vendor programs such as volume purchase allowances, purchasediscounts, listing fees and exclusivity allowances. Consideration received from a vendor is a reduction in the cost of the vendor’s productsor services and is recognized as a reduction in the cost of sales, selling and administrative expenses and the related inventory whenrecognized in the consolidated statement of earnings and the consolidated balance sheet. Certain exceptions apply if the consideration is a payment for assets or services delivered to the vendor or for reimbursement of selling costs incurred to promote the vendor’sproducts, provided that certain conditions are met.
Inventories (principally finished products) Retail store inventories are stated at the lower of cost and estimated net realizable value less normal gross profit margin. Distributioncentre inventories, seasonal general merchandise and other inventories are stated at the lower of cost and estimated net realizable value.Cost is determined substantially using the first-in, first-out method.
Fixed AssetsFixed assets are recorded at cost including capitalized interest. Depreciation commences when the assets are put into use and isrecognized on a straight-line basis to depreciate the cost of these assets over their estimated useful lives. Estimated useful lives rangefrom 10 to 40 years for buildings, 10 years for building improvements and from 3 to 16 years for equipment and fixtures. Leaseholdimprovements are depreciated over the estimated useful life and may include renewal options when an improvement is made afterinception of the lease, to a maximum of 25 years, which approximates economic life. Equipment under capital leases is depreciatedover the term of the lease.
Fixed assets are reviewed for impairment when events or changes in circumstances indicate that the carrying value exceeds the sum of the undiscounted future cash flows expected from use and eventual disposal. These events or changes in circumstances include acommitment to retire or transfer manufacturing assets for Weston Foods and to close a Loblaw store or distribution centre or to relocateor convert a Loblaw store. Fixed assets are also reviewed for impairment annually. For purposes of annually reviewing assets forimpairment, asset groups are reviewed at their lowest level for which identifiable cash flows are largely independent of cash flows ofother assets and liabilities. Therefore, Weston Foods manufacturing asset net cash flows are grouped together by major productioncategories, where cash flows are largely dependent on each other. Loblaw’s store net cash flows are grouped together by primary marketareas, where cash flows are largely dependent on each other. Primary markets are regional areas where a number of store formatsoperate within close proximity to one another. If an indicator of impairment exists, such as sustained negative operating cash flows of therespective asset group, then an estimate of undiscounted future cash flows of each such major production category for Weston Foods, orstore for Loblaw, is prepared and compared to its carrying value. For purposes of annually reviewing Loblaw’s distribution centre assetsfor impairment, distribution centre net cash flows are grouped with the respective net cash flows of the stores they service. An impairmentin the Loblaw store network serviced by the distribution centre would indicate an impairment in the distribution centre assets as well. If Weston Foods or Loblaw’s assets are determined to be impaired, the impairment loss is measured as the excess of the carrying valueover fair value.
Deferred ChargesDebt issue costs associated with long term debt are deferred and amortized on a straight-line basis over the term of the respective debt issues. Other deferred charges are amortized over the related assets’ estimated useful lives, to a maximum of 15 years.
George Weston Limited 2006 Financial Report 65

66 George Weston Limited 2006 Financial Report
Notes to the Consolidated Financial Statements
Goodwill and Intangible AssetsGoodwill represents the excess of the purchase price of a business acquired over the fair value of the underlying net assets acquired at the date of acquisition. Other intangible assets are recorded at fair value at the date of acquisition. Goodwill is not amortized and itscarrying value is tested at least annually for impairment. Intangible assets with an indefinite life are not subject to amortization and aretested at least annually for impairment. Intangible assets with a finite life are amortized over their estimated useful lives ranging from 5 to 30 years. Any impairment in the carrying value of goodwill or intangible assets is recognized in operating income. Additionaldisclosure regarding the results of the 2006 annual goodwill impairment test is provided in note 3.
Foreign Currency Translation(i) Self-Sustaining Foreign OperationsAssets and liabilities of self-sustaining foreign operations denominated in foreign currencies are translated into Canadian dollars at theforeign currency exchange rate in effect at each balance sheet date. The resulting exchange gains or losses on translation are recognizedas part of shareholders’ equity in cumulative foreign currency translation adjustment. When there is a reduction in the Company’s netinvestment in self-sustaining foreign operations, the proportionate amount of cumulative foreign currency translation adjustment isrecognized in net earnings from continuing operations. Revenues and expenses denominated in foreign currencies are translated intoCanadian dollars at the weighted average foreign currency exchange rate for the year.
(ii) Other including Loblaw Foreign OperationsAssets and liabilities denominated in foreign currencies are translated into Canadian dollars at the foreign currency exchange rate ineffect at each balance sheet date. Exchange gains or losses arising from the translation of these balances denominated in foreigncurrencies are recognized in operating income. Revenues and expenses denominated in foreign currencies are translated into Canadiandollars at the average foreign currency exchange rate for the year.
Derivative InstrumentsThe Company uses derivative agreements in the form of cross currency basis swaps, interest rate swaps, equity swaps and forwards,and commodity futures and options to manage its current and anticipated exposure to fluctuations in foreign currency exchange rates,interest rates, the market prices of Weston and Loblaw common shares and commodity prices. The Company does not enter intoderivative agreements for trading or speculative purposes.
The Company formally identifies, designates and documents the relationships between hedging instruments and hedged itemsincluding: Weston’s 3% Exchangeable Debentures as a hedge of the anticipated disposal of the Domtar Inc. (“Domtar”) investment;Loblaw’s cross currency basis swaps and interest rate swaps as cash flow hedges against its exposure to fluctuations in the foreigncurrency exchange rate and variable interest rates on a portion of its United States dollar denominated assets, principally cashequivalents and short term investments held by Loblaw; Loblaw’s interest rate swaps as a cash flow hedge of the variable interest rateexposure on commercial paper; and commodity futures as a cash flow hedge of anticipated future commodity purchases. Effectivenesstests are performed to evaluate hedge effectiveness at inception and on an ongoing basis, both retrospectively and prospectively.
Realized and unrealized foreign currency exchange rate adjustments on Loblaw’s cross currency basis swaps are offset by realized andunrealized foreign currency exchange rate adjustments on a portion of its United States dollar denominated assets and are recognized in operating income. The cumulative unrealized foreign currency exchange rate receivable or payable is recorded in other assets or otherliabilities, respectively. The exchange of interest payments on Loblaw’s cross currency basis swaps and Weston’s and Loblaw’s interestrate swaps is recognized on an accrual basis in interest expense and other financing charges. Unrealized gains or losses on the interestrate swaps designated within an effective hedging relationship are not recognized. On termination of a hedging relationship, realized andunrealized gains and losses on interest rate swaps are deferred over the remaining term of the initial hedge and recognized in interestexpense and other financing charges.
Financial derivative instruments not designated within an effective hedging relationship are measured at fair value with changes in fairvalue recorded in net earnings from continuing operations.
Unrealized and realized gains and losses on commodity futures which are designated as a cash flow hedge of future anticipatedcommodity purchases are deferred in current assets or liabilities and are recognized in cost of sales when the inventory produced fromthe related commodity is sold. Market price adjustments on commodity futures and options, which are not designated as a cash flowhedge of future anticipated commodity purchases, are recognized in operating income.
A non-cash charge or income is recognized in consolidated interest expense and other financing charges and represents the fair valueadjustment of Weston’s forward sale agreement for 9.6 million Loblaw common shares. The fair value adjustment is based on fluctuationsin the market price of the underlying Loblaw shares and is a non-cash item that will ultimately be offset by the recognition of any gain on Weston’s disposition of the 9.6 million Loblaw common shares. Prior to the amendment to Emerging Issues Committee Abstract 56,“Exchangeable Debentures” (“EIC 56”), effective the third quarter of 2004, the fair value adjustment was deferred and recorded in theconsolidated balance sheet in other assets and other liabilities. According to the transitional provisions, the non-cash fair value adjustment,as of the effective date of the amendment to EIC 56, of $125 is deferred in other assets on the consolidated balance sheet.
Equity swaps and forwards are used to manage exposure to fluctuations in the market prices of Weston and Loblaw common shares,which impacts the stock-based compensation cost recognized. The partial offset between the Company’s stock-based compensationcosts and the equity derivatives is effective as long as the market prices of Weston and Loblaw common shares exceed the exerciseprice of the related employee stock options. Market price adjustments on these equity swaps and forwards are recognized in operatingincome as gains or losses and the cumulative unrealized gains or losses are recorded in other assets or other liabilities, respectively.Interest on equity swaps and forwards is recognized on an accrual basis in interest expense and other financing charges.
Income TaxesThe asset and liability method of accounting is used for income taxes. Under the asset and liability method, future income tax assets andliabilities are recognized for the future income tax consequences attributable to temporary differences between the financial statementcarrying values of existing assets and liabilities and their respective income tax bases. Future income tax assets and liabilities are measuredusing enacted or substantively enacted income tax rates expected to apply to taxable income in the years in which those temporarydifferences are expected to be recovered or settled. The effect on future income tax assets and liabilities of a change in income tax rates is recognized in income tax expense when enacted or substantively enacted. Future income tax assets are evaluated and a valuationallowance, if required, is recorded against any future income tax asset if it is more likely than not that the asset will not be realized.
Employee Future BenefitsThe Company sponsors a number of pension plans, including registered funded defined benefit pension plans, defined contribution pensionplans and supplemental unfunded arrangements providing pension benefits in excess of statutory limits. The Company also offers certainemployee post-retirement and post-employment benefit plans and long term disability benefit plans. Post-retirement and post-employmentbenefit plans are not funded, are mainly non-contributory and include health care, life insurance and dental benefits. The Company alsocontributes to various multi-employer pension plans which provide pension benefits.
Defined Benefit PlansThe cost and accrued benefit plan obligations of the Company’s defined benefit pension plans and other benefit plans, including post-retirement, post-employment and long term disability benefits, are accrued based on actuarial valuations. The actuarial valuationsare determined using the projected benefit method prorated on service and management’s best estimate of the expected long term rate of return on plan assets, rate of compensation increase, retirement ages of employees and expected growth rate of health carecosts. Actuarial valuations are performed using a September 30 measurement date for accounting purposes. Market values used tovalue benefit plan assets are as at the measurement date. The discount rate used to value the accrued benefit plan obligation is basedon market interest rates as at the measurement date, assuming a portfolio of Corporate AA bonds with terms to maturity that, onaverage, match the terms of the accrued benefit plan obligation.
Past service costs arising from plan amendments are amortized over the expected average remaining service period of the activeemployees. The unamortized net actuarial gain or loss that exceeds 10% of the greater of the accrued benefit plan obligation or the fair value of the benefit plan assets at the beginning of the year is amortized over the expected average remaining service period of the active employees for defined benefit pension and post-retirement benefit plans. The unamortized net actuarial gain or loss for post-employment and long term disability benefits is amortized over periods not exceeding three years. The expected average remainingservice period of the active employees covered by the defined benefit pension plans ranges from 6 to 17 years, with a weighted averageof 12 years. The expected average remaining service period of the employees covered by the post-retirement benefit plans ranges from 6 to 22 years, with a weighted average of 17 years.
The accrued benefit plan asset or liability represents the cumulative difference between the cost and the funding contributions and is recorded in other assets and other liabilities.
Defined Contribution and Multi-Employer Pension PlansThe costs of pension benefits for defined contribution pension plans and multi-employer pension plans are expensed as contributions are due.
George Weston Limited 2006 Financial Report 67

68 George Weston Limited 2006 Financial Report
Notes to the Consolidated Financial Statements
Stock Option Plan and Share Appreciation RightsThe Company recognizes a compensation cost in operating income and a liability related to employee stock option grants that will be settled by issuing its common shares. The compensation cost is the fair value of the stock option on the grant date using an optionpricing model and is recognized in operating income on a prescribed vesting basis. On the exercise of this type of stock option, theconsideration paid by the employee and the related fair value accrual are credited to common share capital. Each stock option grantedbefore 2003 that will be settled by issuing common shares will be accounted for as a capital transaction and no compensation cost is recognized. Consideration paid by employees on the exercise of this type of stock option is credited to common share capital.
The Company recognizes a compensation cost in operating income and a liability related to employee stock option grants that allow for settlement in shares or in the share appreciation value in cash at the option of the employee and employee share appreciation rightgrants that will be settled in cash, using the intrinsic value method. Under the intrinsic value method, the stock-based compensationliability is the amount by which the market price of the common shares exceeds the exercise price of the stock options. A year-over-yearchange in the stock-based compensation liability is recognized in operating income on a prescribed vesting basis.
Restricted Share Unit (“RSU”) PlanThe Company recognizes in operating income a compensation cost for each RSU granted equal to the market value of a Weston orLoblaw common share at the date on which RSUs are awarded to each participant prorated over the performance period and adjusts forchanges in the market value until the end of the performance date. The cumulative effect of the changes in market value is recognizedin operating income in the period of the change.
Deferred Share UnitsOutside members of Weston’s and Loblaw’s Boards of Directors may elect annually to receive all or a portion of their annual retainer(s)and fees in the form of deferred share units. The deferred share units obligation is accounted for using the intrinsic value method. Under the intrinsic value method, the deferred share unit compensation liability is the amount by which the market price of the commonshares exceeds the initial value of the deferred share unit. The year-over-year change in the deferred share unit compensation liability is recognized in operating income.
Employee Share Ownership PlanWeston and Loblaw maintain Employee Share Ownership Plans for their employees, which allow employees to acquire Weston’s andLoblaw’s common shares through payroll deductions of up to 5% of their gross regular earnings. Weston and Loblaw contribute anadditional 25% of each employee’s contribution to their respective plans, which is recognized in operating income as a compensationcost when the contribution is made.
Use of Estimates and AssumptionsThe preparation of the consolidated financial statements requires management to make estimates and assumptions that affect thereported amounts and disclosures made in the consolidated financial statements and accompanying notes. These estimates andassumptions are based on management’s historical experience, best knowledge of current events and conditions and activities that may be undertaken in the future. Actual results could differ from these estimates.
Certain estimates, such as those related to valuation of inventories, goodwill, indefinite life intangible assets, income taxes, Goods and Services Tax (“GST”) and provincial sales taxes (“PST”), employee future benefits and impairment of fixed assets, depend uponsubjective or complex judgments about matters that may be uncertain, and changes in those estimates could materially impact the consolidated financial statements.
Comparative InformationCertain prior year’s information was reclassified to conform with the current year’s presentation.
2. IMPLEMENTATION OF NEW ACCOUNTING STANDARDS
Accounting Standards Implemented in 2006Effective January 1, 2006, the Company implemented Emerging Issues Committee Abstract 156, “Accounting by a Vendor forConsideration Given to a Customer (Including a Reseller of the Vendor’s Products)” (“EIC 156”), issued by the Canadian Institute of Chartered Accountants in September 2005. EIC 156 addresses cash consideration, including sales incentives, given by a vendor to a customer. This consideration is presumed to be a reduction of the selling price of the vendor’s products and shouldtherefore be classified as a reduction of sales in the vendor’s statement of earnings.
George Weston Limited 2006 Financial Report 69
Prior to the implementation of EIC 156, Loblaw recorded certain sales incentives paid to independent franchisees, associates andindependent accounts in cost of sales, selling and administrative expenses on the consolidated statements of earnings. Accordingly, the implementation of EIC 156, on a retroactive basis, resulted in a reduction in both sales and cost of sales, selling and administrativeexpenses of $174 for 2005. As reclassifications, these changes did not impact net earnings from continuing operations.
Accounting Standards Implemented in 2005Effective January 1, 2005, the Company implemented AcG 15, retroactively without restatement of prior periods and as a result, theCompany consolidates entities in which it has control through ownership of a majority of the voting interests as well as all significantVIEs for which it is the primary beneficiary.
AcG 15 defines a variable interest entity as an entity that either does not have sufficient equity at risk to finance its activities withoutsubordinated financial support or where the holders of the equity at risk lack the characteristics of a controlling financial interest. AcG 15 requires the primary beneficiary to consolidate VIEs and considers an entity to be the primary beneficiary of a VIE if it holdsvariable interests that expose it to a majority of the VIE’s expected losses or that entitle it to receive a majority of the VIE’s expectedresidual returns or both.
Upon implementation of AcG 15, the Company identified the following significant VIEs:
Independent FranchiseesLoblaw enters into various forms of franchise agreements that generally require the independent franchisee to purchase inventory fromLoblaw and pay certain fees in exchange for services provided by Loblaw and for the right to use certain trademarks and licenses ownedby Loblaw. Independent franchisees generally lease the land and building from Loblaw, and when eligible, may obtain financing througha structure involving independent trusts to facilitate the purchase of the majority of their inventory and fixed assets, consisting mainly of fixturing and equipment. These trusts are administered by a major Canadian chartered bank. Under the terms of certain franchiseagreements, Loblaw may also lease equipment to independent franchisees. Independent franchisees may also obtain financing throughoperating lines of credit with traditional financial institutions or through issuing preferred shares or notes payable to Loblaw. Loblawmonitors the financial condition of its independent franchisees and provides for estimated losses or write-downs on its accounts andnotes receivable or investments when appropriate. Upon implementation of AcG 15, the Company determined that 121 of Loblaw’sindependent franchise stores met the criteria for VIEs that require consolidation by the Company pursuant to AcG 15.
As at year end 2006, 123 (2005 – 123) of Loblaw’s independent franchise stores met the criteria for a VIE and were consolidatedpursuant to AcG 15.
Warehouse and Distribution AgreementLoblaw has entered into a warehouse and distribution agreement with a third party to provide to Loblaw distribution and warehousingservices from a dedicated facility. Loblaw has no equity interest in this third party; however, the terms of the agreement with the third party are such that the Company has determined that the third party meets the criteria for a VIE that requires consolidation by the Company. As a result of the fee structure agreed to with this third party, the impact of the consolidation of the warehouse anddistribution entity was not material.
Accordingly, the Company has included the results of these independent franchisees and this third-party entity that provides distributionand warehousing services in its consolidated financial statements effective January 1, 2005.
An after-tax, one-time charge of $18 (net of income taxes of $12 and minority interest of $11) was recorded upon implementation andresulted mainly from delaying the recognition of vendor monies to when the related inventories of the independent franchisees are soldto their customers, the excess of the independent franchisees’ accumulated losses over the allowance for doubtful accounts previouslyrecorded by the Company and the reversal of initial franchise fees initially recognized upon the sale of franchises to third parties.
Independent TrustLoblaw has also identified that it holds a variable interest, by way of a standby letter of credit, in an independent trust which is used to securitize credit card receivables for PC Bank. In these securitizations, PC Bank sells a portion of its credit card receivables to theindependent trust in exchange for cash. Although this independent trust has been identified as a VIE, it was determined that Loblaw is not the primary beneficiary and therefore this VIE is not subject to consolidation by the Company. The Company’s maximum exposureto loss as a result of its involvement with this independent trust is disclosed in notes 13 and 24.
The consolidation of these VIEs by Loblaw does not result in any change to its tax, legal or credit risks, nor does it result in Loblawassuming any obligations of these third parties.
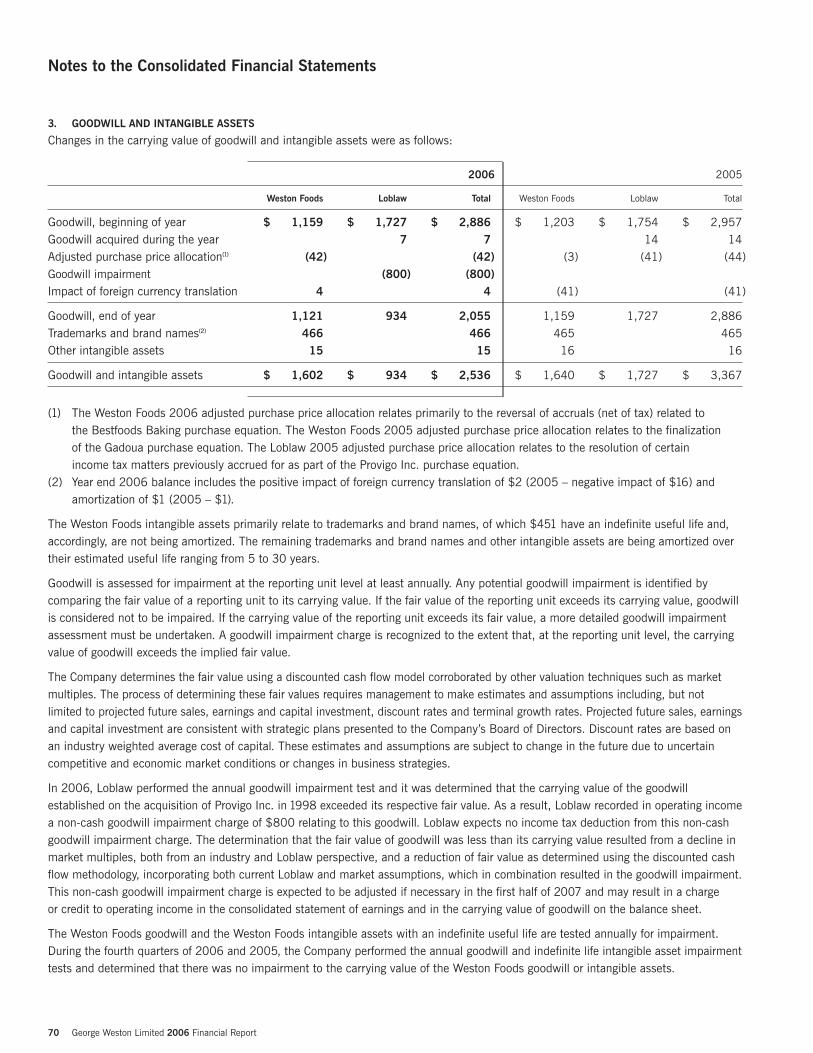
70 George Weston Limited 2006 Financial Report
Notes to the Consolidated Financial Statements
3. GOODWILL AND INTANGIBLE ASSETS
Changes in the carrying value of goodwill and intangible assets were as follows:
2006 2005
Weston Foods Loblaw Total Weston Foods Loblaw Total
Goodwill, beginning of year $ 1,159 $ 1,727 $ 2,886 $ 1,203 $ 1,754 $ 2,957Goodwill acquired during the year 7 7 14 14Adjusted purchase price allocation(1) (42) (42) (3) (41) (44)Goodwill impairment (800) (800)Impact of foreign currency translation 4 4 (41) (41)
Goodwill, end of year 1,121 934 2,055 1,159 1,727 2,886Trademarks and brand names(2) 466 466 465 465Other intangible assets 15 15 16 16
Goodwill and intangible assets $ 1,602 $ 934 $ 2,536 $ 1,640 $ 1,727 $ 3,367
(1) The Weston Foods 2006 adjusted purchase price allocation relates primarily to the reversal of accruals (net of tax) related to the Bestfoods Baking purchase equation. The Weston Foods 2005 adjusted purchase price allocation relates to the finalization of the Gadoua purchase equation. The Loblaw 2005 adjusted purchase price allocation relates to the resolution of certain income tax matters previously accrued for as part of the Provigo Inc. purchase equation.
(2) Year end 2006 balance includes the positive impact of foreign currency translation of $2 (2005 – negative impact of $16) and amortization of $1 (2005 – $1).
The Weston Foods intangible assets primarily relate to trademarks and brand names, of which $451 have an indefinite useful life and,accordingly, are not being amortized. The remaining trademarks and brand names and other intangible assets are being amortized overtheir estimated useful life ranging from 5 to 30 years.
Goodwill is assessed for impairment at the reporting unit level at least annually. Any potential goodwill impairment is identified bycomparing the fair value of a reporting unit to its carrying value. If the fair value of the reporting unit exceeds its carrying value, goodwillis considered not to be impaired. If the carrying value of the reporting unit exceeds its fair value, a more detailed goodwill impairmentassessment must be undertaken. A goodwill impairment charge is recognized to the extent that, at the reporting unit level, the carryingvalue of goodwill exceeds the implied fair value.
The Company determines the fair value using a discounted cash flow model corroborated by other valuation techniques such as marketmultiples. The process of determining these fair values requires management to make estimates and assumptions including, but not limited to projected future sales, earnings and capital investment, discount rates and terminal growth rates. Projected future sales, earningsand capital investment are consistent with strategic plans presented to the Company’s Board of Directors. Discount rates are based onan industry weighted average cost of capital. These estimates and assumptions are subject to change in the future due to uncertaincompetitive and economic market conditions or changes in business strategies.
In 2006, Loblaw performed the annual goodwill impairment test and it was determined that the carrying value of the goodwillestablished on the acquisition of Provigo Inc. in 1998 exceeded its respective fair value. As a result, Loblaw recorded in operating incomea non-cash goodwill impairment charge of $800 relating to this goodwill. Loblaw expects no income tax deduction from this non-cashgoodwill impairment charge. The determination that the fair value of goodwill was less than its carrying value resulted from a decline inmarket multiples, both from an industry and Loblaw perspective, and a reduction of fair value as determined using the discounted cashflow methodology, incorporating both current Loblaw and market assumptions, which in combination resulted in the goodwill impairment.This non-cash goodwill impairment charge is expected to be adjusted if necessary in the first half of 2007 and may result in a charge or credit to operating income in the consolidated statement of earnings and in the carrying value of goodwill on the balance sheet.
The Weston Foods goodwill and the Weston Foods intangible assets with an indefinite useful life are tested annually for impairment.During the fourth quarters of 2006 and 2005, the Company performed the annual goodwill and indefinite life intangible asset impairmenttests and determined that there was no impairment to the carrying value of the Weston Foods goodwill or intangible assets.
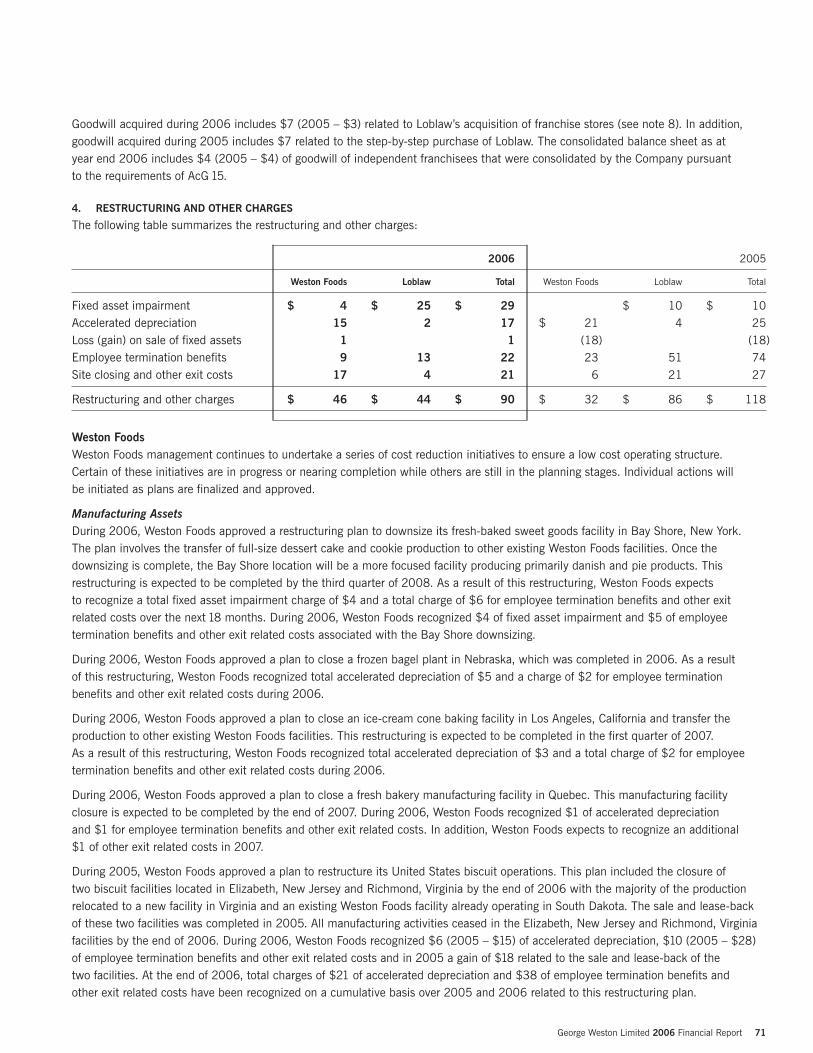
Goodwill acquired during 2006 includes $7 (2005 – $3) related to Loblaw’s acquisition of franchise stores (see note 8). In addition,goodwill acquired during 2005 includes $7 related to the step-by-step purchase of Loblaw. The consolidated balance sheet as at year end 2006 includes $4 (2005 – $4) of goodwill of independent franchisees that were consolidated by the Company pursuant to the requirements of AcG 15.
4. RESTRUCTURING AND OTHER CHARGES
The following table summarizes the restructuring and other charges:
2006 2005
Weston Foods Loblaw Total Weston Foods Loblaw Total
Fixed asset impairment $ 4 $ 25 $ 29 $ 10 $ 10Accelerated depreciation 15 2 17 $ 21 4 25Loss (gain) on sale of fixed assets 1 1 (18) (18)Employee termination benefits 9 13 22 23 51 74Site closing and other exit costs 17 4 21 6 21 27
Restructuring and other charges $ 46 $ 44 $ 90 $ 32 $ 86 $ 118
Weston FoodsWeston Foods management continues to undertake a series of cost reduction initiatives to ensure a low cost operating structure. Certain of these initiatives are in progress or nearing completion while others are still in the planning stages. Individual actions will be initiated as plans are finalized and approved.
Manufacturing AssetsDuring 2006, Weston Foods approved a restructuring plan to downsize its fresh-baked sweet goods facility in Bay Shore, New York. The plan involves the transfer of full-size dessert cake and cookie production to other existing Weston Foods facilities. Once thedownsizing is complete, the Bay Shore location will be a more focused facility producing primarily danish and pie products. Thisrestructuring is expected to be completed by the third quarter of 2008. As a result of this restructuring, Weston Foods expects to recognize a total fixed asset impairment charge of $4 and a total charge of $6 for employee termination benefits and other exitrelated costs over the next 18 months. During 2006, Weston Foods recognized $4 of fixed asset impairment and $5 of employeetermination benefits and other exit related costs associated with the Bay Shore downsizing.
During 2006, Weston Foods approved a plan to close a frozen bagel plant in Nebraska, which was completed in 2006. As a result of this restructuring, Weston Foods recognized total accelerated depreciation of $5 and a charge of $2 for employee terminationbenefits and other exit related costs during 2006.
During 2006, Weston Foods approved a plan to close an ice-cream cone baking facility in Los Angeles, California and transfer theproduction to other existing Weston Foods facilities. This restructuring is expected to be completed in the first quarter of 2007. As a result of this restructuring, Weston Foods recognized total accelerated depreciation of $3 and a total charge of $2 for employeetermination benefits and other exit related costs during 2006.
During 2006, Weston Foods approved a plan to close a fresh bakery manufacturing facility in Quebec. This manufacturing facilityclosure is expected to be completed by the end of 2007. During 2006, Weston Foods recognized $1 of accelerated depreciation and $1 for employee termination benefits and other exit related costs. In addition, Weston Foods expects to recognize an additional$1 of other exit related costs in 2007.
During 2005, Weston Foods approved a plan to restructure its United States biscuit operations. This plan included the closure of two biscuit facilities located in Elizabeth, New Jersey and Richmond, Virginia by the end of 2006 with the majority of the productionrelocated to a new facility in Virginia and an existing Weston Foods facility already operating in South Dakota. The sale and lease-backof these two facilities was completed in 2005. All manufacturing activities ceased in the Elizabeth, New Jersey and Richmond, Virginiafacilities by the end of 2006. During 2006, Weston Foods recognized $6 (2005 – $15) of accelerated depreciation, $10 (2005 – $28)of employee termination benefits and other exit related costs and in 2005 a gain of $18 related to the sale and lease-back of the two facilities. At the end of 2006, total charges of $21 of accelerated depreciation and $38 of employee termination benefits and other exit related costs have been recognized on a cumulative basis over 2005 and 2006 related to this restructuring plan.
George Weston Limited 2006 Financial Report 71
72 George Weston Limited 2006 Financial Report
Notes to the Consolidated Financial Statements
Also in 2005, Weston Foods made further progress on its objective of simplifying and removing cost from its existing fresh bakerymanufacturing processes and approved plans to exit certain bread and roll manufacturing lines in the United States. All productionassociated with these lines was transferred to third-party producers or other Weston Foods manufacturing facilities by the end of 2005. As a result of this decision, Weston Foods recognized in 2005, $4 of accelerated depreciation and $1 of employee terminationbenefits and other exit related costs related to this restructuring plan.
Subsequent to year end 2006, Weston Foods approved a plan to exit certain bread and roll manufacturing lines in the Southeast UnitedStates. All production associated with these lines will be transferred to third-party producers or other Weston Foods manufacturingfacilities. As a result of this decision, Weston Foods expects to recognize approximately $5 of accelerated depreciation and $1 of employeetermination benefits and other exit related costs in the first quarter of 2007.
Distribution NetworkDuring 2006, Weston Foods approved a plan to restructure a portion of its distribution network in Quebec. As a result of thisrestructuring, Weston Foods expects to recognize a total charge of $7 for employee termination benefits and other exit related costs by the end of 2007. During 2006, Weston Foods recognized a charge of $6 for employee termination benefits and other exit related costs pursuant to this plan.
Administrative Restructuring and Consolidation of OfficesDuring 2005, Weston Foods approved plans to consolidate, relocate and restructure certain of its administrative offices within NorthAmerica, which resulted in employee termination benefits and other exit related costs of $8 in that year.
Completion of Other Prior Year PlansDuring 2006, Weston Foods recognized a loss on the sale of fixed assets of $1 related to a restructuring plan approved prior to 2006.
During 2005, Weston Foods recognized restructuring income of $8, primarily related to the reversal of accruals no longer required and a charge for accelerated depreciation of $2 related to restructuring plans approved prior to 2005.
In 2006, employee termination benefits and other exit related costs of approximately $33 (2005 – $13) were paid related torestructuring activities. As at year end 2006, the accrued liabilities related to these restructuring activities were $19 (2005 – $26).
In addition, related to these restructuring activities, a net curtailment loss of $2 for defined benefit plans was applied to other assetsand a net curtailment gain of $2 for other benefit plans was applied to other liabilities, both of which were recorded in restructuring and other charges in 2005.
LoblawStore OperationsDuring 2006, Loblaw completed assessments of its store operations, and approved and communicated plans to restructure certain of its store operations. The total restructuring cost under these plans is estimated to be approximately $54. Of the $54 total estimated costs,approximately $10 is attributable to employee termination benefits which include severance resulting from the termination of employees,$25 to fixed asset impairment and accelerated depreciation of assets relating to these restructuring activities and $19 to site closing andother costs including lease obligations. In 2006, Loblaw recognized $35 of these restructuring costs, which are composed of $9 foremployee termination benefits, $25 for fixed asset impairment and accelerated depreciation and $1 for other costs directly associatedwith those initiatives. The components of the store operations restructuring plan are described below.
As part of a review of the Quebec store operations, Loblaw approved and communicated a plan in 2006 to close 19 underperformingstores, mainly within the Provigo banner. This initiative is expected to be completed during 2007 and the total restructuring cost underthis initiative is estimated to be approximately $40, of which $28 was recognized in 2006.
Based on Loblaw’s review of the impact on the Cash & Carry and wholesale club network of the loss in tobacco sales following thedecision by a major tobacco supplier to sell directly to certain customers of Loblaw, Loblaw approved and communicated a plan in 2006to close 24 wholesale outlets which were impacted most significantly by this change. This initiative is expected to be completed during2007 and the total restructuring cost under this initiative is estimated to be approximately $10, of which $6 was recognized in 2006.
As part of a review of the Atlantic store operations, Loblaw approved and communicated a plan in 2006 to close 8 stores in the Atlanticregion. This initiative is expected to be completed during 2007 and the total restructuring cost under this initiative is estimated to beapproximately $4, of which $1 was recognized in 2006.
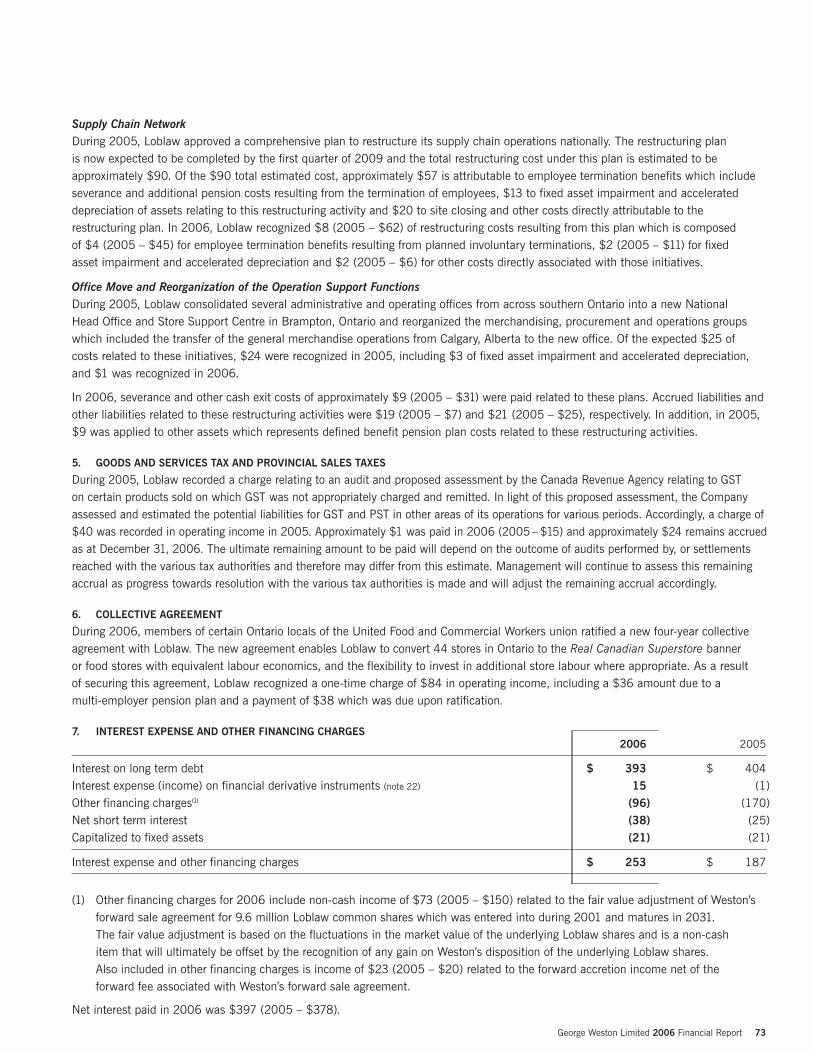
Supply Chain NetworkDuring 2005, Loblaw approved a comprehensive plan to restructure its supply chain operations nationally. The restructuring plan is now expected to be completed by the first quarter of 2009 and the total restructuring cost under this plan is estimated to beapproximately $90. Of the $90 total estimated cost, approximately $57 is attributable to employee termination benefits which includeseverance and additional pension costs resulting from the termination of employees, $13 to fixed asset impairment and accelerateddepreciation of assets relating to this restructuring activity and $20 to site closing and other costs directly attributable to therestructuring plan. In 2006, Loblaw recognized $8 (2005 – $62) of restructuring costs resulting from this plan which is composed of $4 (2005 – $45) for employee termination benefits resulting from planned involuntary terminations, $2 (2005 – $11) for fixed asset impairment and accelerated depreciation and $2 (2005 – $6) for other costs directly associated with those initiatives.
Office Move and Reorganization of the Operation Support FunctionsDuring 2005, Loblaw consolidated several administrative and operating offices from across southern Ontario into a new National Head Office and Store Support Centre in Brampton, Ontario and reorganized the merchandising, procurement and operations groupswhich included the transfer of the general merchandise operations from Calgary, Alberta to the new office. Of the expected $25 of costs related to these initiatives, $24 were recognized in 2005, including $3 of fixed asset impairment and accelerated depreciation,and $1 was recognized in 2006.
In 2006, severance and other cash exit costs of approximately $9 (2005 – $31) were paid related to these plans. Accrued liabilities andother liabilities related to these restructuring activities were $19 (2005 – $7) and $21 (2005 – $25), respectively. In addition, in 2005,$9 was applied to other assets which represents defined benefit pension plan costs related to these restructuring activities.
5. GOODS AND SERVICES TAX AND PROVINCIAL SALES TAXES
During 2005, Loblaw recorded a charge relating to an audit and proposed assessment by the Canada Revenue Agency relating to GST on certain products sold on which GST was not appropriately charged and remitted. In light of this proposed assessment, the Companyassessed and estimated the potential liabilities for GST and PST in other areas of its operations for various periods. Accordingly, a charge of$40 was recorded in operating income in 2005. Approximately $1 was paid in 2006 (2005 – $15) and approximately $24 remains accruedas at December 31, 2006. The ultimate remaining amount to be paid will depend on the outcome of audits performed by, or settlementsreached with the various tax authorities and therefore may differ from this estimate. Management will continue to assess this remainingaccrual as progress towards resolution with the various tax authorities is made and will adjust the remaining accrual accordingly.
6. COLLECTIVE AGREEMENT
During 2006, members of certain Ontario locals of the United Food and Commercial Workers union ratified a new four-year collectiveagreement with Loblaw. The new agreement enables Loblaw to convert 44 stores in Ontario to the Real Canadian Superstore banner or food stores with equivalent labour economics, and the flexibility to invest in additional store labour where appropriate. As a result of securing this agreement, Loblaw recognized a one-time charge of $84 in operating income, including a $36 amount due to a multi-employer pension plan and a payment of $38 which was due upon ratification.
7. INTEREST EXPENSE AND OTHER FINANCING CHARGES2006 2005
Interest on long term debt $ 393 $ 404Interest expense (income) on financial derivative instruments (note 22) 15 (1)Other financing charges(1) (96) (170)Net short term interest (38) (25)Capitalized to fixed assets (21) (21)
Interest expense and other financing charges $ 253 $ 187
(1) Other financing charges for 2006 include non-cash income of $73 (2005 – $150) related to the fair value adjustment of Weston’sforward sale agreement for 9.6 million Loblaw common shares which was entered into during 2001 and matures in 2031. The fair value adjustment is based on the fluctuations in the market value of the underlying Loblaw shares and is a non-cash item that will ultimately be offset by the recognition of any gain on Weston’s disposition of the underlying Loblaw shares. Also included in other financing charges is income of $23 (2005 – $20) related to the forward accretion income net of the forward fee associated with Weston’s forward sale agreement.
Net interest paid in 2006 was $397 (2005 – $378).
George Weston Limited 2006 Financial Report 73
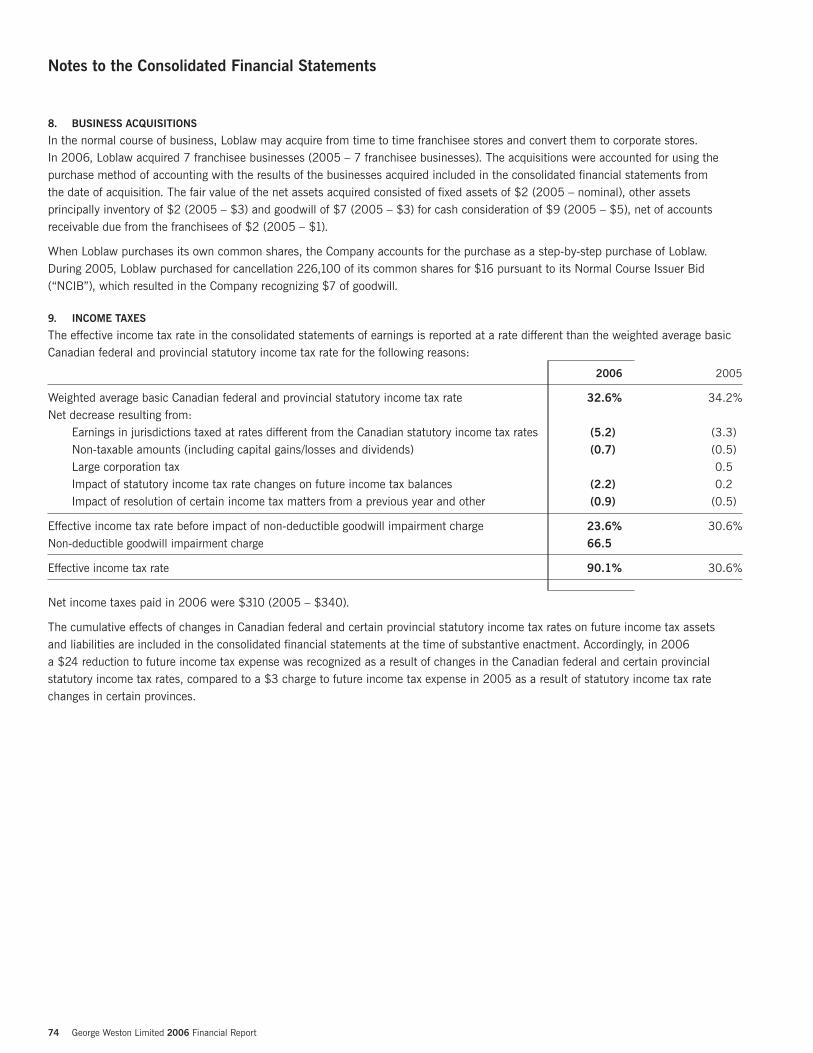
74 George Weston Limited 2006 Financial Report
Notes to the Consolidated Financial Statements
8. BUSINESS ACQUISITIONS
In the normal course of business, Loblaw may acquire from time to time franchisee stores and convert them to corporate stores. In 2006, Loblaw acquired 7 franchisee businesses (2005 – 7 franchisee businesses). The acquisitions were accounted for using thepurchase method of accounting with the results of the businesses acquired included in the consolidated financial statements from the date of acquisition. The fair value of the net assets acquired consisted of fixed assets of $2 (2005 – nominal), other assetsprincipally inventory of $2 (2005 – $3) and goodwill of $7 (2005 – $3) for cash consideration of $9 (2005 – $5), net of accountsreceivable due from the franchisees of $2 (2005 – $1).
When Loblaw purchases its own common shares, the Company accounts for the purchase as a step-by-step purchase of Loblaw. During 2005, Loblaw purchased for cancellation 226,100 of its common shares for $16 pursuant to its Normal Course Issuer Bid(“NCIB”), which resulted in the Company recognizing $7 of goodwill.
9. INCOME TAXES
The effective income tax rate in the consolidated statements of earnings is reported at a rate different than the weighted average basicCanadian federal and provincial statutory income tax rate for the following reasons:
2006 2005
Weighted average basic Canadian federal and provincial statutory income tax rate 32.6% 34.2%Net decrease resulting from:
Earnings in jurisdictions taxed at rates different from the Canadian statutory income tax rates (5.2) (3.3)Non-taxable amounts (including capital gains/losses and dividends) (0.7) (0.5)Large corporation tax 0.5Impact of statutory income tax rate changes on future income tax balances (2.2) 0.2Impact of resolution of certain income tax matters from a previous year and other (0.9) (0.5)
Effective income tax rate before impact of non-deductible goodwill impairment charge 23.6% 30.6%Non-deductible goodwill impairment charge 66.5
Effective income tax rate 90.1% 30.6%
Net income taxes paid in 2006 were $310 (2005 – $340).
The cumulative effects of changes in Canadian federal and certain provincial statutory income tax rates on future income tax assets and liabilities are included in the consolidated financial statements at the time of substantive enactment. Accordingly, in 2006 a $24 reduction to future income tax expense was recognized as a result of changes in the Canadian federal and certain provincialstatutory income tax rates, compared to a $3 charge to future income tax expense in 2005 as a result of statutory income tax ratechanges in certain provinces.
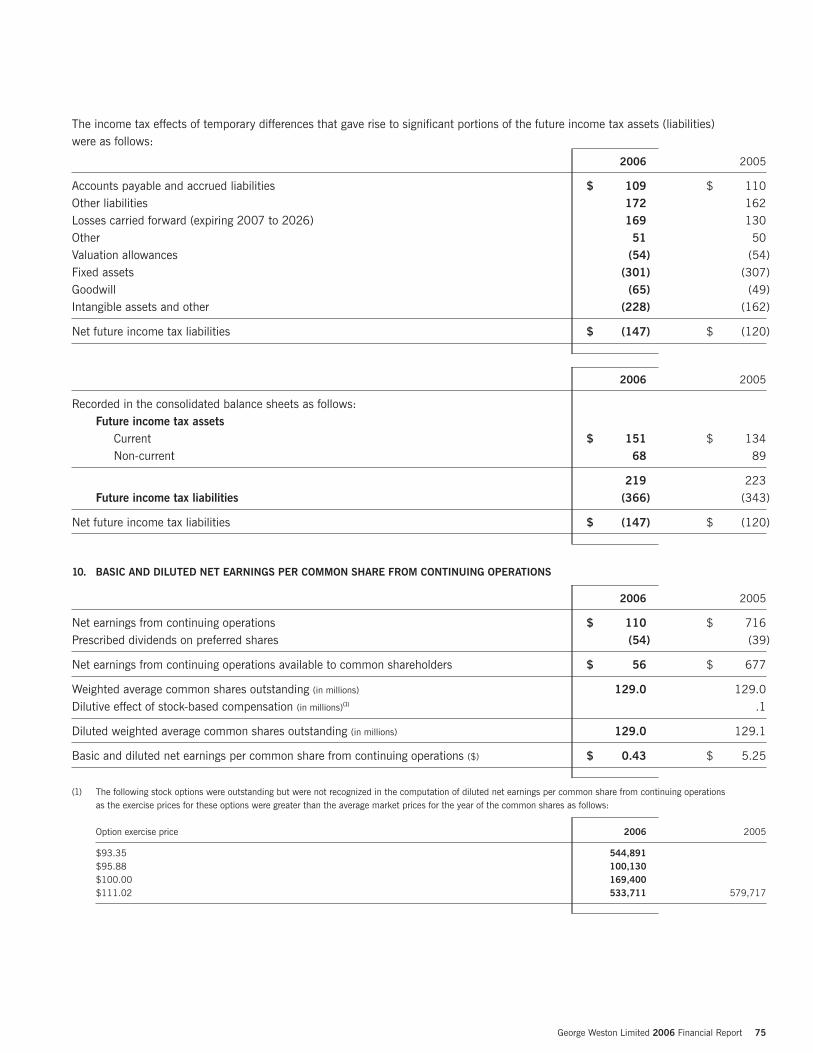
The income tax effects of temporary differences that gave rise to significant portions of the future income tax assets (liabilities) were as follows:
2006 2005
Accounts payable and accrued liabilities $ 109 $ 110Other liabilities 172 162Losses carried forward (expiring 2007 to 2026) 169 130Other 51 50Valuation allowances (54) (54)Fixed assets (301) (307)Goodwill (65) (49)Intangible assets and other (228) (162)
Net future income tax liabilities $ (147) $ (120)
2006 2005
Recorded in the consolidated balance sheets as follows:Future income tax assets
Current $ 151 $ 134Non-current 68 89
219 223Future income tax liabilities (366) (343)
Net future income tax liabilities $ (147) $ (120)
10. BASIC AND DILUTED NET EARNINGS PER COMMON SHARE FROM CONTINUING OPERATIONS
2006 2005
Net earnings from continuing operations $ 110 $ 716Prescribed dividends on preferred shares (54) (39)
Net earnings from continuing operations available to common shareholders $ 56 $ 677
Weighted average common shares outstanding (in millions) 129.0 129.0Dilutive effect of stock-based compensation (in millions)(1) .1
Diluted weighted average common shares outstanding (in millions) 129.0 129.1
Basic and diluted net earnings per common share from continuing operations ($) $ 0.43 $ 5.25
(1) The following stock options were outstanding but were not recognized in the computation of diluted net earnings per common share from continuing operations as the exercise prices for these options were greater than the average market prices for the year of the common shares as follows:
Option exercise price 2006 2005
$93.35 544,891$95.88 100,130$100.00 169,400$111.02 533,711 579,717
George Weston Limited 2006 Financial Report 75
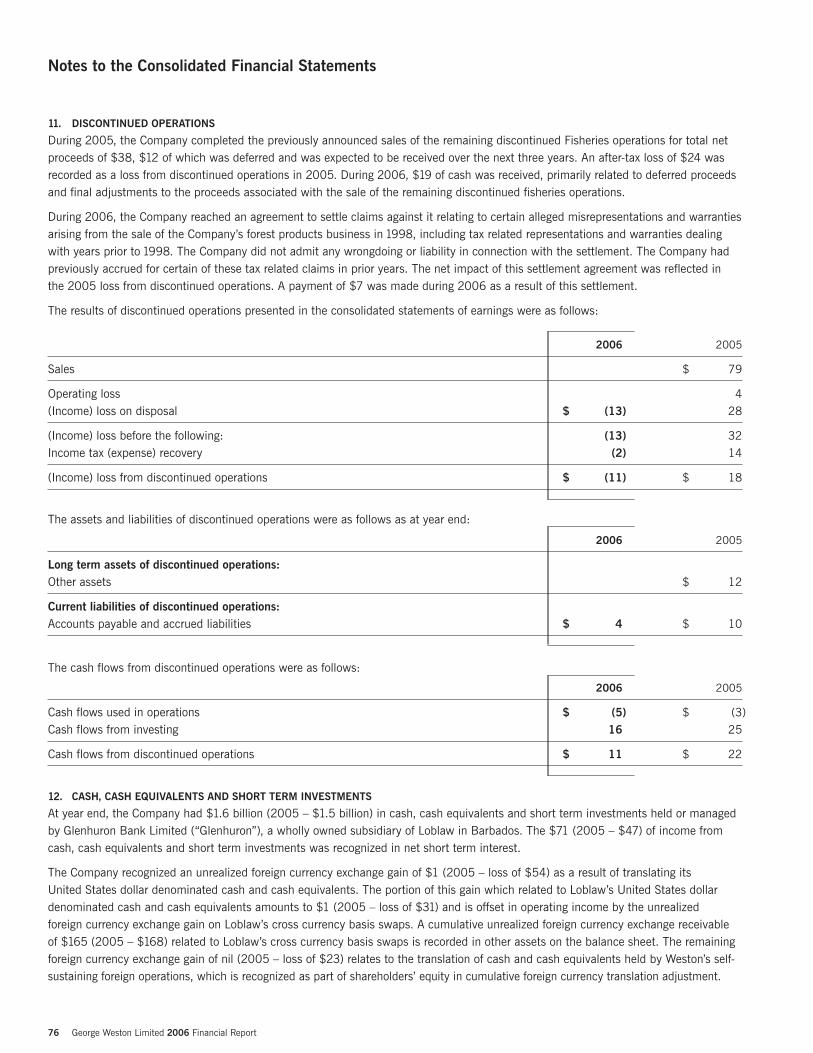
11. DISCONTINUED OPERATIONS
During 2005, the Company completed the previously announced sales of the remaining discontinued Fisheries operations for total netproceeds of $38, $12 of which was deferred and was expected to be received over the next three years. An after-tax loss of $24 wasrecorded as a loss from discontinued operations in 2005. During 2006, $19 of cash was received, primarily related to deferred proceedsand final adjustments to the proceeds associated with the sale of the remaining discontinued fisheries operations.
During 2006, the Company reached an agreement to settle claims against it relating to certain alleged misrepresentations and warrantiesarising from the sale of the Company’s forest products business in 1998, including tax related representations and warranties dealingwith years prior to 1998. The Company did not admit any wrongdoing or liability in connection with the settlement. The Company hadpreviously accrued for certain of these tax related claims in prior years. The net impact of this settlement agreement was reflected in the 2005 loss from discontinued operations. A payment of $7 was made during 2006 as a result of this settlement.
The results of discontinued operations presented in the consolidated statements of earnings were as follows:
2006 2005
Sales $ 79
Operating loss 4(Income) loss on disposal $ (13) 28
(Income) loss before the following: (13) 32Income tax (expense) recovery (2) 14
(Income) loss from discontinued operations $ (11) $ 18
The assets and liabilities of discontinued operations were as follows as at year end:
2006 2005
Long term assets of discontinued operations:Other assets $ 12
Current liabilities of discontinued operations:Accounts payable and accrued liabilities $ 4 $ 10
The cash flows from discontinued operations were as follows:
2006 2005
Cash flows used in operations $ (5) $ (3)Cash flows from investing 16 25
Cash flows from discontinued operations $ 11 $ 22
12. CASH, CASH EQUIVALENTS AND SHORT TERM INVESTMENTS
At year end, the Company had $1.6 billion (2005 – $1.5 billion) in cash, cash equivalents and short term investments held or managedby Glenhuron Bank Limited (“Glenhuron”), a wholly owned subsidiary of Loblaw in Barbados. The $71 (2005 – $47) of income fromcash, cash equivalents and short term investments was recognized in net short term interest.
The Company recognized an unrealized foreign currency exchange gain of $1 (2005 – loss of $54) as a result of translating its United States dollar denominated cash and cash equivalents. The portion of this gain which related to Loblaw’s United States dollardenominated cash and cash equivalents amounts to $1 (2005 – loss of $31) and is offset in operating income by the unrealized foreign currency exchange gain on Loblaw’s cross currency basis swaps. A cumulative unrealized foreign currency exchange receivableof $165 (2005 – $168) related to Loblaw’s cross currency basis swaps is recorded in other assets on the balance sheet. The remainingforeign currency exchange gain of nil (2005 – loss of $23) relates to the translation of cash and cash equivalents held by Weston’s self-sustaining foreign operations, which is recognized as part of shareholders’ equity in cumulative foreign currency translation adjustment.
76 George Weston Limited 2006 Financial Report
Notes to the Consolidated Financial Statements

13. CREDIT CARD RECEIVABLES
The Company, through PC Bank, securitizes credit card receivables through the sale of a portion of the total interest in these receivablesto independent trusts and does not exercise any control over the trusts’ management, administration or assets. When PC Bank sellscredit card receivables in a securitization transaction, it has a retained interest in the securitized receivables represented by the right to future cash flows after obligations to investors have been met. Although PC Bank remains responsible for servicing all credit cardreceivables, it does not receive additional compensation for servicing those credit card receivables sold to the trusts.
During 2006, $240 (2005 – $225) of credit card receivables were securitized through the sale of a portion of the total interest in thesereceivables to independent trusts, yielding a nominal net loss (2005 – nominal net loss) on the initial sale inclusive of nil (2005 – $1)servicing liability. Servicing liabilities expensed during the year were $14 (2005 – $13) and the fair value at year end of recognizedservicing liabilities was $8 (2005 – $8). The trusts’ recourse to PC Bank’s assets is limited to PC Bank’s retained interests and isfurther supported by Loblaw through a standby letter of credit for 9% (2005 – 9%) on a portion of the securitized amount.
2006 2005
Credit card receivables $ 1,571 $ 1,257Amount securitized (1,250) (1,010)
Net credit card receivables $ 321 $ 247
Net credit loss experience $ 9 $ 5
The net credit loss experience of $9 (2005 – $5) includes $45 (2005 – $33) of credit losses on the total portfolio of credit cardreceivables net of credit losses of $36 (2005 – $28) relating to securitized credit card receivables.
The following table displays the sensitivity of the current fair value of retained interests to an immediate 10% and 20% adverse changein the 2006 key economic assumptions. The sensitivity analysis provided in the table is hypothetical and should be used with caution.The sensitivities of each key assumption have been calculated independently of any changes in other key assumptions. Actual experiencemay result in changes in a number of key assumptions simultaneously. Changes in one factor may result in changes in another, whichcould amplify or reduce the impact of such assumptions.
Change in Assumptions
2006 10% 20%
Carrying value of retained interests $ 5Payment rate (monthly) 44.0%Weighted average life (years) 0.7Expected credit losses (annual) 3.14% $ (0.7) $ (1.4)Discount rate applied to residual cash flows (annual) 14.83% $ (2.4) $ (4.9)
The details on the cash flows from securitization are as follows:
2006 2005
Proceeds from new securitizations $ 240 $ 225Net cash flows received on retained interests $ 116 $ 106
During 2006, PC Bank restructured its credit card securitization program. Eagle Credit Card Trust (“Eagle”), a previously establishedindependent trust, issued $500 of five year senior notes and subordinated notes due 2011 at a weighted average rate of 4.5% tofinance the purchase of credit card receivables previously securitized by PC Bank through an independent trust. The subordinated notesprovide credit support to those notes which are more senior. PC Bank will continue to service the credit card receivables on behalf ofEagle, but will not receive any fee for its servicing obligations and has a retained interest in the securitized receivables represented bythe right to future cash flows after obligations to investors have been met. In accordance with Canadian GAAP, the financial statementsof Eagle are not consolidated with those of the Company. The restructuring of the portfolio yielded a nominal net loss.
George Weston Limited 2006 Financial Report 77
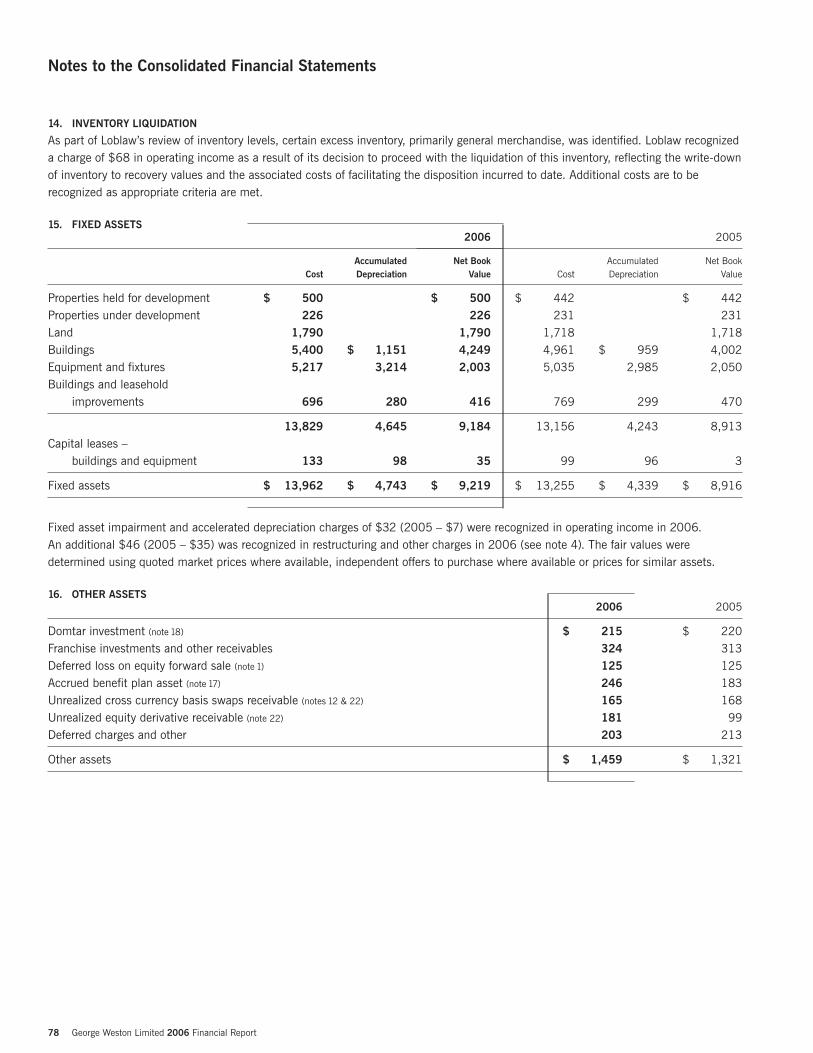
78 George Weston Limited 2006 Financial Report
Notes to the Consolidated Financial Statements
14. INVENTORY LIQUIDATION
As part of Loblaw’s review of inventory levels, certain excess inventory, primarily general merchandise, was identified. Loblaw recognizeda charge of $68 in operating income as a result of its decision to proceed with the liquidation of this inventory, reflecting the write-downof inventory to recovery values and the associated costs of facilitating the disposition incurred to date. Additional costs are to berecognized as appropriate criteria are met.
15. FIXED ASSETS2006 2005
Accumulated Net Book Accumulated Net BookCost Depreciation Value Cost Depreciation Value
Properties held for development $ 500 $ 500 $ 442 $ 442Properties under development 226 226 231 231Land 1,790 1,790 1,718 1,718Buildings 5,400 $ 1,151 4,249 4,961 $ 959 4,002Equipment and fixtures 5,217 3,214 2,003 5,035 2,985 2,050Buildings and leasehold
improvements 696 280 416 769 299 470
13,829 4,645 9,184 13,156 4,243 8,913Capital leases –
buildings and equipment 133 98 35 99 96 3
Fixed assets $ 13,962 $ 4,743 $ 9,219 $ 13,255 $ 4,339 $ 8,916
Fixed asset impairment and accelerated depreciation charges of $32 (2005 – $7) were recognized in operating income in 2006. An additional $46 (2005 – $35) was recognized in restructuring and other charges in 2006 (see note 4). The fair values weredetermined using quoted market prices where available, independent offers to purchase where available or prices for similar assets.
16. OTHER ASSETS2006 2005
Domtar investment (note 18) $ 215 $ 220Franchise investments and other receivables 324 313Deferred loss on equity forward sale (note 1) 125 125Accrued benefit plan asset (note 17) 246 183Unrealized cross currency basis swaps receivable (notes 12 & 22) 165 168Unrealized equity derivative receivable (note 22) 181 99Deferred charges and other 203 213
Other assets $ 1,459 $ 1,321
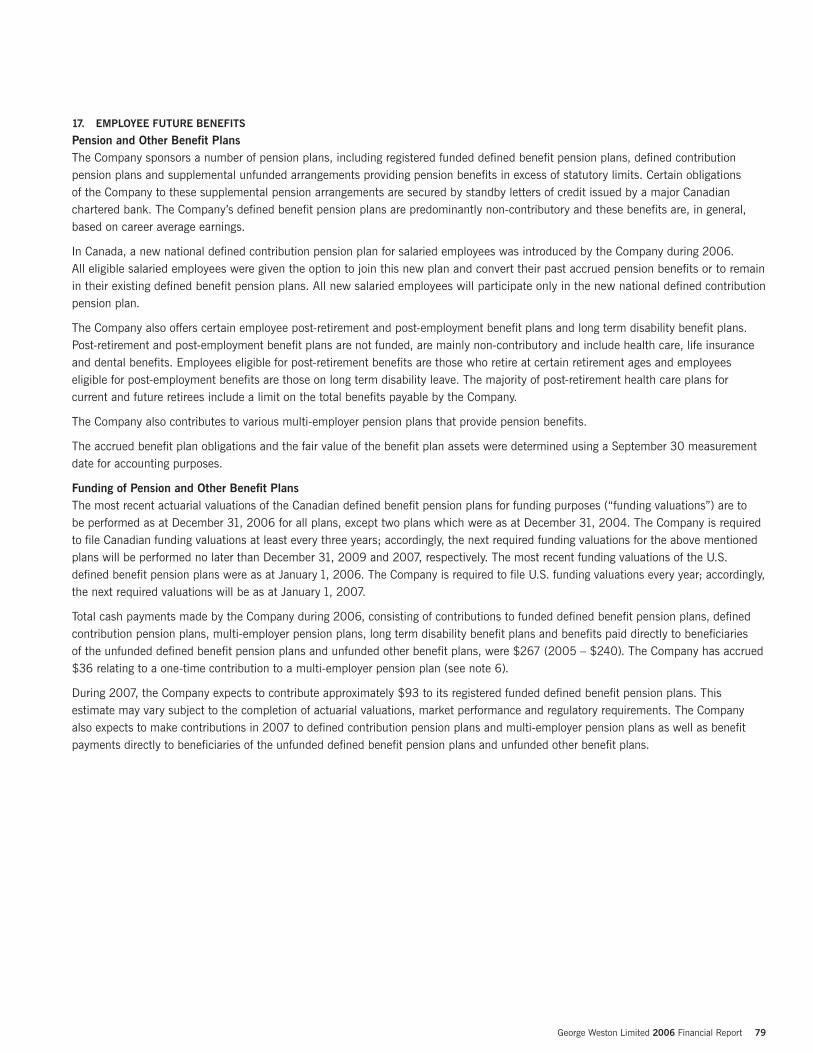
17. EMPLOYEE FUTURE BENEFITS
Pension and Other Benefit PlansThe Company sponsors a number of pension plans, including registered funded defined benefit pension plans, defined contributionpension plans and supplemental unfunded arrangements providing pension benefits in excess of statutory limits. Certain obligations of the Company to these supplemental pension arrangements are secured by standby letters of credit issued by a major Canadianchartered bank. The Company’s defined benefit pension plans are predominantly non-contributory and these benefits are, in general,based on career average earnings.
In Canada, a new national defined contribution pension plan for salaried employees was introduced by the Company during 2006. All eligible salaried employees were given the option to join this new plan and convert their past accrued pension benefits or to remainin their existing defined benefit pension plans. All new salaried employees will participate only in the new national defined contributionpension plan.
The Company also offers certain employee post-retirement and post-employment benefit plans and long term disability benefit plans.Post-retirement and post-employment benefit plans are not funded, are mainly non-contributory and include health care, life insuranceand dental benefits. Employees eligible for post-retirement benefits are those who retire at certain retirement ages and employeeseligible for post-employment benefits are those on long term disability leave. The majority of post-retirement health care plans forcurrent and future retirees include a limit on the total benefits payable by the Company.
The Company also contributes to various multi-employer pension plans that provide pension benefits.
The accrued benefit plan obligations and the fair value of the benefit plan assets were determined using a September 30 measurementdate for accounting purposes.
Funding of Pension and Other Benefit PlansThe most recent actuarial valuations of the Canadian defined benefit pension plans for funding purposes (“funding valuations”) are to be performed as at December 31, 2006 for all plans, except two plans which were as at December 31, 2004. The Company is requiredto file Canadian funding valuations at least every three years; accordingly, the next required funding valuations for the above mentionedplans will be performed no later than December 31, 2009 and 2007, respectively. The most recent funding valuations of the U.S.defined benefit pension plans were as at January 1, 2006. The Company is required to file U.S. funding valuations every year; accordingly,the next required valuations will be as at January 1, 2007.
Total cash payments made by the Company during 2006, consisting of contributions to funded defined benefit pension plans, definedcontribution pension plans, multi-employer pension plans, long term disability benefit plans and benefits paid directly to beneficiaries of the unfunded defined benefit pension plans and unfunded other benefit plans, were $267 (2005 – $240). The Company has accrued $36 relating to a one-time contribution to a multi-employer pension plan (see note 6).
During 2007, the Company expects to contribute approximately $93 to its registered funded defined benefit pension plans. Thisestimate may vary subject to the completion of actuarial valuations, market performance and regulatory requirements. The Companyalso expects to make contributions in 2007 to defined contribution pension plans and multi-employer pension plans as well as benefitpayments directly to beneficiaries of the unfunded defined benefit pension plans and unfunded other benefit plans.
George Weston Limited 2006 Financial Report 79
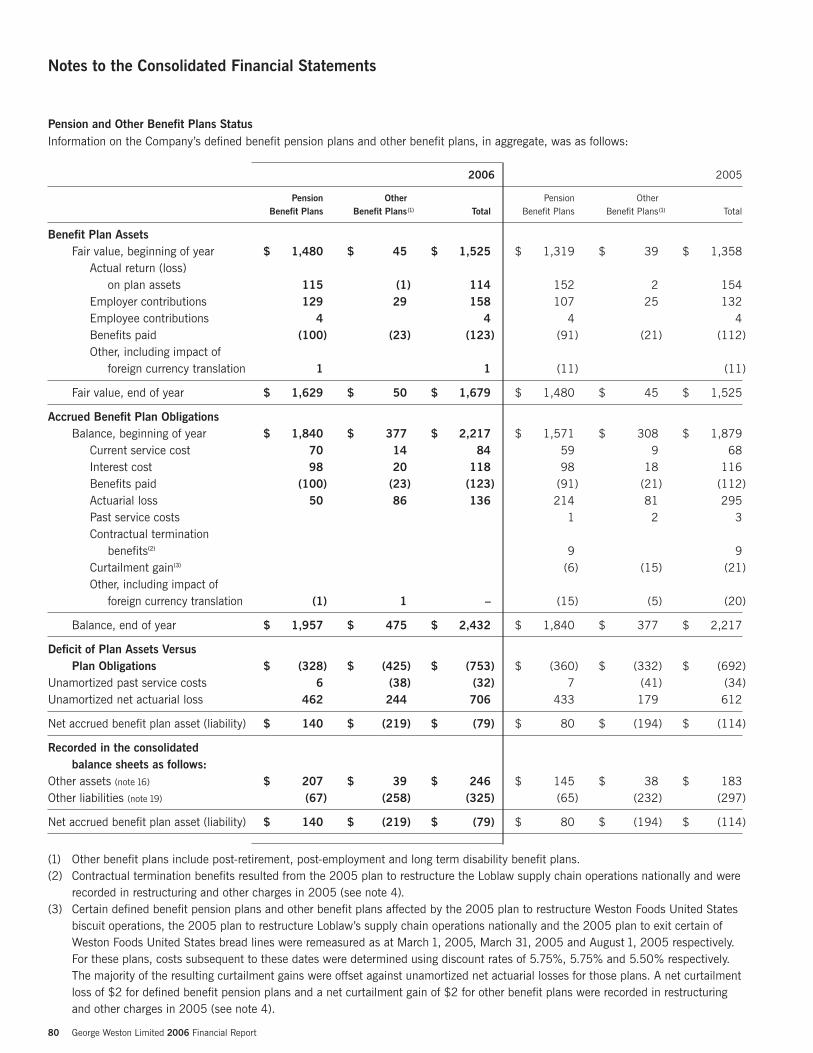
80 George Weston Limited 2006 Financial Report
Notes to the Consolidated Financial Statements
Pension and Other Benefit Plans StatusInformation on the Company’s defined benefit pension plans and other benefit plans, in aggregate, was as follows:
2006 2005
Pension Other Pension OtherBenefit Plans Benefit Plans(1) Total Benefit Plans Benefit Plans(1) Total
Benefit Plan AssetsFair value, beginning of year $ 1,480 $ 45 $ 1,525 $ 1,319 $ 39 $ 1,358
Actual return (loss) on plan assets 115 (1) 114 152 2 154
Employer contributions 129 29 158 107 25 132Employee contributions 4 4 4 4Benefits paid (100) (23) (123) (91) (21) (112)Other, including impact of
foreign currency translation 1 1 (11) (11)
Fair value, end of year $ 1,629 $ 50 $ 1,679 $ 1,480 $ 45 $ 1,525
Accrued Benefit Plan ObligationsBalance, beginning of year $ 1,840 $ 377 $ 2,217 $ 1,571 $ 308 $ 1,879
Current service cost 70 14 84 59 9 68Interest cost 98 20 118 98 18 116Benefits paid (100) (23) (123) (91) (21) (112)Actuarial loss 50 86 136 214 81 295Past service costs 1 2 3Contractual termination
benefits(2) 9 9Curtailment gain(3) (6) (15) (21)Other, including impact of
foreign currency translation (1) 1 – (15) (5) (20)
Balance, end of year $ 1,957 $ 475 $ 2,432 $ 1,840 $ 377 $ 2,217
Deficit of Plan Assets VersusPlan Obligations $ (328) $ (425) $ (753) $ (360) $ (332) $ (692)
Unamortized past service costs 6 (38) (32) 7 (41) (34)Unamortized net actuarial loss 462 244 706 433 179 612
Net accrued benefit plan asset (liability) $ 140 $ (219) $ (79) $ 80 $ (194) $ (114)
Recorded in the consolidatedbalance sheets as follows:
Other assets (note 16) $ 207 $ 39 $ 246 $ 145 $ 38 $ 183Other liabilities (note 19) (67) (258) (325) (65) (232) (297)
Net accrued benefit plan asset (liability) $ 140 $ (219) $ (79) $ 80 $ (194) $ (114)
(1) Other benefit plans include post-retirement, post-employment and long term disability benefit plans.(2) Contractual termination benefits resulted from the 2005 plan to restructure the Loblaw supply chain operations nationally and were
recorded in restructuring and other charges in 2005 (see note 4).(3) Certain defined benefit pension plans and other benefit plans affected by the 2005 plan to restructure Weston Foods United States
biscuit operations, the 2005 plan to restructure Loblaw’s supply chain operations nationally and the 2005 plan to exit certain ofWeston Foods United States bread lines were remeasured as at March 1, 2005, March 31, 2005 and August 1, 2005 respectively.For these plans, costs subsequent to these dates were determined using discount rates of 5.75%, 5.75% and 5.50% respectively.The majority of the resulting curtailment gains were offset against unamortized net actuarial losses for those plans. A net curtailmentloss of $2 for defined benefit pension plans and a net curtailment gain of $2 for other benefit plans were recorded in restructuringand other charges in 2005 (see note 4).
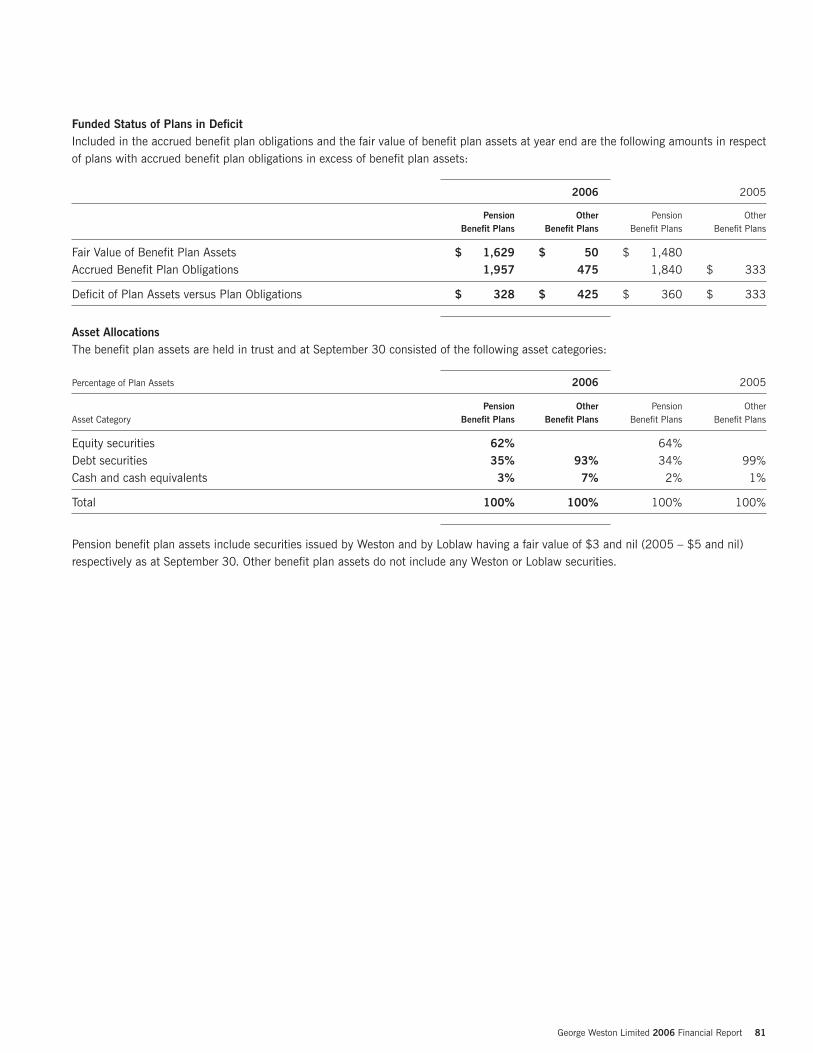
Funded Status of Plans in DeficitIncluded in the accrued benefit plan obligations and the fair value of benefit plan assets at year end are the following amounts in respectof plans with accrued benefit plan obligations in excess of benefit plan assets:
2006 2005
Pension Other Pension OtherBenefit Plans Benefit Plans Benefit Plans Benefit Plans
Fair Value of Benefit Plan Assets $ 1,629 $ 50 $ 1,480Accrued Benefit Plan Obligations 1,957 475 1,840 $ 333
Deficit of Plan Assets versus Plan Obligations $ 328 $ 425 $ 360 $ 333
Asset AllocationsThe benefit plan assets are held in trust and at September 30 consisted of the following asset categories:
Percentage of Plan Assets 2006 2005
Pension Other Pension OtherAsset Category Benefit Plans Benefit Plans Benefit Plans Benefit Plans
Equity securities 62% 64%Debt securities 35% 93% 34% 99%Cash and cash equivalents 3% 7% 2% 1%
Total 100% 100% 100% 100%
Pension benefit plan assets include securities issued by Weston and by Loblaw having a fair value of $3 and nil (2005 – $5 and nil)respectively as at September 30. Other benefit plan assets do not include any Weston or Loblaw securities.
George Weston Limited 2006 Financial Report 81
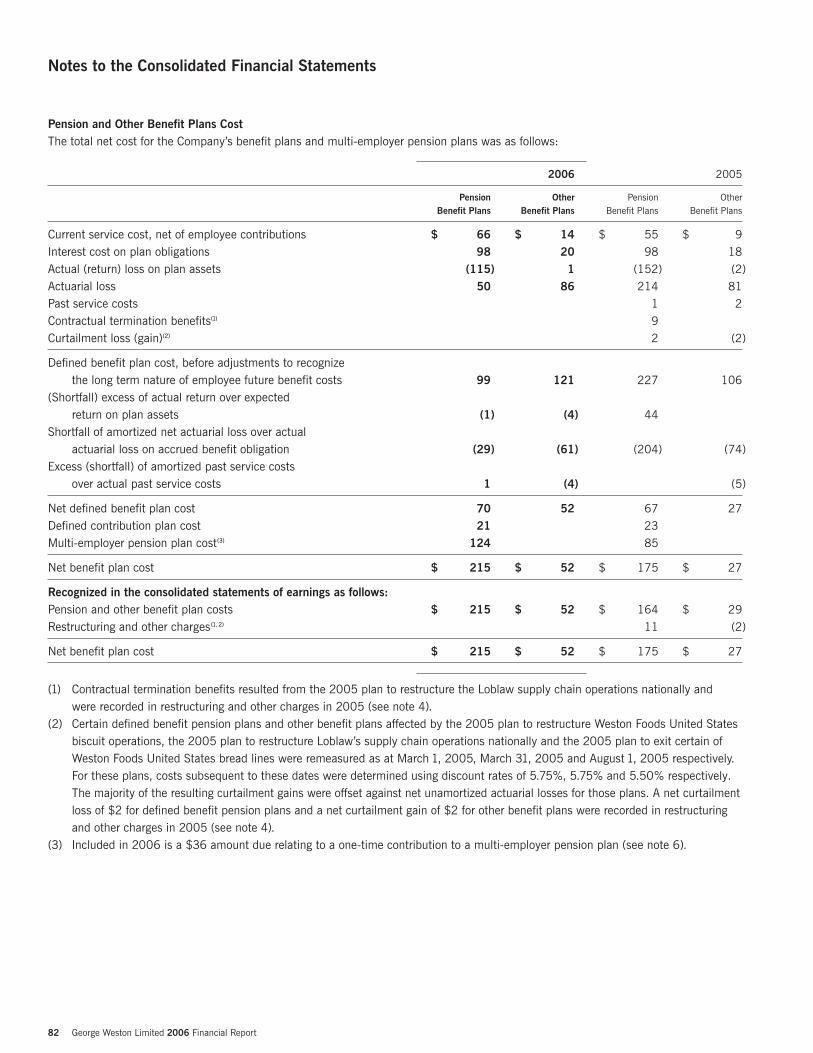
82 George Weston Limited 2006 Financial Report
Notes to the Consolidated Financial Statements
Pension and Other Benefit Plans CostThe total net cost for the Company’s benefit plans and multi-employer pension plans was as follows:
2006 2005
Pension Other Pension OtherBenefit Plans Benefit Plans Benefit Plans Benefit Plans
Current service cost, net of employee contributions $ 66 $ 14 $ 55 $ 9Interest cost on plan obligations 98 20 98 18Actual (return) loss on plan assets (115) 1 (152) (2)Actuarial loss 50 86 214 81Past service costs 1 2Contractual termination benefits(1) 9Curtailment loss (gain)(2) 2 (2)
Defined benefit plan cost, before adjustments to recognize the long term nature of employee future benefit costs 99 121 227 106
(Shortfall) excess of actual return over expectedreturn on plan assets (1) (4) 44
Shortfall of amortized net actuarial loss over actualactuarial loss on accrued benefit obligation (29) (61) (204) (74)
Excess (shortfall) of amortized past service costsover actual past service costs 1 (4) (5)
Net defined benefit plan cost 70 52 67 27Defined contribution plan cost 21 23Multi-employer pension plan cost(3) 124 85
Net benefit plan cost $ 215 $ 52 $ 175 $ 27
Recognized in the consolidated statements of earnings as follows:Pension and other benefit plan costs $ 215 $ 52 $ 164 $ 29Restructuring and other charges (1, 2) 11 (2)
Net benefit plan cost $ 215 $ 52 $ 175 $ 27
(1) Contractual termination benefits resulted from the 2005 plan to restructure the Loblaw supply chain operations nationally and were recorded in restructuring and other charges in 2005 (see note 4).
(2) Certain defined benefit pension plans and other benefit plans affected by the 2005 plan to restructure Weston Foods United Statesbiscuit operations, the 2005 plan to restructure Loblaw’s supply chain operations nationally and the 2005 plan to exit certain ofWeston Foods United States bread lines were remeasured as at March 1, 2005, March 31, 2005 and August 1, 2005 respectively.For these plans, costs subsequent to these dates were determined using discount rates of 5.75%, 5.75% and 5.50% respectively.The majority of the resulting curtailment gains were offset against net unamortized actuarial losses for those plans. A net curtailmentloss of $2 for defined benefit pension plans and a net curtailment gain of $2 for other benefit plans were recorded in restructuringand other charges in 2005 (see note 4).
(3) Included in 2006 is a $36 amount due relating to a one-time contribution to a multi-employer pension plan (see note 6).

Plan AssumptionsThe significant annual weighted average actuarial assumptions used in calculating the Company’s accrued benefit plan obligations as atthe measurement date of September 30 and the net defined benefit plan cost for the year were as follows:
2006 2005
Pension Other Pension OtherBenefit Plans Benefit Plans Benefit Plans Benefit Plans
Accrued Benefit Plan ObligationsDiscount rate 5.2% 5.3% 5.3% 5.3%Rate of compensation increase 3.5% 3.5%
Net Defined Benefit Plan CostDiscount rate(1) 5.3% 5.3% 6.2% 6.1%Expected long term rate of return on plan assets 8.0% 5.0% 8.0% 5.5%Rate of compensation increase 3.5% 3.5%
(1) Certain defined benefit pension plans and other benefit plans affected by the 2005 plan to restructure Weston Foods United Statesbiscuit operations, the 2005 plan to restructure Loblaw’s supply chain operations nationally and the 2005 plan to exit certain ofWeston Foods United States bread lines were remeasured as at March 1, 2005, March 31, 2005 and August 1, 2005 respectively.For these plans, costs subsequent to these dates were determined using discount rates of 5.75%, 5.75% and 5.50% respectively.The majority of the resulting curtailment gains were offset against unamortized net actuarial losses for those plans. A net curtailmentloss of $2 for defined benefit pension plans and a net curtailment gain of $2 for other benefit plans were recorded in restructuringand other charges in 2005 (see note 4).
The growth rate of health care costs, primarily drug and other medical costs for other benefit plans, was estimated at 10.0% (2005 – 10.0%) and is assumed to gradually decrease to 5.0% by 2014 (2005 – 5.0% by 2013), remaining at that level thereafter.
Sensitivity of Key AssumptionsThe following table outlines the key assumptions for 2006 and the sensitivity of a 1% change in each of these assumptions on the accruedbenefit plan obligations and on the benefit plan cost for defined benefit pension plans and other benefit plans. The table reflects the impacton the current service and interest cost components for the discount rate and expected growth rate of health care costs assumptions.
The sensitivity analysis provided in the table is hypothetical and should be used with caution. The sensitivities of each key assumptionhave been calculated independently of any changes in other key assumptions. Actual experience may result in changes in a number of key assumptions simultaneously. Changes in one factor may result in changes in another, which could amplify or reduce the impact of such assumptions.
Pension Benefit Plans Other Benefit Plans
Accrued AccruedBenefit Plan Benefit Benefit Plan BenefitObligations Plan Cost(1) Obligations Plan Cost(1)
Expected long term rate of return on plan assets 8.0% 5.0%Impact of: 1% increase n/a $ (15) n/a $ –
1% decrease n/a $ 15 n/a $ –
Discount rate 5.2% 5.3% 5.3% 5.3%Impact of: 1% increase $ (250) $ (10) $ (56) $ (2)
1% decrease $ 296 $ 11 $ 66 $ 2
Expected growth rate of health care costs(2) 10.0% 10.0%Impact of: 1% increase n/a n/a $ 55 $ 6
1% decrease n/a n/a $ (47) $ (5)
n/a – not applicable(1) Discount rate and expected growth rate of health care costs sensitivity is for current service and interest costs only.(2) Gradually decreasing to 5.0% by 2014 for the accrued benefit plan obligation and the benefit plan cost, remaining at that level thereafter.
George Weston Limited 2006 Financial Report 83
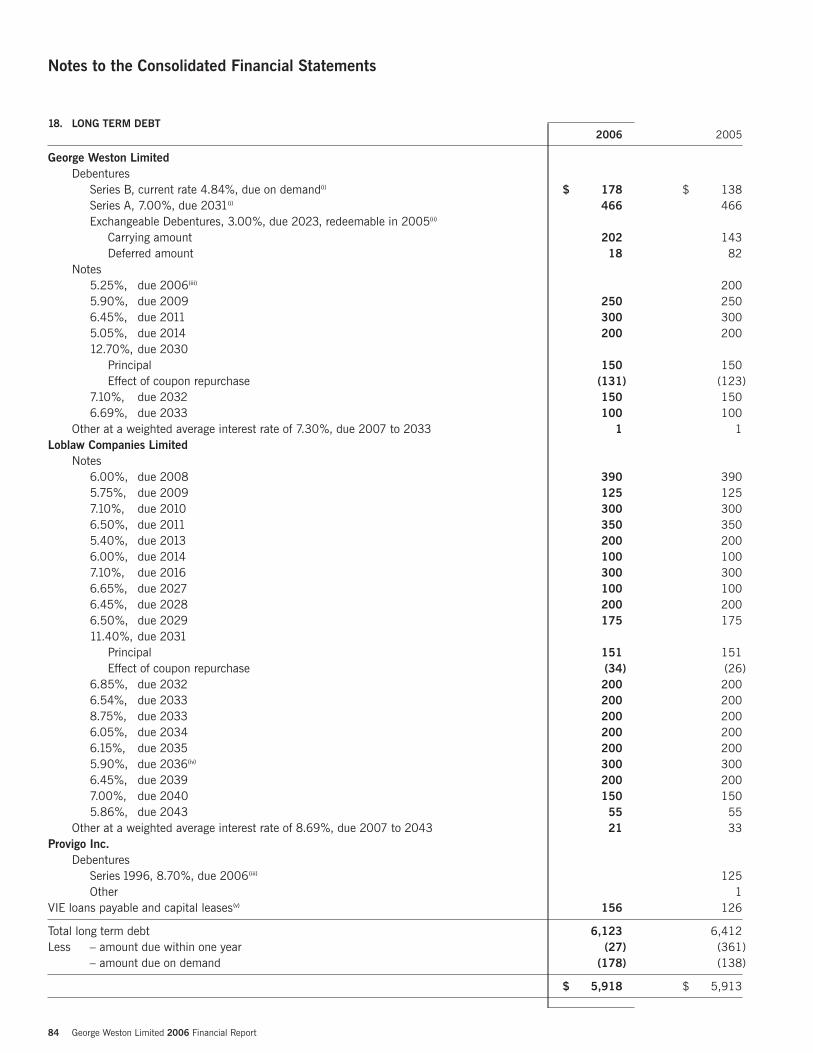
84 George Weston Limited 2006 Financial Report
Notes to the Consolidated Financial Statements
18. LONG TERM DEBT2006 2005
George Weston LimitedDebentures
Series B, current rate 4.84%, due on demand(i) $ 178 $ 138Series A, 7.00%, due 2031(i) 466 466Exchangeable Debentures, 3.00%, due 2023, redeemable in 2005(ii)
Carrying amount 202 143Deferred amount 18 82
Notes5.25%, due 2006(iii) 2005.90%, due 2009 250 2506.45%, due 2011 300 3005.05%, due 2014 200 20012.70%, due 2030
Principal 150 150Effect of coupon repurchase (131) (123)
7.10%, due 2032 150 1506.69%, due 2033 100 100
Other at a weighted average interest rate of 7.30%, due 2007 to 2033 1 1Loblaw Companies Limited
Notes6.00%, due 2008 390 3905.75%, due 2009 125 1257.10%, due 2010 300 3006.50%, due 2011 350 3505.40%, due 2013 200 2006.00%, due 2014 100 1007.10%, due 2016 300 3006.65%, due 2027 100 1006.45%, due 2028 200 2006.50%, due 2029 175 17511.40%, due 2031
Principal 151 151Effect of coupon repurchase (34) (26)
6.85%, due 2032 200 2006.54%, due 2033 200 2008.75%, due 2033 200 2006.05%, due 2034 200 2006.15%, due 2035 200 2005.90%, due 2036(iv) 300 3006.45%, due 2039 200 2007.00%, due 2040 150 1505.86%, due 2043 55 55
Other at a weighted average interest rate of 8.69%, due 2007 to 2043 21 33Provigo Inc.
DebenturesSeries 1996, 8.70%, due 2006(iii) 125Other 1
VIE loans payable and capital leases(v) 156 126
Total long term debt 6,123 6,412Less – amount due within one year (27) (361)
– amount due on demand (178) (138)
$ 5,918 $ 5,913
The five-year schedule of repayment of long term debt, inclusive of VIE and other debt, based on maturity, excluding the ExchangeableDebentures and the amount due on demand, is as follows: 2007 – $27; 2008 – $420; 2009 – $398; 2010 – $319; 2011 – $669.
(i) During 2006, Weston issued $40 (2005 – $36) of Series B Debentures due on demand, which are at a current weighted averageinterest rate of 4.84%. The Series A, 7.00% and Series B Debentures are secured by a pledge of 9.6 million Loblaw common shares.
(ii) In 1998, Weston sold its Forest Products business to Domtar Inc. (“Domtar”) for proceeds of $803, consisting of $435 of cash and $368 of Domtar common shares. The Domtar common share investment is recorded in other assets. Weston subsequently issued$375 of 3% Exchangeable Debentures (“Debentures”) due June 30, 2023. Each one thousand dollar principal amount of the Debenturesis exchangeable at the option of the holder for 95.2381 Domtar common shares. The Debentures became redeemable at the option ofWeston after June 30, 2005. Upon notice of redemption by Weston or within 30 days prior to the maturity date, the holder has the optionto exchange each one thousand dollar principal amount for 95.2381 Domtar common shares plus accrued interest payable in cash.
Weston’s obligation on the exchange or redemption of these Debentures can be satisfied by delivery of a cash amount equivalent to thecurrent market price of Domtar common shares at such time, the Domtar common shares or any combination thereof. Upon maturity,Weston at its option may deliver cash, the Domtar common shares or any combination thereof equal to 95.2381 Domtar commonshares for each one thousand dollar principal amount of these Debentures. During 2006, $5 (2005 – $148) of the 3% ExchangeableDebentures were exchanged for Domtar common shares. A corresponding reduction in the investment in Domtar was recorded.
The carrying amount of these Debentures is based on their market price at the reporting date. As a result of Weston issuing theseDebentures, the Domtar investment is hedged and the difference between the carrying amount and the original issue amount of the Debentures is recorded as a deferred amount until exchange, redemption or maturity. No corresponding valuation adjustment is made to the investment.
On March 7, 2007, pursuant to a transaction whereby Domtar was combined with the fine paper business of Weyerhauser Inc., Domtar common shares were exchanged for an equal number of either non-voting exchangeable shares of Domtar (Canada) Paper Inc.or common shares of Domtar Corporation (the “New Domtar”), a Delaware corporation.
After March 7, 2007, the Debentures entitle the holders to exchange their Debentures for common shares of New Domtar on the basisof 95.2381 common shares of New Domtar for each one thousand dollar principal amount of Debentures. Weston’s obligation on the exchange or redemption of these Debentures can be satisfied by delivery of a cash amount equivalent to the current market price of the common shares of New Domtar at such time, the common shares of New Domtar or any combination thereof.
In addition, the Share Purchase Agreement governing the June 1998 sale by Weston of E.B. Eddy Limited and E.B. Eddy Paper, Inc. toDomtar (the “SPA”) contains a price adjustment clause. The SPA provides, subject to certain exceptions, that if any person subsequentlyacquired more than 50% of the outstanding voting shares of Domtar, the price adjustment clause applies. Weston believes that a priceadjustment in the amount of $110 is payable and Weston has demanded payment of such amount from Domtar. Domtar’s position is that the purchase price adjustment does not apply because of the application of an exception contained in the SPA. Weston intendsto pursue its legal rights pursuant to the SPA.
(iii) During 2006, Weston repaid its $200 of 5.25% Medium Term Notes (“MTN”) as they matured. In addition, during 2006, Loblawrepaid its $125 of 8.70% Series 1996 Provigo Inc. Debenture as it matured.
(iv) During 2005, Loblaw issued $300 of 5.90% MTN due 2036 and the Loblaw $200 of 6.95% MTN matured and were repaid.
(v) Pursuant to the requirements of AcG 15, the consolidated balance sheet as at December 31, 2006 includes $156 (2005 – $126) of loans payable and capital lease obligations of VIEs consolidated by the Company, $23 (2005 – $23) of which is due within one year.
The loans payable of $124 (2005 – $126) represent financing obtained by eligible Loblaw independent franchisees through a structureinvolving independent trusts to facilitate the purchase of the majority of their inventory and fixed assets, consisting mainly of fixturingand equipment. The loans payable, which have an average term to maturity of 8 years (2005 – 7 years), are due and payable ondemand under certain predetermined circumstances and are secured through a general security agreement made by the independentfranchisees in favour of the independent funding trust. Interest is charged on a floating rate basis and prepayment of the loans may be made without penalty. The independent funding trust within the structure finances its activities through the issuance of short termasset-backed notes to third-party investors.
George Weston Limited 2006 Financial Report 85
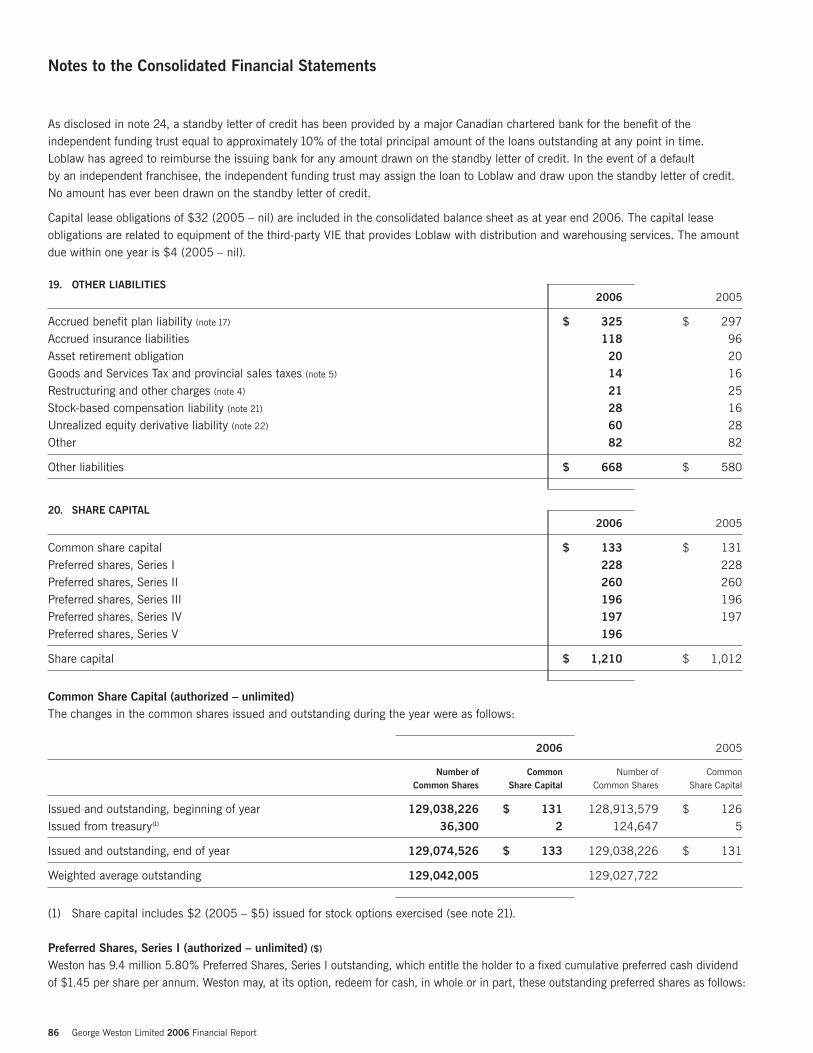
86 George Weston Limited 2006 Financial Report
Notes to the Consolidated Financial Statements
As disclosed in note 24, a standby letter of credit has been provided by a major Canadian chartered bank for the benefit of theindependent funding trust equal to approximately 10% of the total principal amount of the loans outstanding at any point in time.Loblaw has agreed to reimburse the issuing bank for any amount drawn on the standby letter of credit. In the event of a default by an independent franchisee, the independent funding trust may assign the loan to Loblaw and draw upon the standby letter of credit.No amount has ever been drawn on the standby letter of credit.
Capital lease obligations of $32 (2005 – nil) are included in the consolidated balance sheet as at year end 2006. The capital leaseobligations are related to equipment of the third-party VIE that provides Loblaw with distribution and warehousing services. The amountdue within one year is $4 (2005 – nil).
19. OTHER LIABILITIES2006 2005
Accrued benefit plan liability (note 17) $ 325 $ 297Accrued insurance liabilities 118 96Asset retirement obligation 20 20Goods and Services Tax and provincial sales taxes (note 5) 14 16Restructuring and other charges (note 4) 21 25Stock-based compensation liability (note 21) 28 16Unrealized equity derivative liability (note 22) 60 28Other 82 82
Other liabilities $ 668 $ 580
20. SHARE CAPITAL2006 2005
Common share capital $ 133 $ 131Preferred shares, Series I 228 228Preferred shares, Series II 260 260Preferred shares, Series III 196 196Preferred shares, Series IV 197 197Preferred shares, Series V 196
Share capital $ 1,210 $ 1,012
Common Share Capital (authorized – unlimited)The changes in the common shares issued and outstanding during the year were as follows:
2006 2005
Number of Common Number of CommonCommon Shares Share Capital Common Shares Share Capital
Issued and outstanding, beginning of year 129,038,226 $ 131 128,913,579 $ 126Issued from treasury(1) 36,300 2 124,647 5
Issued and outstanding, end of year 129,074,526 $ 133 129,038,226 $ 131
Weighted average outstanding 129,042,005 129,027,722
(1) Share capital includes $2 (2005 – $5) issued for stock options exercised (see note 21).
Preferred Shares, Series I (authorized – unlimited) ($)
Weston has 9.4 million 5.80% Preferred Shares, Series I outstanding, which entitle the holder to a fixed cumulative preferred cash dividendof $1.45 per share per annum. Weston may, at its option, redeem for cash, in whole or in part, these outstanding preferred shares as follows:

On or after December 15, 2006 at $26.00 per shareOn or after December 15, 2007 at $25.75 per shareOn or after December 15, 2008 at $25.50 per shareOn or after December 15, 2009 at $25.25 per shareOn or after December 15, 2010 at $25.00 per share
At any time after issuance, Weston may, at its option, give the holders of these preferred shares the right, at the option of the holder, to convert their preferred shares into preferred shares of a further series designated by Weston on a share-for-share basis on a datespecified by Weston.
Preferred Shares, Series II (authorized – unlimited) ($)
Weston has 10.6 million 5.15% Preferred Shares, Series II outstanding which entitle the holder to a fixed cumulative preferred cashdividend of $1.2875 per share per annum. On or after April 1, 2009, Weston may, at its option, redeem for cash, in whole or in part,these outstanding preferred shares at $25.00 per share. On and after July 1, 2009, these outstanding preferred shares are convertible,at the option of the holder, into a number of Weston’s common shares determined by dividing $25.00 by the greater of $2.00 and 95%of the then current market price of Weston’s common shares. At any time after issuance, Weston may, at its option, give the holders of these preferred shares the right, at the option of the holder, to convert their preferred shares into preferred shares of a further seriesdesignated by Weston on a share-for-share basis on a date specified by Weston.
Preferred Shares, Series III (authorized – unlimited) ($)
During 2005, Weston issued 8.0 million 5.20% Preferred Shares, Series III for $25.00 per share for net proceeds of $194 million which entitle the holder to a fixed cumulative preferred cash dividend of $1.30 per share per annum. In addition, included in sharecapital is a future tax benefit of $2 million related to the deductibility of the issuance costs. Weston may, at its option, redeem for cash, in whole or in part, these outstanding preferred shares as follows:
On or after July 1, 2010 at $26.00 per shareOn or after July 1, 2011 at $25.75 per shareOn or after July 1, 2012 at $25.50 per shareOn or after July 1, 2013 at $25.25 per shareOn or after July 1, 2014 at $25.00 per share
At any time after issuance, Weston may, at its option, give the holders of these preferred shares the right, at the option of the holder, to convert their preferred shares into preferred shares of a further series designated by Weston on a share-for-share basis on a datespecified by Weston.
Preferred Shares, Series IV (authorized – unlimited) ($)
During 2005, Weston issued 8.0 million 5.20% Preferred Shares, Series IV for $25.00 per share for net proceeds of $195 million which entitle the holder to a fixed cumulative preferred cash dividend of $1.30 per share per annum. In addition, included in sharecapital is a future tax benefit of $2 million related to the deductibility of the issuance costs. Weston may, at its option, redeem for cash, in whole or in part, these outstanding preferred shares as follows:
On or after October 1, 2010 at $26.00 per shareOn or after October 1, 2011 at $25.75 per shareOn or after October 1, 2012 at $25.50 per shareOn or after October 1, 2013 at $25.25 per shareOn or after October 1, 2014 at $25.00 per share
At any time after issuance, Weston may, at its option, give the holders of these preferred shares the right, at the option of the holder, to convert their preferred shares into preferred shares of a further series designated by Weston on a share-for-share basis on a datespecified by Weston.
Preferred Shares, Series V (authorized – unlimited) ($)
During 2006, Weston issued 8.0 million 4.75% Preferred Shares, Series V for $25.00 per share for net proceeds of $194 million which entitle the holder to a fixed cumulative preferred cash dividend of $1.1875 per share per annum. In addition, included in sharecapital is a future tax benefit of $2 million related to the deductibility of the issuance costs. Weston may, at its option, redeem for cash, in whole or in part, these outstanding preferred shares as follows:
George Weston Limited 2006 Financial Report 87
88 George Weston Limited 2006 Financial Report
Notes to the Consolidated Financial Statements
On or after July 1, 2011 at $26.00 per shareOn or after July 1, 2012 at $25.75 per shareOn or after July 1, 2013 at $25.50 per shareOn or after July 1, 2014 at $25.25 per shareOn or after July 1, 2015 at $25.00 per share
At any time after issuance, Weston may, at its option, give the holders of these preferred shares the right, at the option of the holder, to convert their preferred shares into preferred shares of a further series designated by Weston on a share-for-share basis on a datespecified by Weston.
NCIB ($)
Weston intends to renew its NCIB to purchase on the Toronto Stock Exchange or enter into equity derivatives to purchase up to 5% of its common shares outstanding. Weston, in accordance with the rules and by-laws of the Toronto Stock Exchange, may purchase its common shares at the then market price of such shares.
21. STOCK-BASED COMPENSATION ($ except table)
The Company maintains five types of stock-based compensation plans, which are described below.
Stock Option PlansWeston maintains a stock option plan for certain employees. Under this plan, Weston may grant options for up to seven million of its common shares; however, Weston has set a guideline which limits the number of stock option grants to a maximum of 5% ofoutstanding common shares at any time. Stock options have up to a seven-year term, vest 20% cumulatively on each anniversary date of the grant and are exercisable at the designated common share price, which is 100% of the market price of Weston’s commonshares on the last trading day prior to the effective date of the grant. Each stock option is exercisable into one common share of Weston at the price specified in the terms of the option agreement, or option holders may elect to receive in cash the share appreciationvalue equal to the excess of the market price at the date of exercise over the specified option price.
During 2006, the share appreciation value of $1 million (2005 – $11 million) was paid on the exercise of 58,550 (2005 – 224,638)stock options and 91,792 (2005 – 31,957) stock options were forfeited or cancelled during 2006. Weston issued 36,300 (2005 – 124,647) common shares on the exercise of stock options and received cash consideration of $2 million (2005 – $5 million),for which it had recorded a stock-based compensation liability of nil (2005 – nominal).
During 2005, Weston granted 401,668 stock options to 106 employees at a weighted average exercise price of $109.88 per commonshare under its existing stock option plan, which allows for settlement in shares or in the share appreciation value in cash at the optionof the employee.
During 2005, Weston granted 213,994 stock options to 19 employees at a weighted average exercise price of $111.02 per commonshare, which will be settled by issuing common shares. The weighted average grant-date fair value of these stock options of $3 millionwas estimated using the Black-Scholes model for pricing options assuming a weighted average expected dividend yield of 1.3% annually, a weighted average risk free interest rate of 3.1%, a weighted average expected common share price volatility of 17.1% and a weighted average expected option life of 3 years.
In addition, during 2005, Weston granted 70,000 stock options to 1 employee at a weighted average exercise price of $95.88 percommon share, which will be settled by issuing common shares. The weighted average grant-date fair value of these stock options of $1 million was estimated using the Black-Scholes model for pricing options assuming a weighted average expected dividend yield of1.5% annually, a weighted average risk free interest rate of 3.7%, a weighted average expected common share price volatility of 16.5%and a weighted average expected option life of 3 years.
Loblaw maintains a stock option plan for certain employees. Under this plan, Loblaw may grant options for up to 20.4 million of its common shares; however, Loblaw has set a guideline which limits the number of stock option grants to a maximum of 5% ofoutstanding common shares at any time. Stock options have up to a seven-year term, vest 20% cumulatively on each anniversary date of the grant and are exercisable at the designated common share price, which is 100% of the market price of Loblaw’s commonshares on the last trading day prior to the effective date of the grant. Each stock option is exercisable into one common share of Loblaw at the price specified in the terms of the option agreement, or option holders may elect to receive in cash the share appreciationvalue equal to the excess of the market price at the date of exercise over the specified option price.
During 2006, Loblaw granted 189,354 (2005 – 2,247,627) stock options with a weighted average exercise price of $55.30 (2005 – $69.73) per common share under its existing stock option plan, which allows for settlement in shares or in the shareappreciation value in cash at the option of the employee.
During 2006, the share appreciation value of $11 million (2005 – $41 million) was paid by Loblaw on the exercise of 815,403 (2005 – 1,135,221) stock options. Loblaw issued 118,750 (2005 – 25,000) common shares on the exercise of stock options andreceived cash consideration of $4 million (2005 – $0.9 million), for which it had recorded a stock-based compensation liability of $0.1 million (2005 – $1 million).
Share Appreciation Right PlanWeston maintains a share appreciation right plan for certain senior United States employees. Share appreciation rights have up to a seven-year term, vest 20% cumulatively on each anniversary date of the grant and are exercisable at the designated common shareprice, which is 100% of the market price of Weston’s common shares on the last trading day prior to the effective date of the grant.When they are exercised, the employee will receive in cash the share appreciation value equal to the excess of the market price at thedate of exercise over the specified right price.
During 2005, Weston granted 174,108 share appreciation rights to 86 employees at a weighted average exercise price of $111.02 per common share under its existing share appreciation right plan, which will be settled in cash.
In 2006, 10,400 share appreciation rights were forfeited or cancelled. In 2005, a nominal amount was paid on the exercise of 19,400 share appreciation rights and 7,000 were forfeited or cancelled.
Restricted Share Unit (“RSU”) PlansWeston and Loblaw have adopted a RSU plan for certain senior employees. The RSUs entitle employees to a cash payment after theend of each performance period, of up to 3 years, following the date of the award. The RSU payment will be an amount equal to theweighted average price of a Weston or Loblaw common share for a prescribed period immediately preceding the end of the performanceperiod for the RSUs multiplied by the number of RSUs held by the employee.
During 2006, Weston granted 148,049 (2005 – 160,958) RSUs to 100 (2005 – 185) employees, 6,396 (2005 – 1,057) RSUs were cancelled and 2,643 were paid out. In addition, during 2006, Loblaw granted 691,001 (2005 – 393,335) RSUs to 238 (2005 – 236) employees, 211,526 (2005 – 10,151) RSUs were cancelled and 112,707 were paid out. At year end, a total of 298,911 (2005 – 159,901) Weston and 749,952 (2005 – 383,184) Loblaw RSUs were outstanding.
Deferred Share Unit (“DSU”) PlansOutside members of Weston’s and Loblaw’s Boards of Directors may elect annually to receive all or a portion of their annual retainer(s)and fees in the form of DSUs, the value of which is determined by the market price of Weston’s or Loblaw’s common shares at the time the director’s annual retainer(s) or fees are earned. Upon termination of Board service, the common shares due to the director, as represented by the DSUs, will be purchased on the open market on the director’s behalf. At year end, Weston had 28,303 (2005 – 21,609) and Loblaw had 44,397 (2005 – 36,666) DSUs outstanding. The year-over-year change in the deferred share units liability was minimal and was recognized in operating income.
Employee Share Ownership Plans (“ESOPs”)Weston and Loblaw maintain ESOPs for their employees which allow employees to acquire Weston’s and Loblaw’s common sharesthrough regular payroll deductions of up to 5% of their gross regular earnings. Weston and Loblaw contribute an additional 25% (2005 – 25%) of each employee’s contribution to its plan. The ESOPs are administered through a trust which purchases Weston’s and Loblaw’s common shares on the open market on behalf of employees. A compensation cost of $7 million (2005 – $6 million)related to these plans was recognized in operating income.
The following table summarizes the Company’s cost recognized in operating income related to its stock-based compensation plans,related equity derivatives and restricted share unit plans:
($ millions) 2006 2005
Stock option plans/share appreciation right plan income $ (11) $ (46)Equity derivatives loss 48 108Restricted share unit plan expense 23 10
Net stock-based compensation cost $ 60 $ 72
George Weston Limited 2006 Financial Report 89
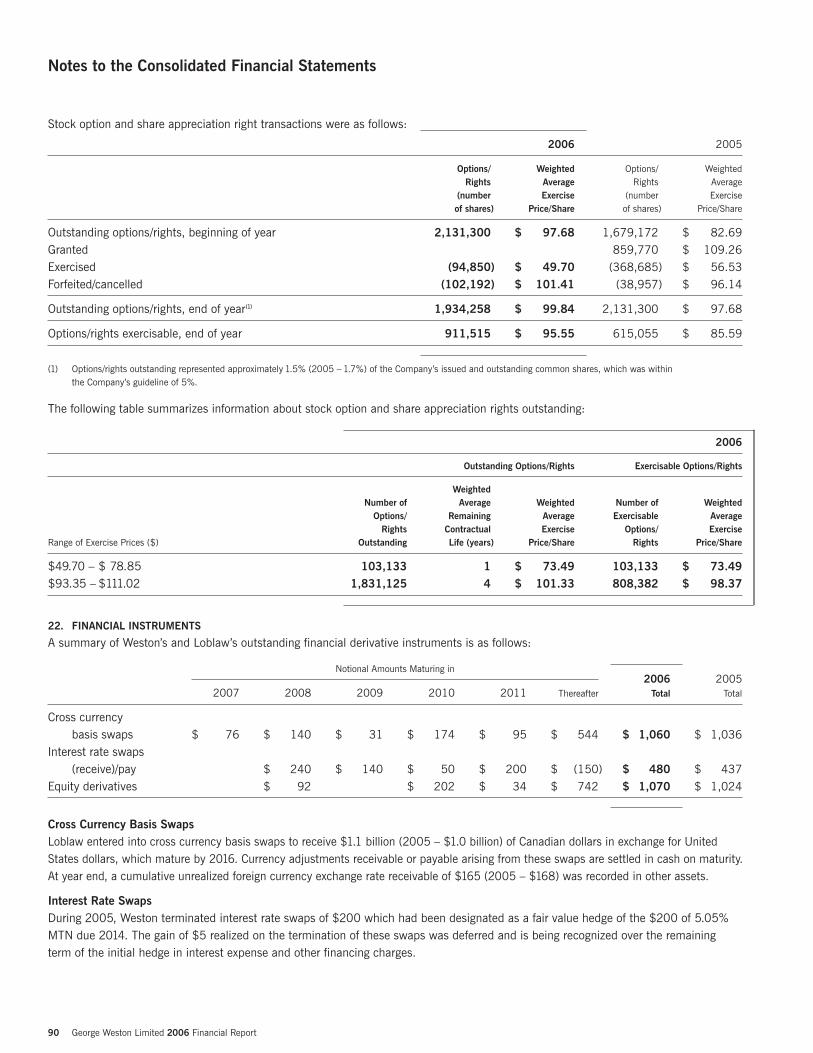
90 George Weston Limited 2006 Financial Report
Notes to the Consolidated Financial Statements
Stock option and share appreciation right transactions were as follows:
2006 2005
Options/ Weighted Options/ WeightedRights Average Rights Average
(number Exercise (number Exerciseof shares) Price/Share of shares) Price/Share
Outstanding options/rights, beginning of year 2,131,300 $ 97.68 1,679,172 $ 82.69Granted 859,770 $ 109.26Exercised (94,850) $ 49.70 (368,685) $ 56.53Forfeited/cancelled (102,192) $ 101.41 (38,957) $ 96.14
Outstanding options/rights, end of year(1) 1,934,258 $ 99.84 2,131,300 $ 97.68
Options/rights exercisable, end of year 911,515 $ 95.55 615,055 $ 85.59
(1) Options/rights outstanding represented approximately 1.5% (2005 – 1.7%) of the Company’s issued and outstanding common shares, which was withinthe Company’s guideline of 5%.
The following table summarizes information about stock option and share appreciation rights outstanding:
2006
Outstanding Options/Rights Exercisable Options/Rights
WeightedNumber of Average Weighted Number of Weighted
Options/ Remaining Average Exercisable AverageRights Contractual Exercise Options/ Exercise
Range of Exercise Prices ($) Outstanding Life (years) Price/Share Rights Price/Share
$49.70 – $ 78.85 103,133 1 $ 73.49 103,133 $ 73.49$93.35 – $111.02 1,831,125 4 $ 101.33 808,382 $ 98.37
22. FINANCIAL INSTRUMENTS
A summary of Weston’s and Loblaw’s outstanding financial derivative instruments is as follows:
Notional Amounts Maturing in2006 2005
2007 2008 2009 2010 2011 Thereafter Total Total
Cross currencybasis swaps $ 76 $ 140 $ 31 $ 174 $ 95 $ 544 $ 1,060 $ 1,036
Interest rate swaps(receive)/pay $ 240 $ 140 $ 50 $ 200 $ (150) $ 480 $ 437
Equity derivatives $ 92 $ 202 $ 34 $ 742 $ 1,070 $ 1,024
Cross Currency Basis SwapsLoblaw entered into cross currency basis swaps to receive $1.1 billion (2005 – $1.0 billion) of Canadian dollars in exchange for UnitedStates dollars, which mature by 2016. Currency adjustments receivable or payable arising from these swaps are settled in cash on maturity.At year end, a cumulative unrealized foreign currency exchange rate receivable of $165 (2005 – $168) was recorded in other assets.
Interest Rate SwapsDuring 2005, Weston terminated interest rate swaps of $200 which had been designated as a fair value hedge of the $200 of 5.05%MTN due 2014. The gain of $5 realized on the termination of these swaps was deferred and is being recognized over the remainingterm of the initial hedge in interest expense and other financing charges.

Loblaw enters into interest rate swaps to hedge a portion of its exposure to fluctuations in interest rates. Loblaw’s interest rate swapsconvert a net notional $480 (2005 – $437) of its floating rate investments to average fixed rate investments at 4.73% (2005 – 4.76%),which mature by 2013.
Equity Swaps and Forwards ($)
In 2006, Weston had cumulative outstanding equity swaps in its common shares of 1,686,700 (2005 – 1,686,700) at an averageforward price of $103.17 (2005 – $103.17). In 2006, Loblaw had cumulative outstanding equity forwards in its common shares of 4.8 million (2005 – 4.8 million), at a cumulative average forward price of $51.43 (2005 – $50.02) including $6.56 (2005 – $5.15)per common share of interest expense net of dividends that has been recognized in net earnings from continuing operations and will be paid at termination. These swaps and forwards allow for several methods of settlement including net cash settlement. They change in value as the market price of the underlying common shares changes and provide a partial offset to fluctuations in Weston’s andLoblaw’s stock-based compensation cost. The partial offset between the Company’s stock-based compensation costs and the equityderivatives is effective as long as the market prices of Weston and Loblaw common shares exceed the exercise price of the relatedemployee stock options. The amount of net stock-based compensation cost recorded in operating income is mainly dependent upon the number of unexercised, vested stock options and restricted share units relative to the number of underlying common shares on the equity derivatives and the fluctuations in the market price of the underlying common shares. The Company has included an unrealized market loss in other liabilities of $47 million (2005 – $28 million) relating to these swaps and has included an unrealizedmarket loss of $13 million in other liabilities (2005 – gain of $30 million in other assets) relating to these forwards.
In 2001, Weston entered into an equity forward sale agreement based on 9.6 million Loblaw common shares at an original forward priceof $48.50 per Loblaw common share which, as at December 31, 2006, had increased to a forward price of $67.64 (2005 – $63.50)per Loblaw common share. The forward matures in 2031 and will be settled in cash as follows: Weston will receive the forward priceand will pay the market value of the underlying Loblaw common shares at maturity. The obligation of Weston under this forward issecured by the underlying Loblaw common shares. Weston entered into this forward to partially offset any repayment risk associatedwith its Series A, 7.00% and Series B Debentures. Further, the market value of the underlying Loblaw common shares exceeds theobligation of Weston under this forward and a portion of the proceeds from a future sale of these shares may be used to satisfy theobligation under this forward contract upon termination or maturity. Weston recognizes a non-cash charge or income, which is includedin consolidated interest expense and other financing charges, representing the fair value adjustment of Weston’s forward sale agreementfor 9.6 million Loblaw common shares. The fair value adjustment is based on fluctuations in the market price of the underlying Loblawshares and is a non-cash item that will ultimately be offset by the recognition of any gain on Weston’s disposition of the 9.6 million Loblawcommon shares. At year end, Weston had a receivable under this forward of $181 million (2005 – $69 million), which was included inother assets.
Fair Value of Financial InstrumentsThe fair value of a financial instrument is the estimated amount that the Company would receive or pay to terminate the instrumentagreement at the reporting date. The following methods and assumptions were used to estimate the fair value of each type of financialinstrument by reference to various market value data and other valuation techniques as appropriate.
• The fair values of cash, cash equivalents, short term investments, accounts receivable, bank indebtedness, commercial paper,accounts payable, accrued liabilities and short term bank loans approximated their carrying values given their short term maturities.
• The fair value of long term debt issues was estimated based on the discounted cash flows of the debt at the Company’s estimatedincremental borrowing rates for debt of the same remaining maturities.
• The fair value of the Exchangeable Debentures was estimated based on the market price at the reporting date.• The fair value of the cross currency basis swaps was estimated based on the market spot exchange rate and forward interest rates
and approximated their carrying value.• The fair value of the interest rate swaps was estimated by discounting net cash flows of the swaps at market and forward interest
rates for swaps of the same remaining maturities.• The fair value of the equity swaps and forwards was estimated by multiplying the number of Weston and Loblaw common shares
outstanding under the equity swaps and forwards by the difference between the market price of the common shares and the averageforward price of the outstanding swaps and forwards at year end.
George Weston Limited 2006 Financial Report 91
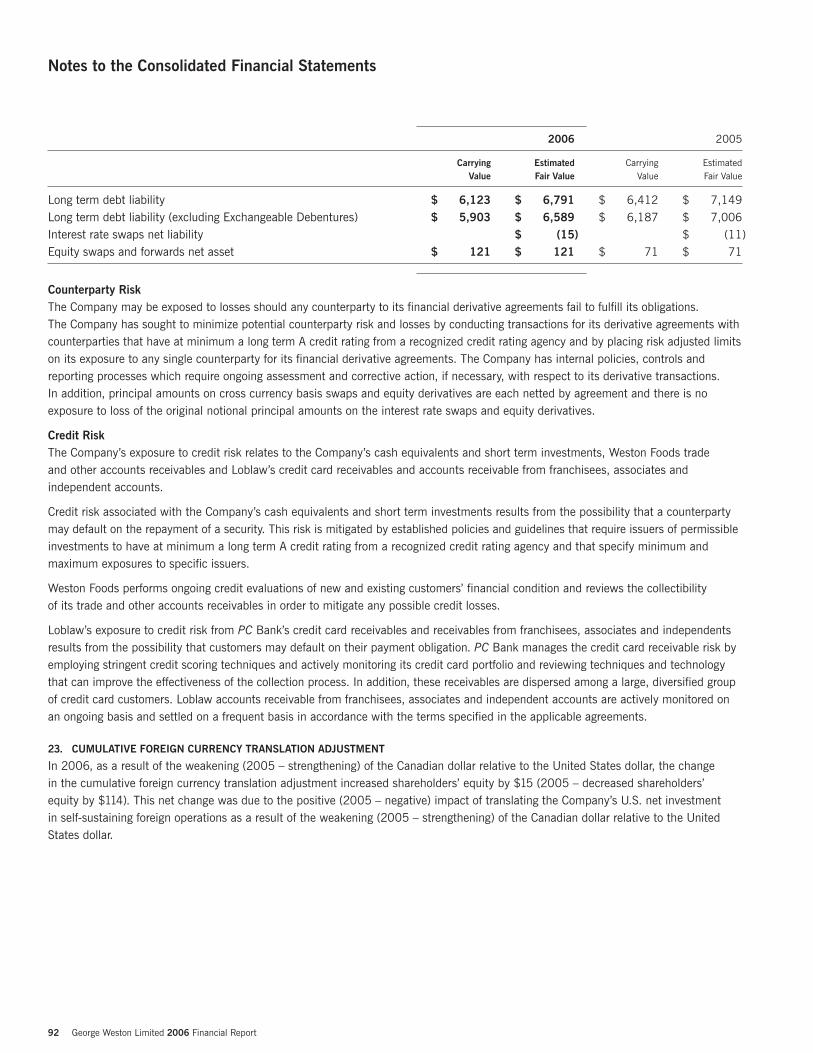
92 George Weston Limited 2006 Financial Report
Notes to the Consolidated Financial Statements
2006 2005
Carrying Estimated Carrying EstimatedValue Fair Value Value Fair Value
Long term debt liability $ 6,123 $ 6,791 $ 6,412 $ 7,149Long term debt liability (excluding Exchangeable Debentures) $ 5,903 $ 6,589 $ 6,187 $ 7,006Interest rate swaps net liability $ (15) $ (11)Equity swaps and forwards net asset $ 121 $ 121 $ 71 $ 71
Counterparty RiskThe Company may be exposed to losses should any counterparty to its financial derivative agreements fail to fulfill its obligations. The Company has sought to minimize potential counterparty risk and losses by conducting transactions for its derivative agreements withcounterparties that have at minimum a long term A credit rating from a recognized credit rating agency and by placing risk adjusted limitson its exposure to any single counterparty for its financial derivative agreements. The Company has internal policies, controls andreporting processes which require ongoing assessment and corrective action, if necessary, with respect to its derivative transactions. In addition, principal amounts on cross currency basis swaps and equity derivatives are each netted by agreement and there is noexposure to loss of the original notional principal amounts on the interest rate swaps and equity derivatives.
Credit RiskThe Company’s exposure to credit risk relates to the Company’s cash equivalents and short term investments, Weston Foods trade and other accounts receivables and Loblaw’s credit card receivables and accounts receivable from franchisees, associates andindependent accounts.
Credit risk associated with the Company’s cash equivalents and short term investments results from the possibility that a counterpartymay default on the repayment of a security. This risk is mitigated by established policies and guidelines that require issuers of permissibleinvestments to have at minimum a long term A credit rating from a recognized credit rating agency and that specify minimum andmaximum exposures to specific issuers.
Weston Foods performs ongoing credit evaluations of new and existing customers’ financial condition and reviews the collectibility of its trade and other accounts receivables in order to mitigate any possible credit losses.
Loblaw’s exposure to credit risk from PC Bank’s credit card receivables and receivables from franchisees, associates and independentsresults from the possibility that customers may default on their payment obligation. PC Bank manages the credit card receivable risk byemploying stringent credit scoring techniques and actively monitoring its credit card portfolio and reviewing techniques and technologythat can improve the effectiveness of the collection process. In addition, these receivables are dispersed among a large, diversified groupof credit card customers. Loblaw accounts receivable from franchisees, associates and independent accounts are actively monitored onan ongoing basis and settled on a frequent basis in accordance with the terms specified in the applicable agreements.
23. CUMULATIVE FOREIGN CURRENCY TRANSLATION ADJUSTMENT
In 2006, as a result of the weakening (2005 – strengthening) of the Canadian dollar relative to the United States dollar, the change in the cumulative foreign currency translation adjustment increased shareholders’ equity by $15 (2005 – decreased shareholders’equity by $114). This net change was due to the positive (2005 – negative) impact of translating the Company’s U.S. net investmentin self-sustaining foreign operations as a result of the weakening (2005 – strengthening) of the Canadian dollar relative to the UnitedStates dollar.
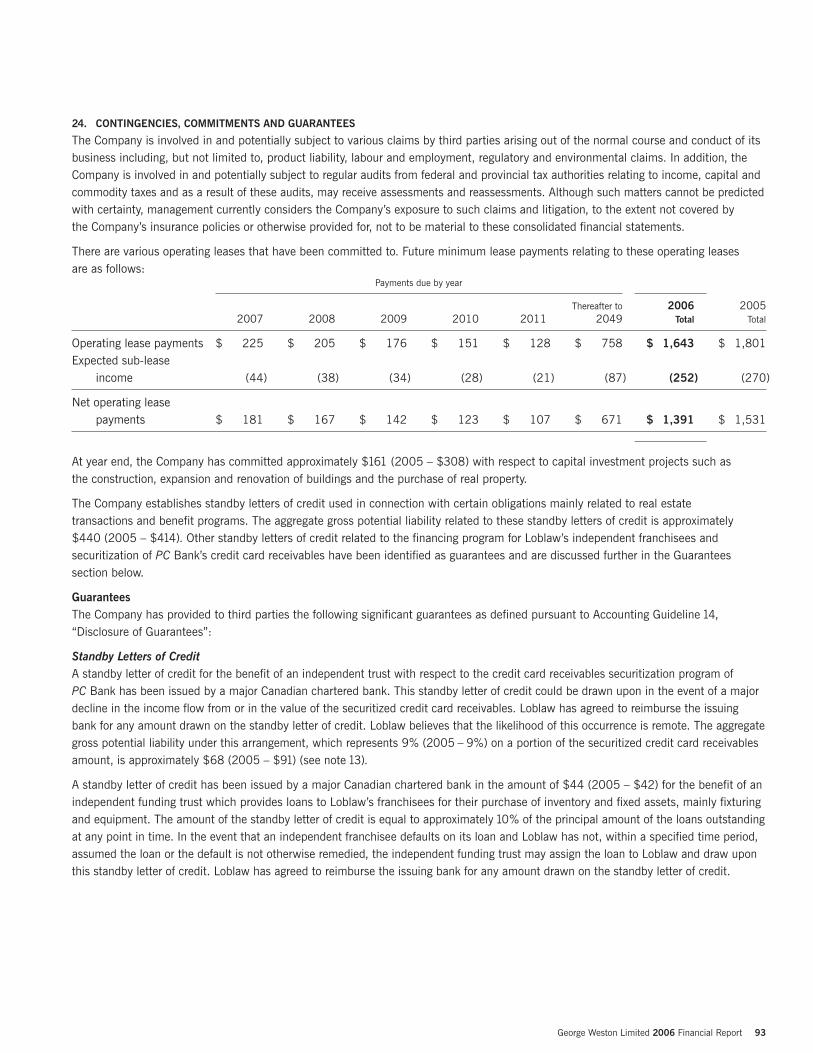
24. CONTINGENCIES, COMMITMENTS AND GUARANTEES
The Company is involved in and potentially subject to various claims by third parties arising out of the normal course and conduct of itsbusiness including, but not limited to, product liability, labour and employment, regulatory and environmental claims. In addition, theCompany is involved in and potentially subject to regular audits from federal and provincial tax authorities relating to income, capital andcommodity taxes and as a result of these audits, may receive assessments and reassessments. Although such matters cannot be predictedwith certainty, management currently considers the Company’s exposure to such claims and litigation, to the extent not covered bythe Company’s insurance policies or otherwise provided for, not to be material to these consolidated financial statements.
There are various operating leases that have been committed to. Future minimum lease payments relating to these operating leases are as follows:
Payments due by year
Thereafter to 2006 20052007 2008 2009 2010 2011 2049 Total Total
Operating lease payments $ 225 $ 205 $ 176 $ 151 $ 128 $ 758 $ 1,643 $ 1,801Expected sub-lease
income (44) (38) (34) (28) (21) (87) (252) (270)
Net operating lease payments $ 181 $ 167 $ 142 $ 123 $ 107 $ 671 $ 1,391 $ 1,531
At year end, the Company has committed approximately $161 (2005 – $308) with respect to capital investment projects such as the construction, expansion and renovation of buildings and the purchase of real property.
The Company establishes standby letters of credit used in connection with certain obligations mainly related to real estate transactions and benefit programs. The aggregate gross potential liability related to these standby letters of credit is approximately $440 (2005 – $414). Other standby letters of credit related to the financing program for Loblaw’s independent franchisees andsecuritization of PC Bank’s credit card receivables have been identified as guarantees and are discussed further in the Guaranteessection below.
GuaranteesThe Company has provided to third parties the following significant guarantees as defined pursuant to Accounting Guideline 14,“Disclosure of Guarantees”:
Standby Letters of CreditA standby letter of credit for the benefit of an independent trust with respect to the credit card receivables securitization program of PC Bank has been issued by a major Canadian chartered bank. This standby letter of credit could be drawn upon in the event of a majordecline in the income flow from or in the value of the securitized credit card receivables. Loblaw has agreed to reimburse the issuingbank for any amount drawn on the standby letter of credit. Loblaw believes that the likelihood of this occurrence is remote. The aggregategross potential liability under this arrangement, which represents 9% (2005 – 9%) on a portion of the securitized credit card receivablesamount, is approximately $68 (2005 – $91) (see note 13).
A standby letter of credit has been issued by a major Canadian chartered bank in the amount of $44 (2005 – $42) for the benefit of anindependent funding trust which provides loans to Loblaw’s franchisees for their purchase of inventory and fixed assets, mainly fixturingand equipment. The amount of the standby letter of credit is equal to approximately 10% of the principal amount of the loans outstandingat any point in time. In the event that an independent franchisee defaults on its loan and Loblaw has not, within a specified time period,assumed the loan or the default is not otherwise remedied, the independent funding trust may assign the loan to Loblaw and draw uponthis standby letter of credit. Loblaw has agreed to reimburse the issuing bank for any amount drawn on the standby letter of credit.
George Weston Limited 2006 Financial Report 93
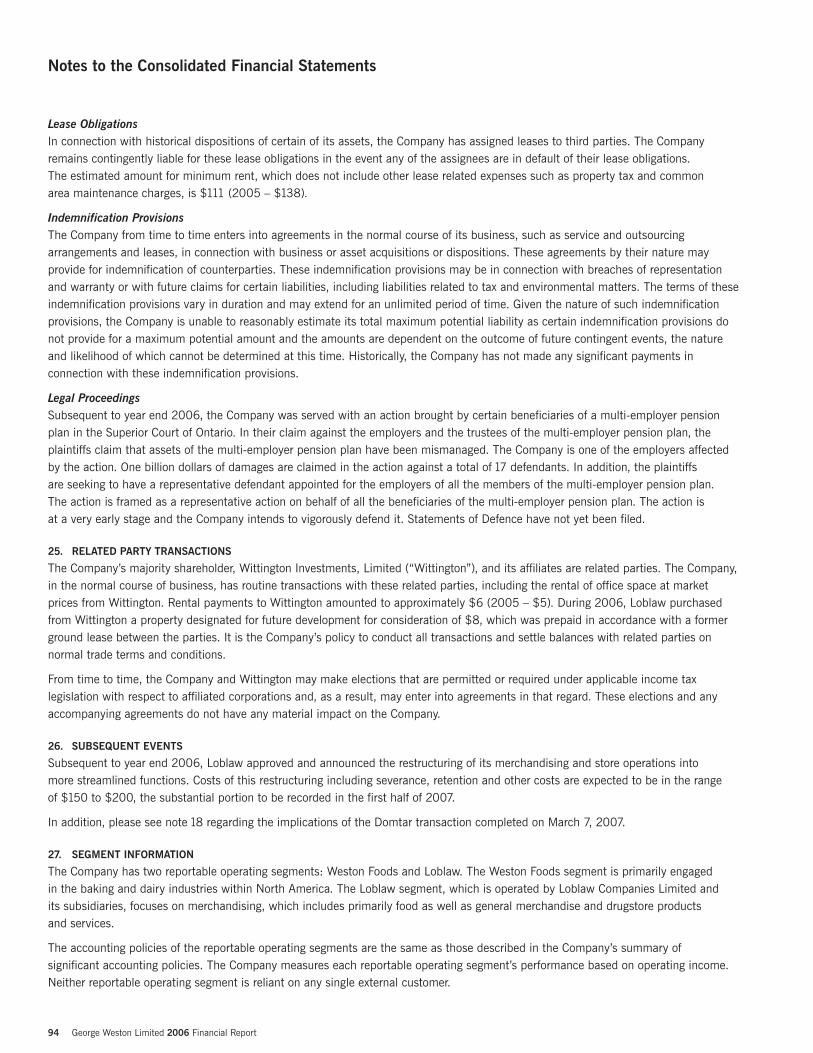
94 George Weston Limited 2006 Financial Report
Notes to the Consolidated Financial Statements
Lease ObligationsIn connection with historical dispositions of certain of its assets, the Company has assigned leases to third parties. The Companyremains contingently liable for these lease obligations in the event any of the assignees are in default of their lease obligations. The estimated amount for minimum rent, which does not include other lease related expenses such as property tax and common area maintenance charges, is $111 (2005 – $138).
Indemnification ProvisionsThe Company from time to time enters into agreements in the normal course of its business, such as service and outsourcingarrangements and leases, in connection with business or asset acquisitions or dispositions. These agreements by their nature mayprovide for indemnification of counterparties. These indemnification provisions may be in connection with breaches of representationand warranty or with future claims for certain liabilities, including liabilities related to tax and environmental matters. The terms of theseindemnification provisions vary in duration and may extend for an unlimited period of time. Given the nature of such indemnificationprovisions, the Company is unable to reasonably estimate its total maximum potential liability as certain indemnification provisions donot provide for a maximum potential amount and the amounts are dependent on the outcome of future contingent events, the natureand likelihood of which cannot be determined at this time. Historically, the Company has not made any significant payments inconnection with these indemnification provisions.
Legal ProceedingsSubsequent to year end 2006, the Company was served with an action brought by certain beneficiaries of a multi-employer pensionplan in the Superior Court of Ontario. In their claim against the employers and the trustees of the multi-employer pension plan, theplaintiffs claim that assets of the multi-employer pension plan have been mismanaged. The Company is one of the employers affectedby the action. One billion dollars of damages are claimed in the action against a total of 17 defendants. In addition, the plaintiffs are seeking to have a representative defendant appointed for the employers of all the members of the multi-employer pension plan. The action is framed as a representative action on behalf of all the beneficiaries of the multi-employer pension plan. The action is at a very early stage and the Company intends to vigorously defend it. Statements of Defence have not yet been filed.
25. RELATED PARTY TRANSACTIONS
The Company’s majority shareholder, Wittington Investments, Limited (“Wittington”), and its affiliates are related parties. The Company,in the normal course of business, has routine transactions with these related parties, including the rental of office space at market prices from Wittington. Rental payments to Wittington amounted to approximately $6 (2005 – $5). During 2006, Loblaw purchased from Wittington a property designated for future development for consideration of $8, which was prepaid in accordance with a formerground lease between the parties. It is the Company’s policy to conduct all transactions and settle balances with related parties onnormal trade terms and conditions.
From time to time, the Company and Wittington may make elections that are permitted or required under applicable income taxlegislation with respect to affiliated corporations and, as a result, may enter into agreements in that regard. These elections and anyaccompanying agreements do not have any material impact on the Company.
26. SUBSEQUENT EVENTS
Subsequent to year end 2006, Loblaw approved and announced the restructuring of its merchandising and store operations into more streamlined functions. Costs of this restructuring including severance, retention and other costs are expected to be in the range of $150 to $200, the substantial portion to be recorded in the first half of 2007.
In addition, please see note 18 regarding the implications of the Domtar transaction completed on March 7, 2007.
27. SEGMENT INFORMATION
The Company has two reportable operating segments: Weston Foods and Loblaw. The Weston Foods segment is primarily engaged in the baking and dairy industries within North America. The Loblaw segment, which is operated by Loblaw Companies Limited and its subsidiaries, focuses on merchandising, which includes primarily food as well as general merchandise and drugstore products and services.
The accounting policies of the reportable operating segments are the same as those described in the Company’s summary of significant accounting policies. The Company measures each reportable operating segment’s performance based on operating income.Neither reportable operating segment is reliant on any single external customer.
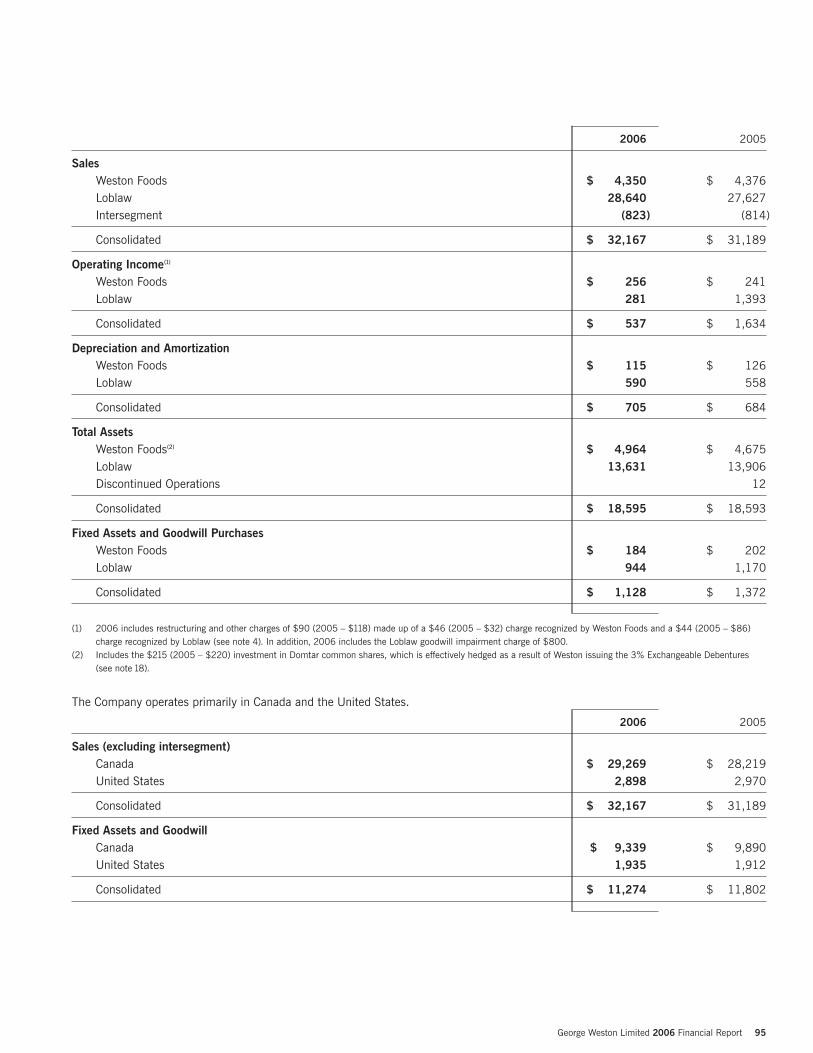
2006 2005
SalesWeston Foods $ 4,350 $ 4,376Loblaw 28,640 27,627Intersegment (823) (814)
Consolidated $ 32,167 $ 31,189
Operating Income(1)
Weston Foods $ 256 $ 241Loblaw 281 1,393
Consolidated $ 537 $ 1,634
Depreciation and AmortizationWeston Foods $ 115 $ 126Loblaw 590 558
Consolidated $ 705 $ 684
Total AssetsWeston Foods(2) $ 4,964 $ 4,675Loblaw 13,631 13,906Discontinued Operations 12
Consolidated $ 18,595 $ 18,593
Fixed Assets and Goodwill PurchasesWeston Foods $ 184 $ 202Loblaw 944 1,170
Consolidated $ 1,128 $ 1,372
(1) 2006 includes restructuring and other charges of $90 (2005 – $118) made up of a $46 (2005 – $32) charge recognized by Weston Foods and a $44 (2005 – $86)charge recognized by Loblaw (see note 4). In addition, 2006 includes the Loblaw goodwill impairment charge of $800.
(2) Includes the $215 (2005 – $220) investment in Domtar common shares, which is effectively hedged as a result of Weston issuing the 3% Exchangeable Debentures (see note 18).
The Company operates primarily in Canada and the United States.
2006 2005
Sales (excluding intersegment)Canada $ 29,269 $ 28,219United States 2,898 2,970
Consolidated $ 32,167 $ 31,189
Fixed Assets and GoodwillCanada $ 9,339 $ 9,890United States 1,935 1,912
Consolidated $ 11,274 $ 11,802
George Weston Limited 2006 Financial Report 95
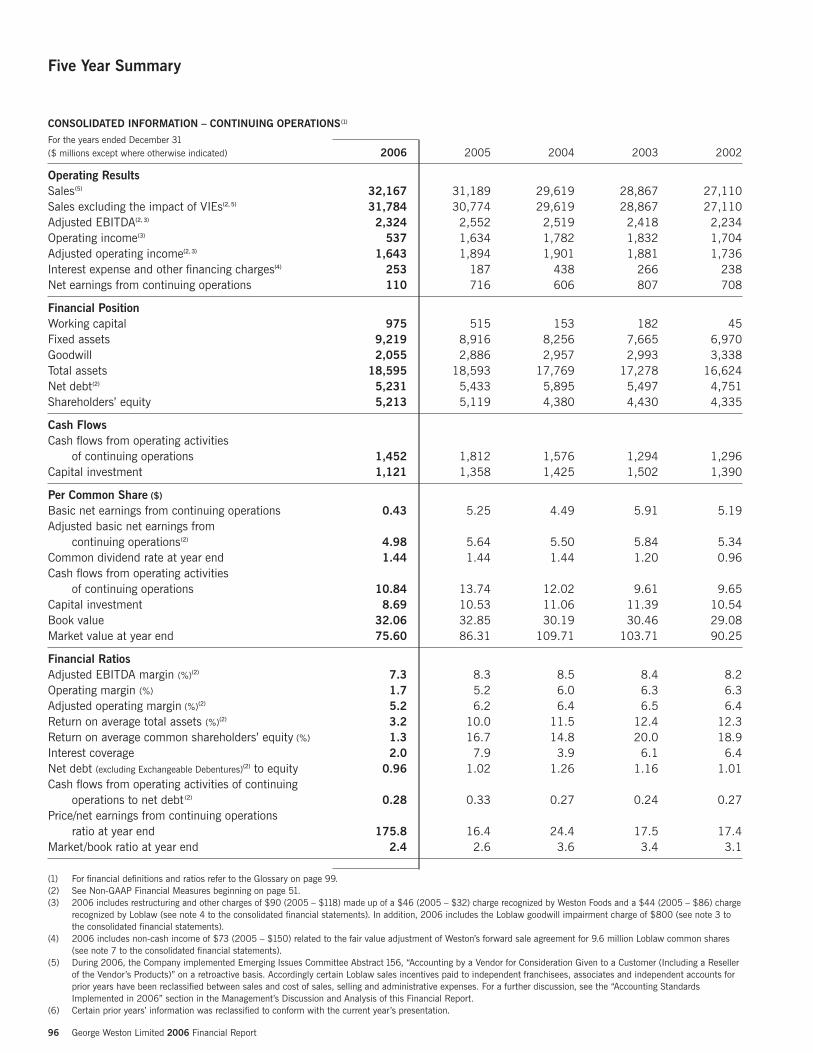
96 George Weston Limited 2006 Financial Report
Five Year Summary
CONSOLIDATED INFORMATION – CONTINUING OPERATIONS (1)
For the years ended December 31($ millions except where otherwise indicated) 2006 2005 2004 2003 2002
Operating ResultsSales(5) 32,167 31,189 29,619 28,867 27,110Sales excluding the impact of VIEs(2, 5) 31,784 30,774 29,619 28,867 27,110Adjusted EBITDA(2, 3) 2,324 2,552 2,519 2,418 2,234Operating income(3) 537 1,634 1,782 1,832 1,704Adjusted operating income(2, 3) 1,643 1,894 1,901 1,881 1,736Interest expense and other financing charges(4) 253 187 438 266 238Net earnings from continuing operations 110 716 606 807 708
Financial PositionWorking capital 975 515 153 182 45Fixed assets 9,219 8,916 8,256 7,665 6,970Goodwill 2,055 2,886 2,957 2,993 3,338Total assets 18,595 18,593 17,769 17,278 16,624Net debt(2) 5,231 5,433 5,895 5,497 4,751Shareholders’ equity 5,213 5,119 4,380 4,430 4,335
Cash FlowsCash flows from operating activities
of continuing operations 1,452 1,812 1,576 1,294 1,296Capital investment 1,121 1,358 1,425 1,502 1,390
Per Common Share ($)
Basic net earnings from continuing operations 0.43 5.25 4.49 5.91 5.19Adjusted basic net earnings from
continuing operations(2) 4.98 5.64 5.50 5.84 5.34Common dividend rate at year end 1.44 1.44 1.44 1.20 0.96Cash flows from operating activities
of continuing operations 10.84 13.74 12.02 9.61 9.65Capital investment 8.69 10.53 11.06 11.39 10.54Book value 32.06 32.85 30.19 30.46 29.08Market value at year end 75.60 86.31 109.71 103.71 90.25
Financial RatiosAdjusted EBITDA margin (%)(2) 7.3 8.3 8.5 8.4 8.2Operating margin (%) 1.7 5.2 6.0 6.3 6.3Adjusted operating margin (%)(2) 5.2 6.2 6.4 6.5 6.4Return on average total assets (%)(2) 3.2 10.0 11.5 12.4 12.3Return on average common shareholders’ equity (%) 1.3 16.7 14.8 20.0 18.9Interest coverage 2.0 7.9 3.9 6.1 6.4Net debt (excluding Exchangeable Debentures)(2) to equity 0.96 1.02 1.26 1.16 1.01Cash flows from operating activities of continuing
operations to net debt (2) 0.28 0.33 0.27 0.24 0.27Price/net earnings from continuing operations
ratio at year end 175.8 16.4 24.4 17.5 17.4Market/book ratio at year end 2.4 2.6 3.6 3.4 3.1
(1) For financial definitions and ratios refer to the Glossary on page 99.(2) See Non-GAAP Financial Measures beginning on page 51.(3) 2006 includes restructuring and other charges of $90 (2005 – $118) made up of a $46 (2005 – $32) charge recognized by Weston Foods and a $44 (2005 – $86) charge
recognized by Loblaw (see note 4 to the consolidated financial statements). In addition, 2006 includes the Loblaw goodwill impairment charge of $800 (see note 3 tothe consolidated financial statements).
(4) 2006 includes non-cash income of $73 (2005 – $150) related to the fair value adjustment of Weston’s forward sale agreement for 9.6 million Loblaw common shares(see note 7 to the consolidated financial statements).
(5) During 2006, the Company implemented Emerging Issues Committee Abstract 156, “Accounting by a Vendor for Consideration Given to a Customer (Including a Resellerof the Vendor’s Products)” on a retroactive basis. Accordingly certain Loblaw sales incentives paid to independent franchisees, associates and independent accounts forprior years have been reclassified between sales and cost of sales, selling and administrative expenses. For a further discussion, see the “Accounting StandardsImplemented in 2006” section in the Management’s Discussion and Analysis of this Financial Report.
(6) Certain prior years’ information was reclassified to conform with the current year’s presentation.
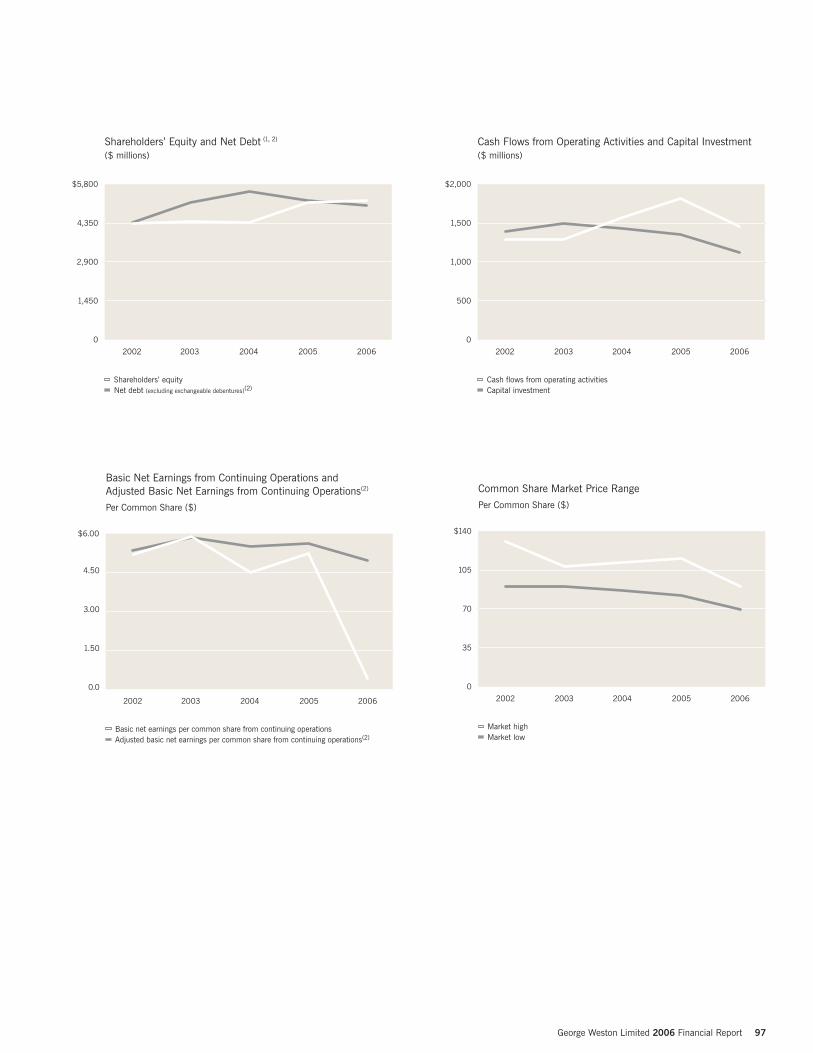
George Weston Limited 2006 Financial Report 97
20062005200420032002
Cash flows from operating activitiesCapital investment
Cash Flows from Operating Activities and Capital Investment($ millions)
0
500
1,000
1,500
$2,000
20062005200420032002
Shareholders’ equityNet debt (excluding exchangeable debentures)(2)
Shareholders’ Equity and Net Debt (1, 2) ($ millions)
0
1,450
2,900
4,350
$5,800
0
35
70
105
$140
20062005200420032002
Common Share Market Price Range
Per Common Share ($)
Market highMarket low
Basic Net Earnings from Continuing Operations andAdjusted Basic Net Earnings from Continuing Operations(2)
Per Common Share ($)
20062005200420032002
Basic net earnings per common share from continuing operationsAdjusted basic net earnings per common share from continuing operations(2)
0.0
1.50
3.00
4.50
$6.00
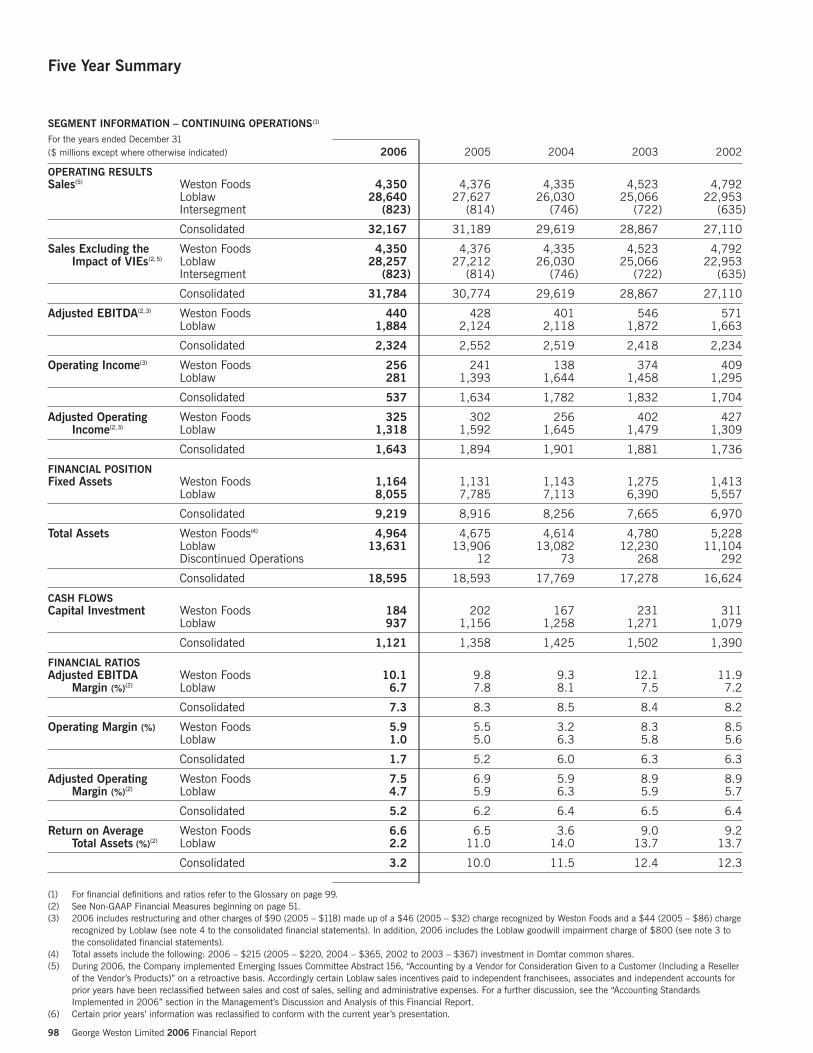
98 George Weston Limited 2006 Financial Report
SEGMENT INFORMATION – CONTINUING OPERATIONS (1)
For the years ended December 31($ millions except where otherwise indicated) 2006 2005 2004 2003 2002
OPERATING RESULTSSales(5) Weston Foods 4,350 4,376 4,335 4,523 4,792
Loblaw 28,640 27,627 26,030 25,066 22,953Intersegment (823) (814) (746) (722) (635)
Consolidated 32,167 31,189 29,619 28,867 27,110
Sales Excluding the Weston Foods 4,350 4,376 4,335 4,523 4,792Impact of VIEs(2,5) Loblaw 28,257 27,212 26,030 25,066 22,953
Intersegment (823) (814) (746) (722) (635)
Consolidated 31,784 30,774 29,619 28,867 27,110
Adjusted EBITDA(2,3) Weston Foods 440 428 401 546 571Loblaw 1,884 2,124 2,118 1,872 1,663
Consolidated 2,324 2,552 2,519 2,418 2,234
Operating Income(3) Weston Foods 256 241 138 374 409Loblaw 281 1,393 1,644 1,458 1,295
Consolidated 537 1,634 1,782 1,832 1,704
Adjusted Operating Weston Foods 325 302 256 402 427Income(2,3) Loblaw 1,318 1,592 1,645 1,479 1,309
Consolidated 1,643 1,894 1,901 1,881 1,736
FINANCIAL POSITIONFixed Assets Weston Foods 1,164 1,131 1,143 1,275 1,413
Loblaw 8,055 7,785 7,113 6,390 5,557
Consolidated 9,219 8,916 8,256 7,665 6,970
Total Assets Weston Foods(4) 4,964 4,675 4,614 4,780 5,228Loblaw 13,631 13,906 13,082 12,230 11,104Discontinued Operations 12 73 268 292
Consolidated 18,595 18,593 17,769 17,278 16,624
CASH FLOWSCapital Investment Weston Foods 184 202 167 231 311
Loblaw 937 1,156 1,258 1,271 1,079
Consolidated 1,121 1,358 1,425 1,502 1,390
FINANCIAL RATIOSAdjusted EBITDA Weston Foods 10.1 9.8 9.3 12.1 11.9
Margin (%)(2) Loblaw 6.7 7.8 8.1 7.5 7.2
Consolidated 7.3 8.3 8.5 8.4 8.2
Operating Margin (%) Weston Foods 5.9 5.5 3.2 8.3 8.5Loblaw 1.0 5.0 6.3 5.8 5.6
Consolidated 1.7 5.2 6.0 6.3 6.3
Adjusted Operating Weston Foods 7.5 6.9 5.9 8.9 8.9Margin (%)(2) Loblaw 4.7 5.9 6.3 5.9 5.7
Consolidated 5.2 6.2 6.4 6.5 6.4
Return on Average Weston Foods 6.6 6.5 3.6 9.0 9.2Total Assets (%)(2) Loblaw 2.2 11.0 14.0 13.7 13.7
Consolidated 3.2 10.0 11.5 12.4 12.3
(1) For financial definitions and ratios refer to the Glossary on page 99.(2) See Non-GAAP Financial Measures beginning on page 51.(3) 2006 includes restructuring and other charges of $90 (2005 – $118) made up of a $46 (2005 – $32) charge recognized by Weston Foods and a $44 (2005 – $86) charge
recognized by Loblaw (see note 4 to the consolidated financial statements). In addition, 2006 includes the Loblaw goodwill impairment charge of $800 (see note 3 tothe consolidated financial statements).
(4) Total assets include the following: 2006 – $215 (2005 – $220, 2004 – $365, 2002 to 2003 – $367) investment in Domtar common shares.(5) During 2006, the Company implemented Emerging Issues Committee Abstract 156, “Accounting by a Vendor for Consideration Given to a Customer (Including a Reseller
of the Vendor’s Products)” on a retroactive basis. Accordingly certain Loblaw sales incentives paid to independent franchisees, associates and independent accounts forprior years have been reclassified between sales and cost of sales, selling and administrative expenses. For a further discussion, see the “Accounting StandardsImplemented in 2006” section in the Management’s Discussion and Analysis of this Financial Report.
(6) Certain prior years’ information was reclassified to conform with the current year’s presentation.
Five Year Summary
Glossary
George Weston Limited 2006 Financial Report 99
Adjusted basic net earnings per common share from continuing operationsBasic net earnings per common share from continuing operations adjusted foritems that affect the comparability of the financial results and are not a result ofongoing operations (see Non-GAAP Financial Measures beginning on page 51).
Adjusted EBITDA Adjusted operating income before depreciation and amortization (see Non-GAAPFinancial Measures beginning on page 51).
Adjusted EBITDA margin Adjusted EBITDA divided by sales excluding the impact of VIEs (see Non-GAAPFinancial Measures beginning on page 51).
Adjusted net earnings from continuing operationsNet earnings from continuing operations adjusted for items that affect thecomparability of the financial results and are not a result of ongoing operations.
Adjusted operating income Operating income adjusted for items that affect the comparability of the financialresults and are not a result of ongoing operations (see Non-GAAP FinancialMeasures beginning on page 51).
Adjusted operating income margin Adjusted operating income divided by sales excluding the impact of VIEs (see Non-GAAP Financial Measures beginning on page 51).
Annual ReportFor 2006, the Annual Report consists of the Annual Summary and the Financial Report.
Basic net earnings per common share from continuing operations Net earnings from continuing operations available to common shareholders dividedby the weighted average number of common shares outstanding during the year.
Book value per common share Common shareholders’ equity divided by the number of common sharesoutstanding at year end.
Capital investment Fixed asset purchases.
Capital investment per common share Capital investment divided by the weighted average number of common shares outstanding during the year.
Cash flows from operating activities of continuing operations per common shareCash flows from operating activities of continuing operations less preferreddividends paid divided by the weighted average number of common sharesoutstanding during the year.
Cash flows from operating activities of continuing operations to net debt Cash flows from operating activities of continuing operations divided by net debt(see Non-GAAP Financial Measures beginning on page 51).
Common shareholders’ equity Total shareholders’ equity less preferred shares outstanding.
Control label A brand and associated trademark that is owned by Loblaw for use in connectionwith its own products and services.
Conversion A store that changes from one Loblaw banner to another Loblaw banner.
Corporate stores sales per average square foot Sales by corporate stores divided by the average corporate stores’ square footageat year end.
Diluted net earnings per common share from continuing operations Net earnings from continuing operations available to common shareholders dividedby the weighted average number of common shares outstanding during the periodminus the dilutive impact of outstanding stock option grants at period end.
Dividend rate per common share at year endDividend per common share declared in the fourth quarter multiplied by four.
Free cash flowCash flows from operating activities of continuing operations less fixed assetpurchases and dividends.
Gross margin Sales less cost of sales and inventory shrinkage divided by sales.
Interest coverage Operating income divided by interest expense adding back interest capitalized to fixed assets.
Major expansion Expansion of a store that results in an increase in square footage that is greaterthan 25% of the square footage of the store prior to the expansion.
Market/book ratio at year end Market price per common share at year end divided by book value per commonshare at year end.
Minor expansion Expansion of a store that results in an increase in square footage that is less thanor equal to 25% of the square footage of the store prior to the expansion.
Net debtBank indebtedness, commercial paper, short term bank loans, long term debt duewithin one year and long term debt less cash, cash equivalents and short terminvestments (see Non-GAAP Financial Measures beginning on page 51).
Net debt (excluding Exchangeable Debentures) to equityNet debt excluding Exchangeable Debentures divided by total shareholders’ equity(see Non-GAAP Financial Measures beginning on page 51).
Net debt to equity Net debt divided by total shareholders’ equity.
New store A newly constructed store, conversion or major expansion.
Operating incomeNet earnings from continuing operations before minority interest, interest expenseand other financing charges and income taxes.
Operating margin Operating income divided by sales.
Price/earnings from continuing operations ratio at year end Market price per common share at year end divided by basic net earnings percommon share from continuing operations for the year.
Renovation A capital investment in a store resulting in no change to the store square footage.
Retail sales Combined sales of stores owned by Loblaw and those owned by Loblaw’sindependent franchisees.
Retail square footageRetail square footage includes corporate and independent franchised stores.
Return on average common shareholders’ equity Net earnings from continuing operations available to common shareholders dividedby average total common shareholders’ equity.
Return on average total assetsOperating income divided by average total assets excluding cash, cash equivalents,short term investments and assets held for sale (see Non-GAAP FinancialMeasures beginning on page 51).
Sales excluding the impact of VIEs Total sales less sales attributable to the consolidation of VIEs pursuant to AcG 15(see Non-GAAP Financial Measures beginning on page 51 and note 2 to theconsolidated financial statements).
Same-store sales Retail sales from the same physical location for stores in operation in that locationin both periods being compared but excluding sales from a store that has undergonea conversion or major expansion in the period.
Variable interest entity (“VIE”)An entity that either does not have sufficient equity at risk to finance its activitieswithout subordinated financial support or where the holders of the equity at risklack the characteristics of a controlling financial interest (see note 2 to theconsolidated financial statements).
Weighted average common shares outstandingThe number of common shares outstanding determined by relating the portion of timewithin the year the common shares were outstanding to the total time in that year.
Working capitalTotal current assets excluding current assets of operations held for sale, less totalcurrent liabilities excluding current liabilities of operations held for sale.
Year The Company’s year end is December 31. Sales and related activities are reportedon a fiscal year ending on the Saturday closest to December 31, usually 52 weeksin duration, but includes 53 weeks every 5 to 6 years.
100 George Weston Limited 2006 Financial Report
Shareholder and Corporate Information
Executive OfficeGeorge Weston Limited22 St. Clair Avenue EastToronto, Canada M4T 2S7Tel: 416.922.2500Fax: 416.922.4395www.weston.ca
Stock Exchange Listing and SymbolsThe Company’s common and preferred shares are listed on the Toronto StockExchange and trade under the symbols: “WN”, “WN.PR.A”, “WN.PR.B”, “WN.PR.C”,“WN.PR.D” and “WN.PR.E”.
Common SharesAt year end 2006, there were 129,074,526 common shares outstanding, 1,018 registered common shareholders and 48,371,678 common shares availablefor public trading.
The average 2006 daily trading volume of the Company’s common shares was 107,421.
Preferred SharesAt year end 2006, there were 9,400,000 preferred shares Series I, 10,600,000preferred shares Series II, 8,000,000 preferred shares Series III, 8,000,000preferred shares Series IV and 8,000,000 preferred shares Series V outstanding and 58 registered preferred shareholders. All outstanding preferred shares wereavailable for public trading.
The average 2006 daily trading volume of the Company’s preferred shares was:
Series I: 5,331Series II: 5,473Series III: 8,813Series IV: 5,968Series V: 23,386
Common Dividend PolicyIt is the Company’s policy to maintain a dividend payment equal to approximately20% to 25% of the prior year’s adjusted basic net earnings per common share fromcontinuing operations(1).
Common Dividend DatesThe declaration and payment of quarterly common dividends are made subject to approval by the Board of Directors. The anticipated record and payment dates for 2007 are:
Record Date Payment DateMarch 15 April 1June 15 July 1Sept. 15 Oct. 1Dec. 15 Jan. 1
Normal Course Issuer BidThe Company has a Normal Course Issuer Bid on the Toronto Stock Exchange.
Value of Common SharesFor capital gains purposes, the valuation day (December 22, 1971) cost base for the Company, adjusted for the 4 for 1 stock split (effective May 27, 1986) and the 3 for 1 stock split (effective May 8, 1998), is $1.50 per share. The value on February 22, 1994 was $13.17 per share.
Registrar and Transfer AgentComputershare Investor Services Inc.100 University AvenueToronto, Canada M5J 2Y1Tel: 416.263.9200Toll Free Tel: 1.800.663.9097Fax: 416.263.9394Toll Free Fax: 1.888.453.0330
To change your address or eliminate multiple mailings, or for other shareholderaccount inquiries, please contact Computershare Investor Services Inc.
Independent AuditorsKPMG LLP
Chartered AccountantsToronto, Canada
Annual MeetingThe George Weston Limited Annual and Special Meeting of Shareholders will beheld on Wednesday, May 16, 2007 at 11:00 a.m. at the Harbour Castle ConventionCentre, Frontenac Ballroom, Toronto, Canada.
TrademarksGeorge Weston Limited and its subsidiaries own a number of trademarks. Thesetrademarks are the exclusive property of George Weston Limited and its subsidiarycompanies. Trademarks where used in this report are in italics.
Investor RelationsShareholders, security analysts and investment professionals should direct their requests to Mr. Geoffrey H. Wilson, Senior Vice President, Financial Servicesand Investor Relations at the Company’s Executive Office or by e-mail [email protected].
Additional financial information has been filed electronically with various securitiesregulators in Canada through the System for Electronic Document Analysis andRetrieval (SEDAR). The Company holds an analyst call shortly following the releaseof its quarterly results. These calls are archived in the Investor Zone section of theCompany’s website.
This Annual Report includes selected information on Loblaw Companies Limited, a 62%-owned public reporting subsidiary company with shares trading on theToronto Stock Exchange.
Ce rapport est disponible en français.
This Financial Report was printed in Canada on Husky Offset, manufacturedelemental chlorine-free, at a mill independently certified as meeting theprocurement provisions of the Sustainable Forestry Initiative® (SFI) standard.
(1) See Non-GAAP Financial Measures beginning on page 51.

www.weston.ca