wettability studies for porous solids including powders ... · in particular, the recent...
TRANSCRIPT

KRÜSS GmbH | Borsteler Chaussee 85 | 22453 Hamburg | Germany | www.kruss.de 1 | 14
Technical Note
Washburn measurements on porous solids
Technical note: TN302e
Industry section: Paper, textile, chemical, pharma,
composites, print
Author: CR
Date: 01/1996
Method:
Force Tensiometer – K12
Keywords: Washburn method, powder, wettability, fibers, nonwoven, membranes, Zisman plot, pigment
Wettability studies for porous solids including powders and fibrous materials
Scope
This technical note is intended to be an introduction for those who are interested in studying the wetting properties of porous
solids including powders and fibrous materials. The note begins with a discussion of why the study of wetting is more
complicated for porous solids than it is for non-porous solids. The Washburn theory is then introduced as a framework for
studying the wetting of porous solids, and its mathematical detail is explained. Having established a theoretical (and
mathematical) framework, the note then proceeds to discuss experimental aspects. The Krüss Force Tensiometer K12 is
introduced as an instrument for automated wetting studies, and the accessories that are available for the Force Tensiometer to
facilitate porous solid studies are discussed. In particular, the recent development of a new powder and fibrous material
sample holder (the FL12) is highlighted. This information makes up the first two sections of this note.
Having discussed both the theoretical and the experimental
aspects of porous solid wetting studies, the note proceeds
to highlight six sets of wettability studies we have
performed recently. Each of these sets is termed a "sample
experiment" and was chosen to illustrate a certain aspect of
wetting studies. Sample experiment #1 deals with the
wettability of woven polyester fabric used in the
composites industry. However, the discussion
accompanying sample experiment #1 also deals with the
possibility of misinterpreting wettability data if data
analysis is done carelessly. Likewise, sample experiment #2
describes how to determine wetting of a porous paper. It
also deals with the concept that solids have a characteristic
"surface energy", and goes on to explain how that quantity
can be defined and used. Sample experiment #3 deals with
wetting a high density polyethylene membrane which has a
very low surface energy. It discusses the complications of
characterizing low surface energy materials. Sample
experiments #4 and #5 deal with the wetting of two widely
used powders – the pigment titanium dioxide and the
excipient microcrystalline cellulose. However, the
discussions of these experiments also deal with two very
practical aspects of wettability experimentation – error
analysis and the selection of proper test liquids. Sample
experiment #6 shows that wetting of fibrous materials can
be studied as reproducibly as the wetting of other porous
materials, if experiments are properly designed. It focuses
on some very common fibrous materials.
Introduction
The wetting of non-porous solid surfaces by liquids is
commonly quantified by contact angle measurements. The
contact angle between a liquid and a solid is the angle

KRÜSS GmbH | Borsteler Chaussee 85 | 22453 Hamburg | Germany | www.kruss.de 2 | 14
naturally formed when the liquid is placed on the solid
surface. This is depicted in figure 1.
Fig. 1: contact angle on non-porous solid
Krüss offers several automated instruments which measure
contact angles on non-porous solids. These instruments are
fundamentally based on two techniques – the Wilhelmy (or
force) method and the goniometer (or sight) method.
Technical note #303 in this series compares and contrasts
these two techniques and explains the difference between
"advancing" (or wetting) contact angles and "receding" (or
dewetting) contact angles. It is recommending reading for
those who are interested in the wetting of non-porous
solids.
The focus of this technical note, however, is the wettability
of porous solids. If one wishes to study the wetting of
porous solids such as woven textiles, prepreg composite
fibers, The focus of this technical note, however, is the
wettability of porous solids. If one wishes paper products,
fibrous materials like cotton, or even powders like
pigments, pharmaceuticals, and granulated metals, the
more traditional types of contact angle measurement are
largely inadequate. The contact angle of a liquid on a
porous solid cannot be accurately obtained by optical
inspection (the goniometer method), because the liquid will
be penetrating into the pores of the solid as one is
attempting to measure contact angle. This is true if the
contact angle is less than 90° (the critical angle for
spontaneous capillary or pore wetting). Likewise, attempts
to apply the Wilhelmy method to the wetting of porous
materials, including powders, are limited to the study of
contact angles greater than 90°. Since the Wilhelmy
method is based on measuring the force of contact
between a wetting liquid and the surface of a solid, any
penetration of liquid into the pores of the solid during a
Wilhelmy experiment causes an error in force which is
difficult, at best, and impossible at worst, to correct for.
There is one notable exception to this rule. It is sometimes
possible to use a goniometer as a dynamic instrument on
porous solid/liquid combinations where the contact angle
is less than 90°. By taking several contact angle
measurements as a function of time, the rate of penetration
of a liquid droplet into a porous solid may be studied. This
is commonly done with coated paper products. A liquid
droplet placed on the surface of a coated paper forms a
contact angle which is fairly constant over some finite
period of time (while the liquid is only penetrating into the
surface coating). Following this time period, which may be
as short as 0.01 to 0.1 seconds and as long as a few
minutes, is a period during which the liquid rapidly
penetrates the bulk of the paper.
There are also some situations in which it is necessary to
determine contact angles of greater than 90° for liquids on
porous solids. In these situations the goniometer method
and the Wilhelmy method can be used. For powders, the
Wilhelmy method can be used by adhering the powder to
a glass microscope cover slip and running a standard
dynamic contact angle experiment. The Krüss Force
Tensiometer K12 is the instrument of choice for this type of
measurement. Alternatively, the powder might be
compressed into a "block" on which droplets could be
placed for goniometer based testing. Any of a number of
Krüss goniometers may be used for this type of study.
However, such situations are fairly specialized. Most people
interested in wetting porous solids are working with liquids
which do spontaneously penetrate into the solids (that is,
have contact angles which are less than 90° on the solid).
Note that the word "spontaneous", as used in this text,
refers to thermodynamic and not kinetic spontaneity. In
this case, "spontaneous" only means that no energy input
is required to make the liquid penetrate the solid. Time,
however, may be required. Suppose you take a porous
solid and place it in a beaker of test liquid for some period
of time. If it is evident that the liquid penetrates the solid
(or simply saturates the solid, when the solid is a loose
powder) during that period, then the contact angle for that
liquid/solid combination is less than 90°. This is true
whether the period of time you need to leave the solid in
the breaker, to observe substantial penetration or
saturation, is 1 second, 1 minute, 1 hour, or 1 day.
Since most studies of wetting for porous solids fall into this
category, the objectives of porous solid wettability studies
commonly involve understanding wetting kinetics, and
quantifying the completeness of the wetting process.
Investigators are usually trying to answer one or more of
the following questions:
How can I alter the nature of my wetting liquid (in terms
of solute concentrations, types of solutes present, and
so on) to provide for more complete and/or quicker
wetting of my porous solid or powder?
How can I alter the surface properties of my porous
solid to provide for more complete and/or quicker
wetting by a particular liquid?
How is the wettability of my solid affected by various
chemical and/or physical treatments which must be
done to the solid for reasons other than surface
modification?
How hydrophobic and/or hydrophilic is the surface of
my solid?
What is the surface energy of my solid?
How does surface energy relate to wettability?
Are the surface properties of my porous solid product
consistent from lot to lot?
What level of lot to lot variability can be tolerated with
my porous solid and still have it performing consistently
in its application?
What is the effect of liquid viscosity on wetting?
What is the effect of liquid surface tension on wetting?

KRÜSS GmbH | Borsteler Chaussee 85 | 22453 Hamburg | Germany | www.kruss.de 3 | 14
In order to find answers to questions like these, it is
necessary to be able to accurately measure contact angles
in the range of 0° to 90° on porous solids. Contact angles
of greater than 90°, although obtainable by the Wilhelmy
method and/or the goniometer method, are generally of
little interest. If a liquid doesn't wet, it doesn't wet.
For most applications it is not important to quantify how
non-spontaneous the penetration of a non-wetting liquid
into the pores of the solid is. We wish to study wetting
liquids. The method of choice for such studies is the
Washburn method.
The Washburn Method
Washburn theory1 indicates that if a porous solid is brought
into contact with a liquid, such that the solid is not
submerged in the liquid, but rather is just touching the
liquid's surface, then the rise of liquid into the pores of the
solid due to capillary action will be governed by the
following equations:
𝑡 = 𝐴𝑚2 (1)
wherein t = time after the solid and the liquid are brought
into contact, m = mass of liquid sucked into the solid, and
A = a constant which is dependent on the properties of the
liquid and the solid in question.
Specifically,
𝐴 =𝜂
𝑐∗𝜌2∗𝜎∗𝑐𝑜𝑠𝜃 (2)
wherein η = viscosity of the liquid, ρ = density of the liquid,
σ = surface tension of the liquid, θ = contact angle
between the solid and the liquid, and c = a material
constant which is dependent on the porous architecture of
the solid.
Combining equations 1 and 2, followed by rearrangement,
leads to equation 3 which is the useful form of Washburn's
equation.
𝑐𝑜𝑠𝜃 =𝑚2
𝑡∗
𝜂
𝜌2𝜎𝑐 (3)
In setting up a Washburn experiment, a liquid with known
density (ρ), viscosity (η), and surface tension (σ) should be
used. An inspection of equation 3 leads to the conclusion
that if this is the case, and the mass of liquid which rises
into the porous solid can be monitored as a function of
time (such that m2/t is the raw experimental data), then two
unknowns remain: the contact angle of the liquid on the
solid (θ) and the solid material constant (c).
However, if a Washburn experiment is performed with a
liquid which is known to have a contact angle of θ = 0°
(cosθ = 1) on the solid, then the solid material constant (c)
is the only remaining unknown in equation 3 and can thus
be determined. N-hexane is typically a good choice as the
liquid for determining material constants, because of its
low surface tension (18.4 mN/m) at room temperature.
Once the material constant (c) has been determined for a
particular solid, a second sample of the solid can be tested
for wettability by another liquid. The material constant
determined by the n-hexane test is simply used in the
Washburn equation, in combination with m2/t data
obtained during testing with the second liquid. This allows
calculation of the contact angle between the second liquid
and the solid.
Washburn adsorption experiments can be easily and
automatically performed on a variety of porous materials
using a Krüss Force Tensiometer K12 in combination with
Krüss K121 software in the Adsorption mode. The porous
solid is placed in an appropriate sample holder and
suspended from the balance in the Force Tensiometer just
above the surface of a test liquid. See figure 2.
Fig. 2: sample holder
The Force Tensiometer performs the whole experiment
automatically. The liquid is raised until it just touches the
bottom of the porous sample. Mass versus time data is
then collected as liquid penetrates into the solid. The rate
and interval over which this data is collected is user
selectable in the K121 software. At the end of the
experiment data can be output in either graphical or
tabular format. It is also automatically converted to mass2
versus time data from which a slope is taken and used in
the Washburn equation to calculate either the material
constant "c" or a contact angle "θ" depending on the
experiment. If a series of liquids (at least two in addition to
the material constant determining liquid) is tested against
any one solid, then the resultant contact angle data can be
used to calculate surface energy of the porous solid.
Surface energy calculations are also performed
automatically by the software, and will be discussed in
more detail later in this text.
The major advancement that Krüss has made to Washburn
experimentation, aside from automation, involves the
design of sample holders to accommodate testing on
various types of porous solids – most notably powders and
fibrous materials. The design of proper sample holders is of
utmost importance because the Washburn equation
contains two unknowns, (the material constant "c" and the

KRÜSS GmbH | Borsteler Chaussee 85 | 22453 Hamburg | Germany | www.kruss.de 4 | 14
contact angle "θ"). These two variables are both inherently
linked and wholly independent.
The material constant for a porous solid is theoretically
given by:
𝑐 =1
2𝜋2𝑟5𝑛2 (4)
where r = the average capillary radius within the porous
solid, and n = the number of capillaries in the sample. From
this equation it obvious that if I had two pieces of the same
porous material (say pieces of fabric for example), their
material constants would be the same only if they were
exactly the same size (same number of capillaries (n) or
pores in each). In addition, they must be held relative to the
surface of the test liquid in exactly the same configuration.
If they are not, then their material constants will be found
to be different, because, from the point of view of the
penetrating liquid, neither the average capillary radius for
the pores (r) nor the number of capillaries (n) will be exactly
the same.
This, however, will not affect the contact angle that the
liquid forms on the pores of the fabric. In this sense, the
material constant and the contact angle are independent.
In other words, if I test a 2 cm x 2 cm square of woven
fabric and a 1 cm x 2 cm rectangle of the same woven
fabric against the same liquid, I should obtain the same
contact angle from both tests, providing that I know the
material constant for each sample in advance. According to
the material constant definition given above, the material
constant for the 2 cm x 2 cm sample will be about four
times larger than the material constant for the 1 cm x 2 cm
sample, however (This assumes nlarge sample = 2 x nsmall sample).
Why, then, is it necessary to use uniform samples for
multiple Washburn tests on the same solid? It is necessary
because, in determining contact angles, the material
constant must be known. The only way we can know the
material constant of a fresh (untested) sample is to have
determined it beforehand on a sample which was exactly
like the fresh sample in terms of both size and placement.
For fairly rigid porous samples, such as fritted glass sieves
and thick polymeric membranes, producing uniform
samples is a matter of cutting the materials into rectangles
or squares uniformly. To attach such samples to the
balance, Krüss offers a rigid sample holder clip (model
CLMP 10) which neatly holds samples with a thickness of
up to 4 mm and allows a sample to be adjusted easily so
that its bottom edge is parallel to the liquid's surface.
For more flexible porous solids such as papers, thin
membranes, and films, the flexible sample holder (model
FO12) is offered. This holder bends the flexible sample at a
45° angle along its center line perpendicular to its liquid
contact edge. This gives flexible samples some added
physical integrity so that the path of liquid penetration into
the sample is the same from test to test. Of course, flexible
samples must also be uniformly cut prior to a series of
measurements.
Powders and fibrous materials require a specialized sample
holder. These materials pose an additional challenge
because they are not "continuous" porous materials like
papers and membranes. We cannot simply cut out a
rectangle of powder and clamp it to the balance. We must
establish some way to pack the powder into a plug and
then hold that plug together while it is being wet by the
test liquid. The plug of powder should be packed tight
enough that it does not "cake" and establish voids during
the wetting process. The packing process must also be
repeatable, so that the same material constant can be
obtained for each successive test. In addition, the holder for
the powder plug, which, in any scenario, will have to come
into contact with the test liquid, must allow for the powder
to be wet without impeding the wetting process. It would
also be favorable for the holder to be relatively easy to
clean (free of wet powder) at the end of each experiment.
The same requirements are extended to any holder
designed for fibrous materials.
Krüss has done a fair amount research on powder and
fibrous material holders. Many of our current customers
may be using our model PU12, which is a small glass
cylinder with a fritted glass filter at one end and a means of
attachment to the K12 balance at the other. With the PU12,
a known quantity of powder (usually about 1 gram) is
packed into the cylinder against the fritted glass filter.
When liquid is brought into contact with the glass frit at the
bottom of the cell, the liquid rises through the frit and then
through the powder bed. Since glass has a high surface
energy, the glass frit generally does not impede liquid
adsorption into the powder plug (unless of course the frit
becomes plugged and is not cleaned properly).
The PU12 design works quite well in a number of situations
for determining contact angles on powders. However, we
have realized that it does have its drawbacks. Namely, the
glass frit at the bottom of the tube is difficult to clean, the
whole apparatus is fragile, and it can be difficult to pack the
powder into the cylinder in a highly reproducible fashion.
This last problem makes it difficult to obtain a reproducible
"c" factor, or material constant, for multiple experiments on
the same powder. A single user, with practice, can develop
his own highly reproducible powder packing method for
the PU12. However, any two users would probably not pack
the powder in the same manner. In addition, the PU12 is
not useful for the study of fibrous materials (with the
possible exception of very fine and/or very small fibers).
A new powder holder has been designed to overcome
these drawbacks. The new apparatus is called the FL12.
Figure 3 is a diagram of the FL12.

KRÜSS GmbH | Borsteler Chaussee 85 | 22453 Hamburg | Germany | www.kruss.de 5 | 14
Fig. 3: FL12 sample holder
The cell is made of aluminum (less fragile than glass) and
small holes in its bottom instead of a fritted glass filter
(easier to clean). The cover for the cell is equipped with two
screw threads. One connects it with the sample chamber
while the other allows the user to guide a piston down
onto the sample itself and compress it (better
reproducibility in packing, and therefore "c" factor). When
using the cell with powders, the following procedure can
be followed:
1. Place a circle of filter paper in the bottom of the sample
cell. This prevents powder from leaking out the bottom
of the cell. Porosity of the filter paper to be used is
governed by the nature of the powder to be tested. The
finer the powder is, the finer the filter paper should be.
The filter does not have to be paper, but it should be a
material that is easily wet by the liquid to be tested.
2. Place a known mass of powder into the cell. This mass
should be great enough that the powder is compressed
a fair amount during step 4 of this procedure. If this is
the case, then reproducibility of your material constants
and contact angles will be dependent almost solely on
your ability to weigh out the same amount of powder
for each test. Thus, two users can easily achieve the
same material constant on the same powder. I think this
is the largest advantage of the new FL12 versus the old
PU12.
3. Place a second piece of filter paper on top of the
powder that you placed in the cell. This will prevent
powder from rising through the holes in the piston
during the compression process and/or during the
experiment.
4. Screw the cover onto the sample cell and screw the
piston completely down. You should have placed
enough powder in the cell to provide some resistance
to screwing down the piston, but not so much powder
that it is impossible for you to screw the piston
completely down with your fingers alone. Defining this
happy medium, in terms of mass of powder used, takes
a couple of tries. However, once you have it, you have a
good technique to reproducibly pack powders. For
most powders a good amount is in the range of 1 to 2
grams.
For fibrous materials, like cotton and fiberglass, a similar
procedure should be used. Depending on how fine the
fibers are, filter papers may or may not be needed.
The remainder of this note highlights the wide ranging
utility of Washburn adsorption experiments by discussing
some of the wettability work that has been performed in
our laboratory over the past few months. The porous
materials discussed include:
Woven fabrics used in the composites industry
Laser printer paper
A high density polyethylene membrane support used in
the water treatment industry
A series of treated titanium dioxide (TiO2) powders,
with varying degrees of hydrophobicity, which are used
in the pigment industry
Microcrystalline cellulose, which is used in the
pharmaceutical industry as an excipient
The naturally absorbent fibrous material flax
Fiberglass insulation
Cigarette filter fibers
Sample Experiment #1 – Woven Polyester
Fabric
We have recently explored the propensity of various woven
polyester fabrics to be wet by toluene and n-hexane. These
fabrics are used in the composites industry as "peel ply"
release liners. Their wetting properties are of interest
because they must be able to be well wetted by the
polymeric resin that makes up the matrix of the composite
to which they are applied. The best fabric for the
application would be the one that was most thoroughly
wet by the resin. Tests with toluene and n-hexane were
used as predictors of resin wetting behavior for a series of
fabrics which had been treated in a variety of ways. The
goal was save costly composite formation tests by pre-
selecting the most wettable fabric. The most wettable fabric
is the one that is found to have the lowest contact angle
against toluene.
The fabrics were cut into 2 cm x 5 cm rectangular pieces.
For both the n-hexane (material constant determining) and
the toluene (contact angle determining) experiments a
piece of fabric was suspended from the balance in a K12
instrument so that its 2 cm edge would be lowered into the
liquid. The flexible sample holder (FO12) was used to hold
the fabric samples.
Figure 4 shows some representative data from the testing.
The data is in the raw form of mass2 versus time.

KRÜSS GmbH | Borsteler Chaussee 85 | 22453 Hamburg | Germany | www.kruss.de 6 | 14
Fig. 4: Adsorption into woven polyester fabric
Note that both the n-hexane adsorption data and the
toluene adsorption data are linear with a positive slope
until they each reach a plateau. This is the general trend for
adsorption data. Liquid rises into the pores to the solid
(linear rise region in the data) until it is saturated (plateau
region in the data). Also, note that the linear rise portions
of both the n-hexane and the toluene data have been fit
with best-fit lines. The Krüss software does this
automatically. The slope of the n-hexane data was used in
the Washburn equation to calculate the material constant
for this particular piece of polyester fabric (which was
2.01x10⁻⁴ cm5). The slope of the toluene data was then
used to calculate contact angle of toluene on this particular
polyester fabric. The contact angle with toluene was 20.2°
in this case.
There is one further point of interest concerning this raw
data, however. If we just view the raw data, it seems that
toluene wets the fabric "better" than n-hexane. The weight
of toluene rising into the fabric at any particular time is
greater than the weight of n-hexane rising into the fabric at
any equivalent time. In addition, at saturation, a
2 cm x 5 cm piece of the fabric has adsorbed approximately
1.0 g {(1.0 g2)1/2
} of toluene. Only about 0.80 g {(0.64 g2)1/2
}
of n-hexane is adsorbed at saturation. All of this
information appears to conflict with n-hexane having been
assumed to have a contact angle of 0° on the fabric and
toluene having been calculated to have a contact angle of
20.2° on the fabric. N-hexane (surface tension =
18.4 mN/m) should wet the fabric better than toluene
(surface tension =28.4 mN/m). The calculated contact angle
data reflects this, but studying the raw data seemingly does
not. Why?
Much of the apparent conflict comes from the fact that our
experiment measures the mass of liquid which rises into
the pores of the solid. However, what the material constant
and contact angle of a porous solid against any given liquid
controls is the volume of liquid which rises into the pores
as a function of time. The volume of rising liquid is, of
course, the mass of rising liquid divided by the density of
the rising liquid (or m/ρ in terms of the symbols used in the
Washburn equation above). Note that the Washburn
equation can be rearranged into the following form:
𝑐𝑜𝑠𝜃 =𝑉2
𝑡∗
𝜂
𝜎𝑐 (5)
wherein V = the volume of liquid which has risen into the
porous solid. This is actually the original form of
Washburn's equation. It is simply not the form of the
equation that we commonly use, since direct measurement
of the volume of liquid uptake by a solid is more difficult
than is direct measurement of the mass of liquid drawn up.
With this information, let's study the raw data in figure 4
again. From the two plateaus we can calculate that at
saturation a 2 cm x 5 cm sample of this particular polyester
fabric takes up approximately {1 g2/(0.867 g/cm
3)2}1/2
=
1.15 cm3 of toluene. The same size sample of fabric takes
up approximately {0.64g2/(0.661g/cm
3)2}1/2
= 1.21 cm3 of n-
hexane at saturation. In these calculations, 0.867g/cm3 =
ρToluene and 0.661 g/cm3 = ρn-Hexane. On a volume basis then,
n-hexane saturates the porous solid more completely than
does toluene. The n-hexane also saturates the fabric more
quickly. The saturation plateau is reached at approximately
115 to 120 seconds for n-hexane compared to 135 to
140 seconds for toluene. Studying the raw data in this
manner eliminates our apparent conflict. The n-hexane
does in fact wet the fabric more completely than does the
toluene, as would be expected, and as is reflected by the
contact angle data.
The point of this extended discussion concerning the first
sample experiment was to provide a framework for
interpretation of Washburn adsorption data. The polyester
fabric data was a good example, because the raw data
could be misinterpreted. We, at Krüss, like examples like
this because, although our instrument is fully automated
and our software automatically does Washburn
calculations, we do not intend for it to be used as a magical
"black box". The most useful insights into the meaning of
scientific data always come from thoughtful analysis, not
from automated instruments.
Similar apparent quality of wetting (raw data versus
calculated data) conflicts will also be observed, but not
explained in detail, throughout the series of Washburn
experiment examples put forth in this text. These generally
arise when two liquids with surface tensions that are very
similar, but densities that are substantially different, are
studied with the same solid.
One final comment on the data that we have seen so far is
warranted before we proceed further. It is interesting (to
me) that if we take the contact angle which was obtained
for toluene wetting the fabric (20.2°) and multiply its cosine
(0.9385) by the volume of n-hexane that adsorbs into the
fabric at saturation (1.21 cm3) we get a volume of 1.14 cm
3,
which is nearly identical to the volume of toluene that was
found to saturate the fabric 1.15 cm3. There is probably no
scientific basis for doing such a calculation. However, I find
it interesting. (Note that such a calculation will be
necessarily correct in the limit of a liquid which has a
contact angle of 90° on the solid, since the cos(90°) = 0 and

KRÜSS GmbH | Borsteler Chaussee 85 | 22453 Hamburg | Germany | www.kruss.de 7 | 14
the volume of the liquid which will rise into the solid will
also be 0 cm3).
Sample Experiment #2 – Laser Print Paper
The adsorption of liquids into paper products is most
notably a concern in the printing industry. To what extent
an ink will penetrate a paper, or simply dry in a controlled
manner on the paper's outer surface, is fundamental to
printing. In addition, the longevity of a paper in terms of
resistance to discoloration is often dependent on the
extent to which the paper adsorbs moisture from the air.
We have recently studied the adsorption of a series of
liquids into a common grade of laser printer paper by the
Washburn technique. The paper was cut into 2 cm x 5 cm
pieces and tested using the flexible sample holder (FO12)
in the Force Tensiometer K12. Figures 5 and 6 show raw
data from adsorption tests with the following liquids and in
support of the following contact angle data.
Liquid
Room Temperature
Surface Tension
[mN/m]
Contact Angle on
Laser Printer
Paper [°]
n-Hexane 18.4 0 (c=2.803x10⁻⁴
cm5)
Acetone 23.7 0
Toluene 28.4 0
Benzyl Alcohol 39.0 24.5
Ethylene Glycol 47.7 45.2
Water (distilled) 72.3 80.1
Table 1: Contact Angle Data for Laser Printer Paper
Fig. 5: Adsorption into Laser Printer Paper I
Fig. 6: Adsorption into Laser Printer Paper II
Since a series of contact angles were obtained for liquids
wetting the laser printer paper, it is possible to use those
contact angles to calculate "surface energy" of the paper.
The surface energy of a solid surface is conceptually the
equivalent of the surface tension of a liquid. A high surface
energy means that interfaces between the solid and air are
not favorable in a thermodynamic sense. High surface
energy solids are therefore wet extremely well by liquids,
since liquid wetting eliminates solid/air interfaces in favor
of liquid/solid interfaces. Low surface energy solids are
correspondingly wet very poorly by most liquids. The
reason for calculating the surface energy of a solid is that
having this value allows you to predict how well the solid
will be wet by other liquids which have not yet been tested
against the solid. However, the surface energy of a solid
must be calculated. It cannot be measured. In order to see
why this is true, let's briefly return to the discussion of the
wetting on non-porous solids.
Consider figure 7, which depicts a liquid droplet on a non-
porous solid surface.
Fig. 7: liquid droplet on non-porous solid
The contact angle which the drop in figure 7 forms with the
solid surface is governed by a balance of forces in the x-
direction. Mathematically,
𝜃 = 𝑐𝑜𝑠−1[𝜎𝑆−𝜎𝑆𝐿
𝜎𝐿] (6)
where θ = contact angle, σS = the surface tension of the
solid, σL = the surface tension of the liquid, and σSL = the
interfacial tension between the solid and the liquid.
KRÜSS GmbH | Borsteler Chaussee 85 | 22453 Hamburg | Germany | www.kruss.de 8 | 14
This is Young's equation2. The unfortunate part of doing
any contact angle work is that there is no way to
deconvolute the surface tension of a solid (σS) from the
interfacial tension between the solid and the liquid (σSL). If a
liquid with known surface tension (σL) is placed on a non-
porous solid, and the contact angle (θ) is measured, then
Young's equation can be used to calculate the value (σS-
σSL). However, the two terms cannot be separated, and thus
the surface tension of a solid cannot be known. The same
situation applies to contact work done on porous solids.
Fortunately, it is not necessarily the surface tension of the
solid that we wish to determine. We wish to determine a
characteristic value for the wettability of the solid. This
characteristic value has been termed surface energy. It is
now apparent that surface energy must be defined in some
manner, before we can attempt to calculate it. To make
matters more complicated, there is no universally agreed
upon definition of surface energy. There are, however,
many theories in the scientific literature regarding how
surface energy should be defined. These theories range
from simple to highly complex in mathematical form. Three
of the most well regarded are the Zisman method3, the
Owens/Wendt method4, and the Wu method
5.
Both the Owens/Wendt method and the Wu method are
somewhat complex mathematically. The use of either
involves sub-dividing the surface tension of the wetting
liquid, as well as the surface energy of the solid, into polar
and disperse components based on some knowledge of
their chemical properties. These methods can be quite
effective, and Krüss software is designed to use any of
them (at the user's option) to calculate surface energies for
solids based on contact angle data. However, the nature of
these methods is such that, if they are individually applied
to the same contact angle data, vastly different values of
solid surface energy may be obtained. It is then up to the
experimenter to decide which method he feels is best for
his application. Individuals who are interested in a more
thorough and mathematical explanation of the
Owens/Wendt method and the Wu method are referred to
the literature cited and to the Krüss K121 contact angle
software manual. Such a discussion is somewhat beyond
the scope of this text.
The Zisman method, on the other hand, is simple in
mathematical form and very straightforward in terms of the
information that it provides about the ability of a solid
surface to be wetted. For this reason, it is more widely used
than either the Owens/Wendt method or the Wu method.
In order to highlight practicality of the Zisman method, we
will use it to determine surface energy of the laser print
paper which we have studied. However, before doing that,
it is instructive to first review development of Zisman's
method in a little more detail.
The problem with defining and then determining the
surface energy of a solid, as related to the discussion
above, is that the surface tension of the solid (σS) cannot be
deconvoluted from the interfacial tension between that
solid and a liquid (σSL), based solely on contact angle
measurements. By measuring the contact angle of a liquid
with known surface tension on a solid, the value (σS-σSL)
may be obtained. However, surface energy of the solid
remains undefined. Zisman's solution to this problem was
to simply define surface energy of the solid as equal to the
entire value (σS-σSL) in the limit of the contact angle
approaching θ = 0°. The utility of this definition becomes
apparent if we consider Young's equation for the case of a
liquid which has a zero contact angle on the solid in
question. For θ to equal 0°, in Young's equation, the value
(σS-σSL)/σL must be equal to 1. In other words, (σS-σSL) = σL,
or the surface energy of the solid is equal to the surface
tension of an applied liquid which just has a zero contact
angle on the solid. By "just" we mean that a solid's surface
energy is actually defined as the being equal to the surface
tension of a liquid (real or imaginary) which has the highest
possible surface tension that will still allow it to wet the
solid's surface with a 0° contact angle.
To determine the surface tension of this ideal liquid (and
thereby the solid's surface energy) contact angle data
obtained using real liquids is plotted against surface
tension values for the real liquids. When such data is
plotted in the form of cos(θ) versus liquid surface tension,
the plot is typically linear. The data are extrapolated to
cos(θ)=1 (or 0°) and surface energy of the solid is taken as
the liquid surface tension at that intercept. Such a plot is
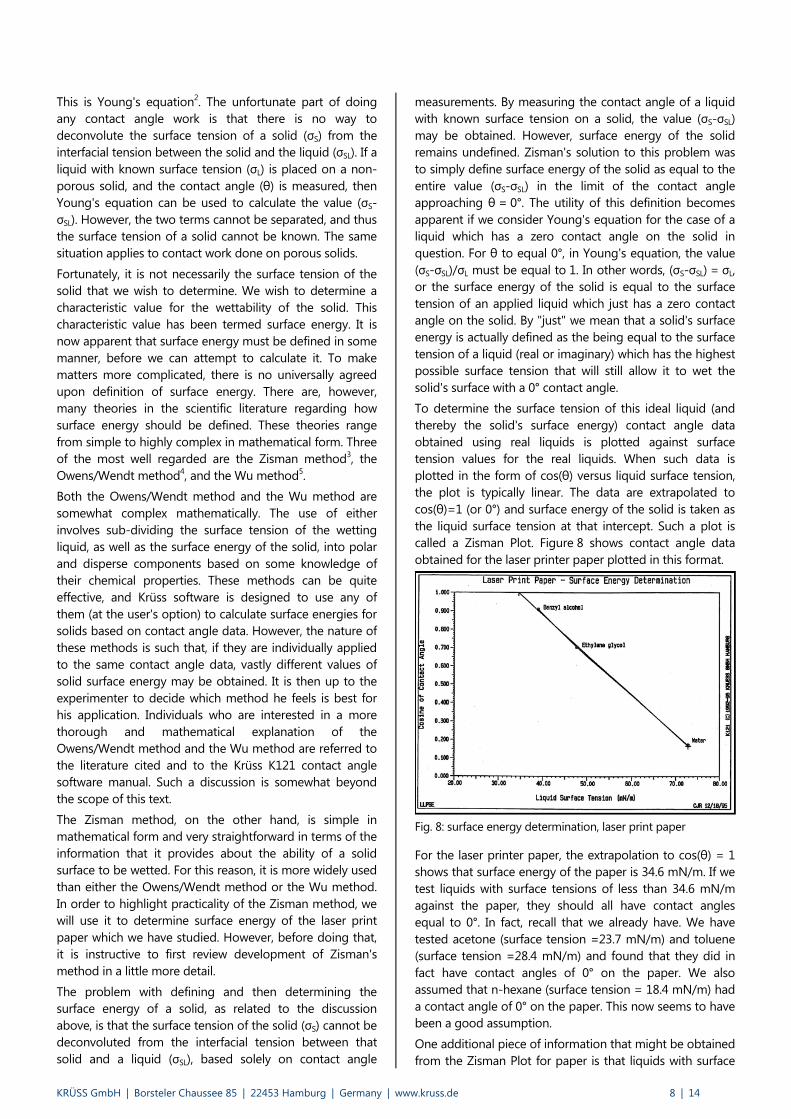
called a Zisman Plot. Figure 8 shows contact angle data
obtained for the laser printer paper plotted in this format.
Fig. 8: surface energy determination, laser print paper
For the laser printer paper, the extrapolation to cos(θ) = 1
shows that surface energy of the paper is 34.6 mN/m. If we
test liquids with surface tensions of less than 34.6 mN/m
against the paper, they should all have contact angles
equal to 0°. In fact, recall that we already have. We have
tested acetone (surface tension =23.7 mN/m) and toluene
(surface tension =28.4 mN/m) and found that they did in
fact have contact angles of 0° on the paper. We also
assumed that n-hexane (surface tension = 18.4 mN/m) had
a contact angle of 0° on the paper. This now seems to have
been a good assumption.
One additional piece of information that might be obtained
from the Zisman Plot for paper is that liquids with surface

KRÜSS GmbH | Borsteler Chaussee 85 | 22453 Hamburg | Germany | www.kruss.de 9 | 14
tensions of greater than approximately 80 mN/m can be
expected to have contact angles of greater than 90° on the
paper. (The data can be extrapolated to cos(θ)=0 as well.) It
is rare to deal with liquids that have surface tensions which
are greater than 80 mN/m. Only concentrated aqueous salt
solutions would have surface tension values this high.
However, this data suggests that such liquids will not
spontaneously penetrate into the laser printer paper.
Sample Experiment #3 – Adsorption into a
High Density Polyethylene Membrane
Support
In a manner similar to that used for the laser printer paper,
we have also recently characterized wettability of a high
density polyethylene (HDPE) membrane support. The
support had pores in the diameter range of 10-20 microns
and it was approximately 3 mm thick. It is used to support
much thinner polymeric membranes which are responsible
for removal of trace impurities from water. The reason for
studying wettability of the membrane support and
determining its surface energy, was to provide a basis for
exploring what types of membranes would work most
efficiently with it. The contact angle for water on the
untreated support was actually found to be greater than
90°.
The support was cut into 1 cm x 3 cm strips for the
wettability experiments. These samples were tested using
the Force Tensiometer K12 in the adsorption mode and the
rigid sample clip (CLMP10). The results of the testing are
shown in Table 2 and in Figures 9 and 10.
Liquid
Room Temperature
Surface Tension
[mN/m]
Contact Angle on
HDPE Membrane
Support [°]
n-Hexane 18.4 0 (c=1.537x10⁻⁶
cm5)
Acetone 23.7 45.5
Toluene 28.4 57.8
Benzyl Alcohol 39.0 78.1
Table 2: Wettability Tests on a HDPE Membrane Support
Fig. 9: Adsorption into HDPE membrane
Fig. 10: surface energy determination, HDPE membrane
There are three points of interest concerning this data.
1. Figure 9 suggests that saturation of the support with
benzyl alcohol is a relatively slow process. The support
is saturated by n-hexane, acetone, or toluene within
10 seconds. By contrast, at 20 seconds the support is
still nowhere near saturated with benzyl alcohol. It
might be predicted that saturation with benzyl alcohol
would take greater than 100 seconds. However, the
actual experiment was terminated at 20 seconds
because plenty of data had been collected by that time
for the contact angle calculation. This is due to the
relatively high viscosity of benzyl alcohol (η = 5.80 cP)
and the high contact angle between benzyl alcohol and
the support (78.1°).
2. The Zisman plot for the support (figure 10) suggests
that surface energy of the support is approximately
14.4 mN/m. It should be pointed out that this number is
only an estimate, however. Why?
The value 14.4 mN/m was obtained based on contact
angle values for acetone, toluene, and benzyl alcohol.
Those contact angles were themselves obtained based
on a material constant (c) which was in turn obtained by
assuming that the contact angle of n-hexane on the
support was 0°. However, if the surface energy of the
support is truly 14.4 mN/m then the contact angle for
n-hexane on the support would not be 0°. In fact, based
on Young's equation in would be 38.5° {cos-1
(14.4/18.4)}
since n-hexane has a surface tension of 18.4 mN/m at
room temperature.
The obvious way to correct this problem is to
redetermine the material constant for the support with
a liquid that has a surface tension less than 14.4 mN/m,
and can thus be correctly assumed to have a contact
angle of 0° on the support. The contact angles for n-
hexane, acetone, toluene, and benzyl alcohol could then
be corrected based on the new material constant. This,
however, is complicated by the fact that there are few
standard liquids with surface tensions as low as
14.4 mN/m. Pentane, another easily used liquid for
material constant determination, has a surface tension

KRÜSS GmbH | Borsteler Chaussee 85 | 22453 Hamburg | Germany | www.kruss.de 10 | 14
of 15.4 mN/m. Some fluorinated solvents do exist with
surface tensions that are this low, but they are not
environmentally friendly to work with.
On the other hand, it is probably not extremely
important to calculate a more exact value for surface
energy of the support. This data shows that the surface
energy is definitely less than 18.4 mN/m (the surface
tension of n-hexane), and estimates it at 14.4 mN/m.
The surface is obviously very hydrophobic.
3. For water treatment (the application for this membrane
support), the 90° contact angle limit is probably more
important than the surface energy. Extrapolation of the
Zisman plot to cosθ = 0 (contact angle = 90°) provides
the information that liquids with surface tensions
greater than approximately 44 mN/m will not
spontaneously penetrate pores of the support. This
includes liquids such as ethylene glycol (surface tension
= 47.7 mN/m) and distilled water (surface tension
=72.3 mN/m).
Sample Experiment #4 – Characterizing the
Hydrophobicity of Treated TiO2 Powders
A major concern for pigment manufacturers is how well
their pigments wet and disperse when added to various
product formulations. There are basically two ways to
achieve better pigment wetting and subsequent dispersion.
First, the nature of the formulation can be altered to
accommodate the pigment. Wetting agents (surfactants)
can be added, to aqueous formulations to lower the
interfacial tension between the bulk solution and the
pigment. In solvent based formulations, the ratio of polar
to non-polar solvent can be adjusted and dispersing aids
can be used to promote wetting. Second, the nature of the
pigment can be altered. Surface modifications which raise
the surface energy of the pigment are generally favorable
because they increase the range of liquids which will wet
the pigment. Surface modification is often the option
explored by pigment manufacturers, since they generally
have little control over the nature of the formulations in
which their pigments are used. They want to manufacture
pigments which are generally more easily wetted and
dispersed under a variety of conditions.
We recently had a customer who was concerned with these
very issues for titanium dioxide (TiO2) pigments. He sent six
TiO2 pigments to us which had been surface modified in
various ways, and wanted us rank the samples in terms of
wettability (or hydrophilicity).
So far in this note we have discussed "continuous" porous
solids. This is the first sample experiment which gives us the
opportunity to discuss powders. Perhaps more importantly,
another thing that has not yet been discussed in this note
is how to begin work on characterizing wettability of a
porous solid. In the previous sample experiments we
focused on details of the Washburn method. We used
various common solvents as test liquids, and did not
explain in any detail why those liquids were chosen for the
testing.
Some contact angle work is done specifically to investigate
the interaction between one or more pre-defined liquids
and a solid. In these cases we do not need to search for
test liquids. On the other hand, much contact angle work is
done to characterize wettability (or surface energy, or
hydrophobicity) of a solid. If the goal of experimentation is
to determine the surface energy of a porous solid, we now
know we need to study contact angles of a series of liquids
against that solid. If our goal is to rank a series of solids in
terms of hydrophobicity, we may be able to do this using
only one test liquid. In either case, however, a
characterizing liquid or set of liquids must be chosen.
The first criterion in choosing liquids for a test series is that
they should not dissolve the porous solid. If they do, then
Washburn experimentation cannot be effective. I purposely
waited until we began a discussion of powders to make this
point, because it is with powders that the solubility issue is
most often a problem. If a powder is slightly soluble in a
liquid (against which we want to measure its contact angle)
then we can pre-saturate the liquid with the powder and
proceed with the contact angle experiment. If, however, it is
more than sparsely soluble, then contact angle
measurement may not be possible. We would then be
exploring solubility testing and not contact angle testing!
Being aware of the solubility issue, what is the second
criterion for choosing a series of liquids for contact angle
tests on a porous solid? Assume that we have a situation
like the series of TiO2 samples we wish to characterize. We
initially know nothing about surface energies of the
powders. Therefore, we have no idea which liquids will
spontaneously wet the powders and which liquids will not.
We said previously that liquids which do not spontaneously
wet cannot be used for Washburn experimentation. So, our
second objective should be to eliminate them from
consideration for our series.
Now that we have boundaries regarding what liquids are
not acceptable for use, we can do some educated
guessing. The guessing is guided by some quick and
simple experiments to determine what liquids are
acceptable for use with any given solid.
To start that guessing, with virtually any porous solid, I find
the following series of liquids quite useful.
Liquid Room Temperature
Surface Tension [mN/m]
n-Hexane 18.4
Acetone 23.7
Toluene 28.4
Benzyl Alcohol 39.0
Ethylene Glycol 47.7
Glycerol 63.4
Water (distilled) 72.3
Table 3: Suggested Liquids to Check Wetting

KRÜSS GmbH | Borsteler Chaussee 85 | 22453 Hamburg | Germany | www.kruss.de 11 | 14
I have chosen this series for a number of reasons. First,
most of these solvents are commonly found in research
laboratories. Second, they are, for the most part, not
extremely hazardous to the experimenter. Third, taken
together, they cover the range of surface tensions for
common liquids.
Many fluorinated solvents have surface tensions of less
than 18.4 mN/m, but they can be hazardous. In addition, n-
pentane, the highest molecular weight straight chain
hydrocarbon that is a liquid at room temperature, has a
surface tension of 15.4 mN/m at room temperature. It can
be a good liquid for contact angle work. It is not extremely
hazardous, but it is extremely volatile at room temperature.
Its volatility keeps it off my list of primary test liquids. Salt
solutions are the most common liquids which have surface
tensions greater than that of pure water (72.3 mN/m) at
room temperature. Concentrated salt solutions can have
surface tensions which approach, but rarely surpass
100 mN/m. Beyond this there are only fairly exotic liquids,
like mercury which has a surface tension of 484 mN/m at
room temperature.
Having confined our search for test liquids somewhat, the
first thing I typically do in studying wettabilities of powders
(and other porous solids as well) is to simply line up a series
of small beakers containing my prospective liquids and
drop a small sample of each powder (or a piece of paper, if
I happen to be testing paper, etc.) into each liquid. Liquids
which dissolve the powder (paper, etc.) are eliminated from
consideration, as are liquids which do not wet the powder
within some reasonable amount of time (because those
liquids have contact angles of greater than 90°) on the
powder. A good set of usable test liquids can then be
chosen from the liquids that were well behaved.
These simple tests, which often take no more than a few
minutes, can save an experimenter from setting up
Washburn experiments that don't work. It is generally best
to start with distilled water. If the powder (or porous solid)
wets with, but is not dissolved by, water, then use water as
a test liquid. The powder will also undoubtedly wet with all
of the other liquids in the series. Therefore, any of the
remaining liquids that do not dissolve the solid can be used
as well.
Occasionally, however, additional information beyond what
test liquid might be used for contact angle tests can be
gained from the initial testing. The more hydrophobic a
powder is, the lower the surface tension of a liquid must be
for it to spontaneously wet the powder. Therefore, if my
series of liquids is used for the initial tests, along with a
series of powders, sometimes powders can be
distinguished from one another in terms of hydrophobicity
just on the basis of these initial tests. Such was the case for
the TiO2 samples that were recently tested, mainly because
they were so hydrophobic.
None of the six TiO2 samples spontaneously wet with
distilled water (surface tension = 72 mN/m) or glycerol
(63 mN/m). This indicates that the contact angle of these
two liquids on all of the powders is greater than 90°, and
cannot be determined by the Washburn technique. Had we
really wanted to know what the contact angle of these
particular liquids were on the TiO2 powders we could have
determined them using the Wilhelmy method by sticking
some quantity each of powder onto a solid plate (usually a
glass slide) and doing dynamic contact angle experiments
on the resultant coated plates. This technique was
described in the background section of this note. However,
for this work, we were not interested in such data. We
wanted to characterize the powders with liquids which had
contact angles of less than 90° on all them, if we could find
such liquids.
The initial tests with ethylene glycol (surface tension =
47.7 mN/m) gave me the first indication of differences
between the six TiO2 samples. We had labeled the samples
A through E. Samples A, C, and D, spontaneously wet with
ethylene glycol. Sample B wet, but only very slowly.
Samples E and F did not wet over the course of about two
minutes. Ethylene glycol thus characterized 90° contact
angles on the TiO2 samples quite well. It also told us that
samples A, C, and D, followed by B, were more hydrophilic
than samples E and F. Ethylene glycol is still not low
enough in surface tension to be a good test liquid for
Washburn tests on all of the samples, however.
Moving to lower surface tension liquids, we did initial tests
on the TiO2 powders using benzyl alcohol (39.0 mN/m),
toluene (28.4 mN/m), acetone (23.7 mN/m), and n-hexane
(18.4 mN/m). All of these liquids spontaneously wet all of
the powders. Therefore, no further background information
was ascertained, except that any (or all) of these liquids
might be used along with the Washburn technique to
characterize the TiO2 powders.
We choose to use n-hexane as the material constant
determining liquid and acetone as a liquid for contact
angle experimentation by the Washburn method. Since we
did not necessarily need to determine the surface energy of
each of the TiO2 powders precisely, contact angle testing
with acetone was sufficient. The TiO2 powder which had the
lowest contact angle with acetone could be said to be the
most hydrophilic of the series, and the TiO2 powder which
had the highest contact angle with acetone could be said
to be the most hydrophobic, and so on.
The FL12 powder holder was used for the experiments. The
procedure described earlier for use of the FL12 with
powders was strictly adhered to, and we found that 3.00 g
of powder was a good amount for each test.
Raw data from some of the Washburn experiments
preformed on these powders is shown in figures 11
through 13.

KRÜSS GmbH | Borsteler Chaussee 85 | 22453 Hamburg | Germany | www.kruss.de 12 | 14
Fig. 11: n-Hexane adsorption into treated TiO2 powders
Fig. 12: acetone adsorption into treated TiO2 powders
Fig. 13: reproducibility adsorption into treated TiO2 powders
From the data in figures 11, 12 and 13 the following
information regarding the powders was obtained.
TiO2 Powder
Material constant
with n-Hexane
[x10-6
cm5]
Contact Angle
with Acetone
[°]
A (Run #1) 1.1606 46.2
A (Run #2) 1.1676 45.8
B 1.1633 57.5
C 1.7607 11.8
D 1.7134 17.8
E 1.4451 62.4
F 1.0676 58.3
Table 4: Material Constant Determination and Acetone Contact
Angles for TiO2 Powders
There are three points that should be made about this data.
1. Data are reported from two tests with n-hexane and
two tests with acetone on sample A. (The raw data from
these tests is the subject of figure 13.) The purpose of
this is to indicate reproducibility. We have yet to discuss
data reproducibility in this application note, so we will
do so now.
It is difficult to declare a single number for the
reproducibility (or precision) of Washburn adsorption
data for a number of reasons. Largely, the precision is
based on uniformity of the samples being tested. For
continuous porous solids, "uniformity" means how
similar the porous architecture of the first piece tested
is to the second, and so forth. Assuming we cut such
samples from the same large piece of material (for
example multiple strips of paper from the same
8.5" x 11" sheet, all oriented in the same direction), this
has to do with homogeneity of the sheet of paper both
in terms of porosity and in terms of the surface
treatment that the pores have been subjected to.
For powders and other non-continuous porous
materials sample "uniformity" means two things. First,
uniformity has to do with how likely an experimenter is
to get a group of powder particles of the same size
distribution every time she takes a few grams of powder
from a larger sample of the powder (usually a jar of
powder), and how likely it is that particles she gets will
have a surface treatment that is similar to that of the
last particles. Obviously, a large powder sample with a
narrow particle size distribution will be apt to provide
more uniform small powder samples than a large
powder sample with a broad particle size distribution. A
widely recommended technique for obtaining
representative samples of a powder is use of a spinning
riffler. This device will subdivide a quantity of powder
into eight or sixteen representative portions. By
successive passes through the riffler a desired sample
size of 1 g to 5 g can be readily obtained.
Second, uniformity is also dependent on how
reproducibly each powder sample can be packed. We
have previously given some description of the
advantages of the new FL12 powder holder with regard
to this. In general, the FL12 has enhanced the
reproducibility of Washburn experiments on powders
into approximately the same range as the
reproducibility achievable for continuous porous solids
like papers and membranes (with which repeatable
packing is at least not necessary). A good very general
estimate of this reproducibility is ±2.0° for contact angle
experiments and ±2% for material constant
determination experiments.
For many samples this estimate is overly conservative,
however. For example, the data for TiO2 sample A
shows a material constant reproducibility of 0.6% and a
contact angle reproducibility of 0.4° based on duplicate
tests. Of course, for any scientific study the level of
reproducibility necessary is governed by the level of

KRÜSS GmbH | Borsteler Chaussee 85 | 22453 Hamburg | Germany | www.kruss.de 13 | 14
detectable difference between any two systems. If the
former exceeds the latter, the two systems are not
differentiated by the study. This was not the case with
the acetone contact angles determined on the TiO2
powders. The closest two acetone contact angles are for
samples B and F, which are 57.5° and 58.3° respectively,
for a difference of 0.8°, or approximately twice the
precision of this set of experiments.
2. The acetone contact angle data follows the trend
developed during initial tests on the samples with
ethylene glycol. However, it provides a more detailed
evaluation which was necessary for our customer's work
with his TiO2 pigments. The lower the contact angle of
acetone on a TiO2 sample, the more hydrophilic the
sample is. The contact angle results with acetone show
the following trend.
E > F > B > A > D > C
Increasing Hydrophilicity or Surface Energy
----------------------------->
The initial test data with ethylene glycol showed.
E = F > B > A = C = D
Increasing hydrophilicity
----------------------------->
3. The third point of interest for this data involves the
material constants which were determined with n-
hexane. Samples A and B have very similar material
constants (for 3.00 g packed plugs of each). Samples C
and D also have fairly similar material constants. The
material constants for samples E and F are somewhat
different from all of the others. Material constants
reflect the porosity of packed powder plugs, both in
terms of the number of capillaries in a plug and the
average radius of those capillaries. It seems that certain
pairs of TiO2 powders in the group pack very similarly.
This probably indicates those powders have similar
particle size distributions. We have not performed
particle size analysis on these samples. Nonetheless, I
point this out as a secondary piece of information that
can be qualitatively obtained from Washburn
experimentation on powders.
Sample Experiment #5 – Microcrystalline
Cellulose Powder
We have performed Washburn experiments on a standard
grade of microcrystalline cellulose, and it may be instructive
to discuss that work as another example. Microcrystalline
cellulose is used in the pharmaceutical industry as an
"excipient". An excipient is a fairly inert substance which
serves as a medium for delivery of a medicine. For example,
a tablet containing 20 mg of a drug often weights 0.5 g.
The 0.48 g of the tablet that is not drug is excipient. In
general terms, microcrystalline cellulose is a solid diluent. It
is what often makes up the majority of a pharmaceutical
tablet that is not the pharmaceutical itself. How well it wets
and disperses in water and other biological media is thus of
some importance.
The goal of our study was to determine how well one
particular grade of microcrystalline cellulose wets with
water and with ethylene glycol. The study was performed
using a Krüss Force Tensiometer K12 in the Adsorption
mode with the FL12 powder holder. For each test, 2.00 g of
microcrystalline cellulose was used. Raw data from these
tests is shown in figure 14.
Fig. 14: adsorption into microcrystalline cellulose powder
The calculated results are as follows:
Liquid
Room
Temperature
Surface Tension
[mN/m]
Run
Number
Material
Constant or
Contact Angle
n-Hexane 18.4 1 2.118x10⁻³
cm5
n-Hexane 18.4 2 2.132x10⁻³
cm5
Ethylene
Glycol 47.7 1 31.4°
Ethylene
Glycol 47.7 2 31.6°
Water
(distilled) 72.3 1 67.6°
Water
(distilled) 72.3 2 66.8°
Table 5: Contact Angle Data for Microcrystalline Cellulose
A Zisman plot based on this data (not shown) indicates that
surface energy of this microcrystalline cellulose is
approximately 40 mN/m, and that liquids with surface
tensions of greater than approximately 92 mN/m will not
spontaneously wet the powder. As can be calculated from
the data above, reproducibility of these experiments was
0.7% for the material constant with n-hexane, 0.8° for tests
with water, and 0.2° for tests with ethylene glycol, based on
duplicate experiments.
Sample Experiment #6 – Fibrous Materials
In order to demonstrate the utility of the FL12 sample
holder for Washburn experiments on fibrous materials, we

KRÜSS GmbH | Borsteler Chaussee 85 | 22453 Hamburg | Germany | www.kruss.de 14 | 14
have studied wettabilities of three types of fibers. They
were: a standard grade of fiberglass insulation, a flax-like
material which serves as an absorbent within packing pads
that are used to protect bottles of liquid during shipments,
and cigarette filter fibers. Some of the data obtained for
these three systems are shown in Table 6. Figure 15 shows
data for water adsorption into each of the fibrous materials.
Fibrous
Material
Wetting
Liquid
Run # Material Constant
or Contact Angle
Fiberglass
Insulation
n-Hexane 1 1.172x10⁻²
cm5
Fiberglass
Insulation
n-Hexane 2 1.161x10⁻²
cm5
Fiberglass
Insulation
Distilled
Water
1 54.8°
Fiberglass
Insulation
Distilled
Water
2 54.7°
Absorbent
Flax
n-Hexane 1 1.634x10⁻²
cm5
Absorbent
Flax
n-Hexane 2 1.655x10⁻²
cm5
Absorbent
Flax
Distilled
Water
1 44.8°
Absorbent
Flax
Distilled
Water
2 44.3°
Cigarette
Filter
n-Hexane 1 1.623x10⁻²
cm5
Cigarette
Filter
n-Hexane 2 1.632x10⁻²
cm5
Cigarette
Filter
Distilled
Water
1 65.0°
Table 6: Contact Angle Data for Selected Fibrous Materials
Fig. 15: water adsorption onto various fibrous materials
I think that this data makes it fairly evident that
reproducibility and linearity can be achieved for Washburn
experiments on packed fiber beds as well as packed
powders and "continuous" porous solids. For the flax
material and the cigarette filter material it is interesting to
note that the material constants are very similar. This could
be a function of the materials themselves being quite
similar. Certainly, the packing of these two fibers into the
FL12 was similar, since 2.5 grams was the amount of each
used for each experiment. For the fiberglass insulation,
3.0 grams was the sample amount required for each
experiment, and the material constant was much different
as well. A greater mass of the fiberglass was necessary to
pack the FL12 because glass is a relatively high density
material, and the volume of material packed is governed by
the dimensions of the FL12 itself.
The contact angle results with water are no surprise. The
lowest contact angle (best wetting) was observed with the
flax-like material which is supposed to be absorbent. The
fiberglass wet second best, which is not unexpected
because glass is known to have a fairly high surface energy.
The cigarette filter material was the least wettable.
Conclusions
I hope that this technical note is both useful and instructive
for individuals who are interested in studying wettabilities
of porous solids. In writing it I attempted to cover both the
theoretical and experimental aspects for such studies. I also
tried to focus, as much as possible, on the practical aspects.
I wanted to provide the reader with some idea of which
experiments are necessary to answer wettability questions
and, just as importantly, which experiments are not.
Experimental design issues are often difficult to treat
thoroughly with in technical notes since they are largely
sample dependent and cannot be generalized. I took the
approach of simply sharing a handful of my own
experiences in studying the wetting of porous solids (the
sample experiments) and discussed the practical matters as
they "fell out" of each study. I don't pretend that this was
the best or only possible approach.
If you have any questions or comments about this note, or
if you would like to discuss an application that you have for
porous solid wettability studies, I would be happy to hear
from you.
References
[1] Washburn, E.W., Phys. Rev., 17, 374, 1921.
[2] Shaw, D.J.; Introduction to Colloid and Surface
Chemistry, 4th edition, Butterworth-Heinemann Ltd,
Oxford, (1992).
[3] Zisman, W.A.; ACS Advances in Chemistry Series, 43,
1-51, (1964).
[4] Owens, D.K. and Wendt, R.C.; Jour. of Appl. Polymer
Sci., 13, 1741-1747, (1969).
[5] Wu, S.; Jour. of Adhesion, 5, 39-55, (1973).
You will find many other interesting Application Reports
and Technical Notes at
https://www.kruss.de/services/education-
theory/literature/application-reports/