wfc3 ir filters: measured throughput and comparison … · instrument science report wfc3 wfc3 ir...
TRANSCRIPT
Instrument Science Report WFC3 WFC3 IR Filters: Measured Throughput
and Comparison to Specifications
_______________________
O. Lupie, R. Boucarut (GSFC), T. Pham (GSFC), M. Quijada (GSFC)
July, 2003
Abstract This ISR presents the WFC3 IR filter throughput at the center of each filter as measured by the Optics Branch at Goddard Space Flight Center (R. Boucarut, M. Quijada and S. Struss). The measured data are compared to the WFC3 CEI specifications and to the design requirements outlined in the GSFC IR Filter specification document (GSFC 2001). Instrument throughput as a function of selected filter, out of band blocking conformance, as well as spatial trends will be documented in future ISRs. Note: The intention of this study is to document the comparison between spec and as- built properties for future reference. Ultimately, the science goals determine the applicability of a specific filter. The WFC3 Science Oversight Committee has reviewed all the measured data, selected the flight candidates, and approved the filter deliveries. 1. Introduction We present the Wide Field Camera 3 (WFC3) IR filter throughput measurements and compare the as-built qualities to the design specifications. Although we focus on the throughput and bandpass at the central regions of the filter in this ISR, future ISRs will document spatial trends as well as entire instrument throughput. The filter measurement program (Boucarut, Quijada, Lupie, Struss, and Miner 2002) was lead by the Optics Branch at Goddard Space Flight Center (R. Boucarut, M. Quijada and others). Assessment of conformance was carried out by Boucarut and Lupie. The intention of this ISR is to document the comparison between spec and as-built properties for future reference. Ultimately, the science goals determine the applicability of a specific filter. The WFC3 Science Oversight Committee has reviewed all the measured data, selected the flight candidates, and approved the filter deliveries from the vendors. The structure of this ISR is as follows: Section 2 presents the throughput data and derived parameters in the form of annotated plots and tables. Definitions of all relevant filter characterization parameters are provided. Section 3 compares the throughput measurements to the specifications. Section 4 describes the requirements and GSFC measurements of wavefront, wedge, and focus shift. The document text closes with acknowledgements and references. Tables and figure panels may be found at the end of the text section.
1
The Wide Field Camera 3 program has spanned 3 years starting with the scientific selection of wavelength ranges of interest followed by the filter definition and requirements phase, the vendor interface phase, receipt and measurement of the filter properties and the final selection of the flight candidates. The scientific selection process and interim results are documented in several ISRs (WFC3 ISRs 2000-07,08,09 and ISR 2002-10). The team responsible for the entire filter development program comprises the following:
−
− − − − −
WFC3 Science Oversight Committee recommended the selection of filters and chose the final flight candidates. GSFC (Boucarut) and STScI (Lupie) designed the IR filters specifications. Barr Associates, Inc manufactured the filters. GSFC team (Boucarut et al.,) assessed filter quality and measured filter characteristics. Ball Aerospace provided optical prescriptions and mounted the filters in the housings. STScI/GSFC/Ball Aerospace provided scientific studies and technical support.
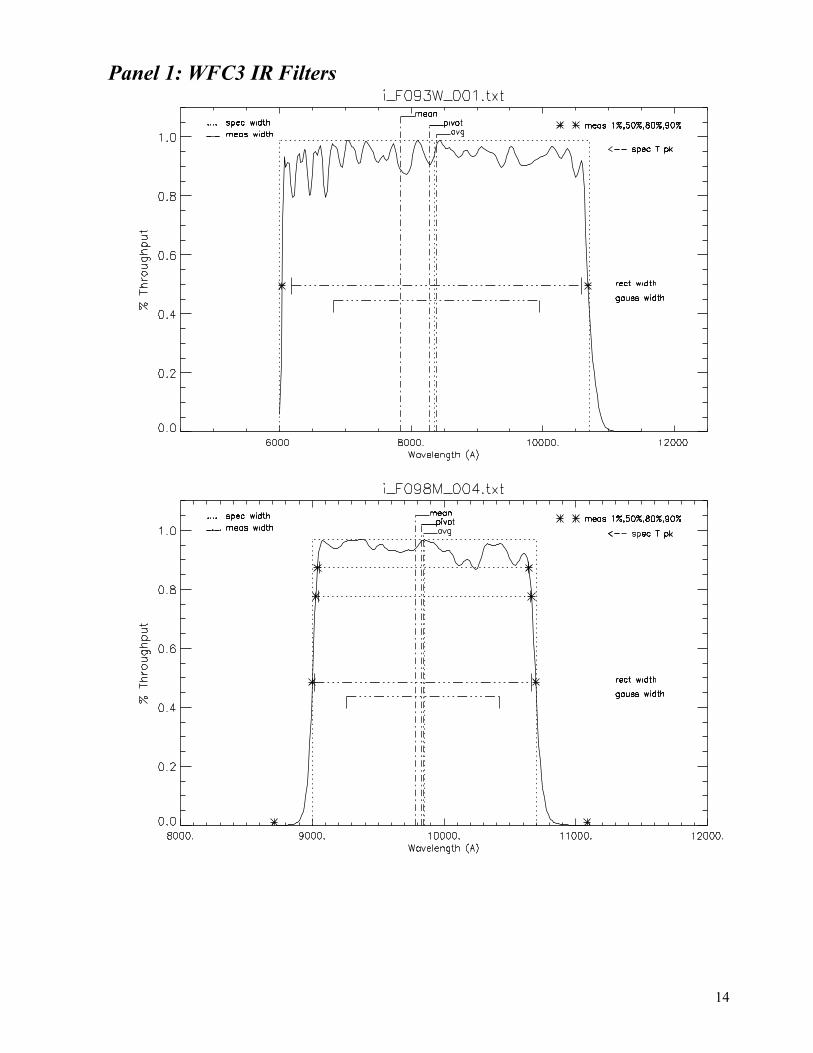
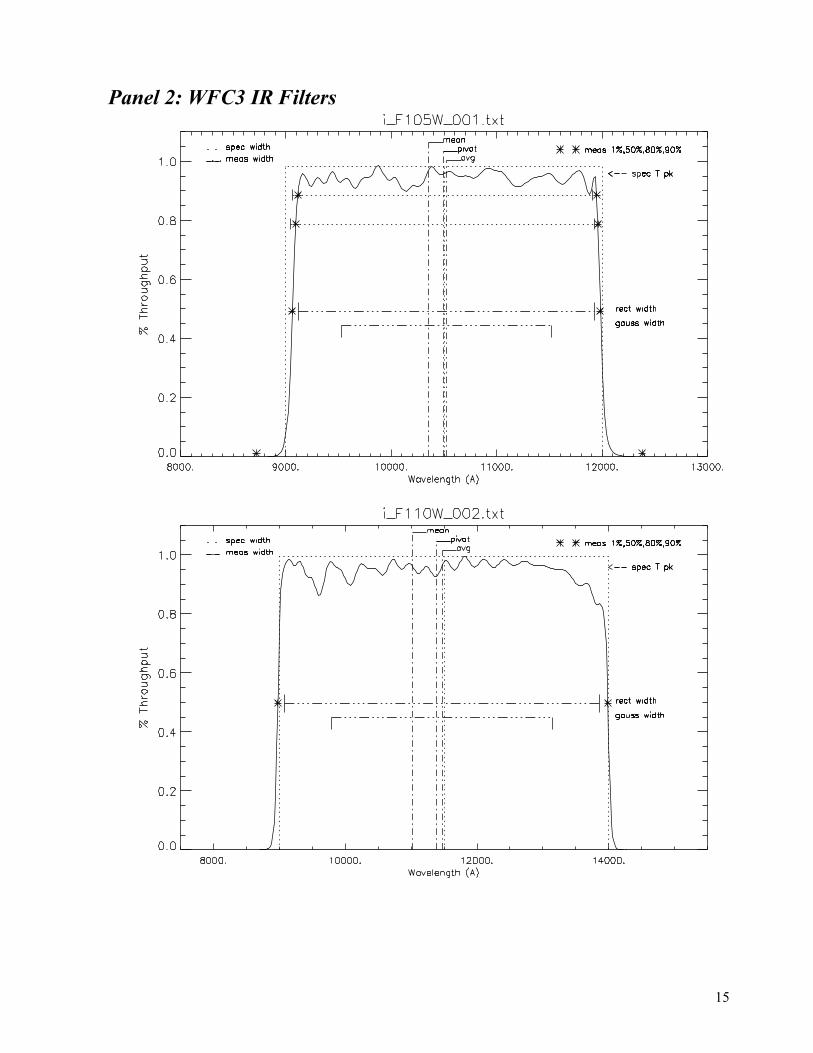
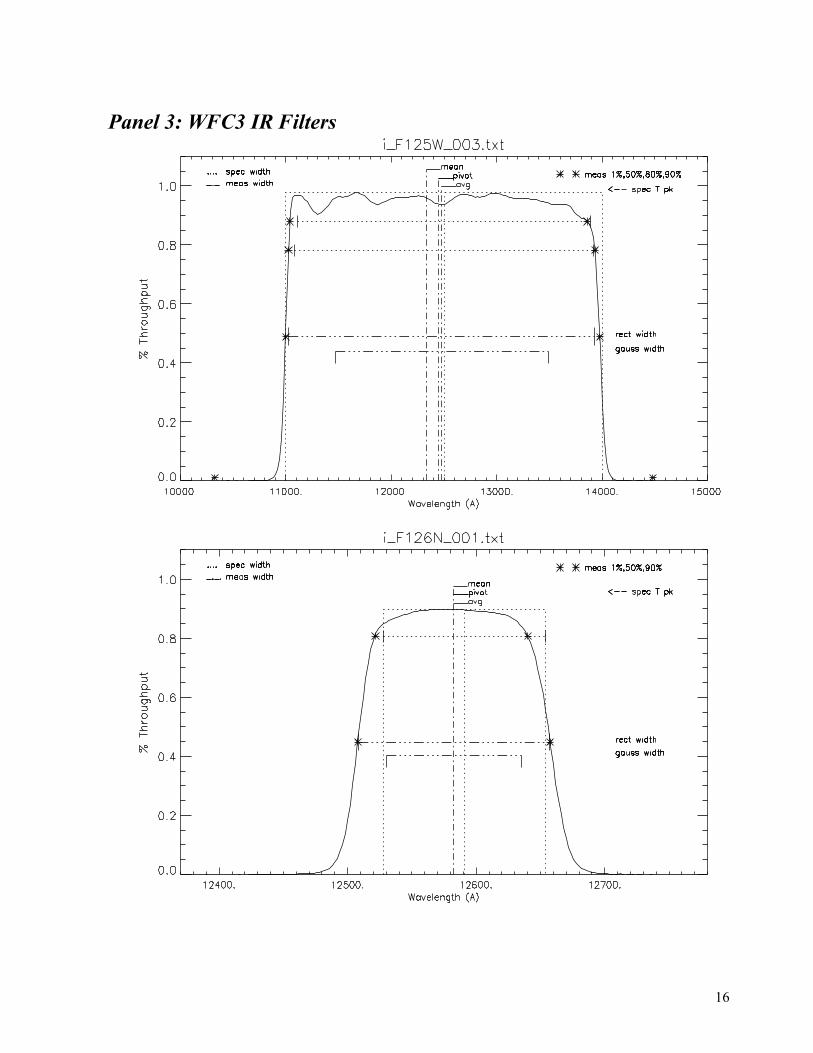
2. Filter Throughput Data The WFC3 IR channel filter wheel contains 17 slots for spectral defining elements. One blank (opaque) slot also on the filter wheel is used to block external light during background calibrations, since the IR channel has no shutter mechanism. Two of the elements are grisms and the remaining 15 are composed of broad, medium, and narrow band filters. The IR grisms, G141 and G102, will be documented in a future ISR. The substrate materials for most of the filters is IR80, an IR grade (non-water absorbing) glass. Acceptance testing was performed at two temperatures, 20C and –40C (+/-5C), the latter being the in-orbit operating temperature of the filters. The requirements state that no deterioration or change of spectral characteristics may be present following temperature cycling from 25 to –40C. Testing procedures, scientific method, and error budget analyses are well established, well documented and consistent with the needs of the WFC3 program. The acceptance and measurement techniques may be found in (Boucarut et al., 2001). 2.1 Panel Annotations Panels 1 through 7 are plots of the measured throughput at the center of each IR filter as a function of wavelength. Design requirements (referred to as ‘spec’) and measured (as-built) and derived parameters are also indicated in the panels. Data for the wide and medium band filters were measured by GSFC in units of 0.002 and 0.001 microns respectively. Narrow band filter throughput was sampled at 0.00025 micron steps over the “in-band” regime and larger step sizes farther out in the wings of the throughput profile. The data were measured at 5 positions on each filter (center, right, left, top, and bottom) and at two temperatures, 296K and 243K. The data presented here are obtained at 296K because the trend with temperature is not appreciable. Spatial trends across the filter, though larger than spec, are within the science requirements and will be characterized in a future ISR. 2.1.1 Spectral Requirements For detailed explanations of the requirements definitions and tolerances, we refer the reader to ISR WFC3-2000-09 (Lupie and Boucarut 2000). Summaries definitions are provided here for convenience. Spectral Performance
2
The spectral performance requirements are given in terms of critical wavelengths, i.e., wavelengths at which the transmittance on either side of the passband equals a certain percentage of the peak, and remains less than that value for all shortward and longward wavelengths. The critical wavelengths include λ +50, λ -50 , λ -80 , λ +80, λ -90 , λ +90 and λ -01 , λ +01 . In each panel, a dotted rectangle outlines the specs for the FWHM defined at the wavelengths where the transmittance is 50% or 90% for wide/medium and
narrow bands, respectively. The height of this rectangle happens to coincide with the measured peak of the filter. The required central wavelength is labeled by the dotted vertical line halfway between the 50% critical wavelengths. One, two, or three horizontal dotted lines intersecting the dotted box identify the wavelengths at which the transmittance is 50% (all filters), 80% (wide and medium only), or 90% (most filters). Exceptions are F093W and F110W where the 50% points are specified in the plots. The blocking and bandpass shapes of these filters, manufacturing materials and techniques are very similar to F125W process. The narrow band specifications emphasize the 50 and 90% critical wavelengths. The required peak throughput, defined as the average absolute transmittance between λ -90 and λ +90, is flagged by an arrow in the panels. Bandpass The width of the bandpass, drawn as a dotted rectangle (FWHM), is defined as [λ -50 - λ +50 ]. For narrow bands, the [λ -90 - λ +90 ] width is a more descriptive and stringent requirement for a rectangular filter. The rectangle is centered on the central wavelength. Central Wavelength The central wavelength stated in the requirements is the “center of mass” of the filter and is defined as the midpoint between either the 50% wavelengths or the 90% wavelengths depending on the filter category, i.e., broad/medium, or narrow. Filter Shape Although not shown on the panels, the required side slopes of the filters were provided to the vendors. The shape of the passband is a function of the number of “cavities” (or layers) in the design of the filter coating. The more cavities, the more square the filter, an advantageous characteristic for science programs. However, increasing the number of cavities also amplifies the peaks and valleys of the transmittance across the wavelength regime. Slopes of wide and medium band filters are calculated using ±5% and ±80% wavelengths, i.e., blue side slope = [λ -80 - λ -05 ]/ λ -05 . Narrow band slopes were calculated using the ±1% and ±90% wavelengths . The maximum slope requirements are 1.5%, 1%, and 0.5% for wide, medium, and narrow band filters respectively. An alternative spec for the narrow band filters, specifically those that have accompanying continuum filters, the size of the overlap region was specified, i.e., the mutually-shared overlap of line and continuum filters (throughput vs wavelength) must be less than 10% of the area of the line filter. Out of Band Blocking Requirements The dynamic range of an instrument can be limited by a poorly designed out-of-band blocking requirement. Vendors require specification of the wavelength where the transmittance and ripples must not exceed the limiting value (e.g., 0.01% or 0.005%). The out-of-band blocking descriptors are not included in this report. 2.1.2 Tolerances The IR Filter Specification document calls out the following tolerance criteria for in-band critical wavelengths:
CriticalWavelengths
WavelengthTolerance
MinimumWavelengthTolerance Application
W-50, W+50 +/-20 A +/-100 A Wide/Medium BandsW-90, W+90 +/-5 A +/-20 A Narrow BandsW-01, W+01 +/-5 A +/-20 A Narrow Bands
3
2.1.2 As-Built Descriptions Spectral Performance Parameters Knowledge of the technique used to manufacture a filter is always infused in the statement of the specifications to the vendors. Modeling of filter coatings and substrate thickness are used to realistically set the performance requirements. This is why the requirements specifications may refer to different parameters depending on the type of filter being manufactured. As an example, for some of the wide band filters, one wavelength edge may be defined by the natural blocking of the color glass substrate used for that filter while the other edge may be sculpted by the type and thickness of the coating on the substrate. For most narrow bands, it is important that the peak of the filter be as flat and ‘square’ as possible. Therefore, specifying the 90% wavelengths is more descriptive to the vendor than providing the 50% FWHM points used to describe wider filters. The measured wavelengths at which the transmittances are 0.01 absolute, 50%, 80%, and 90% of peak are denoted on the panels by a large asterisk and were calculated used a simple linear interpolation between to the two closest points to the specified transmittance. Bandpasss Two filter widths are denoted by horizontal dash-dot-dash lines with end brackets: 1) the full width half maximum of an equivalent Gaussian and 2) the rectangular width of the bandpass. These are labeled in the figures. The rectangular width is more suited for comparison with the FWHM specified in the requirements document. Central Wavelength Three descriptive “central wavelengths” are labeled using vertical dash-dot-dash line: pivot, average, and mean. Each of these three centralized wavelengths provide unique information about the filter’s symmetry in wavelength space or frequency (energy) space. The mean wavelength, (originally described in Schneider, Gunn and Hoessel Ap.J 264,337 and then used to describe WFPC1 and WFCP2 filters), is used by astronomers to indicate the “center of mass” in terms of frequency, i.e., it represents the wavelength halfway between the “frequency” mean of the filter and the wavelength mean (WFPC2 Instrument Handbook – Appendix B, System Throughput Section). The average wavelength is the center of mass with respect to the area in the wavelength domain and is most closely related to the geometric mean wavelength specified in the GSFC requirements document. The pivot wavelength is the center of mass weighted by the inverse of the wavelength.
4
2.2 Table Descriptions 2.2.1 Requirements Specifications Table 1 summarizes the performance requirements as stated in Version B, GSFC Filter Specifications Document (GSFC HST P442-3402) and modified by the change request documentation. The central wavelength and FWHM as specified in the “WFC3 Contract End Item Specifications” (WFC3 STE-66 baselined May 31, 2002) are consistent with the GSFC filter specs in all but two cases, F160W and F105W where the central wavelengths were adjusted for science reasons after the last update of the STE-66. These differences are highlighted in blue shading. The column definitions are as follows: Column 1: F number – filter number designation used by the vendor. Column 2: Science description. Column 3: Filter name. Column 4: Central Wavelength (microns):
[λ -50 - λ +50 ]/2 for wide/medium bands or [λ -90 - λ +90 ]/2 for narrow bands.
Column 5: Central Wavelength (Shifted): [λ +50 - λ -50 ]/2 for wide/medium bands or ([λ -90 - λ +90 ]/2 + δλ) for narrow bands where δλ is a redward shift of 500 km/sec. Wide, medium and continuum narrow band central wavelengths are not redshifted.
Column 6: FWHM (microns): [λ +50 - λ -50 ] or [λ +90 - λ -90 ] for wide/medium and narrow bands respectively.
Column 7: Minimum average transmittance between [λ -90 and λ +90 ]. Column 8: Fractional width (microns) defined as the FWHM divided by the central wavelength Columns 9 through 16: the wavelengths at which the transmittance is the specified percentage of the peak and remains less than that value for all shorter and longer wavelengths (λ -01, λ -50 , λ -80, λ -90 ,
λ +90, λ +80, λ +50, λ +01). Blank cells indicate that the parameter was not describe the filter Table 2 contains the out-of-band blocking requirements for the filter. The column definitions are: Column 1: Filter Name Column 2: Out-of-band blocking on the blue side: below a certain wavelength the transmittance shall not exceed the specified value. Column 3: Wavelength pertaining to the out-of-band blocking requirement. Column 4: Out-of-band blocking on the red side: below a certain wavelength the transmittance shall not exceed the specified value. Column 5: Wavelength pertaining to the out-of-band blocking requirement. 2.2.2 Measurements Table 3 contains descriptive properties of filters as calculated using integrals across the filter bandpasses. Wavelengths are given in Angstroms. The columns and parameter definitions are: Column 1: Filter name. Column 2: File name containing the filter name and the sample number – selected as flight filters. Column 3: Pivot Wavelength – center of mass of the filter weighted by the inverse wavelength according to the following: √[(∫Τ(λ)λdλ)/∫(Τ(λ)dλ/λ) ] where T is the transmittance. Column 4: Bandwidth: RMS bandwidth. Column 5: Equivalent Gaussian FWHM (note - most filters are not Gaussian in shape). Column 6: Peak λ - wavelength of the peak transmittance. Column 7: Peak Transmittance.
5
Column 8: Average Wavelength – straightforward “center of mass” of the filter according to the following: ∫T(λ)λdλ / ∫T(λ)dλ . Column 9: Rectangular Width – area divided by the peak: ∫ [ T(λ)dλ / max(T(λ))] Column 10: Mean (or bar) Wavelength – wavelength of the center of mass in frequency space according to the following: exp[ (∫ T(λ)ln(λ)dλ/λ) / (∫ T(λ)dλ/λ) ]. Table 4 is a summary of the critical wavelengths, the measured FWHM and central wavelengths, and slopes of the filter bandpass: Column 1: Filter name. Column 2 through 9: the wavelengths where the measured transmittance is the specified percentage of the peak (λ -01, λ -50 , λ -80, λ -90 , λ +90, λ+80, λ +50, λ +01 ). Note that the 1% transmittance is an absolute transmittance. Column 10: Measured Central Wavelength using [λ +50 - λ -50 ]/2 or [λ +90 - λ -90 ]/2 for wide/medium and narrow bands respectively. Column 11: Measured FWHM (microns) defined as [λ +50 - λ -50 ] or [λ +90 - λ -90 ] for wide/medium and narrow band filters respectively. Column 12: Measured Transmittance peak. Column 13: Percent Blue-side Slope defined as [λ -90 - λ -50 ]/ λ -50 . Although we provide a single definition for the Blue slope here, the vendors were actually given several unique (stringent) instructions for many of the filters. For the purposes of this documentation, we provide the “pseudo-slope” using the 50% points instead of the 15 or 5%, points for illustration. Column 14: Percent Red-side Slope defined as [λ +90 - λ +50 ]/ λ +50. See explanation for Col. 13. 2.2.3 Comparison: Spec to As-Built The specs, in several cases, were designed to push the limit of manufacturing capability, i.e., manufacturers were to interpret the specs as guidelines for ultimate performance goals. Table 5 lists differences between spec and as-built performance parameters: Column 1: Filter Name. Columns 2 though 7: Differences between the spec and as-built critical wavelengths. The critical wavelengths are those at which the measured transmittance is the specified percentage of the peak. Blank cells indicate that the corresponding specification was not used for that filter. Column 8: Delta Central Wavelength: difference between the spec and as-built Central Wavelength using [λ +50 - λ -50 ]/2 or [λ +90 - λ -90 ]/2 for wide/medium and narrow bands respectively. Column 9: Difference between the measured and as-built FWHM (microns) defined as [λ +50 - λ -50 ] or [λ +90 - λ -90 ] for wide/medium and narrow filters, respectively. Column 10: Comparison of the spec and as-built peak transmittances. Column 11: Difference between the measured “average wavelength” and the spec central wavelength, where the average wavelength is the straightforward “center of mass” of the filter according to the following: ∫T(λ)λdλ / ∫T(λ)dλ . The average wavelength is given in Table 3. 3. As-Built Throughput Conformance - Discussion
6
The Contract End Item Specifications for the IR Filters are given in sections 4.4.6 of STE-66, version May 31, 2002. The requirement states that the channel should include at least 15 with a goal of 20 selectable spectral defining elements (CEI-Table 4-7, and see Table 1 in this ISR columns 3 and 4). Tolerances on the central wavelength and width are specified in the GSFC design requirements. All parties share the understanding that the vendor was to perform “best effort” especially since many of the
filters (and filter quality) are quite unique. Ultimately, the Science Oversight Committee has determined whether a filter fit the particular science need. As a compromise for the purposes of an overall performance verification, a tolerance has been adopted to identify those filters whose performance spec satisfy the needs of the science community but do not conform completely to the performance specifications. Wide and Medium Bands The tolerances on the critical wavelengths for the wide bands are ±100A with a goal of ±20A (best effort) and measurements were made in increments of 20A and 10A for the wide and medium filters respectively. Table 5 demonstrates that 50,80, and 90% critical wavelengths are well within the 100A tolerance. The 50% critical wavelengths of all but F105W is within a factor of 2 of the 20 A goal. The 1% absolute points measured by GSFC are not included in Table 5 but are in conformance with the scientific requirements. Narrow Band The critical wavelengths that best describe the narrow bands are the 1% and 90% points. The tolerances on the critical wavelengths are ±20A with a goal of ±5A (best effort) and measurements were made in increments of ~2.5A in the in-band regime of the filter. Table 5 demonstrates that 90% critical wavelengths are well within the 20A tolerance and the central wavelength and FWHM also meet the scientific specification. The 1% absolute points measured by GSFC are not included in Table 5 but are in conformance with the scientific requirements. 4. Types of Elements, Image Displacement and Transmitted Wavefront The Contract End Item Specifications for the IR Filter elements given in sections 4.4.6 of STE-66, also include the image quality, parfocality condition, wedge, types of elements and their location in the optical train. 4.1 Section 4.4.6.1 and 4.4.6.2 CEI: Types and Numbers of IR Spectral Elements The CEI requires at least 15 selectable spectral defining elements (with a goal of 20) in the WFC3 IR channel as listed in the CEI Table 4-7 (see Table 1 in this ISR columns 3 and 4). There are indeed 17 selectable spectral defining elements. Two of these are grisms and the remaining 15 are composed of broad, medium, and narrow filters. 4.2 Section 4.4.6.4 CEI: Performance of Spectral Elements - Image Quality, Parfocality, Wedge Additional performance requirements state that a mounted filter must not displace the image by more than 0.2 detector pixels or degrade image quality by more than 0.02 waves at 633 nm of transmitted wavefront before mounting in the filter wheel. This requirement guarantees positional and performance consistency between measurements obtained with different filters. The GSFC Requirements detail the focus shift, wedge, and transmitted wave front. The focus shift of each filter must equal the focus shift of a 4.0 mm thick plano/plano IR fused silica substrate at wavelengths 6330 Angstroms (refractive index 1.450416). The focus shift equation insures the parfocality of the filters: K = (n-1)t /n = 1.242171 where n is the index of the substrate at 1 micron and t = 4mm. The allowable wedge is specified as 10 arcsec or less across 22 mm aperture. The results of the GSFC and vendor measurements of the focus shift, transmitted wavefront, were provided by Boucarut (private communication). Table 6 contains the thickness and measured wavefront. Each individual substrate wedge was measured prior to the filter manufacturing process at two positions. From these numbers we can derive an upper limit on the wedge properties of the filter. Measurements of the reflected wavefront for all but two of the 7
filters were made on each side of the filter. For filters F110W and F125W, the transmitted wavefront was measured. The columns in Table 6 are defined as follows: Column1: Filter Name. Column 2: Filter Sample Number. Columns 3 and 4: Filter thickness in (mm) at two positions on the filter. Column 5: Filter Diameter (mm). Columns 6 and 7: Reflected (or Transmitted for F110W and F125W) Wavefront RMS over the full clear aperture of 22mm. 5. Summary We have described the as-built characteristics of the IR filters and compared some basic design requirements to measured parameters. The filter construction and properties conform the needs of the WFC3 Design Reference Mission and anticipated WFC3 science programs. This ISR focuses on the basic filter throughput and bandpass characteristics. Future ISRs will describe the spatial trends across the filters, the grisms, and the out of band blocking conformance. Acknowledgements: The authors wish to thank Sharon Struss (GSFC) for providing the measured throughput data on the filters and additional supporting information. The authors also wish to thank the WFC3 SOC, the Science IPT for their input, John Trauger and Nasrat Raouf for their support with the IR filter program. Finally, we thank the vendor Barr Associates, particularly George Allen for his dedication to making the best filters for WFC3. References: Boucarut, R. 2003. GSFC P-442-3402 “WFC3 Infrared Filter Requirements Document” Boucarut, Rene A., Quijada, Manuel A., Lupie, Olivia L., Struss, Sharon M., Miner, Linda A. , 2001, “Characterization of infrared filters for the wide-field camera 3 of Hubble Space Telescope” - Proc SPIE Vol. 4441, p 142-153, 2001. Boucarut, Rene A., Quijada, Manuel A., Lupie, Olivia L., Struss, Sharon M., Miner, Linda A. “Optical performance of infrared filters and grisms for the Wide Field Camera 3 of the HST ” – presented at SPIE: IR Space Telescopes and Instrumentation, Waikoloa, HI 2002. Lupie, O. L. 2002, WFC3 ISR2002-10: WFC3 IR and UVIS Filter Wheel Slot Assignments. Lupie, O. L. and Boucarut, R. 2000, WFC3 ISR2000-09 “WFC3 Filter Selection Process – Part III, IR Filter Requirements”. Lupie, O., Hanley, C., Nelan, J. 2000, WFC3 ISR2000-08 “WFC3 Filter Selection Process – Part II, WFC3 Compendium of Community Input”. Lupie, O., Hanley, C. 2000 WFC3 ISR2000-07 “WFC3 Filter Selection Process – Part I, HST Historical Filter Usage”. Mackenty, J. , Contract End Item Specifications, STE-66, version May 31, 2002. Trauger, J. T. 2001, WFC3 UVIS Filter Specifications, JPL – Version D, Nov 2001. Turner-Valle, J. 1999, SER OPT-015, “WFC3 Optical Filter Requirements.” 8
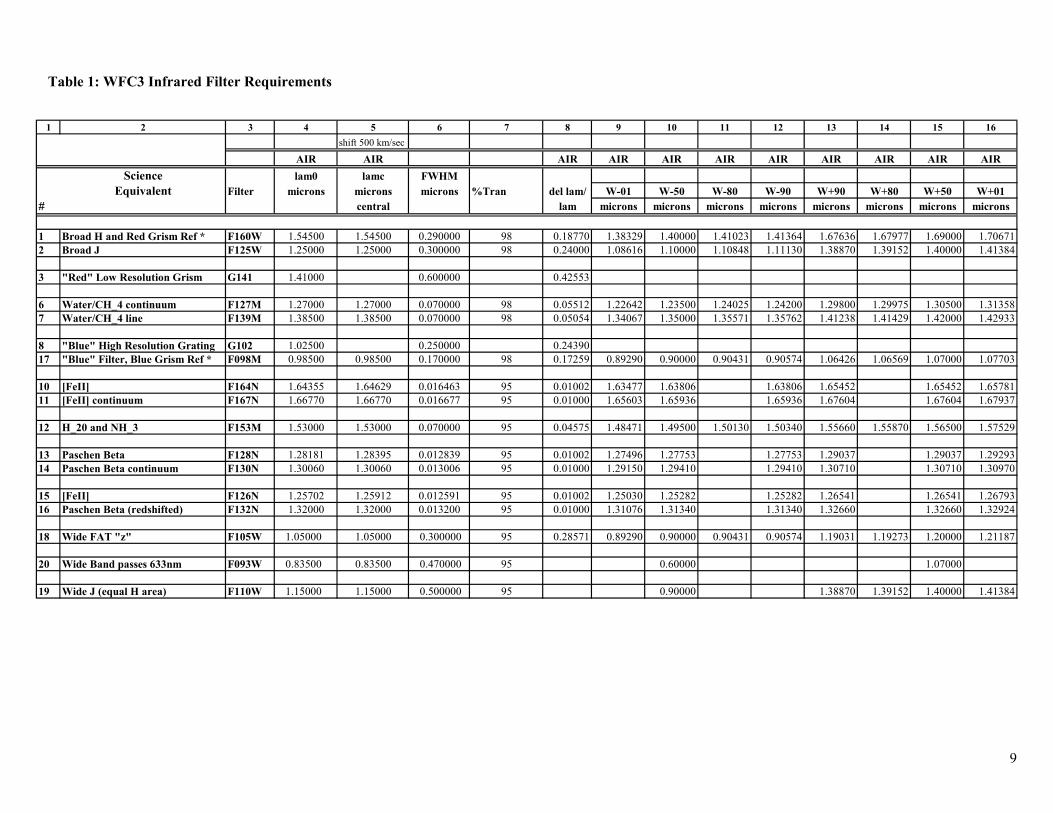
Table 1: WFC3 Infrared Filter Requirements
1 2 3 4 5 6 7 8 9 10 11 12 13 14 15 16
shift 500 km/sec
AIR AIR AIR AIR AIR AIR AIR AIR AIR AIR AIRScience lam0 lamc FWHM
Equivalent Filter microns microns microns %Tran del lam/ W-01 W-50 W-80 W-90 W+90 W+80 W+50 W+01# central lam microns microns microns microns microns microns microns microns
1 Broad H and Red Grism Ref * F160W 1.54500 1.54500 0.290000 98 0.18770 1.38329 1.40000 1.41023 1.41364 1.67636 1.67977 1.69000 1.706712 Broad J F125W 1.25000 1.25000 0.300000 98 0.24000 1.08616 1.10000 1.10848 1.11130 1.38870 1.39152 1.40000 1.41384
3 "Red" Low Resolution Grism G141 1.41000 0.600000 0.42553
6 Water/CH_4 continuum F127M 1.27000 1.27000 0.070000 98 0.05512 1.22642 1.23500 1.24025 1.24200 1.29800 1.29975 1.30500 1.313587 Water/CH_4 line F139M 1.38500 1.38500 0.070000 98 0.05054 1.34067 1.35000 1.35571 1.35762 1.41238 1.41429 1.42000 1.42933
8 "Blue" High Resolution Grating G102 1.02500 0.250000 0.2439017 "Blue" Filter, Blue Grism Ref * F098M 0.98500 0.98500 0.170000 98 0.17259 0.89290 0.90000 0.90431 0.90574 1.06426 1.06569 1.07000 1.07703
10 [FeII] F164N 1.64355 1.64629 0.016463 95 0.01002 1.63477 1.63806 1.63806 1.65452 1.65452 1.6578111 [FeII] continuum F167N 1.66770 1.66770 0.016677 95 0.01000 1.65603 1.65936 1.65936 1.67604 1.67604 1.67937
12 H_20 and NH_3 F153M 1.53000 1.53000 0.070000 95 0.04575 1.48471 1.49500 1.50130 1.50340 1.55660 1.55870 1.56500 1.57529
13 Paschen Beta F128N 1.28181 1.28395 0.012839 95 0.01002 1.27496 1.27753 1.27753 1.29037 1.29037 1.2929314 Paschen Beta continuum F130N 1.30060 1.30060 0.013006 95 0.01000 1.29150 1.29410 1.29410 1.30710 1.30710 1.30970
15 [FeII] F126N 1.25702 1.25912 0.012591 95 0.01002 1.25030 1.25282 1.25282 1.26541 1.26541 1.2679316 Paschen Beta (redshifted) F132N 1.32000 1.32000 0.013200 95 0.01000 1.31076 1.31340 1.31340 1.32660 1.32660 1.32924
18 Wide FAT "z" F105W 1.05000 1.05000 0.300000 95 0.28571 0.89290 0.90000 0.90431 0.90574 1.19031 1.19273 1.20000 1.21187
20 Wide Band passes 633nm F093W 0.83500 0.83500 0.470000 95 0.60000 1.07000
19 Wide J (equal H area) F110W 1.15000 1.15000 0.500000 95 0.90000 1.38870 1.39152 1.40000 1.41384
9
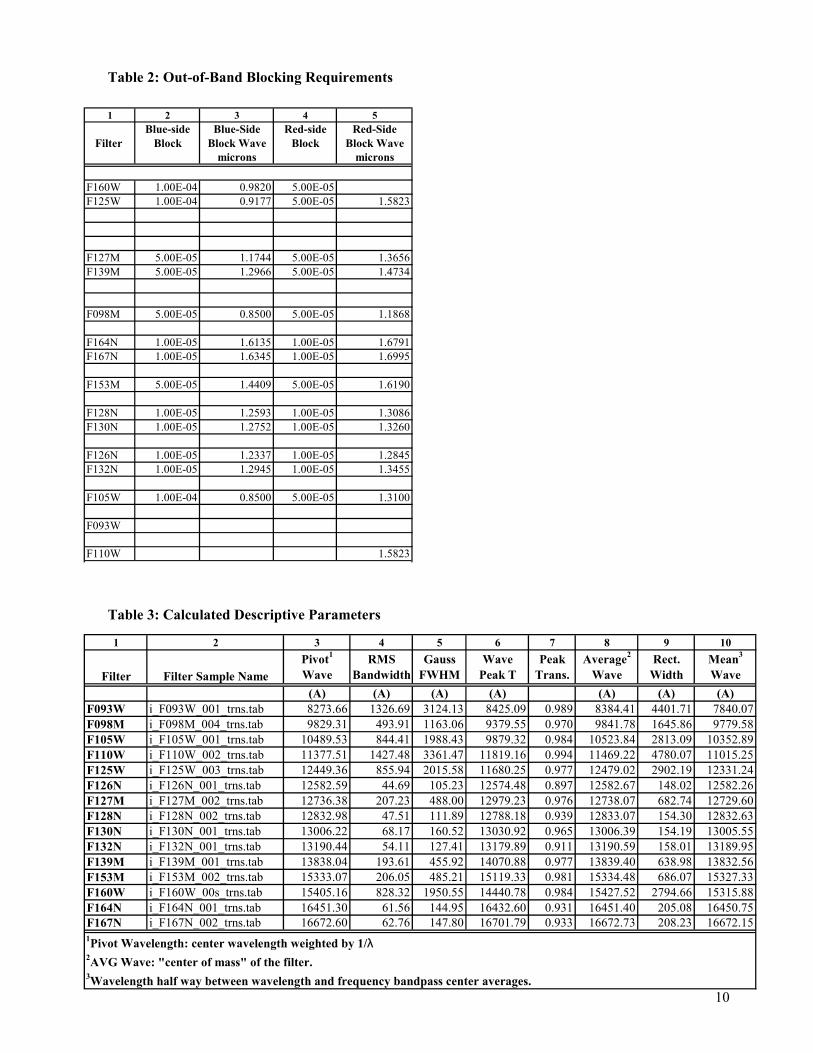
Table 2: Out-of-Band Blocking Requirements
1 2 3 4 5Blue-side Blue-Side Red-side Red-Side
Filter Block Block Wave Block Block Wavemicrons microns
F160W 1.00E-04 0.9820 5.00E-05F125W 1.00E-04 0.9177 5.00E-05 1.5823
F127M 5.00E-05 1.1744 5.00E-05 1.3656F139M 5.00E-05 1.2966 5.00E-05 1.4734
F098M 5.00E-05 0.8500 5.00E-05 1.1868
F164N 1.00E-05 1.6135 1.00E-05 1.6791F167N 1.00E-05 1.6345 1.00E-05 1.6995
F153M 5.00E-05 1.4409 5.00E-05 1.6190
F128N 1.00E-05 1.2593 1.00E-05 1.3086F130N 1.00E-05 1.2752 1.00E-05 1.3260
F126N 1.00E-05 1.2337 1.00E-05 1.2845F132N 1.00E-05 1.2945 1.00E-05 1.3455
F105W 1.00E-04 0.8500 5.00E-05 1.3100
F093W
F110W 1.5823
Table 3: Calculated Descriptive Parameters
10
1 2 3 4 5 6 7 8 9
Filter Filter Sample NamePivot1
WaveRMS
BandwidthGauss
FWHMWave
Peak TPeak
Trans.Average2
WaveRect.
WidthMean3
Wave(A) (A) (A) (A) (A) (A) (A)
F093W i_F093W_001_trns.tab 8273.66 1326.69 3124.13 8425.09 0.989 8384.41 4401.71 7840.07F098M i_F098M_004_trns.tab 9829.31 493.91 1163.06 9379.55 0.970 9841.78 1645.86 9779.58F105W i_F105W_001_trns.tab 10489.53 844.41 1988.43 9879.32 0.984 10523.84 2813.09 10352.89F110W i_F110W_002_trns.tab 11377.51 1427.48 3361.47 11819.16 0.994 11469.22 4780.07 11015.25F125W i_F125W_003_trns.tab 12449.36 855.94 2015.58 11680.25 0.977 12479.02 2902.19 12331.24F126N i_F126N_001_trns.tab 12582.59 44.69 105.23 12574.48 0.897 12582.67 148.02 12582.26F127M i_F127M_002_trns.tab 12736.38 207.23 488.00 12979.23 0.976 12738.07 682.74 12729.60F128N i_F128N_002_trns.tab 12832.98 47.51 111.89 12788.18 0.939 12833.07 154.30 12832.63F130N i_F130N_001_trns.tab 13006.22 68.17 160.52 13030.92 0.965 13006.39 154.19 13005.55F132N i_F132N_001_trns.tab 13190.44 54.11 127.41 13179.89 0.911 13190.59 158.01 13189.95F139M i_F139M_001_trns.tab 13838.04 193.61 455.92 14070.88 0.977 13839.40 638.98 13832.56F153M i_F153M_002_trns.tab 15333.07 206.05 485.21 15119.33 0.981 15334.48 686.07 15327.33F160W i_F160W_00s_trns.tab 15405.16 828.32 1950.55 14440.78 0.984 15427.52 2794.66 15315.88F164N i_F164N_001_trns.tab 16451.30 61.56 144.95 16432.60 0.931 16451.40 205.08 16450.75F167N i_F167N_002_trns.tab 16672.60 62.76 147.80 16701.79 0.933 16672.73 208.23 16672.151Pivot Wavelength: center wavelength weighted by 1/λ2AVG Wave: "center of mass" of the filter.3Wavelength half way between wavelength and frequency bandpass center averages.
10
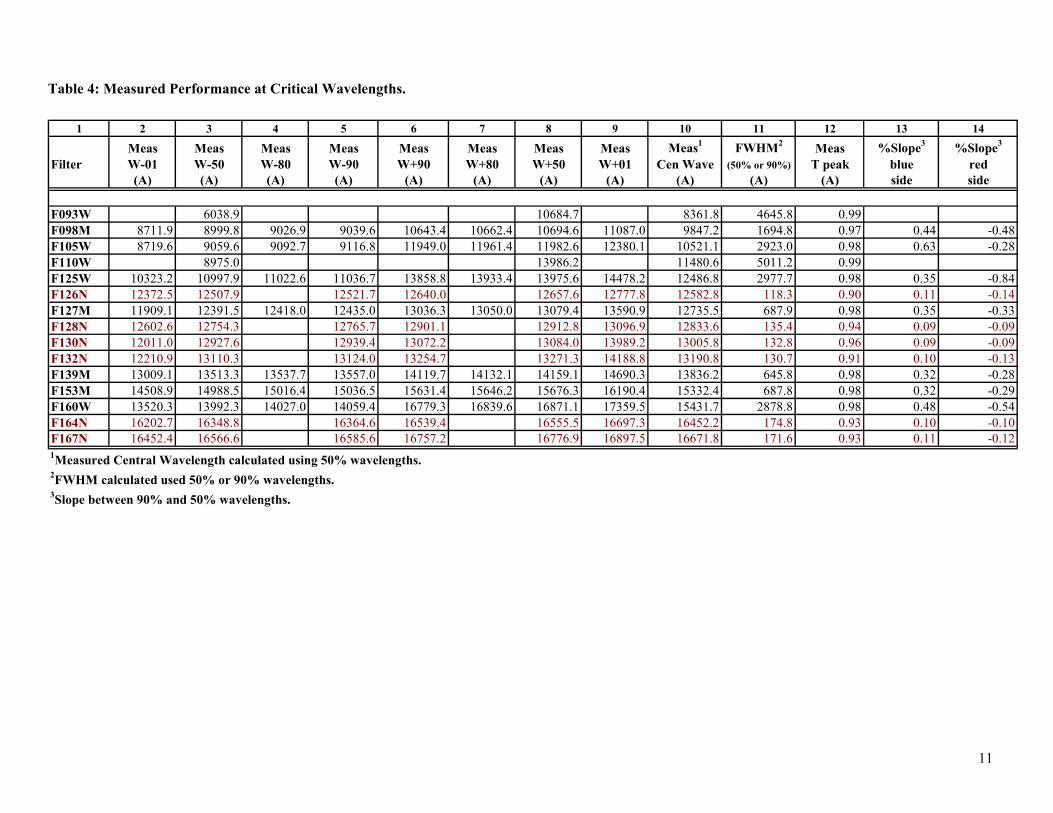
Table 4: Measured Performance at Critical Wavelengths.
1 2 3 4 5 6 7 8 9 10 11 12 13 14
Meas Meas Meas Meas Meas Meas Meas Meas Meas1 FWHM2 Meas %Slope3 %Slope3
Filter W-01 W-50 W-80 W-90 W+90 W+80 W+50 W+01 Cen Wave (50% or 90%) T peak blue red(A) (A) (A) (A) (A) (A) (A) (A) (A) (A) (A) side side
F093W 6038.9 10684.7 8361.8 4645.8 0.99F098M 8711.9 8999.8 9026.9 9039.6 10643.4 10662.4 10694.6 11087.0 9847.2 1694.8 0.97 0.44 -0.48F105W 8719.6 9059.6 9092.7 9116.8 11949.0 11961.4 11982.6 12380.1 10521.1 2923.0 0.98 0.63 -0.28F110W 8975.0 13986.2 11480.6 5011.2 0.99F125W 10323.2 10997.9 11022.6 11036.7 13858.8 13933.4 13975.6 14478.2 12486.8 2977.7 0.98 0.35 -0.84
12418.0 13050.0
13537.7 14132.1F153M 14508.9 14988.5 15016.4 15036.5 15631.4 15646.2 15676.3 16190.4 15332.4 687.8 0.98 0.32 -0.29F160W 13520.3 13992.3 14027.0 14059.4 16779.3 16839.6 16871.1 17359.5 15431.7 2878.8 0.98 0.48 -0.54
1Measured Central Wavelength calculated using 50% wavelengths. 2FWHM calculated used 50% or 90% wavelengths.3Slope between 90% and 50% wavelengths.
F126N 12372.5 12507.9 12521.7 12640.0 12657.6 12777.8 12582.8 118.3 0.90 0.11 -0.14F127M 11909.1 12391.5 12435.0 13036.3 13079.4 13590.9 12735.5 687.9 0.98 0.35 -0.33F128N 12602.6 12754.3 12765.7 12901.1 12912.8 13096.9 12833.6 135.4 0.94 0.09 -0.09F130N 12011.0 12927.6 12939.4 13072.2 13084.0 13989.2 13005.8 132.8 0.96 0.09 -0.09F132N 12210.9 13110.3 13124.0 13254.7 13271.3 14188.8 13190.8 130.7 0.91 0.10 -0.13F139M 13009.1 13513.3 13557.0 14119.7 14159.1 14690.3 13836.2 645.8 0.98 0.32 -0.28
F164N 16202.7 16348.8 16364.6 16539.4 16555.5 16697.3 16452.2 174.8 0.93 0.10 -0.10F167N 16452.4 16566.6 16585.6 16757.2 16776.9 16897.5 16671.8 171.6 0.93 0.11 -0.12
11
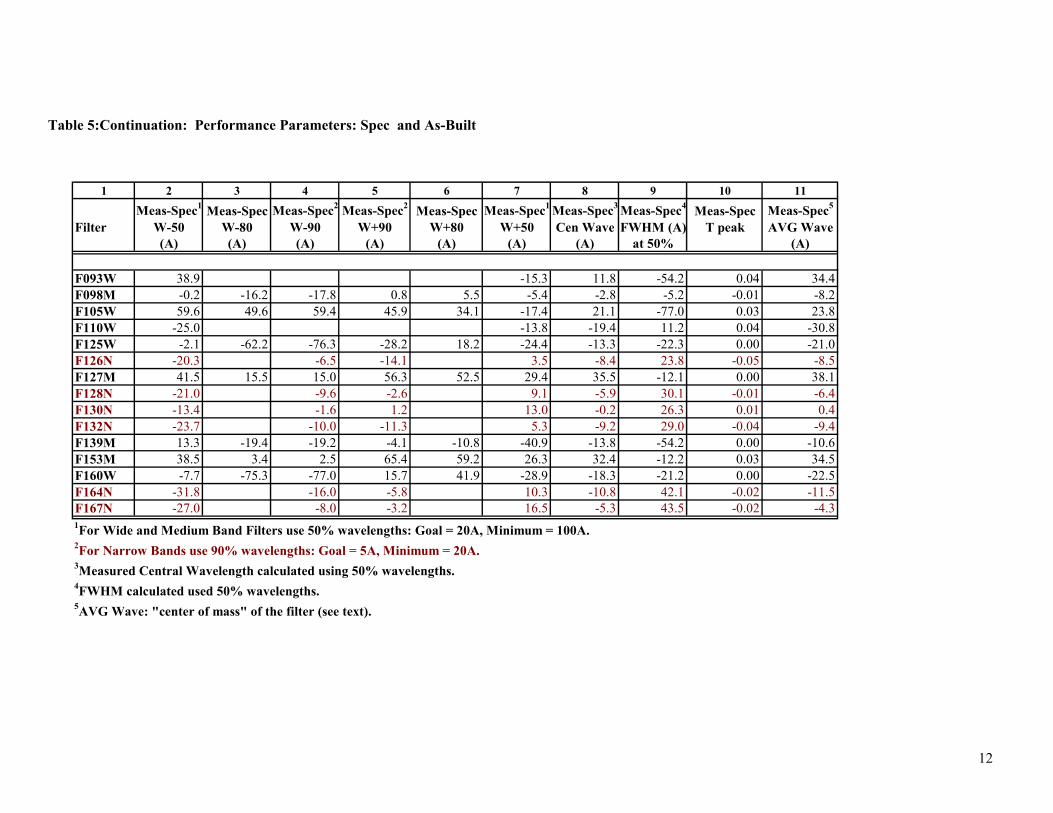
Table 5:Continuation: Performance Parameters: Spec and As-Built
1 2 3 4 5 6 7 8 9 10 11
Meas-Spec1 Meas-Spec Meas-Spec2 Meas-Spec2 Meas-Spec Meas-Spec1 Meas-Spec3 Meas-Spec4 Meas-Spec Meas-Spec5
Filter W-50 W-80 W-90 W+90 W+80 W+50 Cen Wave FWHM (A) T peak AVG Wave(A) (A) (A) (A) (A) (A) (A) at 50% (A)
F093W 38.9 -15.3 11.8 -54.2 0.04 34.4F098M -0.2 -16.2 -17.8 0.8 5.5 -5.4 -2.8 -5.2 -0.01 -8.2F105W 59.6 49.6 59.4 45.9 34.1 -17.4 21.1 -77.0 0.03 23.8F110W -25.0 -13.8 -19.4 11.2 0.04 -30.8F125W -2.1 -62.2 -76.3 -28.2 18.2 -24.4 -13.3 -22.3 0.00 -21.0
15.5 52.5 2 -
-19.4 -10.8 -4 - - -F153M 38.5 3.4 2.5 65.4 59.2 26.3 32.4 -12.2 0.03 34.5F160W -7.7 -75.3 -77.0 15.7 41.9 -28.9 -18.3 -21.2 0.00 -22.5
1For Wide and Medium Band Filters use 50% wavelengths: Goal = 20A, Minimum = 100A.
3Measured Central Wavelength calculated using 50% wavelengths. 4FWHM calculated used 50% wavelengths.5AVG Wave: "center of mass" of the filter (see text).
F126N -20.3 -6.5 -14.1 3.5 -8.4 23.8 -0.05 -8.5F127M 41.5 15.0 56.3 9.4 35.5 12.1 0.00 38.1F128N -21.0 -9.6 -2.6 9.1 -5.9 30.1 -0.01 -6.4F130N -13.4 -1.6 1.2 13.0 -0.2 26.3 0.01 0.4F132N -23.7 -10.0 -11.3 5.3 -9.2 29.0 -0.04 -9.4F139M 13.3 -19.2 -4.1 0.9 13.8 54.2 0.00 10.6
F164N -31.8 -16.0 -5.8 10.3 -10.8 42.1 -0.02 -11.5F167N -27.0 -8.0 -3.2 16.5 -5.3 43.5 -0.02 -4.3
2For Narrow Bands use 90% wavelengths: Goal = 5A, Minimum = 20A.
12
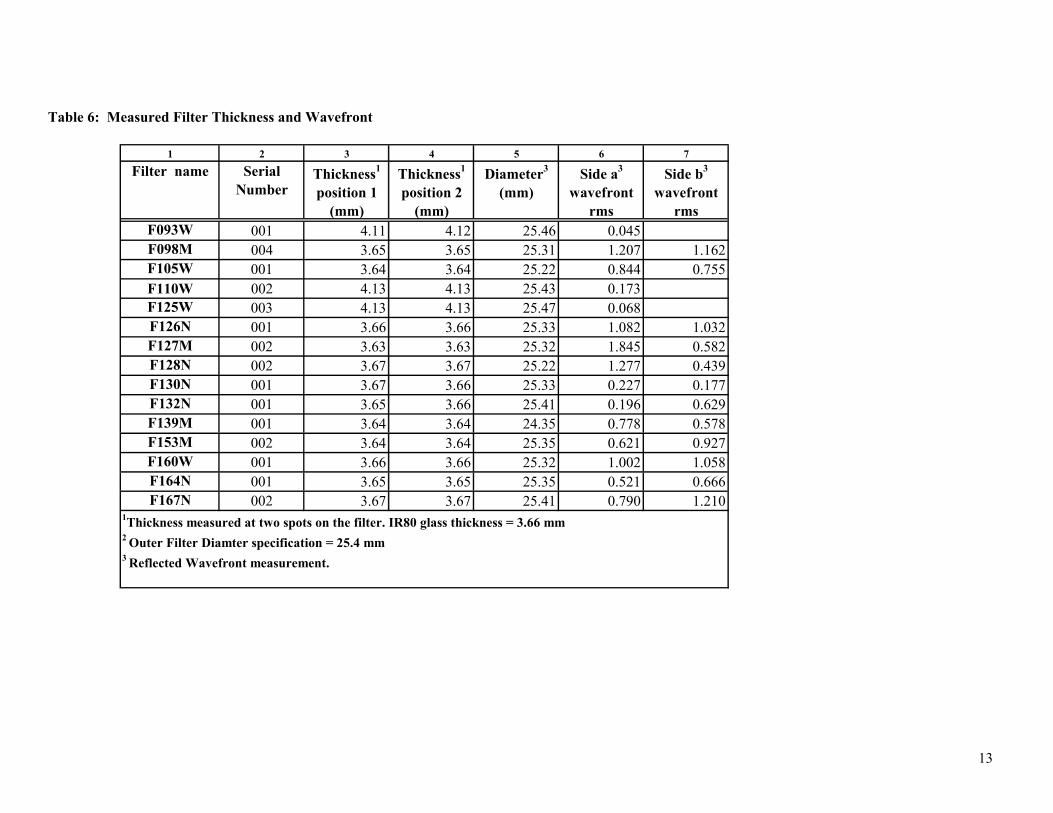
Table 6: Measured Filter Thickness and Wavefront
ameter
1 2 3 4 5 6 7
Filter name Serial Number
Thickness1
position 1(mm)
Thickness1
position 2(mm)
Di 3
(mm)Side a3
wavefront rms
Side b3
wavefront rms
F093W 001 4.11 4.12 25.46 0.045F098M 004 3.65 3.65 25.31 1.207 1.162F105W 001 3.64 3.64 25.22 0.844 0.755F110W 002 4.13 4.13 25.43 0.173F125W 003 4.13 4.13 25.47 0.068F126N 001 3.66 3.66 25.33 1.082 1.032F127M 002 3.63 3.63 25.32 1.845 0.582F128N 002 3.67 3.67 25.22 1.277 0.439F130N 001 3.67 3.66 25.33 0.227 0.177F132N 001 3.65 3.66 25.41 0.196 0.629F139M 001 3.64 3.64 24.35 0.778 0.578F153M 002 3.64 3.64 25.35 0.621 0.927F160W 001 3.66 3.66 25.32 1.002 1.058F164N 001 3.65 3.65 25.35 0.521 0.666F167N 002 3.67 3.67 25.41 0.790 1.210
1Thickness measured at two spots on the filter. IR80 glass thickness = 3.66 mm2 Outer Filter Diamter specification = 25.4 mm3 Reflected Wavefront measurement.
13
Panel 1: WFC3 IR Filters
14
Panel 2: WFC3 IR Filters
15
Panel 3: WFC3 IR Filters
16
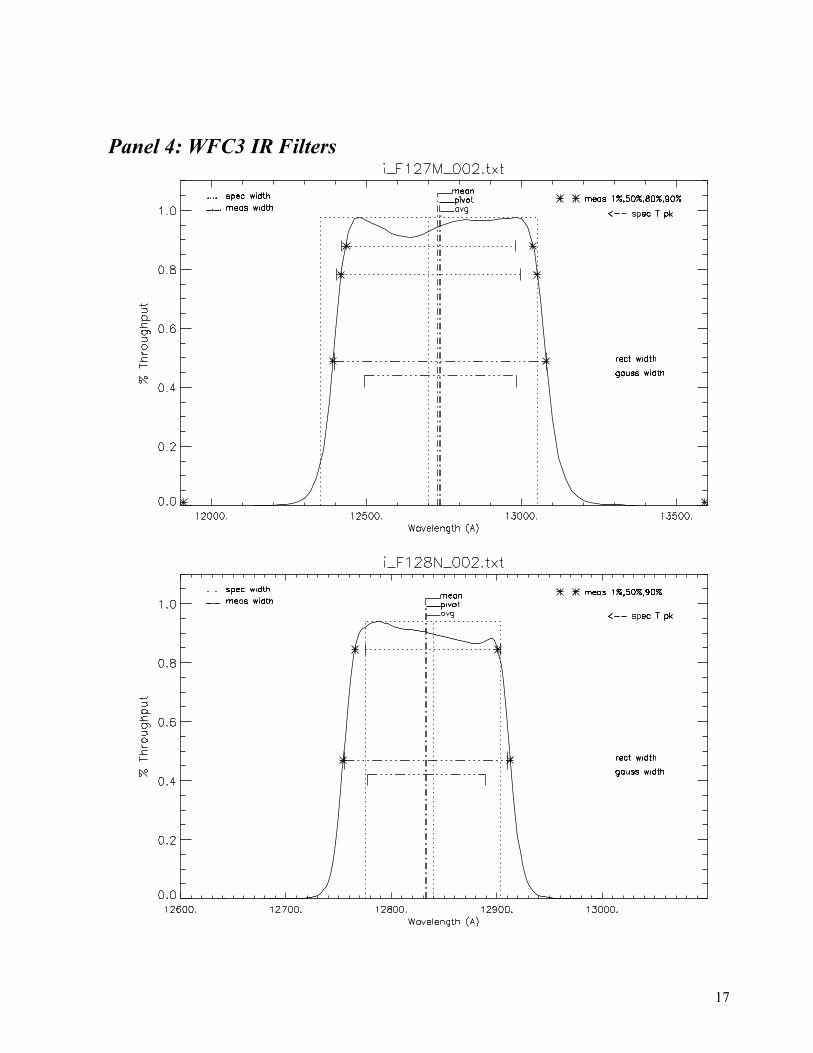
Panel 4: WFC3 IR Filters
17
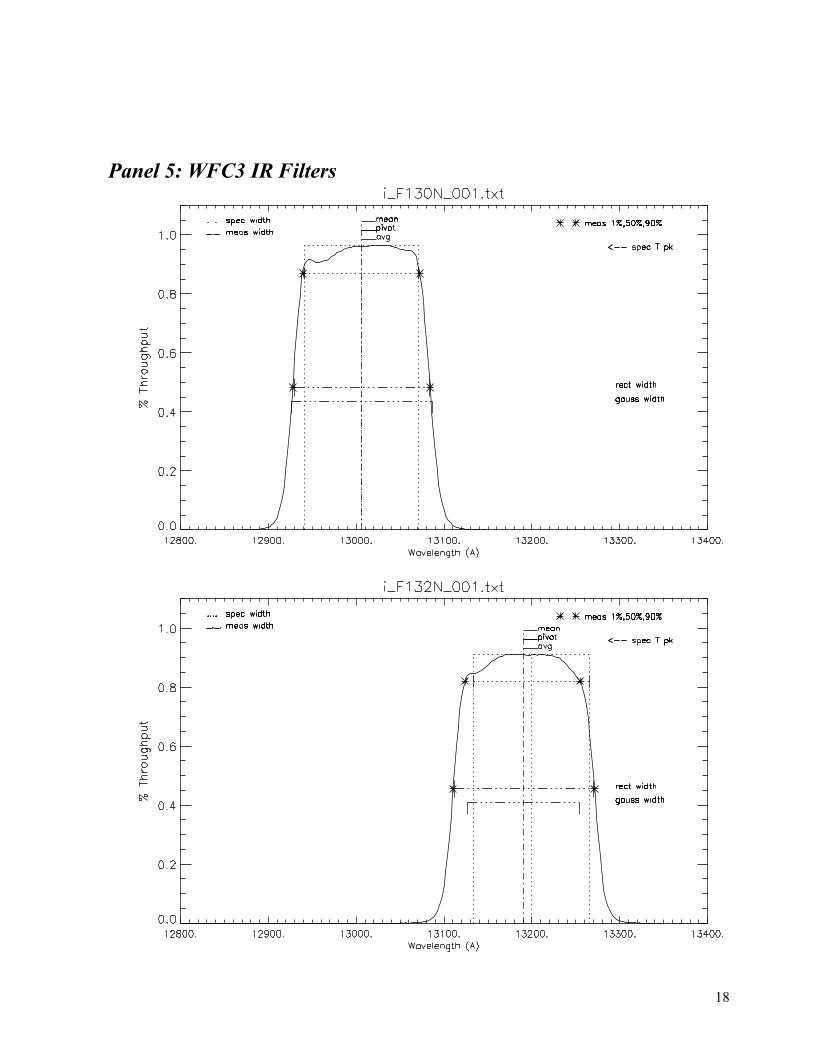
Panel 5: WFC3 IR Filters
18
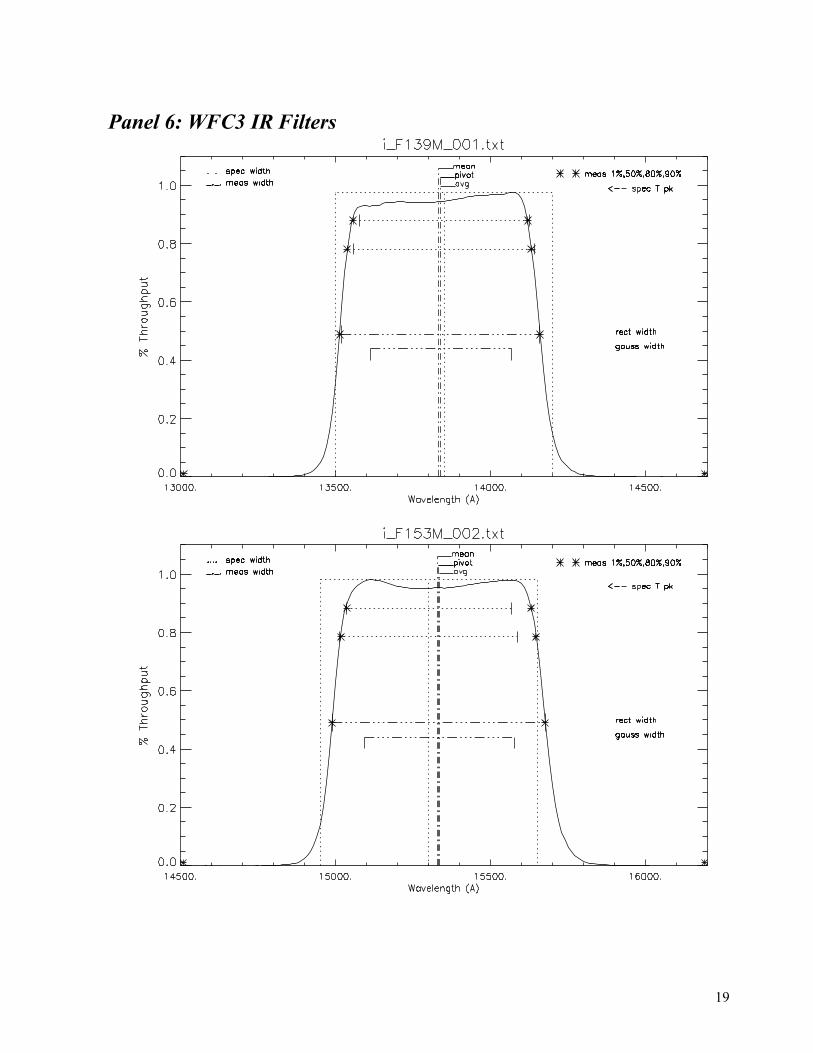
Panel 6: WFC3 IR Filters
19
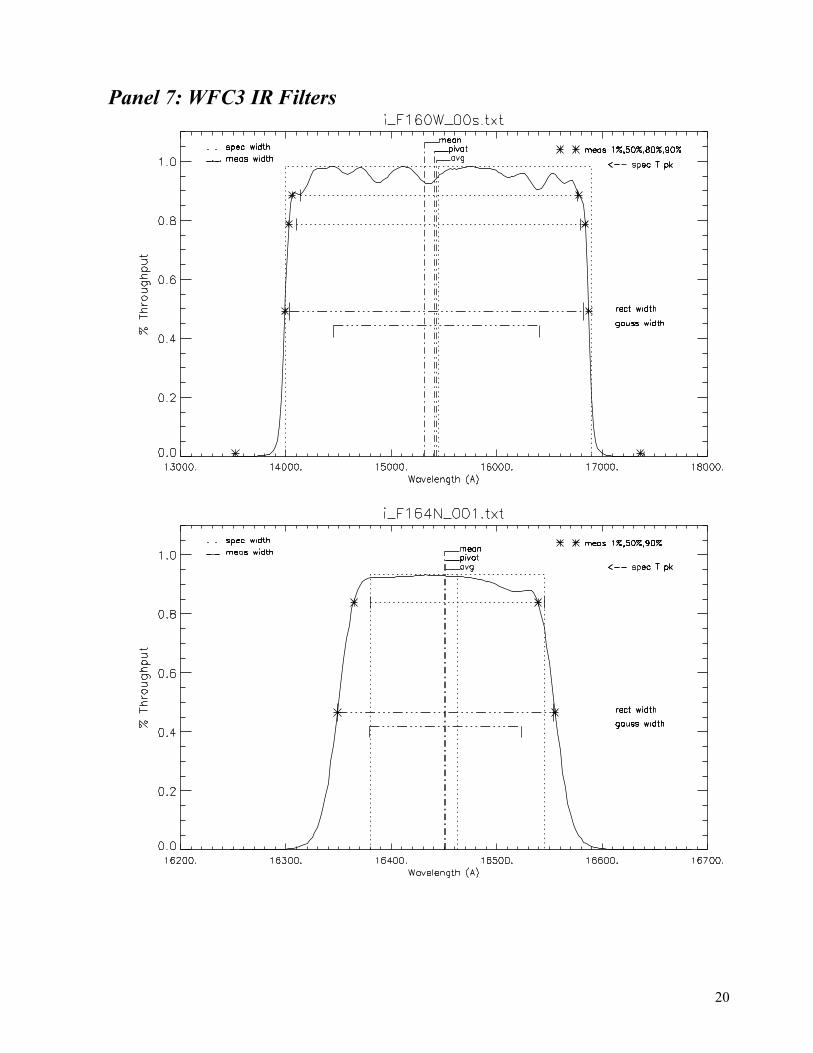
Panel 7: WFC3 IR Filters
20
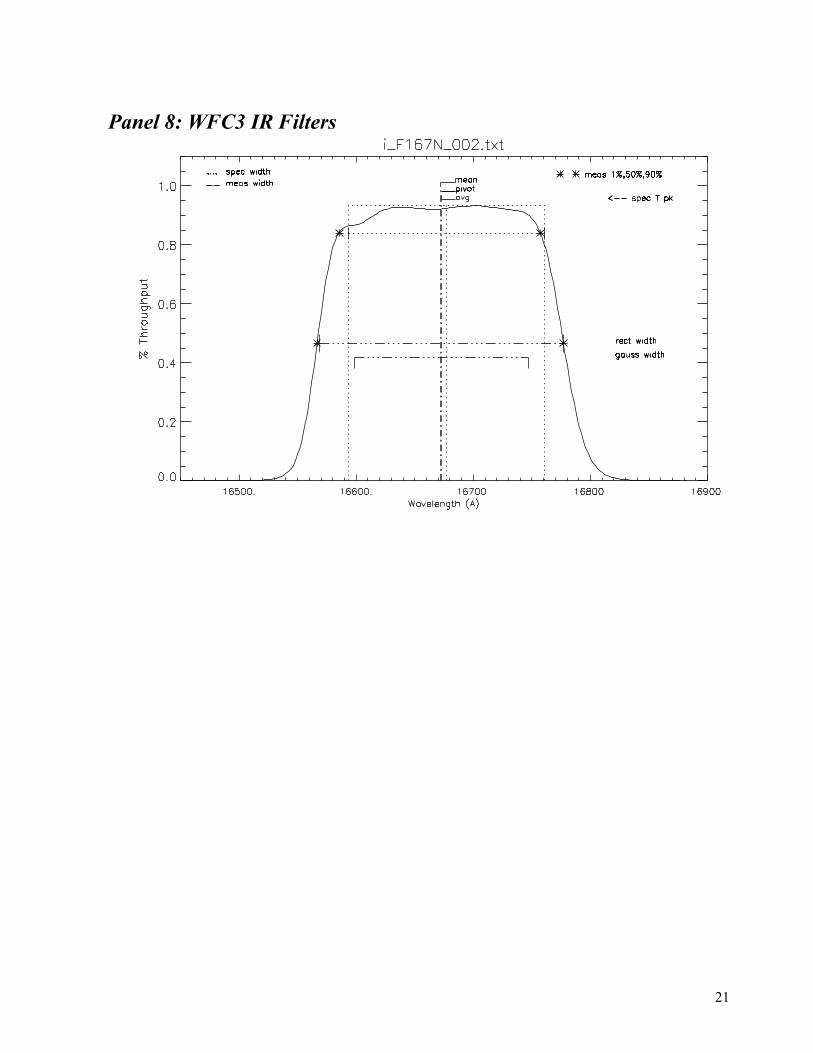
Panel 8: WFC3 IR Filters
21