wha improvement forum for november “building the business case for quality” tom kaster...
TRANSCRIPT
WHA Improvement ForumFor November
“Building the Business Case for Quality”
Tom Kaster
Courtesy Reminders: •Please place your phones on MUTE unless you are speaking (or use *6 on your keypad) •Please do not take calls and place the phone on HOLD during the presentation. 1

2
Improvement Forum Topics The Value Equation IOM Cost of Quality IHI Building the Case for Quality The Financial Impact of Quality HANYS Regulatory Pressures for Improved
Quality
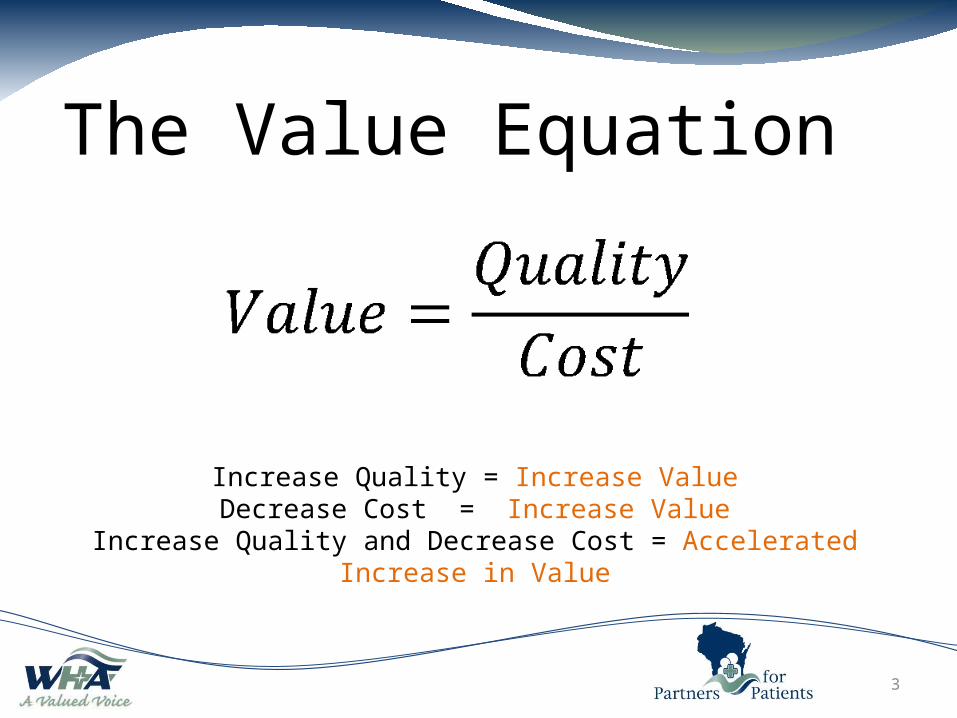
The Value Equation
3
Increase Quality = Increase ValueDecrease Cost = Increase Value
Increase Quality and Decrease Cost = Accelerated Increase in Value

Institute of Medicine (IOM): Cost of Poor-Quality of Care in Lives and
Dollars
The scope of poor quality of care (3 forms)– Overuse: Provide unneeded care– Underuse: Fail to provide needed care– Misuse: Make a mistake and cause harm
4

IOM: Overuse
Overuse occurs when a drug or treatment is given without medical justification.
– Examples includes:• Treating people with antibiotics for simple infections• Failing to follow effective options that cost less or
cause fewer side effects
– Avoiding overuse can decrease cost
5

Overuse ExamplesBoth examples can have a negative impact to the patients and to costs:
• Prescription overuse– Prescribing antibiotics for a viral illness– Using brand name when generics are available
• MRI overuse– When use appropriate MRI’s are valuable– Often MRI’s do not change the treatments
prescribed or a patients outcome.
6

IOM: UnderuseUnderuse is when doctors or hospitals neglect to give patients medically necessary care or to follow proven health care practices
– Examples include:• Failure to give beta-blocking drugs to people having
heart attacks• People receiving necessary preventative care like
mammograms or vaccinations
– Avoiding underuse improves quality
7
Consequences of Underuse
• As many as 91,000 Americans die each year because they do not receive evidence-based care for chronics conditions like HBP, diabetes and heart disease
• Billions of dollars a year are spent reacting to the consequences of underuse
8

IOM: MisuseMisuse occurs when a patient does not fully benefit from a treatment because of a preventable problem, or when a patient is harmed by a treatment.
– Some examples include:• Prescribing a drug that a patient is allergic to• The appropriate care protocol is not given resulting in
patient harm
– Avoiding misuse improves quality
9

Consequences of Misuse
• Billions of dollars a year are spent on helping patients recover from health care harm
• Conservatively between 44,000 and 98,000 people die annually from preventable errors
10

Building the Business Case
11

Obstacles to Building a Business Case for Quality
• The complexity of healthcare • The fragmentation of payer types • Lack of reliable performance indicators that correlate
QI to cost savings• The perception that waste elimination will negatively
effect patient care• The perception that increased efficiencies may
reduce FTE’s
12
Preparing Yourself to Talk the Talk
1. Learn and Understand Healthcare Financial Terms and Payer Dynamics
2. Develop methodologies to measure the financial impact of improvement (ROI etc…)
3. Understand the importance of connecting financial impacts to gain management support
13
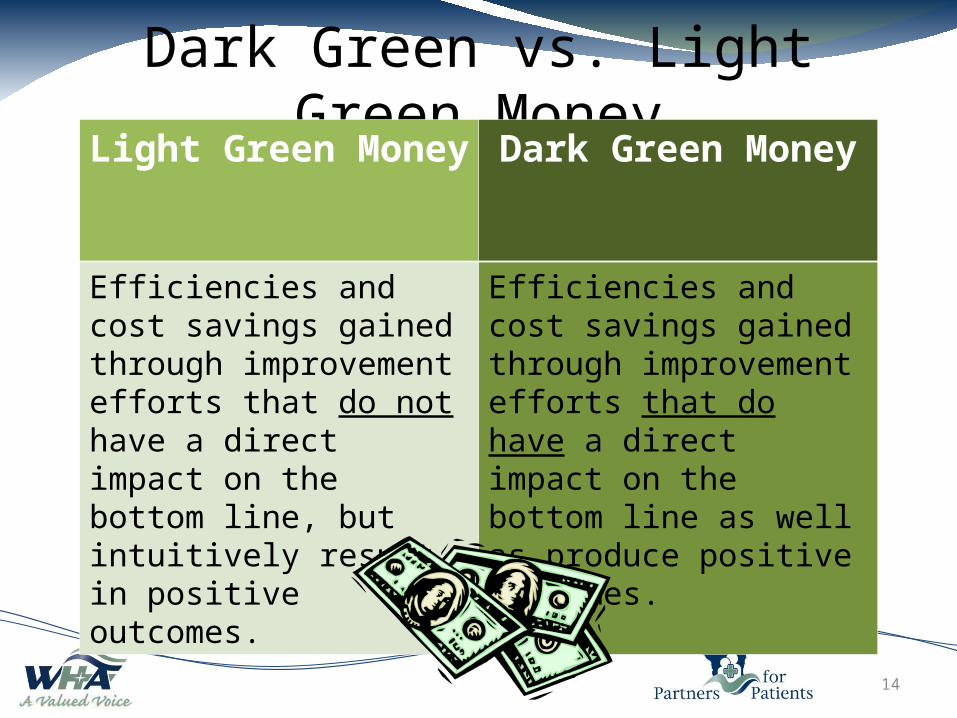
Dark Green vs. Light Green MoneyLight Green Money Dark Green Money
Efficiencies and cost savings gained through improvement efforts that do not have a direct impact on the bottom line, but intuitively result in positive outcomes.
Efficiencies and cost savings gained through improvement efforts that do have a direct impact on the bottom line as well as produce positive outcomes.
14

Examples of Light Green • Organize equipment and supplies room to reduce hunting and
searching time• Streamline workflow to increase efficiencies• Enable care givers more time at the bedside to meet patient
needs • Reduces patient harm from falls, pressure ulcers• Make work more enjoyable and experience less attrition• Improves patient experience • Improves HCAHPS scores
15
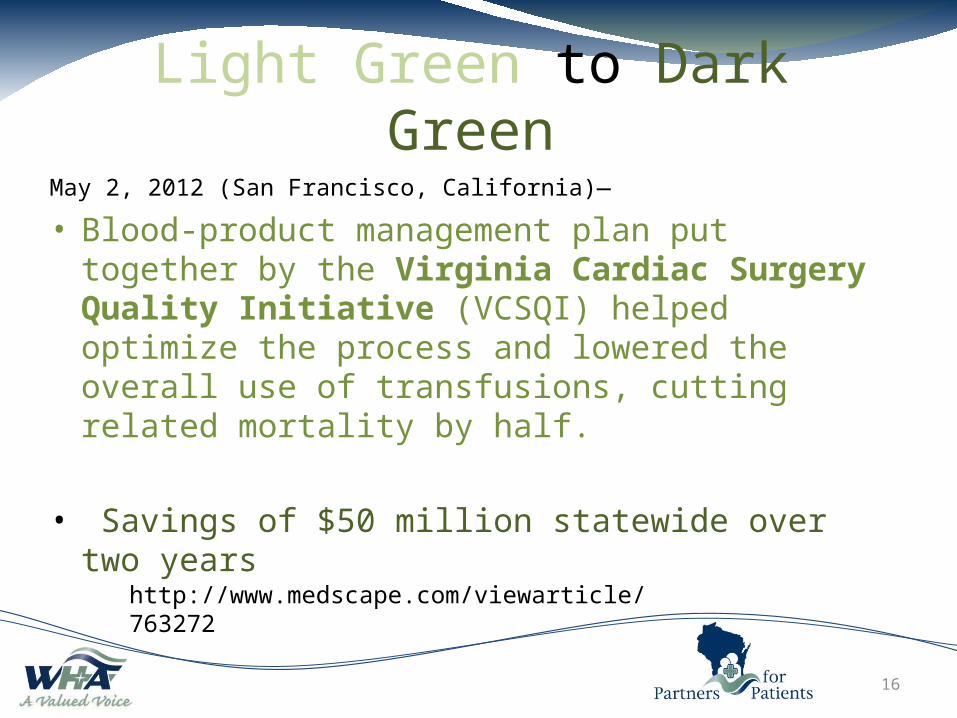
Light Green to Dark GreenMay 2, 2012 (San Francisco, California)—
• Blood-product management plan put together by the Virginia Cardiac Surgery Quality Initiative (VCSQI) helped optimize the process and lowered the overall use of transfusions, cutting related mortality by half.
• Savings of $50 million statewide over two years
16
http://www.medscape.com/viewarticle/763272

Light Green to Dark Green A house-wide hourly rounding initiative…
…Requires the improvement of overall efficiencies:• Nurses spend their time in more value added activities at the
bedside… Which is shown to improve patient and family satisfaction on
HCAHPS scores … Which will positively effect Value Based Purchasing factors
• Reduce Harm by lessoning Falls and Pressure Ulcers... Which will reduce average length of stay for our Medicare
patients • Decrease overall medication doses per stay
… Which in turn will improve profit margins for fixed payment patients
17

IHI: Examples of Dark Green Savings
Areas of Focus Effort and TargetSupplies and Medication Reduce supplies needed by X% by
reducing the number of adverse events and complications
Purchased Services (Agency) Fees
Reduce agency fees by XX% due to improved predictability in demand and improved staff morale that results from the change
Overtime Reduce overtime by XX% due to improved predictability in demand on staff from fewer adverse events and complications
FTE Reduction from Attrition
Reduce FTE Salary and wages by X% by not replacing staff following attrition, if improved work processes permit
18
IHI: Equations to Measure Quality in Dark Green Dollars
• Total Wages per Admission
• Total Medication Cost per Admission
19

IHI: Total Wages per Admission Equation
20
Total wages per admission
(Average wage per hour)
(Worked hours per patient day)
(Patient days per admission)

IHI: Total Wages per Admission Equation
Average wage per hour:• Cost associated with recruiting and training
new staff for vacant positions• Increased cost associated with contract labor
to fill vacancies • Premium overtime pay
21
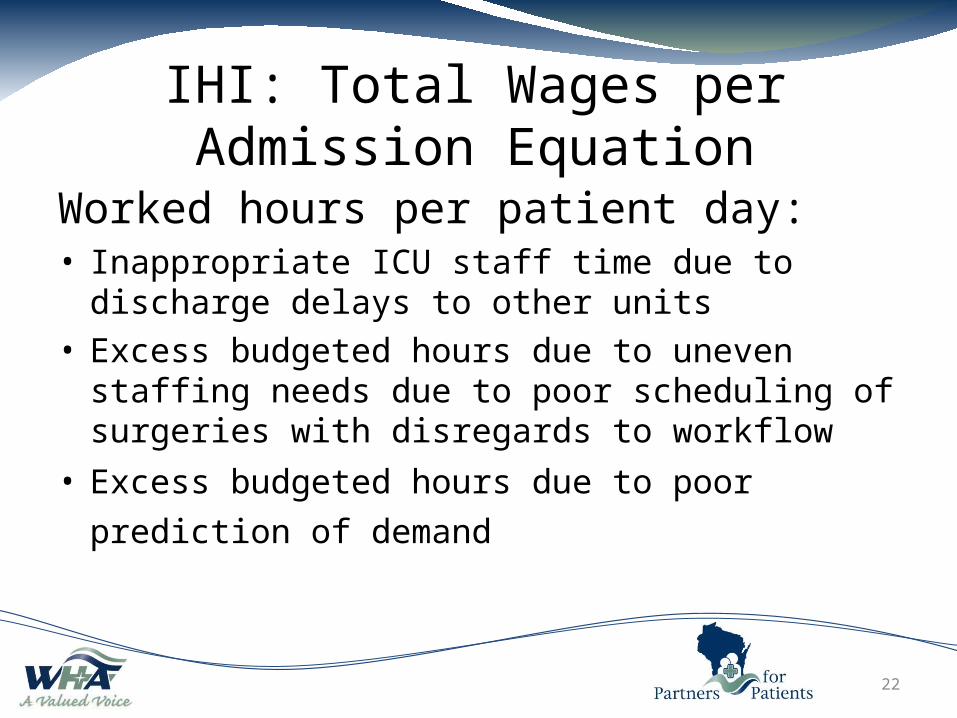
IHI: Total Wages per Admission Equation
Worked hours per patient day:• Inappropriate ICU staff time due to discharge delays
to other units• Excess budgeted hours due to uneven staffing needs
due to poor scheduling of surgeries with disregards to workflow
• Excess budgeted hours due to poor prediction of demand
22
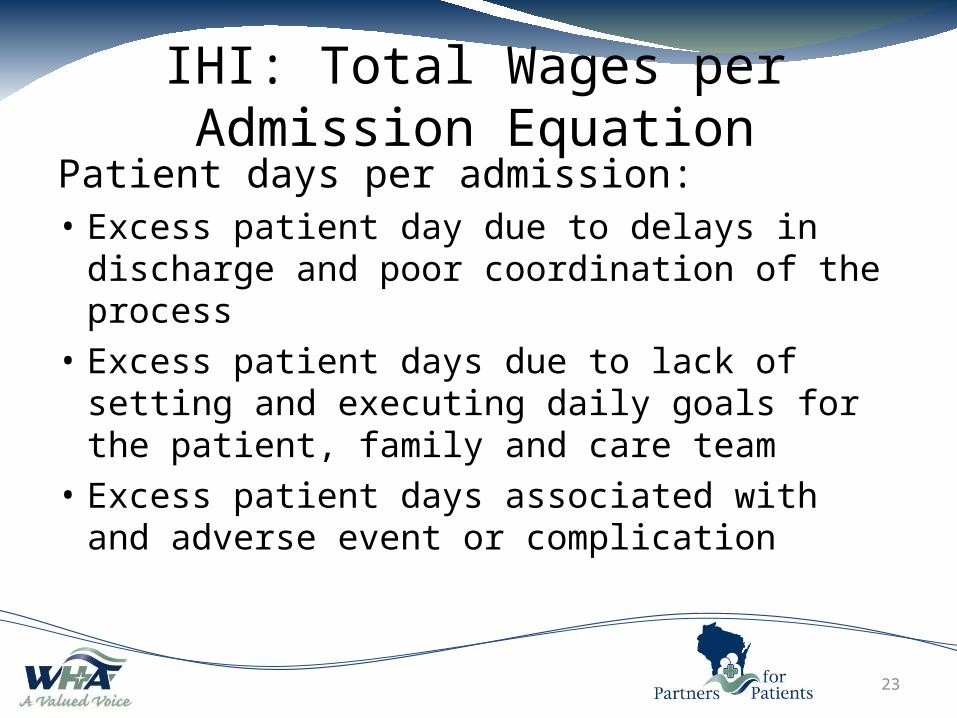
IHI: Total Wages per Admission Equation
Patient days per admission: • Excess patient day due to delays in discharge and
poor coordination of the process• Excess patient days due to lack of setting and
executing daily goals for the patient, family and care team
• Excess patient days associated with and adverse event or complication
23

IHI: Total Medication Cost per Admission Equation
Average cost per dose:• Excess cost of brand names when generic are
available• Excess cost associated with failure to make a timely
switch in Med Administration mode (IV to Oral)• Excess cost associated with overuse of expensive
meds when less expensive alternatives are available
24

IHI: Total Medication Cost per Admission Equation
Number of doses per admission:• Excess cost associated with failure to stop
medications appropriately (continuing preventative antibiotic use longer than 24 hours after surgery)
• The medication cost associated with treating an adverse events
25

IHI: Tying Equations to Dollars
Reduction in overall SSI:– Patient days per admissions: Decreased– Number of doses per admission: Decreased– Average length of stay: Decreased
26

The Financial Impact of Quality
• Medicare Fixed Payments (DRG’s)• Privately Insured• Uninsured• Regulatory
27
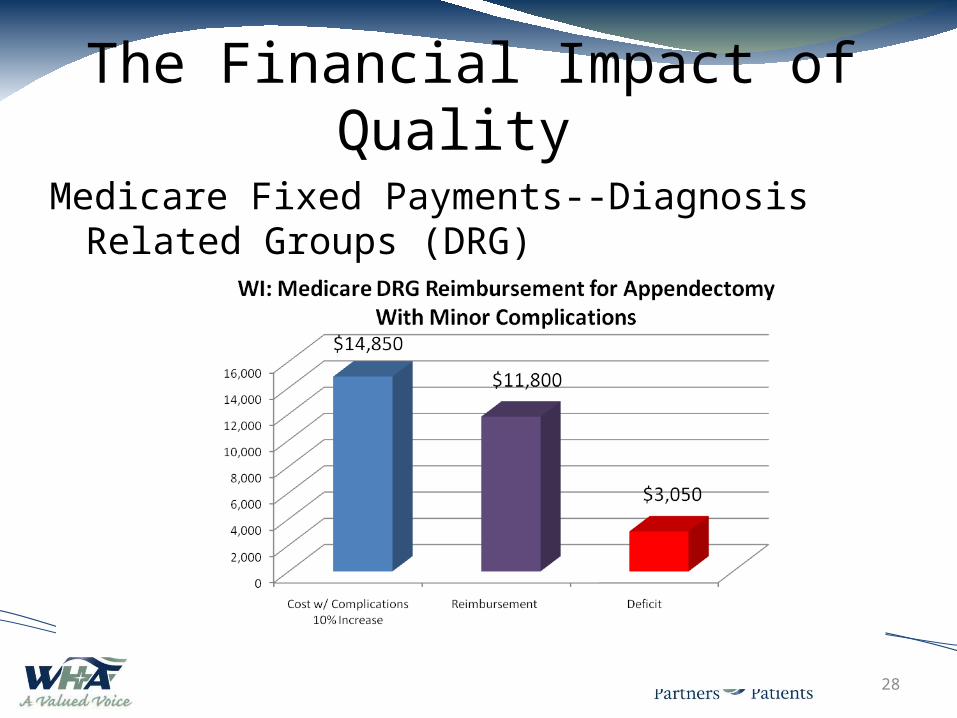
Medicare Fixed Payments--Diagnosis Related Groups (DRG)
28
The Financial Impact of Quality
Consequences of Low Quality
• Medicare Fixed Payments--Diagnosis Related Groups (DRG)– Falls / PUP / CAUTI / Falls– Efficiencies / Increase Length of Stay / Increase of
Rx Cost
• Increased financial deficit• Increased harm to patient
29
30
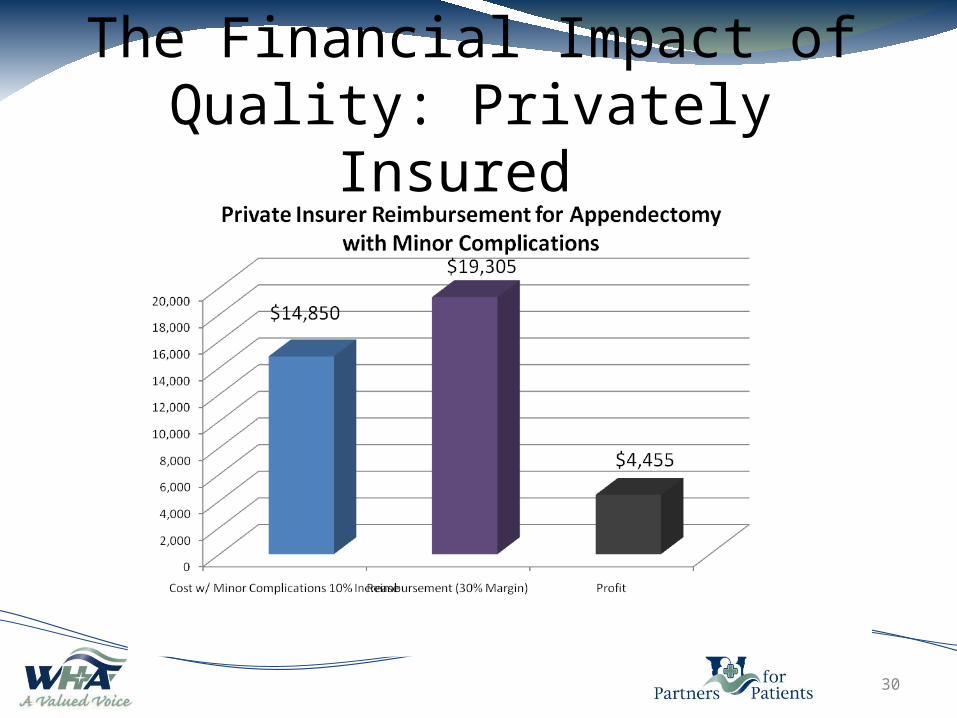
The Financial Impact of Quality: Privately Insured
Consequences of Low Quality • Privately Insured
– Falls / PUP / CAUTI / Falls– Efficiencies / Increase Length of Stay / Increase of Rx
Cost
• Increased financial revenues– Eventual lower negotiated reimbursements– Eventual pressures to adjust or change payment models
• Increased harm to patient
31

32
The Financial Impact of Quality: Uninsured

Consequences of Low Quality
• Uninsured– Falls / PUP / CAUTI / Falls– Efficiencies / Increase Length of Stay / Increase of
Rx Cost• Increase financial burden on patients • Increased likelihood of unpaid claims• Increase charitable care • Increased physical and or financial harm to patient
33
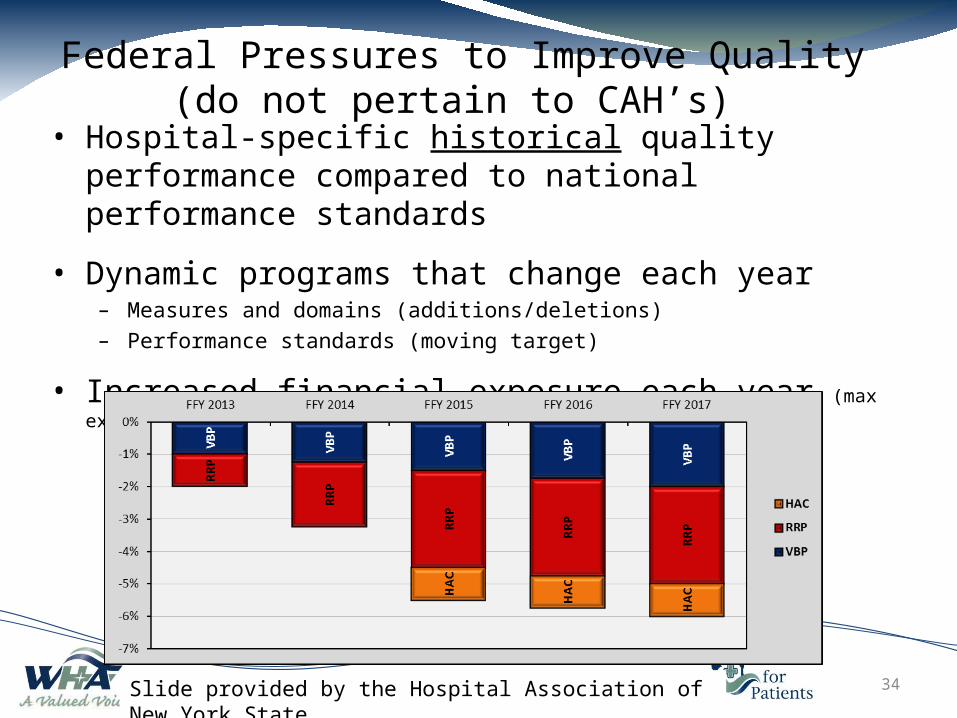
Federal Pressures to Improve Quality(do not pertain to CAH’s)
34
• Hospital-specific historical quality performance compared to national performance standards
• Dynamic programs that change each year– Measures and domains (additions/deletions)– Performance standards (moving target)
• Increased financial exposure each year (max exposure shown below)
Slide provided by the Hospital Association of New York State

Takeaways• Improving quality and / or reducing cost increases value to the
patient• Financial and Quality leaders can drive huge improvement and
cost reductions by teaming up and learning each other’s world• As data becomes more available, so will the ability to tie ROI to
quality • No matter what the industry, improving value and reducing
cost equates to long term sustainability• Even if a quality improvement project does not impact the
bottom line it may still be the right thing to do
35

Next Month
36
December – Strategies for Improving Efficiencies and Reducing Waste
Resources• Institute for health improvement– Increasing
Efficiency and Enhancing Value in Health Care• Institute of Medicine: Overuse, Underuse and
Misuse of Medical Care• Blood Use Article:
www.medscape.com/viewarticle/763272• Hospital Association of New York State -
Regulatory Pressures to Improve Quality
37

Thank You!Questions
Please complete 3 question survey when closing webinar window.
38