what are image statistics - massachusetts institute of...
TRANSCRIPT

1
9.912 Computational Visual Cognition
Introduction to image analysis &Statistics of Natural Images
Aude [email protected]
Fall 2008 - Brain and Cognitive Sciences
What are image statistics ?
• Anything you can measure from an image and the inferences you can make
• Some signals are more interesting, relevant, important for human vision and cognition: signals that have regularities

2
Statistical Regularities object-background
keyboard Fire hydrant
Oliva & Torralba (2007) TICS
Statistical regularities object-object

3
what is a natural image?
We can consider a natural image a picture that somebodycan take.
What is a natural image?

4
But then, is this a natural image?
Yes, now it is. Somebody could take a picture of this…
What is a natural image?
But then, this picture is also a natural image
What is a natural image?

5
> Rand(64,64) Urban constructionA street
Every picture is a natural image. But some processes aregoing to be more likely than others in building the structures thatone observer is going to see.
Cloning gone wrong (but he is still happy)
What is a natural image?
The visual system seems to be tuned to a set of images:
Demo borrowed from D. Field
What is a natural image?

6
The visual system seems to be tuned to a set of images:
What is a natural image?
The visual system seems to be tuned to a set of images:
Did you saw this image?
What is a natural image?

7
What is a natural image?
What is a natural image?

8
There are regularities.. II - The challenge

9
Statistics of Natural Images: Regularities are everywhere to found…
Averaged pictures of categories of objects, scenes and objects in scenes, computed with 100 exemplars or more per category. Exemplars were chosen to have the same basic level and viewpoint in regard to an observer. The group objects in scenes (third row) represent examples of the averaged peripheral information around an object centered in the image.
Barn

10
Beach
Bedroom

11
Cavern
Closet

12
Countryroad
Greenhouse

13
Hair salon
Iceberg

14
Library
Waves

15
sand
water
sky
trees
sand/water
Scene Understanding
The brain perceives ~ 60 millions diagnosticinputs per year (3 samples per second)
A robust representation of natural images require accumulatedinformation about the statistics
… the challenge for natural image recognition systems is to find the relevant regularities to encode
Image Layout: Variety in Texture Gradient
Texture gradient describes the correspondence between the pattern of a surface and the structure of the 3 D world. There are several signature textural gradient: e.g. frontal surface project uniform gradients. Longitudinal surfaces such as floors and streets project gradient that diminish with greater distance from the observer.

16
Human Scene Understanding: Distortion & Transformation
Image perceived
Image Retrieved
Memory DistortionCompression -Reconstruction
Openness Expansion Roughness
II – What are the simple statistics ?

17
Image Analysis
• Analytical mechanism: decomposition of an entity into components
• Components are spatial frequencies and orientations
Second order image statisticsThe basic rule
• Shape of the power spectra (Kretzmer, 52; Field 87)
Power spectrum
P(f) = 1/f 2-α
Scale invariance (Ruderman), physical models of natural images (Mumford)

18
1- A Little Detour in Fourier Land
Computer Tools for Image Analysis
Fourier Transform
• Fourier Analysis considers sinusoidal gratings as the “primitives” of an image
• Fourier analysis is a method by which any two dimensional luminance image can be analyzed into the sum of a set of sinusoidal gratings that differ in spatial frequency, orientation, amplitude and phase.

19
Fourier Transform
• Fourier transform of a real function is complex– difficult to plot, visualize– instead, we can think of the
phase and magnitude of the transform
• Phase is the phase of the complex transform
• Magnitude is the magnitude of the complex transform
Computer Vision - A Modern Approach - Set: Pyramids and Texture - Slides by D.A. Forsyth
Magnitude Phase
Phase and Magnitude
Demonstration– Take two pictures, swap the
phase transforms, compute the inverse - what does the result look like?
Computer Vision - A Modern Approach - Set: Pyramids and Texture - Slides by D.A. Forsyth
Image with cheetah phase (and zebra magnitude)
Image with zebra phase(and cheetah magnitude)

20
Decomposition in frequency bandsDecomposition in frequency bands
Red (low pass filter)
Blue(low pass filter)
Green = R - B(pass-band filter)
Red filterSpectrum
Blue filterSpectrum
Green filterSpectrum
Gaussians and DoG
Spatial frequency (cycles/image)
ampl
itude
Decomposition in frequency bands
Residual
Matlab code: Decomposition of an image in frequency bands code.zip

21
Mona Lisa Painting – Da Vinci
Leonardo Da Vinci’s Mona Lisa Subtle expressionLeonardo Da Vinci’s Mona Lisa Subtle expression
Smile
Smile
No smile
Livingstone, M. (2000). Science
Computer Vision - A Modern Approach - Set: Pyramids and Texture - Slides by D.A. Forsyth
Gaussian Pyramid
Illustration of a Pyramid(gaussian pyramidwith subsampling)

22
The Laplacian Pyramid
Zebra slides from Computer Vision - A Modern Approach - Set: Pyramids and Texture - Slides by D.A. Forsyth
Burt, D.C. & Adelson E. (1983) IEEE Trans. Com.
•Laplacian pyramid is orientation independent
Band pass filters - each level represents spatial frequencies (largely) unrepresented at other levels
cf. Simoncelli’s toolbox
Matlab code: Subband Decomposition from Simoncelli code.zip
Randomizing the phase
Image Phase Scrambling code.zip

23
How to read a Fourier Spectrum
Horizontalorientation
Vertical orientation
45 deg.
0 fmax
0
fx in cycles/image
Low spatial frequencies
High spatial frequencies
Log power spectrum
Fourier Amplitude Spectrum
A B C
1 2 3
fx(cycles/image pixel size) fx(cycles/image pixel size) fx(cycles/image pixel size)

24
Fourier Characteristics of Natural Images
fx
Spectra
1/fa
Low spatial frequencies
High SF
fy
fx
Horizontal
Vertical
Low SF
High spatial frequencies
D. J. Field, "Relations between the statistics of natural images and the response properties of cortical cells," J. Opt. Soc. Am. A 4, 2379- (1987)
Power spectrafall off as 1/f 2
Torralba and Oliva, Statistics of Natural Image Categories. Network: Computation in Neural Systems 14 (2003) 391-412.
Matlab Demo …

25
Some bizarre aspect of the nature
Cow skin
fxfy
Spectra
1/fa
Field (87)fyfx
fyfx
Natural scenes(6000 images)
Man-made scenes(6000 images)
fy
fx
fy
fx
Natural scenesspectral signature
Man-made scenesspectral signature
Statistics of Scene Categories
Torralba and Oliva, Statistics of Natural Image Categories. Network: Computation in Neural Systems 14 (2003) 391-412.

26
Use of Fourier Spectrum (toy version)
Fourier space
Low pass Filter
*
*
High pass filter
Freeman & Adelson, 91; Freeman & Simoncelli, 95
Image decomposition (by the brain or the computer)
27
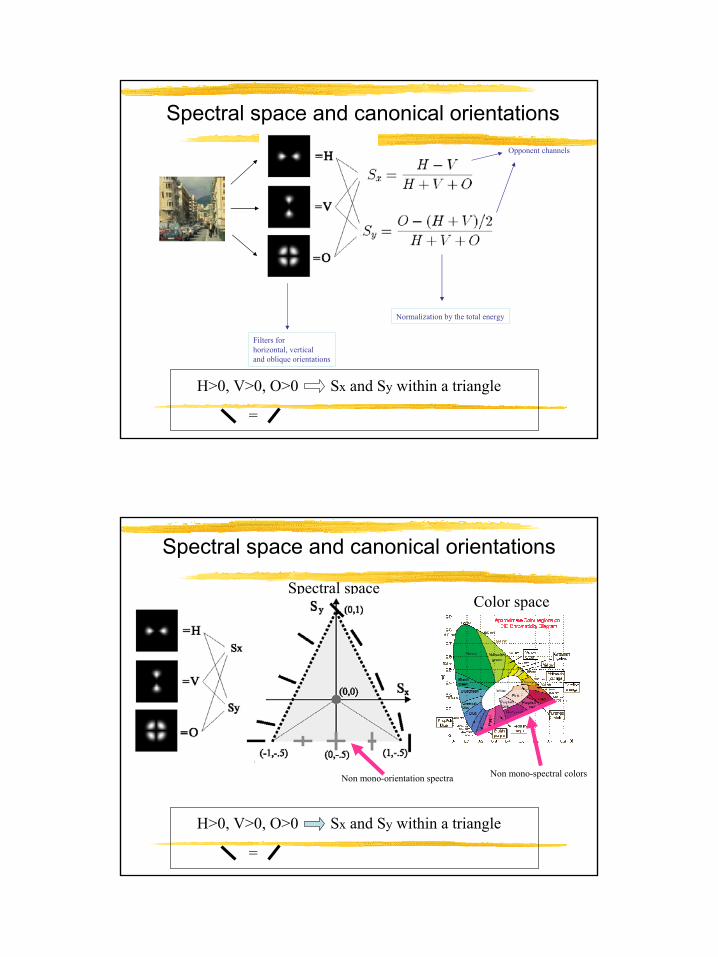
H>0, V>0, O>0 Sx and Sy within a triangle
=
Spectral space and canonical orientations
Filters forhorizontal, vertical and oblique orientations
Normalization by the total energy
Opponent channels
Spectral space and canonical orientations
Spectral space
H>0, V>0, O>0 Sx and Sy within a triangle
=
Non mono-spectral colorsNon mono-orientation spectra
Color space

28
Spectral space and canonical orientations
Spectral space and canonical orientations

29
Spectral space and canonical orientations
Naturalenvironments
Man-madeenvironments
Man-madeobjects
Portraits All imageswith a random
rotation
Spectral space and canonical orientations

30
Spectral space and canonical orientations
What is driving the scene regularities?
Physical processes that shape the environment?
Restrictions on possible observer points of view?
Functional constraints of the scene?

31
Spectral Signature of semantic categoriesMan-made environments Natural environments
Spectral signature of categories of man-made environments Spectral signature of categories of natural environments
Torralba and Oliva, Statistics of Natural Image Categories. Network: Computation in Neural Systems 14 (2003) 391-412.
Natural Image Statistics
fxfy
Power Spectrum
1/fa
Field (87), Ruderman (97)
The group of natural images have particular second-order statistics(quantity of orientation, quantity of frequencies).
fx
fy
Power Spectrum
Spectrogram

32
Open man-made scenes
Verticallystructured scenes
Perspective viewsof streets
Far views ofcity center
Close up viewsof urban scenes
Open naturalscenes
Closed naturalscenes
Mountaneouslandscapes
Enclosedforests
Close up viewsof rocks, water
Spectral Layout SignatureSpectral layout signatures of several scene categories (averaged from hundreds of exemplars)
Torralba and Oliva, Statistics of Natural Image Categories. Network: Computation in Neural Systems 14 (2003) 391- 412.
Image statistics are non-stationary when considering specific categories.
Basic-level scene spectral signatures
Torralba and Oliva, Statistics of Natural Image Categories. Network: Computation in Neural Systems 14 (2003) 391-412.
Global and Local Power Spectrum Signature code.zip

33
Scene Scale
• “The point of view that any given observer adopts on a specific scene is constrained by the volume of the scene.”
• How does the amount of clutter vary against scene scale in man-made environments? In natural environments?
Nature and Man-made environment are not build in the same way
at different scales.
If d1>>d2>>d3 the structures of each view strongly differ. Structure provides monocular information about the scale (mean depth) of the space in front of the observer.
d1d2
d3
Depth Perception from Image Structure
Torralba, A., & Oliva, A. (2002). Depth estimation from image structure. IEEE Pattern Analysis and Machine Intelligence, 24,1226-1238.

34
Spectral Regularities and Mean Depth
Torralba, A., & Oliva, A. (2002). Depth estimation from image structure. IEEE Pattern Analysis and Machine Intelligence, 24,1226-1238.
Mean depth (meters)1 10 100 1000
1
1.2Slope
1 10 100 1000
1
1.2
Slope
Mean depth (meters)
Spatially Localized Statistics
• Image statistics become non-stationary as scene scale increases.
Top Row: Man-made environmentsBottom Row: Natural environments
Global and Local Power Spectrum Signature code.zipTorralba and Oliva, Statistics of Natural Image Categories. Network: Computation in Neural Systems 14 (2003) 391-412.

35

36

37
Textured surface layout influences depth perception
Torralba & Oliva (2002, 2003)

38
Scene Classification from “Texture”
Oliva & Torralba (2001,2006)
Stationary image statistics
v
Input image
Feature mapsLocal 2nd statistics
Same energy at eachsubband (power spectra).

39
Mean Depth from Image Structure
We learn the relationship between image structure and the mean depth of the scene
v = structure
1 104
P (scale |x, v)
1 1000
Π P (scale | x, v)x
Mean Depth from Image Structure
a)
b)
1 1000
1 1000depth (m)
depth (m)
f(D | v)
(Torralba & Oliva, 2002)76 % images with correct estimation. 88% correct when considering images with high confidence.

40
Precision-recall:
Performance in depth estimation
Torralba & Oliva, PAMI - 2002
Let’s go back to the signal …analyzed by the brain
The pyramid filters (Freeman, Adelson, Simoncelli)
41
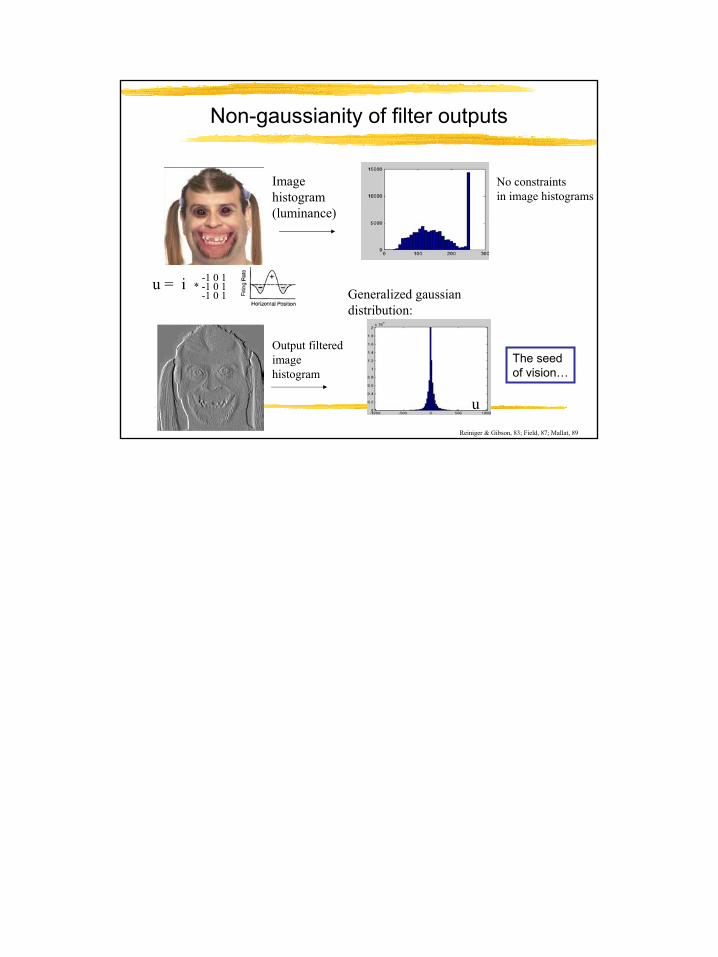
Non-gaussianity of filter outputs
Image histogram(luminance)
-1 0 1* -1 0 1
-1 0 1
Output filteredimagehistogram
Generalized gaussiandistribution:
uReiniger & Gibson, 83; Field, 87; Mallat, 89
u = i
No constraintsin image histograms
The seedof vision…