what are meaningful outcomes from (high) secure … · what are meaningful outcomes from forensic...
TRANSCRIPT

What are meaningful outcomes from forensic ID services?
Catrin Morrissey, Lead PsychologistNicole Geach, Research Assistant
National High Secure Learning Disability ServiceRampton Hospital

Outcomes
• “What happens to the health of the patient as a result of the treatment/care they receive” (RCP, 2013)
• At present each secure service uses outcome measures which relate to its own objectives (and CQUINs), with little standardisation between services
RCP ID Faculty Report 2013 • ‘A common data-set of short-term and long-term
outcome variables [should be] collected through a nationwide audit’
• ‘This could identify predictors of length of hospital stay and successful treatment outcomes’
• Should include measures of effectiveness, safety and patient experience (NHS OF)

Current developments• Clinical Research Group –Forensic IDD (Chair: Dr R
Alexander) NIHR funded• Successful application to NIHR HS&DR for development
work for an outcomes study: 3 elements• Systematic review • What do clinicians believe are relevant outcome
measures ? – Delphi study• What kind of outcomes are relevant to parents and
carers ?– focus groups• Other relevant context: PbR ; NHS ‘outcomes revolution’
(Gilbody et al, 2003)
Systematic review August – September 2014 Provisional findings
• What outcomes from FIDD services have been studied? What measures have been used?
• More inclusive than earlier reviews from this team (Alexander, Chester, et al., 2011)
• Included community forensic settings• Included outcomes during treatment (cross
sectional/ ‘snapshot’) studies as well as follow up/discharge studies.
• Included worldwide studies
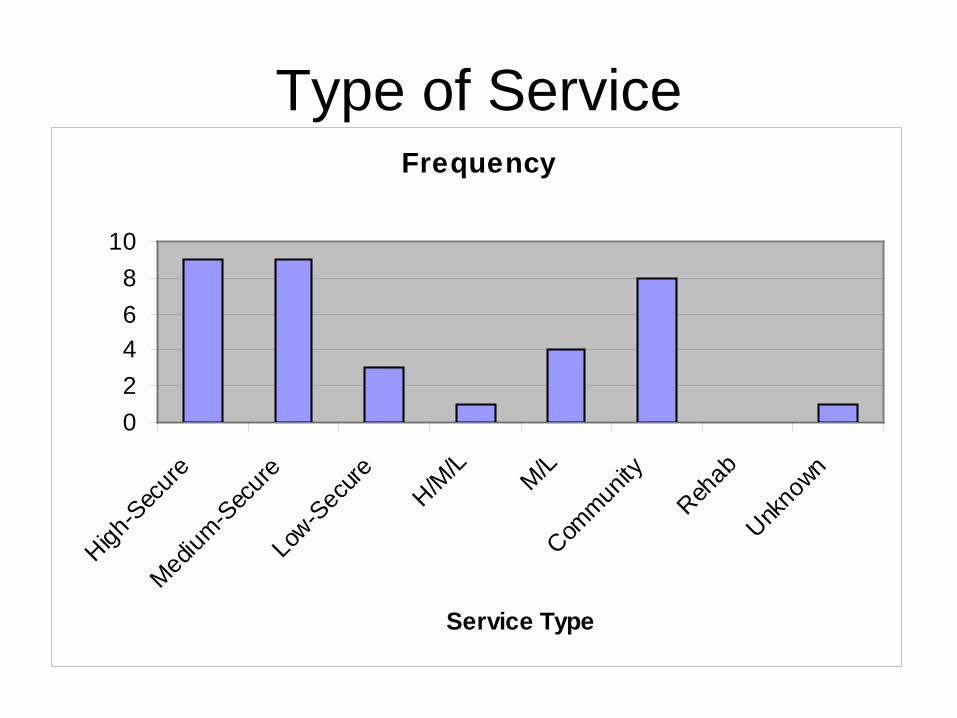
Frequency
02468
10
High-S
ecure
Medium
-Sec
ure
Low-S
ecure
H/M/L M/L
Commun
ityReh
ab
Unkno
wn
Service Type
Type of Service
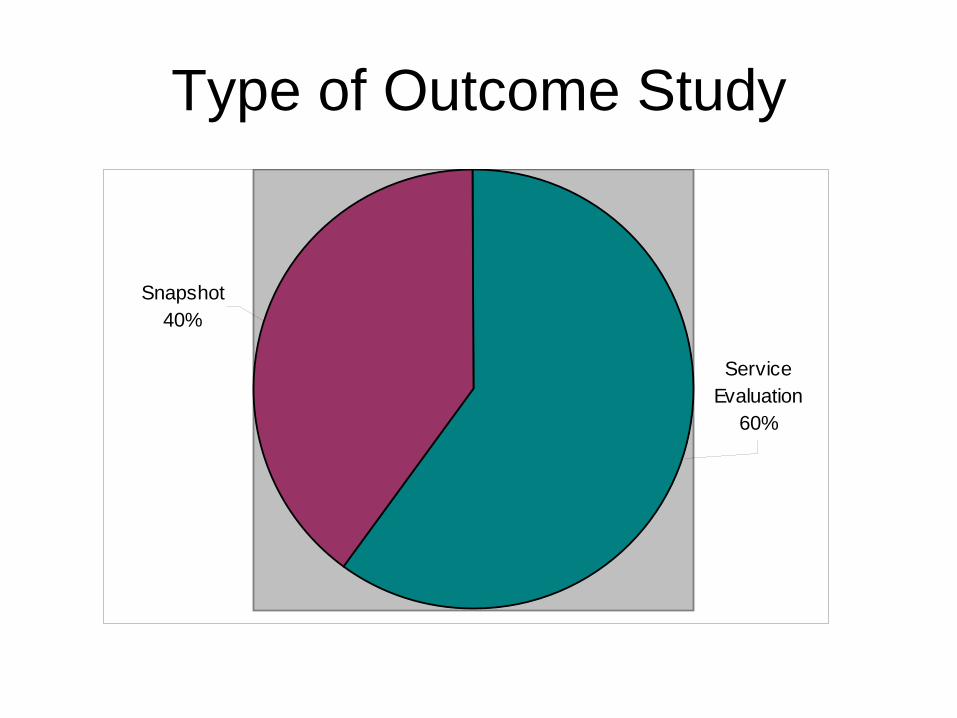
Type of Outcome Study
Snapshot40%
Service Evaluation
60%
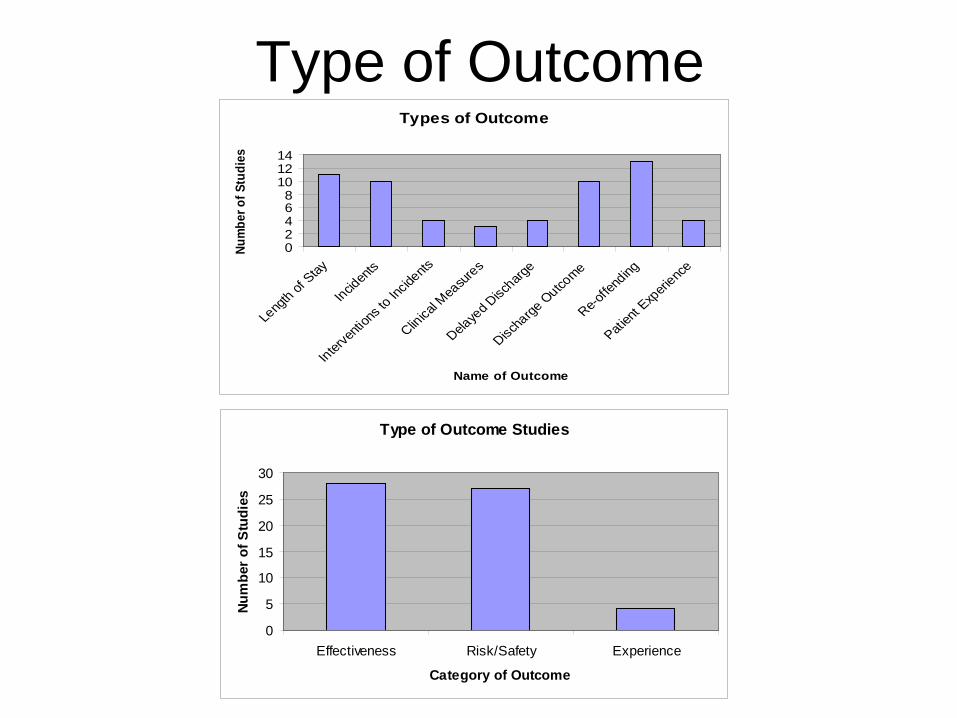
Type of OutcomeTypes of Outcome
02468
101214
Leng
th of Stay
Inciden
ts
Interve
ntion
s to I
ncide
nts
Clinical M
easur
es
Delaye
d Disc
harge
Discha
rge O
utcome
Re-offe
nding
Patien
t Exp
erience
Name of Outcome
Num
ber o
f Stu
dies
Type of Outcome Studies
0
5
10
15
20
25
30
Effectiveness Risk/Safety Experience
Category of Outcome
Num
ber o
f Stu
dies
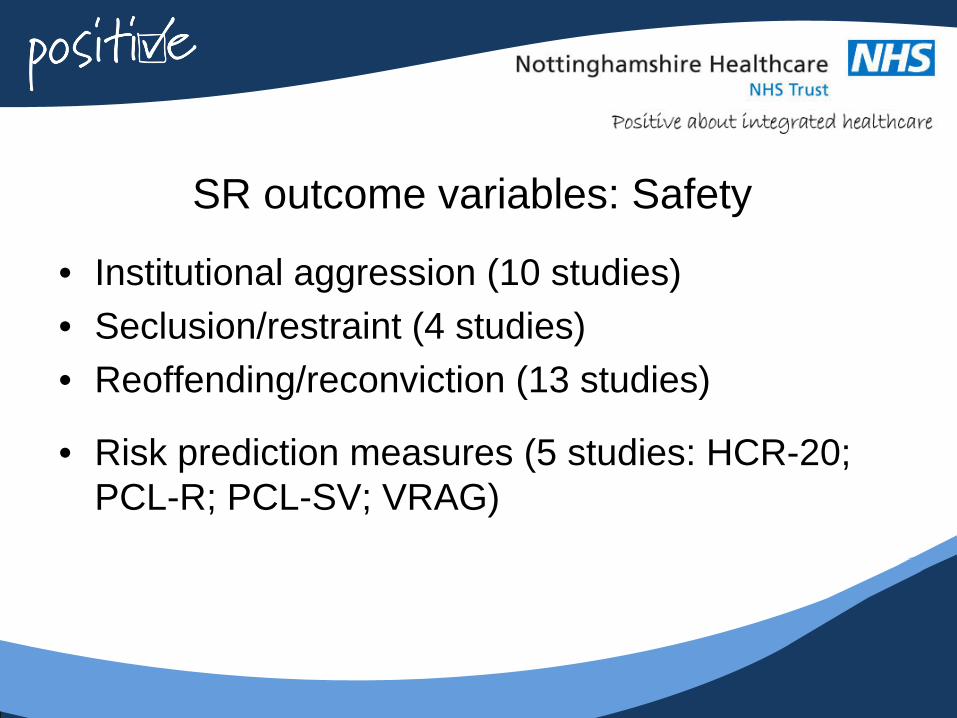
SR outcome variables: Safety
• Institutional aggression (10 studies)• Seclusion/restraint (4 studies)• Reoffending/reconviction (13 studies)
• Risk prediction measures (5 studies: HCR-20; PCL-R; PCL-SV; VRAG)
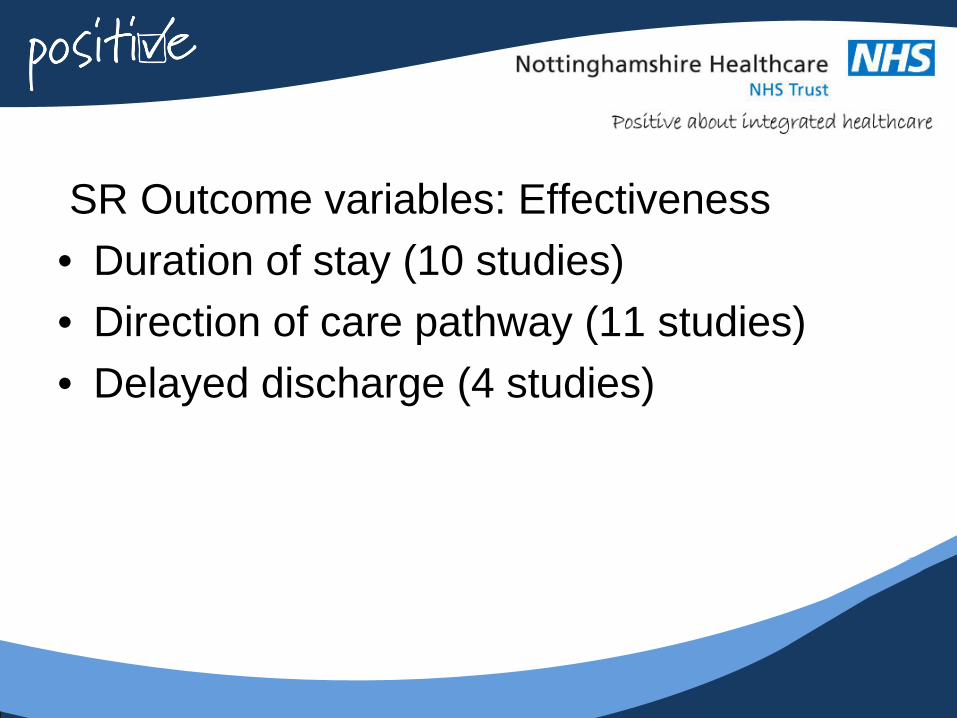
SR Outcome variables: Effectiveness• Duration of stay (10 studies)• Direction of care pathway (11 studies)• Delayed discharge (4 studies)
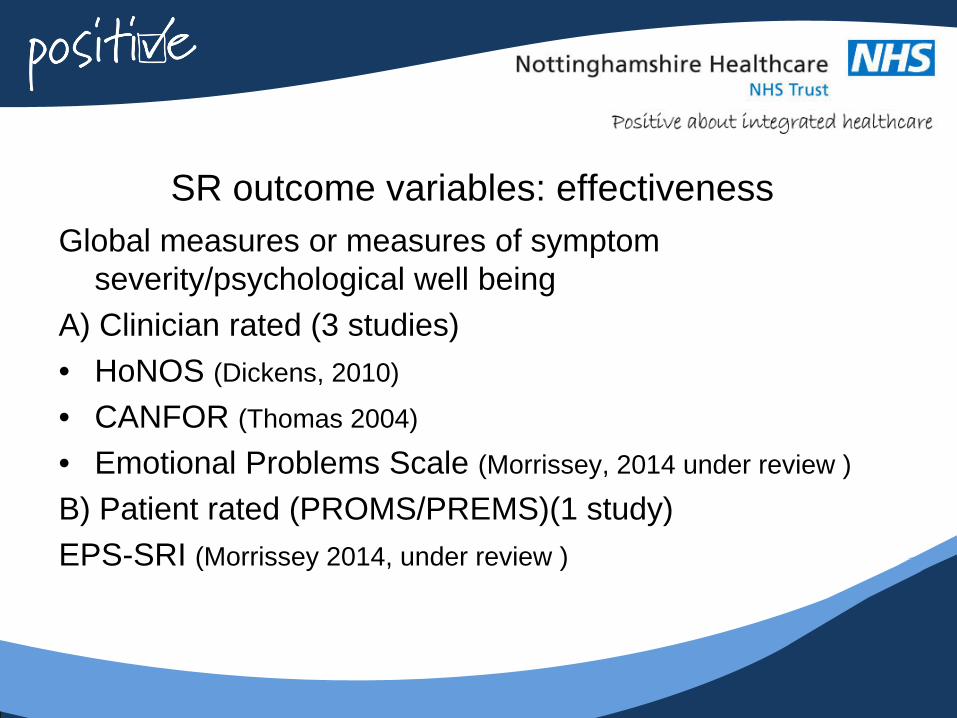
SR outcome variables: effectivenessGlobal measures or measures of symptom
severity/psychological well being A) Clinician rated (3 studies) • HoNOS (Dickens, 2010)
• CANFOR (Thomas 2004)
• Emotional Problems Scale (Morrissey, 2014 under review )
B) Patient rated (PROMS/PREMS)(1 study)EPS-SRI (Morrissey 2014, under review )
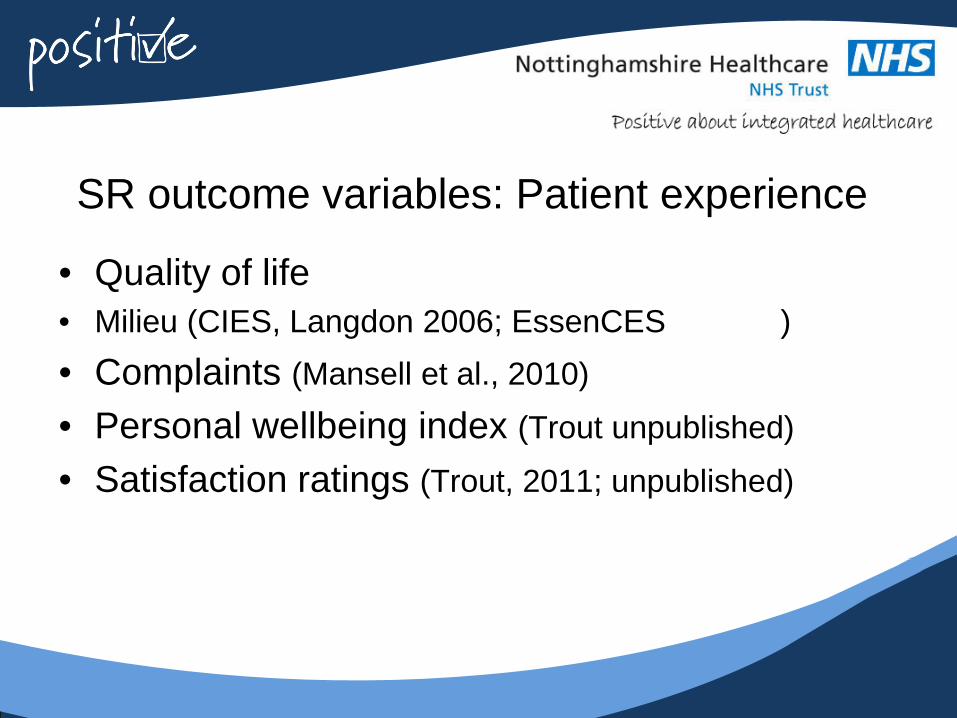
SR outcome variables: Patient experience
• Quality of life • Milieu (CIES, Langdon 2006; EssenCES )• Complaints (Mansell et al., 2010)
• Personal wellbeing index (Trout unpublished)
• Satisfaction ratings (Trout, 2011; unpublished)
Vision:• Multi-site outcomes study • Patients followed with minimum common
data set from admission to discharge and follow-up
• BUT what are the pitfalls?
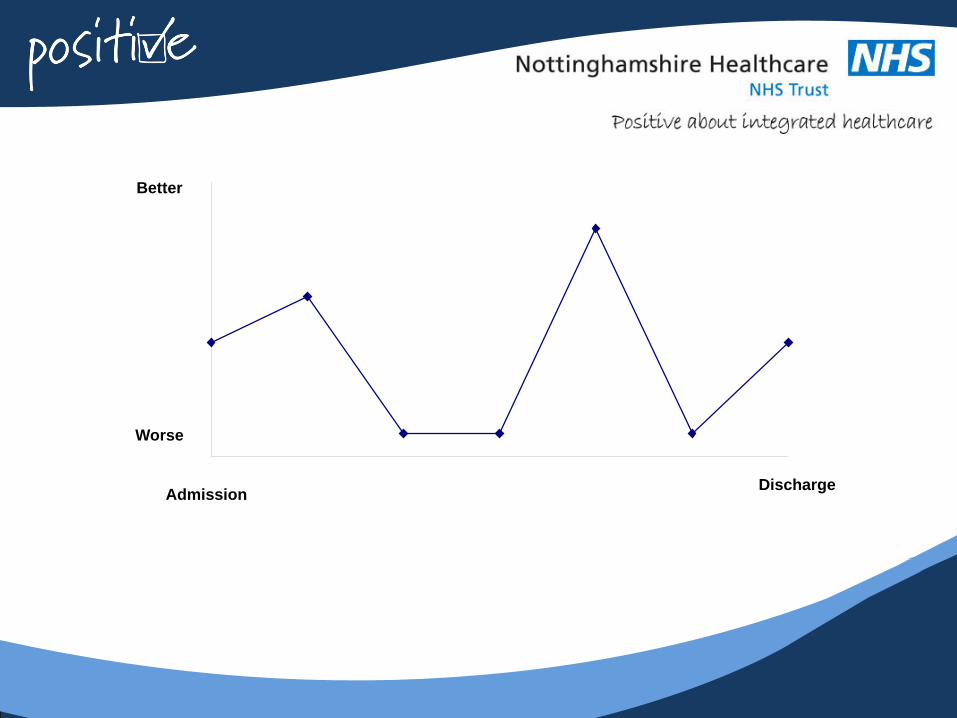
Better
Worse
DischargeAdmission
‘Good’ outcome - depends on the stakeholder
Patient
Commissioners
Service
Public
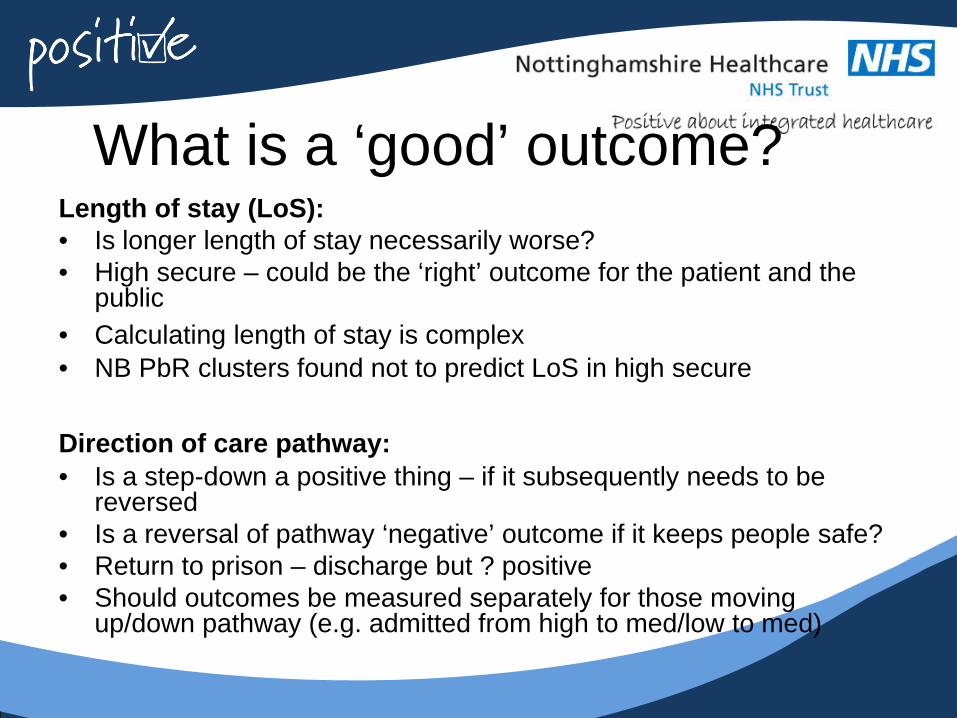
What is a ‘good’ outcome?Length of stay (LoS): • Is longer length of stay necessarily worse?• High secure – could be the ‘right’ outcome for the patient and the
public• Calculating length of stay is complex• NB PbR clusters found not to predict LoS in high secure
Direction of care pathway:• Is a step-down a positive thing – if it subsequently needs to be
reversed• Is a reversal of pathway ‘negative’ outcome if it keeps people safe?• Return to prison – discharge but ? positive• Should outcomes be measured separately for those moving
up/down pathway (e.g. admitted from high to med/low to med)
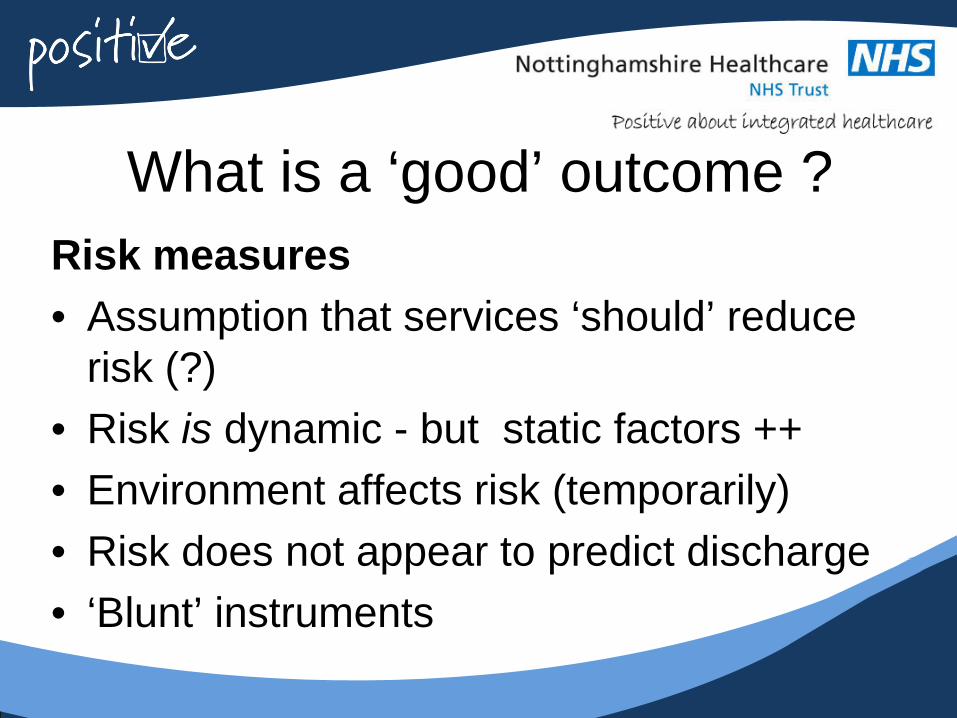
What is a ‘good’ outcome ?Risk measures• Assumption that services ‘should’ reduce
risk (?)• Risk is dynamic - but static factors ++• Environment affects risk (temporarily)• Risk does not appear to predict discharge• ‘Blunt’ instruments
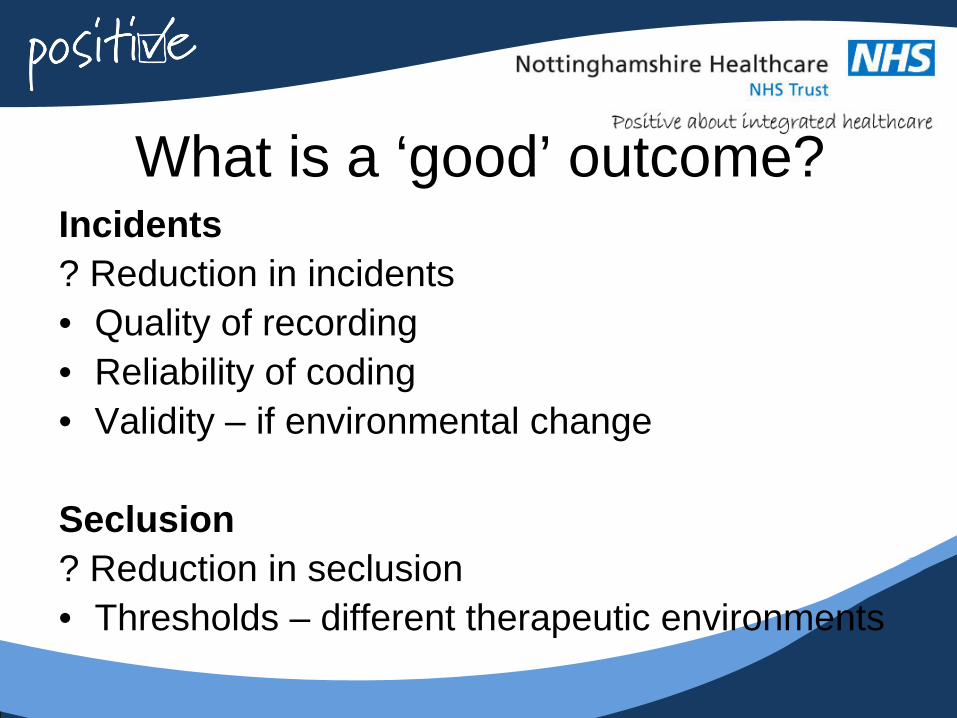
What is a ‘good’ outcome?Incidents ? Reduction in incidents• Quality of recording• Reliability of coding• Validity – if environmental change
Seclusion ? Reduction in seclusion• Thresholds – different therapeutic environments
What is a good outcome?Symptom/ Self report measures• Reliability and validity of measures with ID• Responsiveness and precision • Volatility of data – which time point? Snapshot• How much reduction is ‘enough’ – clinically
significant – into ‘normal’ range?
Informant symptom measures• Change in informant over time & inter rater
reliability
National High Secure LD Service• National Service (England and Wales)• 54 beds (male) – 4 wards• Re-provision into re-designed service in 2010• Admission criteria “grave and immediate danger”• Admission: 1/3 Prison; 2/3 medium secure • About 10% ‘long term segregation’• Comprehensive treatment pathway • Discharge medium secure/prison
NHSLDS 5 year outcome data• RISK - HCR- 20 – at least annual • LoS/DISCHARGE/Re-admission• SYMPTOMS Emotional Problems Scale –
behaviour rating scale (informant) - on admission and every 6 months
• SYMPTOMS Emotional Problems Scale –self report inventory – every 6 months
• VIOLENCE Incidents (IR1s) – continuous
Problems?• What is the question ?• “do patients on average get better in a high secure
service (or not)?”• Is it a reasonable assumption that they should?• Missing data (especially self report)• Analysing repeated measures – best methodology ?• Different baselines; different time points• Admission cohort or whole sample?• Non-normal data• Averages masking patterns of change – who are the
group getting better – and why?
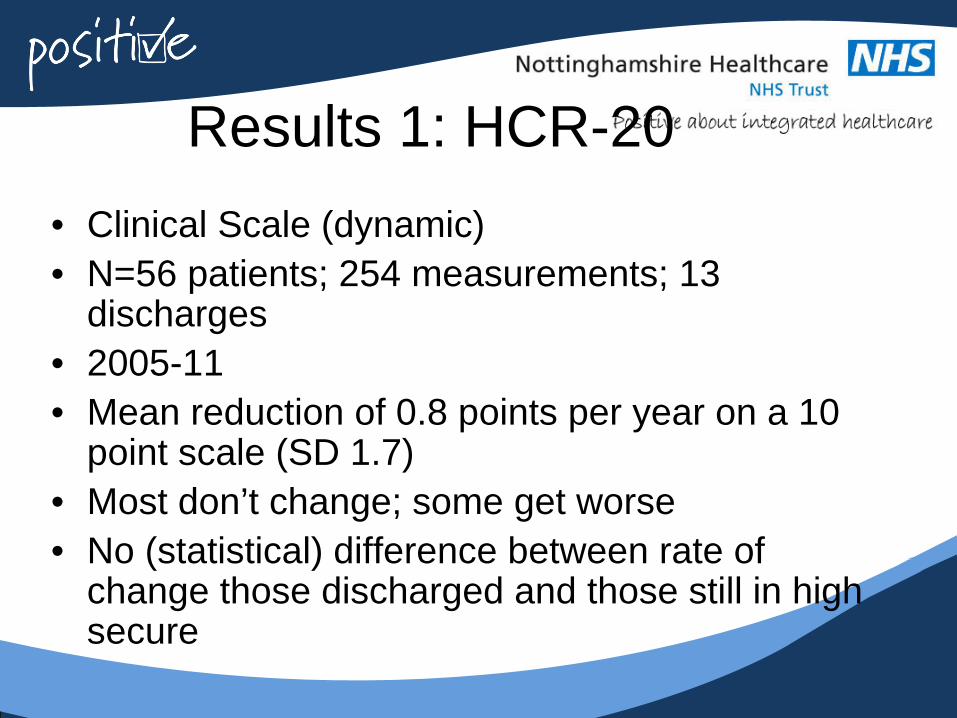
Results 1: HCR-20• Clinical Scale (dynamic)• N=56 patients; 254 measurements; 13
discharges• 2005-11• Mean reduction of 0.8 points per year on a 10
point scale (SD 1.7)• Most don’t change; some get worse• No (statistical) difference between rate of
change those discharged and those still in high secure
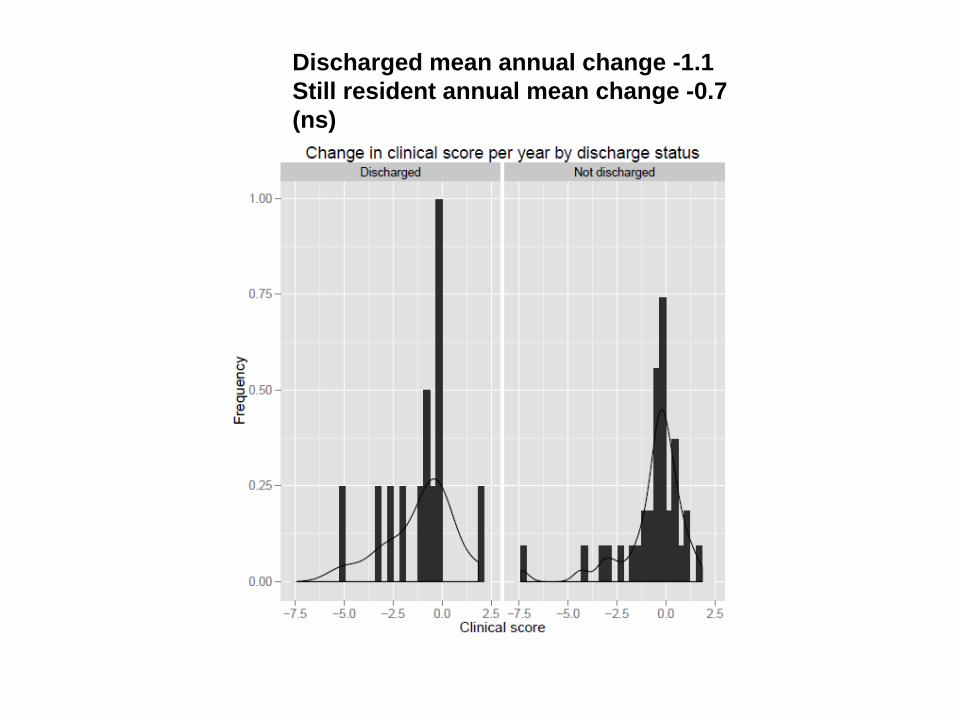
Discharged mean annual change -1.1Still resident annual mean change -0.7 (ns)
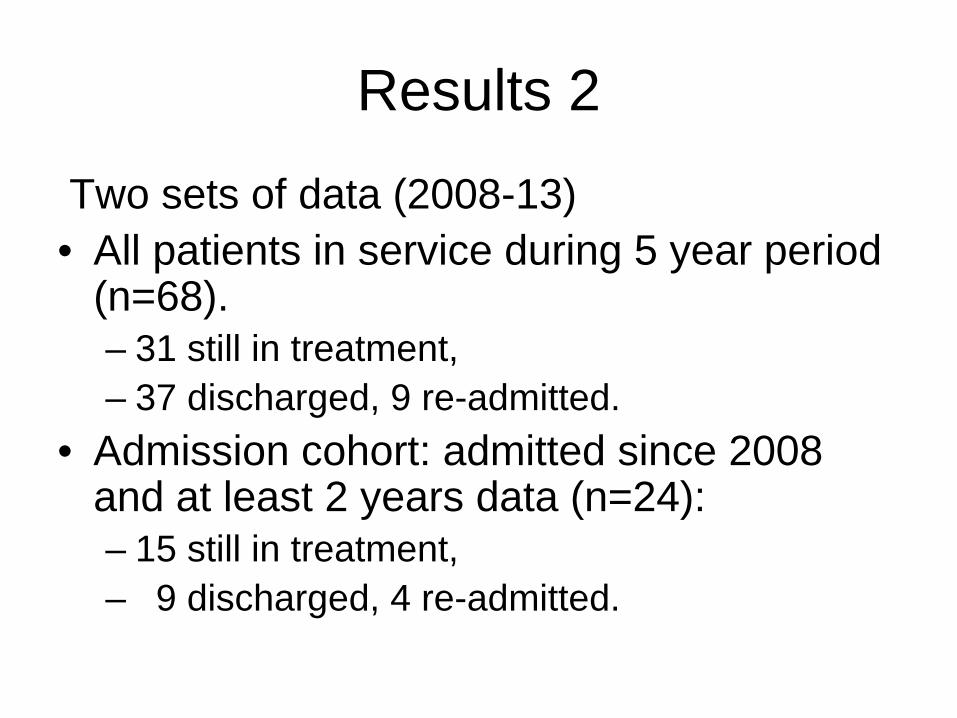
Results 2
Two sets of data (2008-13)• All patients in service during 5 year period
(n=68).– 31 still in treatment, – 37 discharged, 9 re-admitted.
• Admission cohort: admitted since 2008and at least 2 years data (n=24):– 15 still in treatment, – 9 discharged, 4 re-admitted.
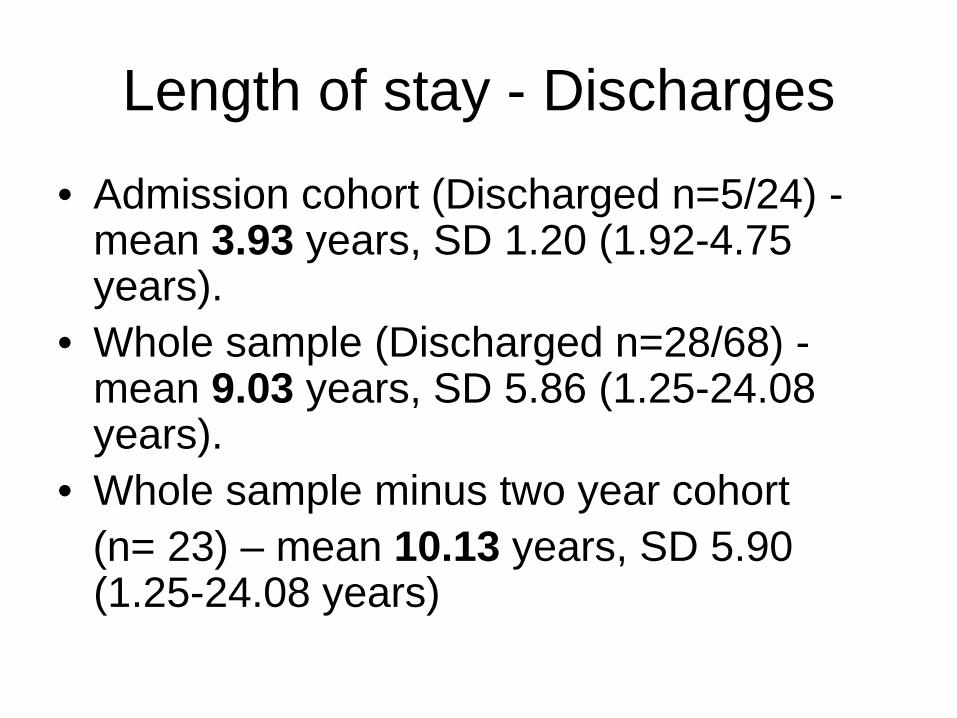
Length of stay - Discharges
• Admission cohort (Discharged n=5/24) -mean 3.93 years, SD 1.20 (1.92-4.75 years).
• Whole sample (Discharged n=28/68) -mean 9.03 years, SD 5.86 (1.25-24.08 years).
• Whole sample minus two year cohort (n= 23) – mean 10.13 years, SD 5.90 (1.25-24.08 years)
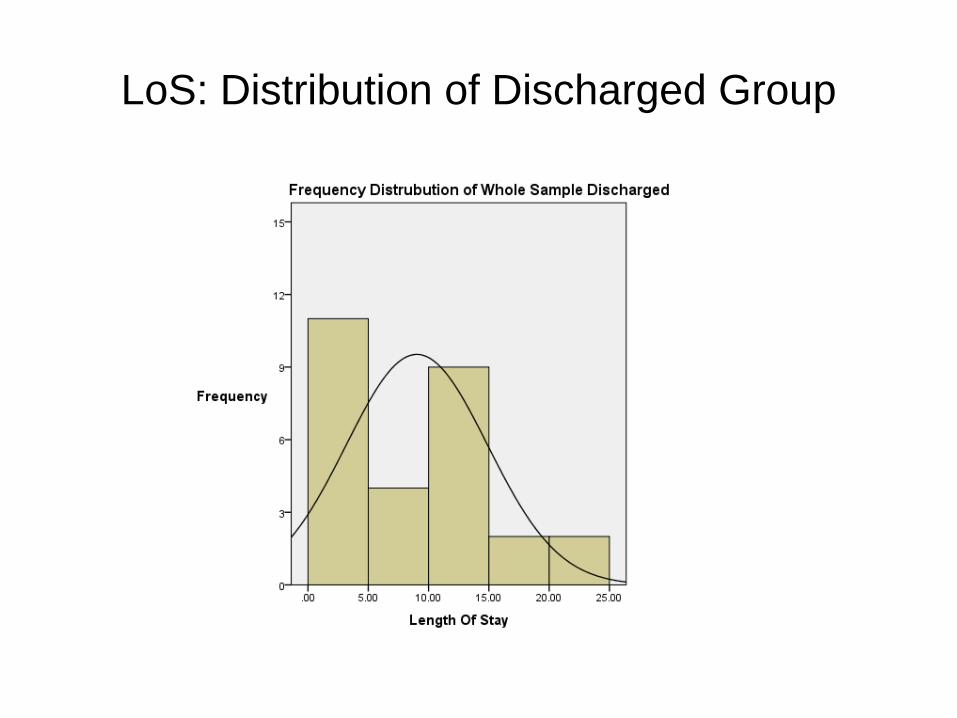
LoS: Distribution of Discharged Group
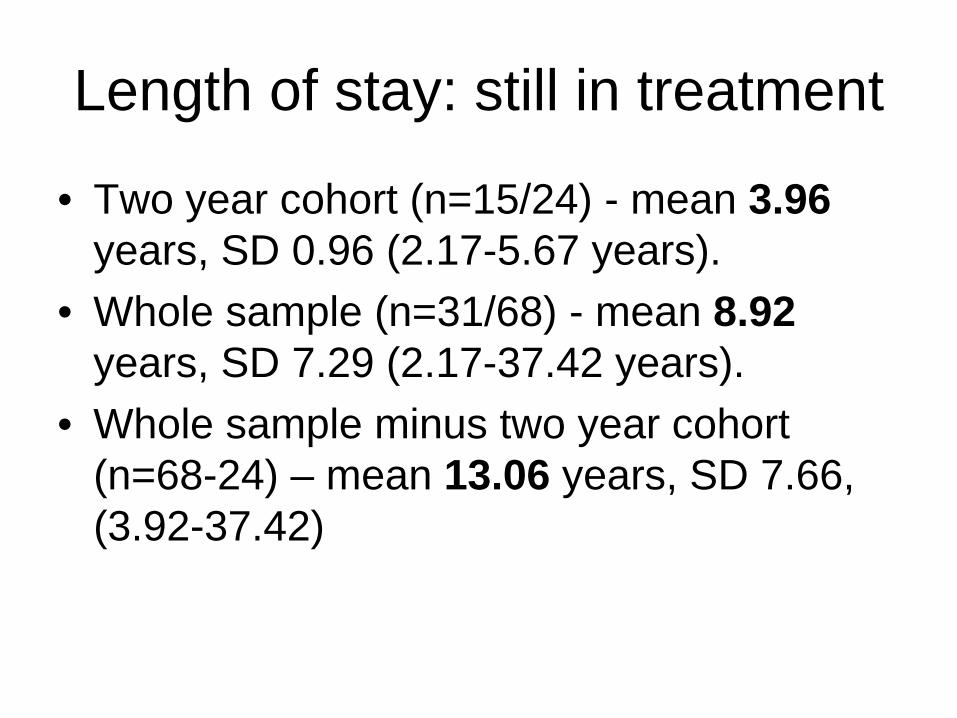
Length of stay: still in treatment
• Two year cohort (n=15/24) - mean 3.96years, SD 0.96 (2.17-5.67 years).
• Whole sample (n=31/68) - mean 8.92 years, SD 7.29 (2.17-37.42 years).
• Whole sample minus two year cohort (n=68-24) – mean 13.06 years, SD 7.66, (3.92-37.42)
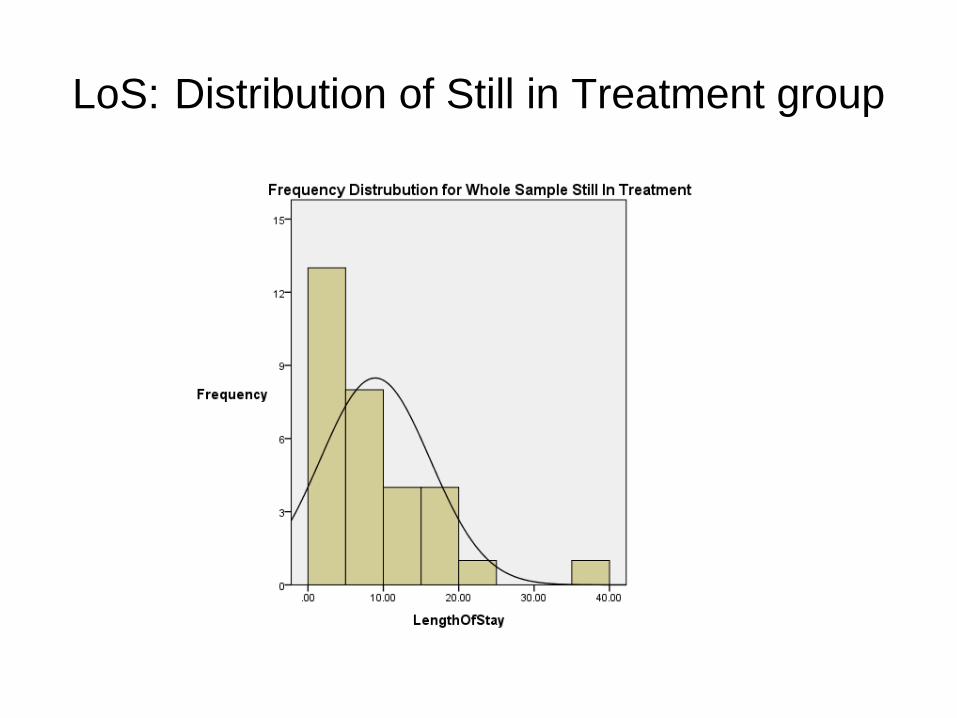
LoS: Distribution of Still in Treatment group
Measuring change for Admission Cohort
• EPS informant (Internalising & Externalising scales) and Self-report (Total pathology) completed four weeks post-admission and at six-monthly intervals (up to 6 years).
• Comparison: change in EPS scores between admission and 2 years (or nearest data point).
• Comparison of change between 3 groups: still resident; discharged and discharged and re-admitted
• Annual violent incident data (year 1 post admission; year 2; year 3 etc).
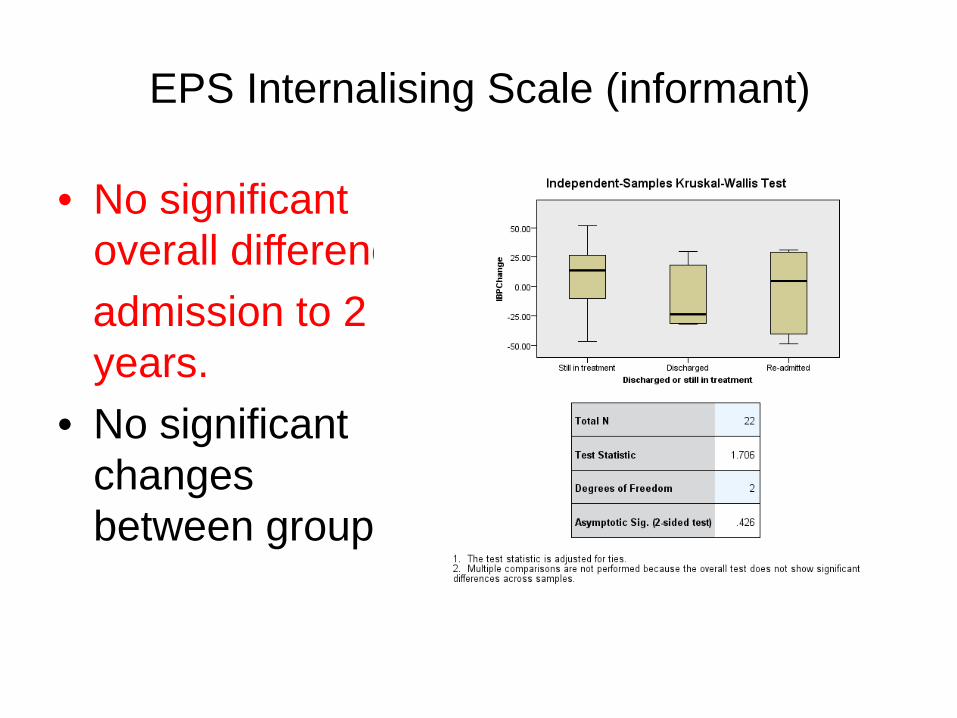
EPS Internalising Scale (informant)
• No significant overall differenceadmission to 2 years.
• No significant changes between groups.

EPS Externalising Scale (informant)
• Overall significant increase in scores admission to 2 years
• Significant differences between groups; Discharged scores decreased slightly while Still in treatment scored increased.
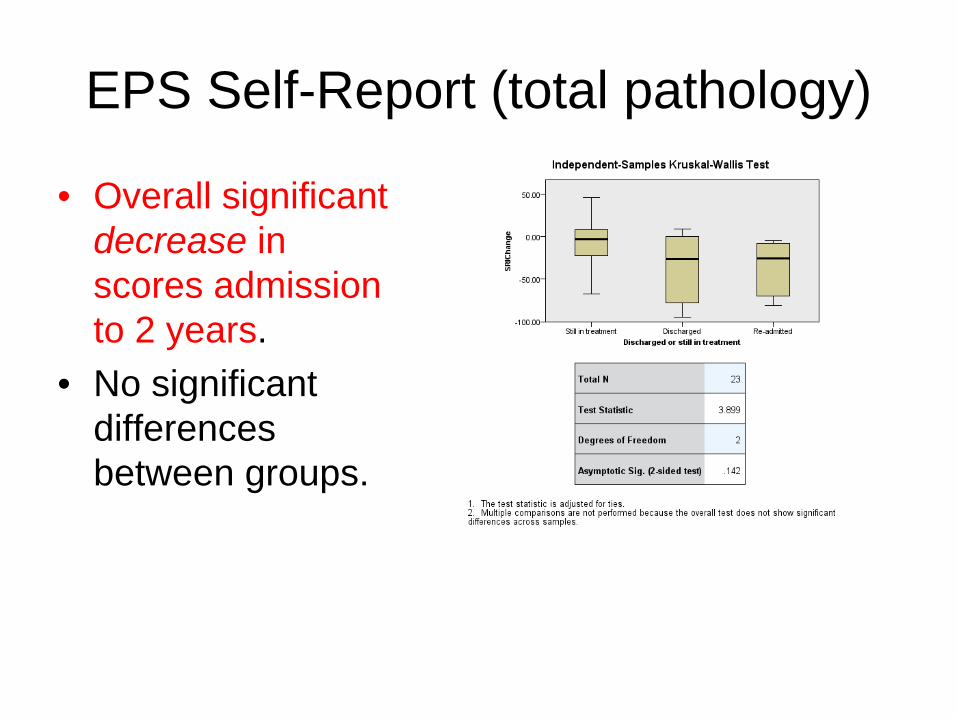
EPS Self-Report (total pathology)
• Overall significant decrease in scores admission to 2 years.
• No significant differences between groups.

Violent Incidents trend
Overall decreasing trend - but does not necessarily tell the whole story.
Mean Number of Violent Incidents
0.00
2.00
4.00
6.00
8.00
10.00
12.00
Year 1 (N = 23)
Year 2 (N = 23)
Year 3 (N = 21)
Year 4 (N = 15)
Year 5 (N = 6)
Mean
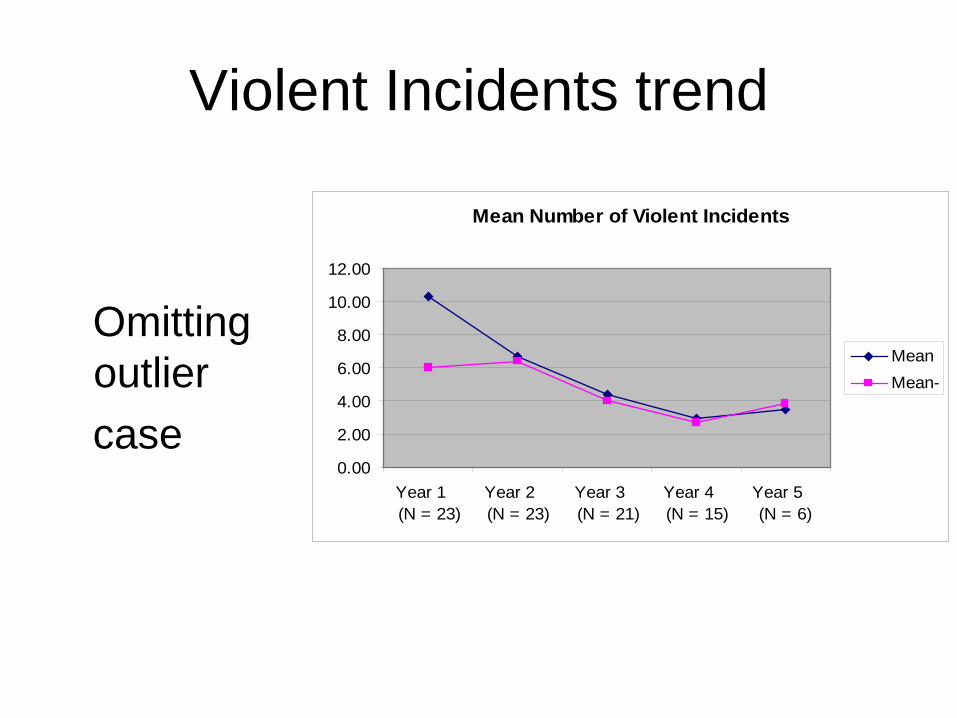
Violent Incidents trend
Omitting outliercase
Mean Number of Violent Incidents
0.00
2.00
4.00
6.00
8.00
10.00
12.00
Year 1 (N = 23)
Year 2 (N = 23)
Year 3 (N = 21)
Year 4 (N = 15)
Year 5 (N = 6)
MeanMean-
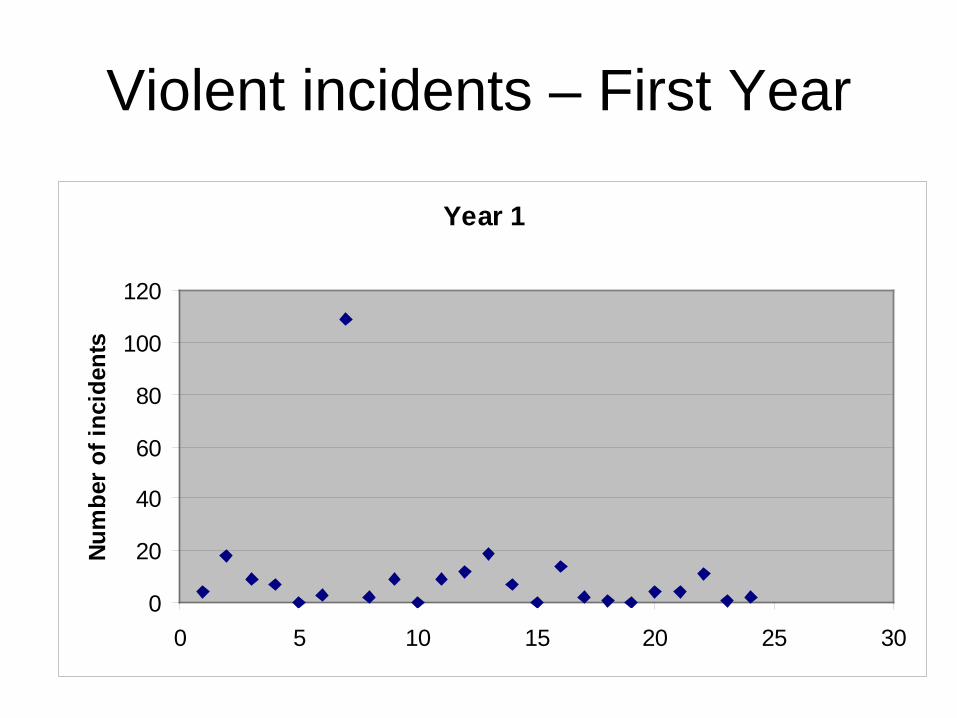
Violent incidents – First Year
Year 1
0
20
40
60
80
100
120
0 5 10 15 20 25 30
Num
ber o
f inc
iden
ts

Violent Incidents: Year 1 to Year 4
• No significant overall differenceYear 1-2; Year 1-3.
• However, there was a significant difference Year 1 - Year 4.
• No significant differences between groups.
Discussion• Overall, a mixed picture.• Staff report externalising scale suggests people
get worse; Self report of symptoms and violent incidents suggest people get better.
• Is externalising scale picking up other problem behaviours ?
• Is SRI improvement due to suggestibility/PIM?• Few differences between discharged and still
resident groups (but small n discharged)?
Conclusions• Record behavioural incidents accurately- but awareness
that environment influences• Real clinical data is messy!• Recovery – if it happens - is not linear• Group statistics may not be the answer for researching a
small, heterogeneous and “abnormal” sample.• Outcomes measured at an individual level can
nevertheless be useful?• May be helpful to have statistical analyses which
separate out those who have improvement trajectory, and a deterioration trajectory
• Still likely to be difficult to explain what predicts improvement and otherwise, as factors are complex