what are the constraints to inclusive growth in...
TRANSCRIPT

What Are the Constraints to Inclusive Growth in Zambia?
Elena Ianchovichina and Susanna Lundström
PREM weekApril 22, 2008

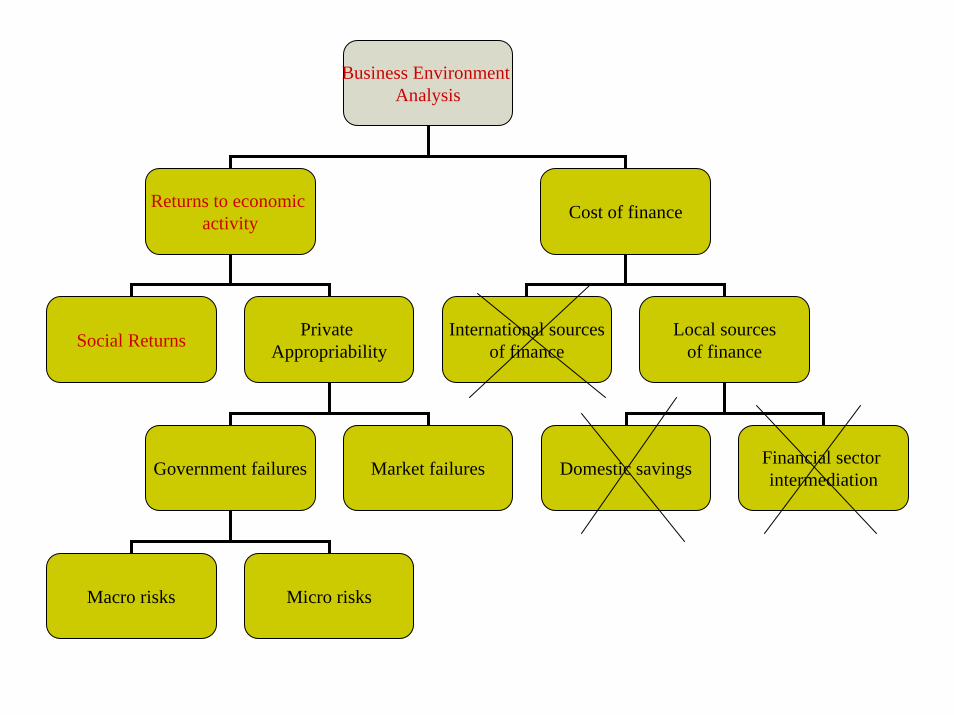
Business Environment Analysis
Returns to economic activity Cost of finance
Social Returns Private Appropriability
International sourcesof finance
Local sourcesof finance
Domestic savings Financial sector intermediationGovernment failures Market failures
Macro risks Micro risks

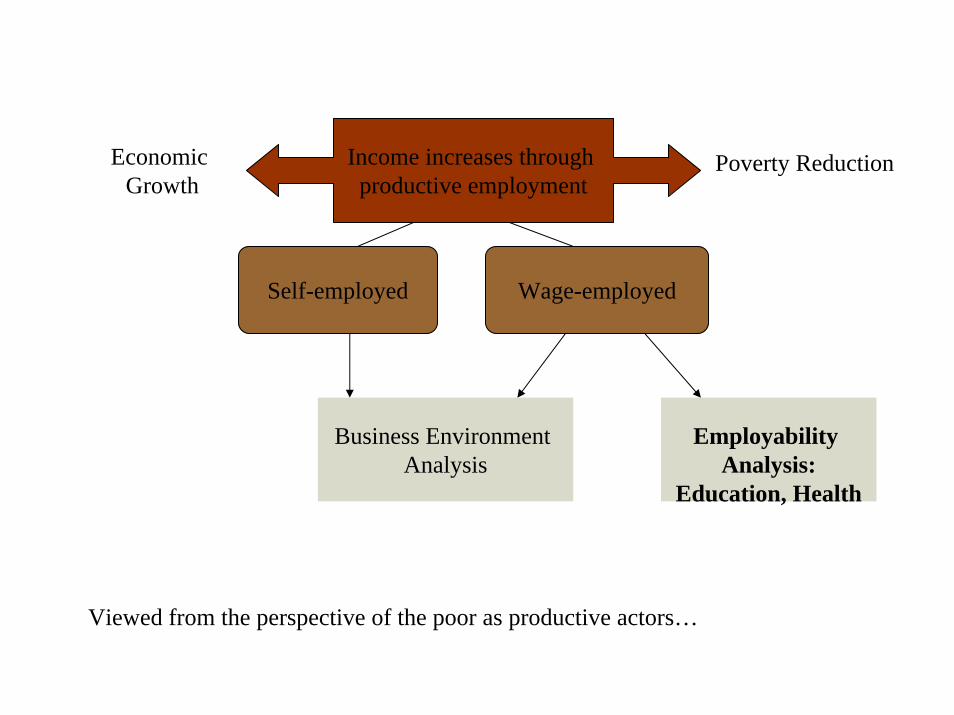
Economic Growth
Poverty Reduction
Wage-employedSelf-employed
Employability Analysis
Business Environment Analysis
Income increases through productive employment
Viewed from the perspective of the poor as productive actors…

Three Main PartsThe overall dynamics and what it tells us about the potential in different sectors
Growth-Poverty Pattern, Sector Dynamics and Productivity Dynamics
Identifying the productive activities and resources of the poorGoing through the extended tree with the objective of increasing in a sustainable way the income of the poor
Given the characteristics and future opportunities of the poor identified in step one and two.

Introduction 5
Increased and less volatile growth rates
-15
-10
-5
0
5
10
15
20
1962
1964
1966
1968
1970
1972
1974
1976
1978
1980
1982
1984
1986
1988
1990
1992
1994
1996
1998
2000
2002
2004
2006
%
050
100150
200250
300350
400450
500
LCU
thou
sand
s
GDP per capita growth (annual %) GDP growth (annual %) GDP per capita (constant LCU)

Development driven by discrete events or potentially sustainable growth?
0.0
100.0
200.0
300.0
400.0
500.0
600.0
700.0
800.0
1965
1970
1975
1980
1985
1990
1995
2000
2005
0
1000
2000
3000
4000
5000
6000
7000
Production (mt'000) LHS International price (constant 1990 USD mt) RHS
0
20
40
60
80
100
120
140
1980 1985 1990 1995 2000 2004Nu
mbe
r of e
xpor
ts0.00
0.20
0.40
0.60
0.80
1.00
1.20
Inde
x/sh
ares
No. of products exported (> 10,000 US$)Herfindahl IndexFive largest (share of merchandise exports)

Loans to the private sector
0
200,000
400,000
600,000
800,000
1,000,000
1,200,000
1,400,000
1,600,000
Dec
-98
Jun-
99
Dec
-99
Jun-
00
Dec
-00
Jun-
01
Dec
-01
Jun-
02
Dec
-02
Jun-
03
Dec
-03
Jun-
04
Dec
-04
Jun-
05
Dec
-05
Jun-
06
Dec
-06
Jun-
07
Agriculture, forestry,Fishingand huntingMining and quarying
Manufacturing
Electricity, gas, water andenergyConstruction
Wholesale and retail trade
Restaurants and hotels
Transport, storage andcommunicationsFinancial services
Community, social andpersonal servicesReal estate
Other sectors

Rural poverty reduction not responsive to growth
20
30
40
50
60
70
80
90
100
91 92 93 94 95 96 97 98 99 00 01 02 03 04 05 06
Pove
rty
Head
Cou
nt (%
)
150
170
190
210
230
250
270
290
310
GDP
Per
cap
ita (1
994
Kwac
ha)
National Headcount (LHS)National Rural (LHS)National Urban (LHS)Poverty headcount at 1US$ a dayGDP Per Capita (RHS)

Inverse relation between productivity levels/growth and employment levelsPaths out of poverty has mainly been through new employment opportunities in low-cost urban areas, or higher returns in other urban areas Productivity growth has been on the rise except in agriculture where also employment opportunities has stagnated
Value added per worker in Zambia
0
500
1000
1500
2000
2500
3000
2000 2001 2002 2003 2004 2005 2006
LCU
in th
ousa
nds
Total Agriculture Industry Services
Source: Authors’ estimates based on data from Government of Zambia and World Bank.
70%
7%
23%
AgricultureIndustryServices

What are the sources of income for the rural poor in Zambia?
Table 1: Mean Shares of Household Income by Source, by Income Quintile, Rural Areas
Quintile of National Distribution All Poorest
20% 2 3 4 Richest
20% Food crop sales 6 7 6 6 6 5 Nonfood crop sales 2 1 2 3 2 2 Non-farm business 10 11 10 10 13 11 Livestock and other ag. Income 2 2 2 3 2 3 Salary 6 3 5 6 7 11 Remittances 6 7 6 6 7 5 Pension 0 0 0 0 0 0 Nonagricultural rent 0 0 0 0 0 0 Other income 11 13 12 12 11 9 Consumption of own production 55 57 55 54 55 52
Source: World Bank (2007a)
Most rural poor are smallholder subsistence farmers

What are the sources of income for the urban poor in Zambia?
Most urban poor are employed in informal businessesand rely on multiple activities as a source of income
Table 3. Mean Shares of Household Income by Source, by Quintile, Urban Areas Quintile of National Distribution All Poorest 20% 2 3 4 Richest 20% Non-farm business 24 25 27 27 26 19 Salary 50 38 40 46 50 60 Remittances 6 8 6 5 6 5 Other income 15 20 19 16 14 13 Consumption of own production 5 9 7 7 4 3 100 100 100 100 100 100 Source: 2002-03 LCMS
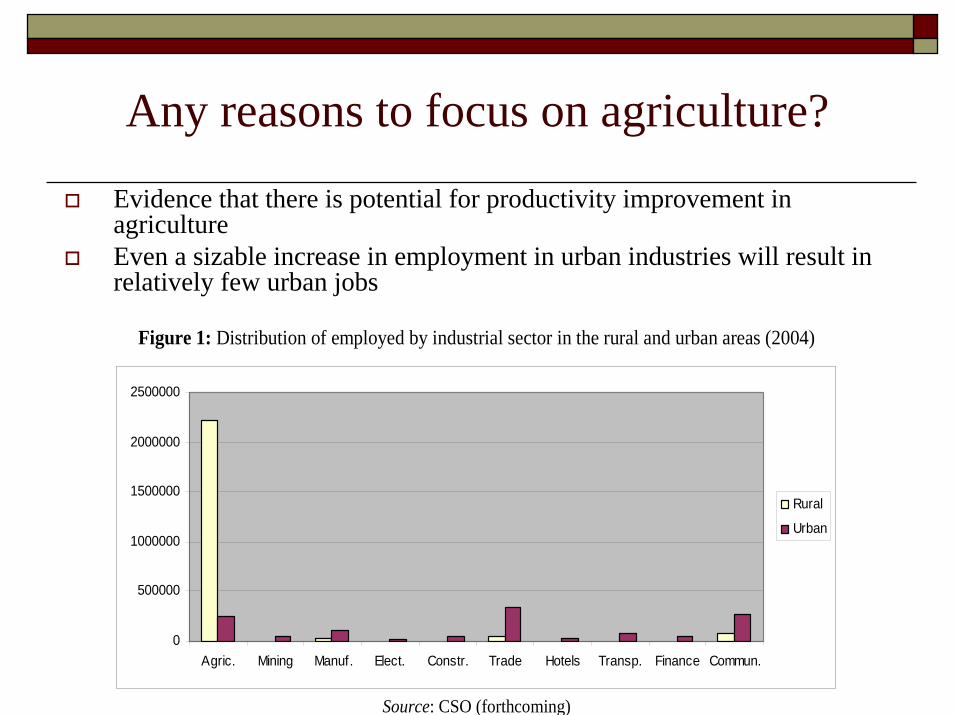
Any reasons to focus on agriculture?
Evidence that there is potential for productivity improvement inagricultureEven a sizable increase in employment in urban industries will result in relatively few urban jobs
Figure 1: Distribution of employed by industrial sector in the rural and urban areas (2004)
0
500000
1000000
1500000
2000000
2500000
Agric. Mining Manuf. Elect. Constr. Trade Hotels Transp. Finance Commun.
Rural
Urban
Source: CSO (forthcoming)

Implication of the booming mining sector
The capital intensive nature implies that few new jobs are createdAdverse REER effects on the competitiveness and job opportunities of the tradable sectors

Look for constraint to inclusive growth through:
Self as well as wage employmentAgriculture as well as non-agriculture activitiesUp-coming data on employment and additional analysis may help to narrow down further
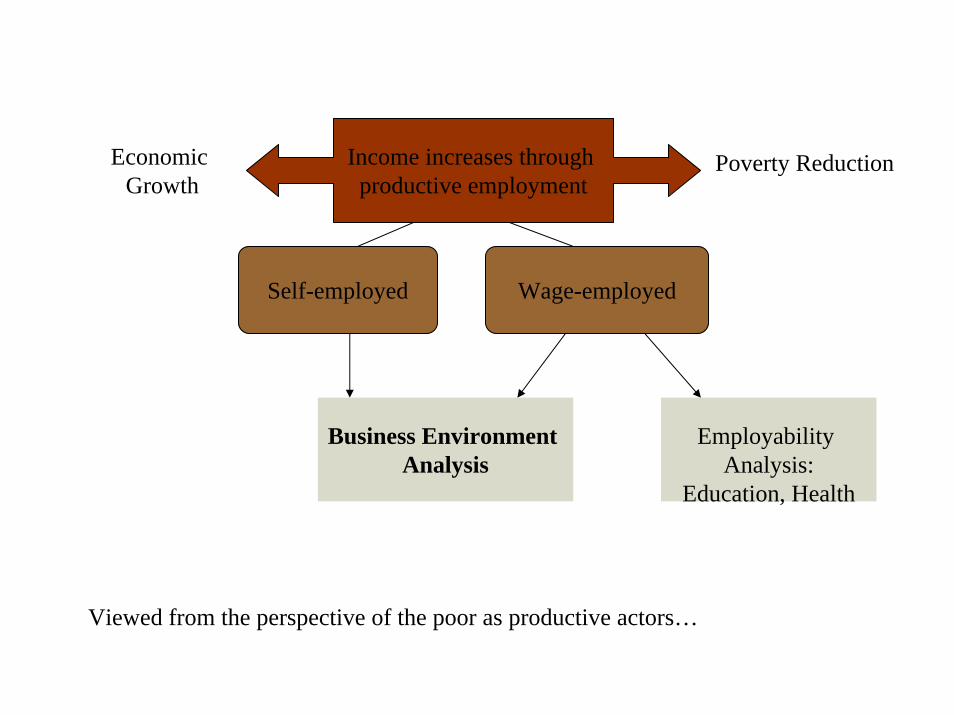
Economic Growth
Poverty Reduction
Wage-employedSelf-employed
Employability Analysis:
Education, Health
Business Environment Analysis
Income increases through productive employment
Viewed from the perspective of the poor as productive actors…

Is education a major constraint for the poor as individuals?
Major difference in mean years of education between the rich and poor households in urban areas, and limited access to higher education in rural areas
Table 1: Mean years of schooling of household head in 2002/03
All Poorest 20% Richest 20% Rural 5.3 4.4 6.2 Urban 9.3 6.6 11.1
Source: World Bank (2007a)
0102030405060708090
100
Middle Basic School(1-7)
Secondary School
RuralUrban
Percentage of households with access to education facilities within five kilometers

Is health a major constraint for the poor?
HIV/AIDS costs almost 1 percent in GDP growth per year
Prevalence rates are high: 17% of working age population in 2005 compared to the SSA average of 6%.High prevalence rates combined with poor health care provision and other diseases undermine
Labor stock and ability to provide labor;Productivity of the work force;Incentives for investment;
Economic Growth
Poverty Reduction
Wage-employedSelf-employed
Employability Analysis:
Education, Health
Business Environment Analysis
Income increases through productive employment
Viewed from the perspective of the poor as productive actors…

Business Environment Analysis
Returns to economic activity Cost of finance
Social Returns Private Appropriability
International sourcesof finance
Local sourcesof finance
Domestic savings Financial sector intermediationGovernment failures Market failures
Macro risks Micro risks
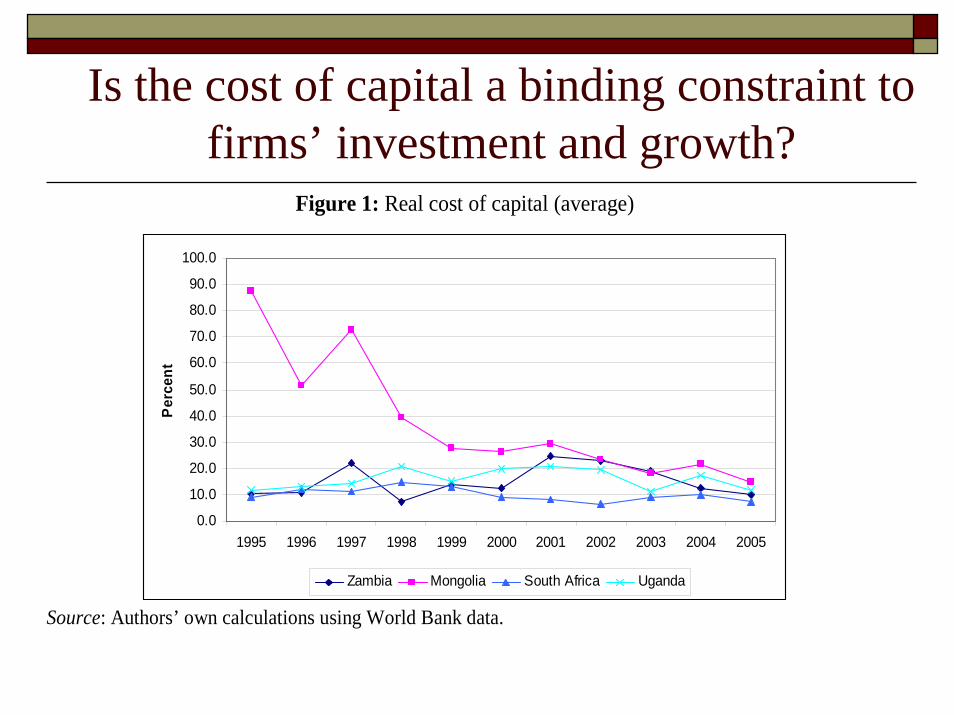
Is the cost of capital a binding constraint to firms’ investment and growth?
Figure 1: Real cost of capital (average)
0.0
10.0
20.0
30.0
40.0
50.0
60.0
70.0
80.0
90.0
100.0
1995 1996 1997 1998 1999 2000 2001 2002 2003 2004 2005
Per
cent
Zambia Mongolia South Africa Uganda
Source: Authors’ own calculations using World Bank data.
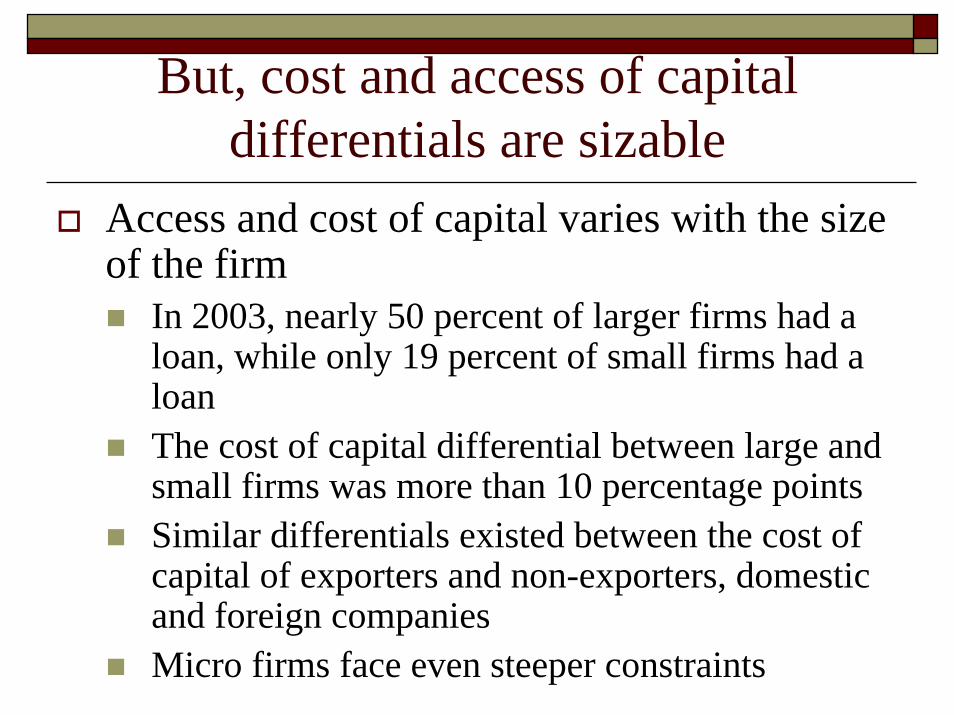
But, cost and access of capital differentials are sizable
Access and cost of capital varies with the size of the firm
In 2003, nearly 50 percent of larger firms had a loan, while only 19 percent of small firms had a loanThe cost of capital differential between large and small firms was more than 10 percentage pointsSimilar differentials existed between the cost of capital of exporters and non-exporters, domestic and foreign companiesMicro firms face even steeper constraints

What are the reasons for the poor access to and high cost of finance for small and micro firms?
Poor financial intermediation rather than low domestic savings or bad international finance
Domestic savings as a share of GDP climbed up from 6% in 1990s to 18.1% in 2006, a share higher than the SSA averageFDI and aid have been higher than the average for SSA and LICs both in 1990s and 2000s
However, there are signs of improvements: the percentage of people identifying the cost of finance as the main reason for their poverty status halved in the period 2002-06
Business Environment Analysis
Returns to economic activity Cost of finance
Social Returns Private Appropriability
International sourcesof finance
Local sourcesof finance
Domestic savings Financial sector intermediationGovernment failures Market failures
Macro risks Micro risks

Do low social returns constrain income growth?
Zambia is well endowed with natural resourcesLandlocked geographic position:
Pros: Serves as an import tax protecting domestic import-competing industries; borders 8 countries and plays an active role in regional tradeCons: reaching global markets and realizing economies of scale is a problem
Affects ability to export bulky low–value products (e.g. farm products)Requires well-developed air transport and an emphasis on high value, low weight and volume goods
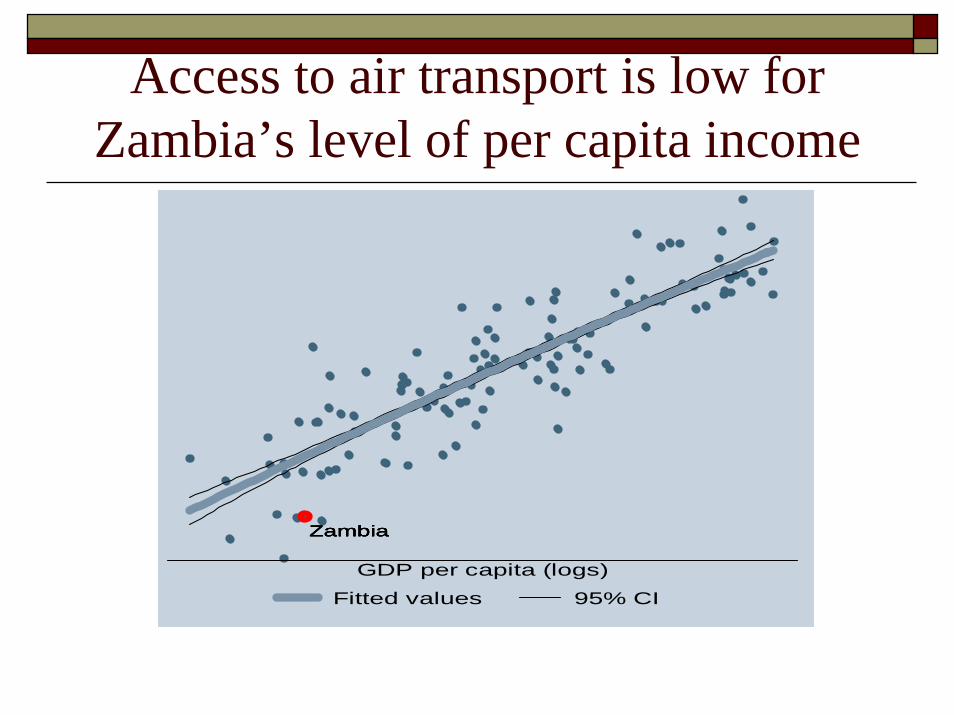
Access to air transport is low for Zambia’s level of per capita income
ZambiaZambiaZambiaZambia
GDP per capita (logs)
Fitted values 95% CI

Are infrastructure and basic services a binding constraint to income growth?
High domestic transport costs due to poor domestic road condition and high fuel:
affect the ability of rural residents to access markets;The reasons for poor access is not always because of limited supply (e.g. electricity), but because of industry structures and interestsPoor quality and expensive basic services undermine the competitiveness of firms and slow down job creation

Cost-structure: firm-level averages
Source: Eifert, Gelb, and Ramachandran (2005)

Connectivity servicesMobile rates per minute
$0.44
$0.32
$0.29
$0.27
$0.25
$0.25
$0.21
$0.14
$0.10
$0.04
$0.00 $0.05 $0.10 $0.15 $0.20 $0.25 $0.30 $0.35 $0.40 $0.45
Zambia
Botswana
Malawi
South Africa
Tanzania
Swaziland
Namibia
Mozambique
Zimbabwe
Mauritius
Source: Mattoo and Payton (2007)

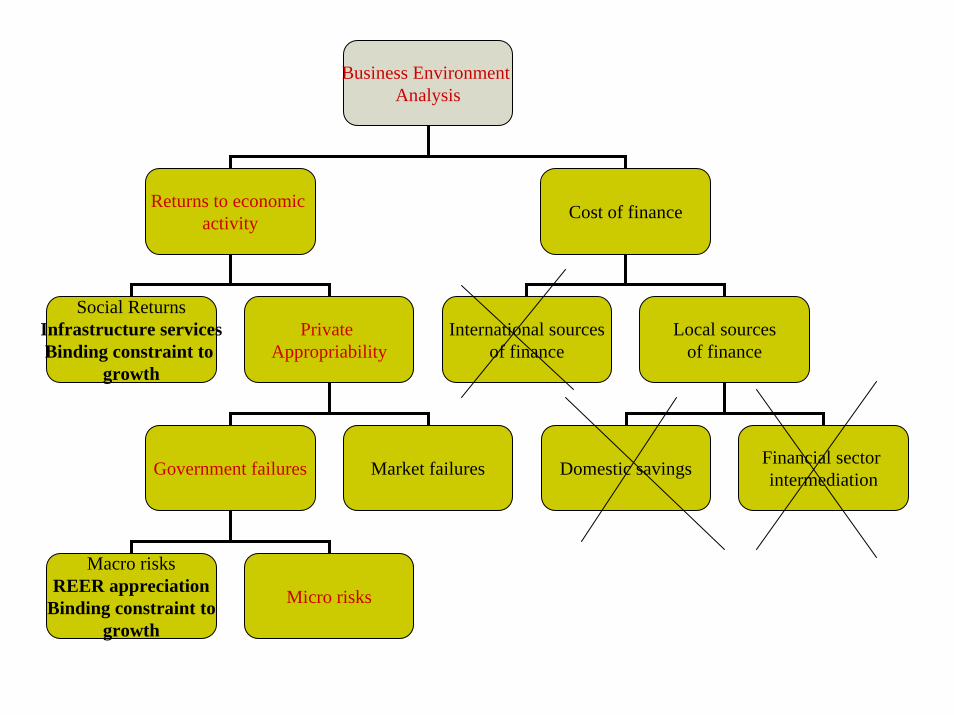
Business Environment Analysis
Returns to economic activity Cost of finance
Social ReturnsInfrastructure servicesBinding constraint to
growth
Private Appropriability
International sourcesof finance
Local sourcesof finance
Domestic savings Financial sector intermediationGovernment failures Market failures
Macro risks Micro risks

Is the macroeconomic environment a binding constraint to shared growth?
Exchange rate developments
5060708090
100110120130140150
1997 1998 1999 2000 2001 2002 2003 2004 2005 2006
REE
R in
dex
(199
7=10
0)
0
1,000
2,000
3,000
4,000
5,000
6,000
Nom
inal
Kw
acha
per
dol
lar
Business Environment Analysis
Returns to economic activity Cost of finance
Social ReturnsInfrastructure servicesBinding constraint to
growth
Private Appropriability
International sourcesof finance
Local sourcesof finance
Domestic savings Financial sector intermediationGovernment failures Market failures
Macro risksREER appreciation
Binding constraint togrowth
Micro risks

Are property rights over land a major constraint to income growth?
Customary land arrangements with limited transfer possibilities are dominant, with only 6-15% of land under statutory tenureThe land system is not perceived as a binding constraint to shared growth
Land is abundant – only 40% of arable land is usedMost smallholders who demand more land get land from their chiefs (only 4% of respondents mentioned lack of land as a reason for poverty)Despite small plot sizes, a typical household does not have capability to cultivate more landThe system creates risks to future returns on investmentsLack of serviced land with access to infrastructure is a perceived binding constraint to operations implying not land, but rural infrastructure is a bottleneck

Is regulatory uncertainty and government interventions an obstacle to shared growth?
Regulatory uncertainty is the fourth most binding constraint to firms’ operations
Most of firm owners (70 percent) think that officials’interpretation of regulations is inconsistent and unpredictableProblem is especially acute in agriculture
Fertilizer subsidy programLast minute contracts push up the cost of the inputProgram not well targeted opens opportunities for rent seekingProgram is expensive (accounts for 50% of the budget earmarked for agriculture, compared to only 3% for irrigation and other rural infrastructure)

Is governance a constraint?

Business Environment Analysis
Returns to economic activity Cost of finance
Social ReturnsInfrastructure servicesBinding constraint to
growth
Private Appropriability
International sourcesof finance
Local sourcesof finance
Domestic savings Financial sector intermediationGovernment failures Market failures
Macro risksREER appreciation
Binding constraint togrowth
Micro risksRegulatory uncertainty
Government effectivenessBinding constraint to
growth

Are market failures binding constraints for income growth?
Firms need services requiring simultaneous, large scale investments in:
basic infrastructure and connectivity services which ensure access to inputs and foreign markets;marketing, state-of-the-art technology, and product quality information services
Might be a development trap:No incentives for private investor before a certain level of economic activityEspecially severe in sparsely populated countries

Rural-urban differentials in connectivity service provision
Poor access and high cost of basic services are major constraints to growthRural areas are at a disadvantage relative to urban areas
0
20
40
60
80
100
120
FoodMarket
InputMarket
Post Office PublicTransport
PublicPhone
InternetCafe
RuralUrban
Source: CSO (forthcoming)
Farm level productivity is negatively correlated with weak service performanceExamples where there were positive coordination externalities (e.g. outgrower schemes)
Number of households with access to facilities within 5 km

Business Environment Analysis
Returns to economic activity Cost of finance
Social ReturnsInfrastructure servicesBinding constraint to
growth
Private Appropriability
International sourcesof finance
Local sourcesof finance
Domestic savings Financial sector intermediationGovernment failures
Market failuresCoordination failuresBinding constraint to
growth
Macro risksREER appreciation
Binding constraint togrowth
Micro risksRegulatory uncertainty
Government effectivenessBinding constraint to
growth

Bindings constraints to shared growth in Zambia
Lack of positive coordination externalities (rural-urban connectivity)Poor government effectivenessRegulatory uncertainty and government interventions (stop doing harm before doing good, especially severe in agriculture)Real exchange rate appreciation (international connectivity)Access to post-primary education and health for the poor
end
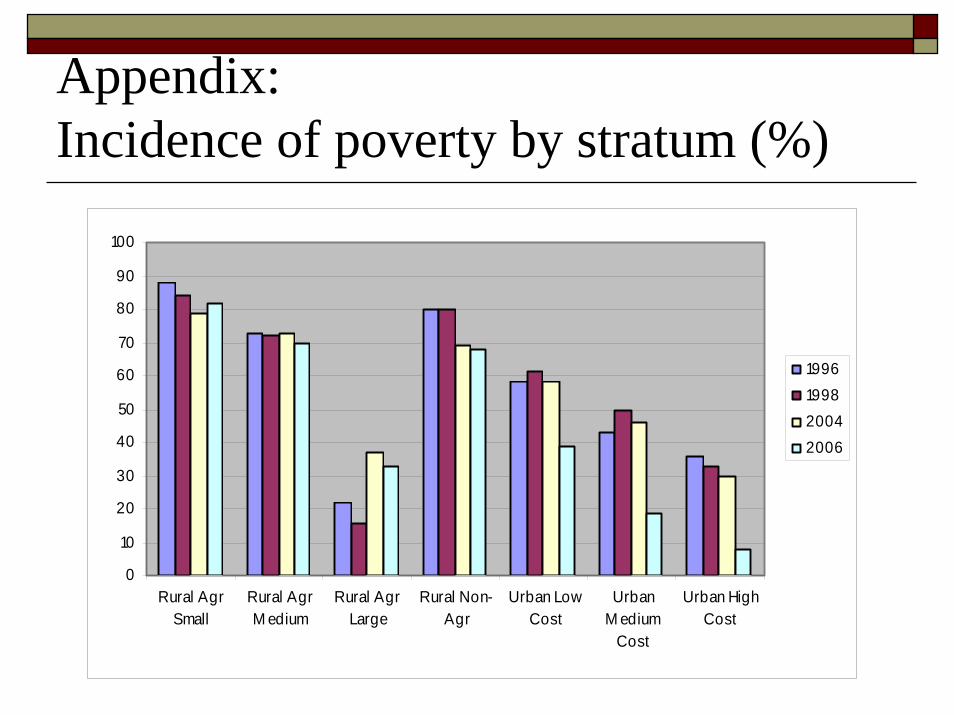
Appendix:Incidence of poverty by stratum (%)
0
10
20
30
40
50
60
70
80
90
100
Rural AgrSmall
Rural AgrM edium
Rural AgrLarge
Rural Non-Agr
Urban LowCost
UrbanM edium
Cost
Urban HighCost
1996199820042006

Appendix:Number of people employed by stratum
0
500000
1000000
1500000
2000000
2500000
RuralAgr
Small
RuralAgr
Medium
RuralAgr
Large
RuralNon-Agr
UrbanLowCost
UrbanMedium
Cost
UrbanHighCost
1996
1998
2004
2006