what are we looking for?
DESCRIPTION
G41A-0887. Comparison of GRACE gravity field solutions, hydrological models and time series of superconducting gravimeters in Central Europe. de Viron O. 1 , Van Camp M. 1,2 , Métivier L. 3 , Meurers B. 4 , Francis, O. 5 , H. Wziontek 6. 1 IPGP - PowerPoint PPT PresentationTRANSCRIPT
WE
WA
VI
ST
PE
MO
MB
MC
CO CO
BH
MC
MB
MO
PE
ST
VI
WA
Comparison of GRACE gravity field solutions, hydrological models and time series of superconducting gravimeters in Central Europe
Are there common signals between terrestrial gravity data from superconducting gravimeters (SGs), time series from the GRACE satellites and hydrological models?
What are we looking for?
1IPGP2Royal Observatory of Belgium -- [email protected]
3IGN France. 4U. Vienna, 5U. Luxembourg, 6Bundesamt für Kartographie und Geodäsie
Results
Figure 1. SG stations
de Viron O.1, Van Camp M. 1,2, Métivier L.3, Meurers B.4, Francis, O.5, H. Wziontek6
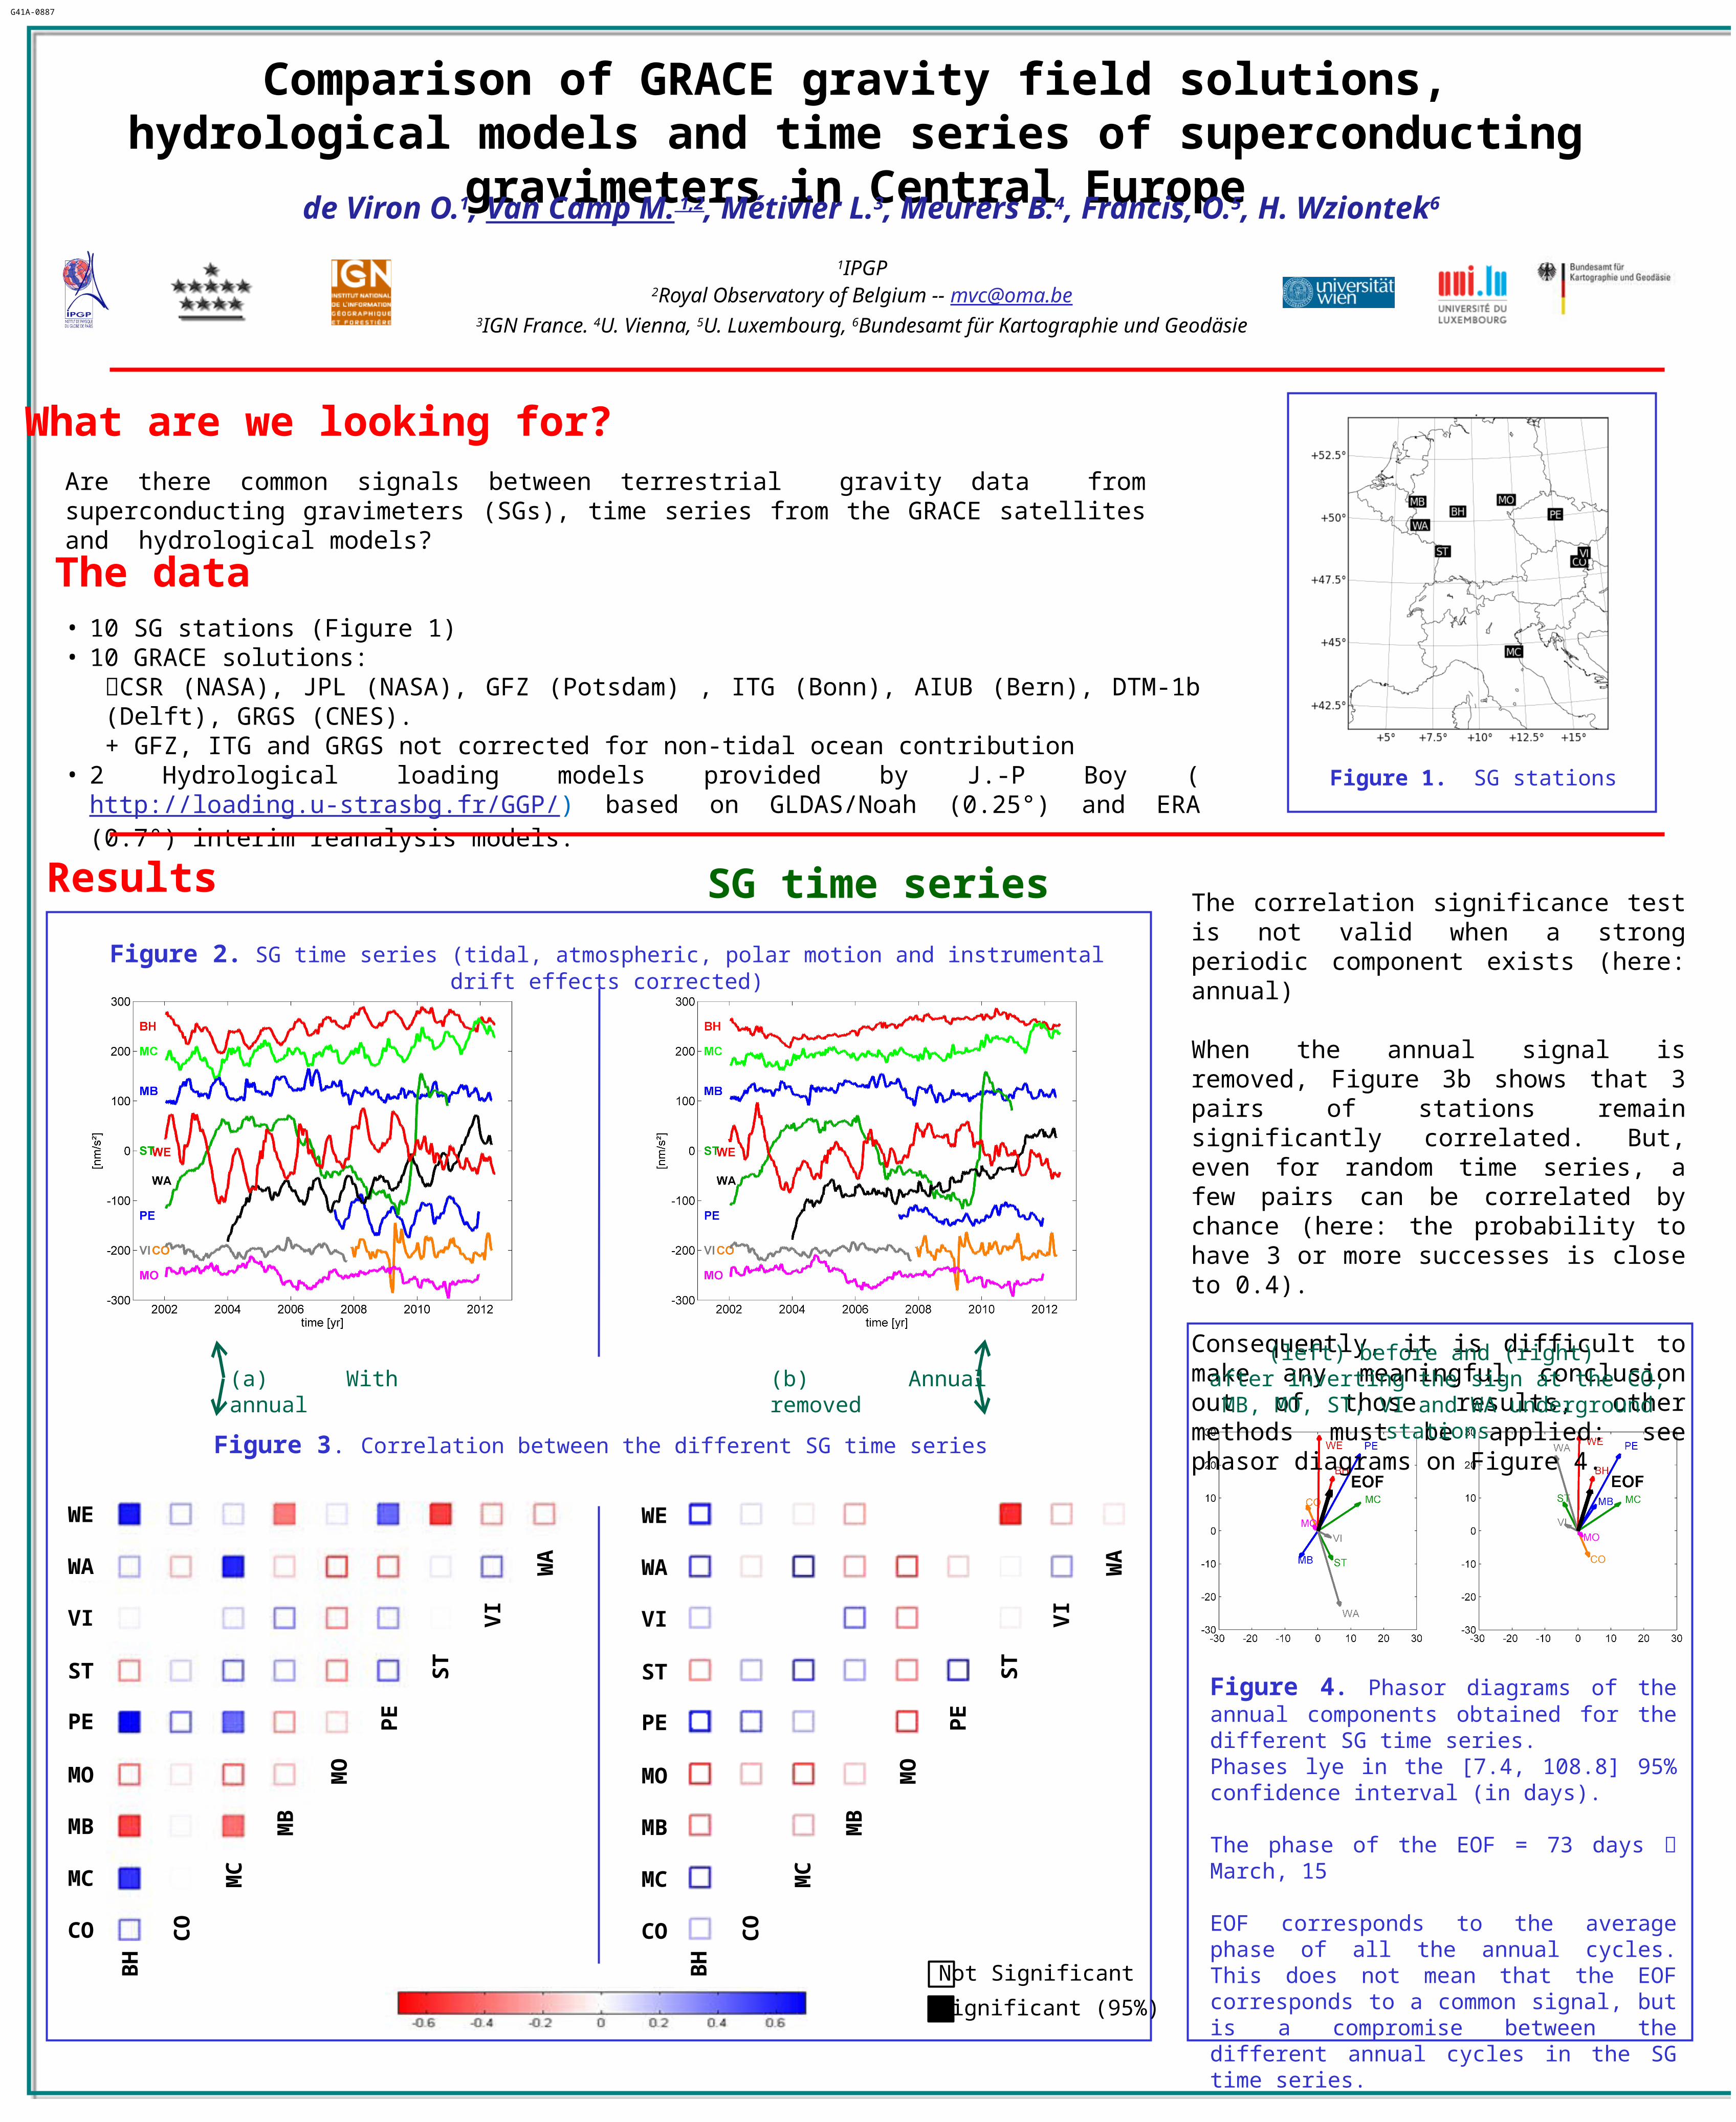
Figure 4. Phasor diagrams of the annual components obtained for the different SG time series. Phases lye in the [7.4, 108.8] 95% confidence interval (in days).
The phase of the EOF = 73 days March, 15
EOF corresponds to the average phase of all the annual cycles. This does not mean that the EOF corresponds to a common signal, but is a compromise between the different annual cycles in the SG time series.
G41A-0887
• 10 SG stations (Figure 1)• 10 GRACE solutions:
CSR (NASA), JPL (NASA), GFZ (Potsdam) , ITG (Bonn), AIUB (Bern), DTM-1b (Delft), GRGS (CNES).+ GFZ, ITG and GRGS not corrected for non-tidal ocean contribution
• 2 Hydrological loading models provided by J.-P Boy (http://loading.u-strasbg.fr/GGP/) based on GLDAS/Noah (0.25°) and ERA (0.7°) interim reanalysis models.
The data
Figure 2. SG time series (tidal, atmospheric, polar motion and instrumental drift effects corrected)
Figure 3. Correlation between the different SG time series
SG time series
WE
WA
VI
ST
PE
MO
MB
MC
CO CO
BH
MC
MB
MO
PE
ST
VI
WA
(a) With annual (b) Annual removed
Not SignificantSignificant (95%)
The correlation significance test is not valid when a strong periodic component exists (here: annual)
When the annual signal is removed, Figure 3b shows that 3 pairs of stations remain significantly correlated. But, even for random time series, a few pairs can be correlated by chance (here: the probability to have 3 or more successes is close to 0.4).
Consequently, it is difficult to make any meaningful conclusion out of those results, other methods must be applied: see phasor diagrams on Figure 4.
(left) before and (right) after inverting the sign at the CO, MB, MO,
ST, VI and WA underground stations
Acknowledgements
SGs vs GRACE & Hydrological models
The authors thank the operators of the SG stations. The data from MO, PE and ST were obtained through the GGP project database hosted by the GFZ Potsdam. We are grateful to J.-P. Boy for fruitful discussions and making available the atmospheric and hydrological loading models. We thank L. Vandercoilden for her assistance in the processing of the GGP data.
Discussion
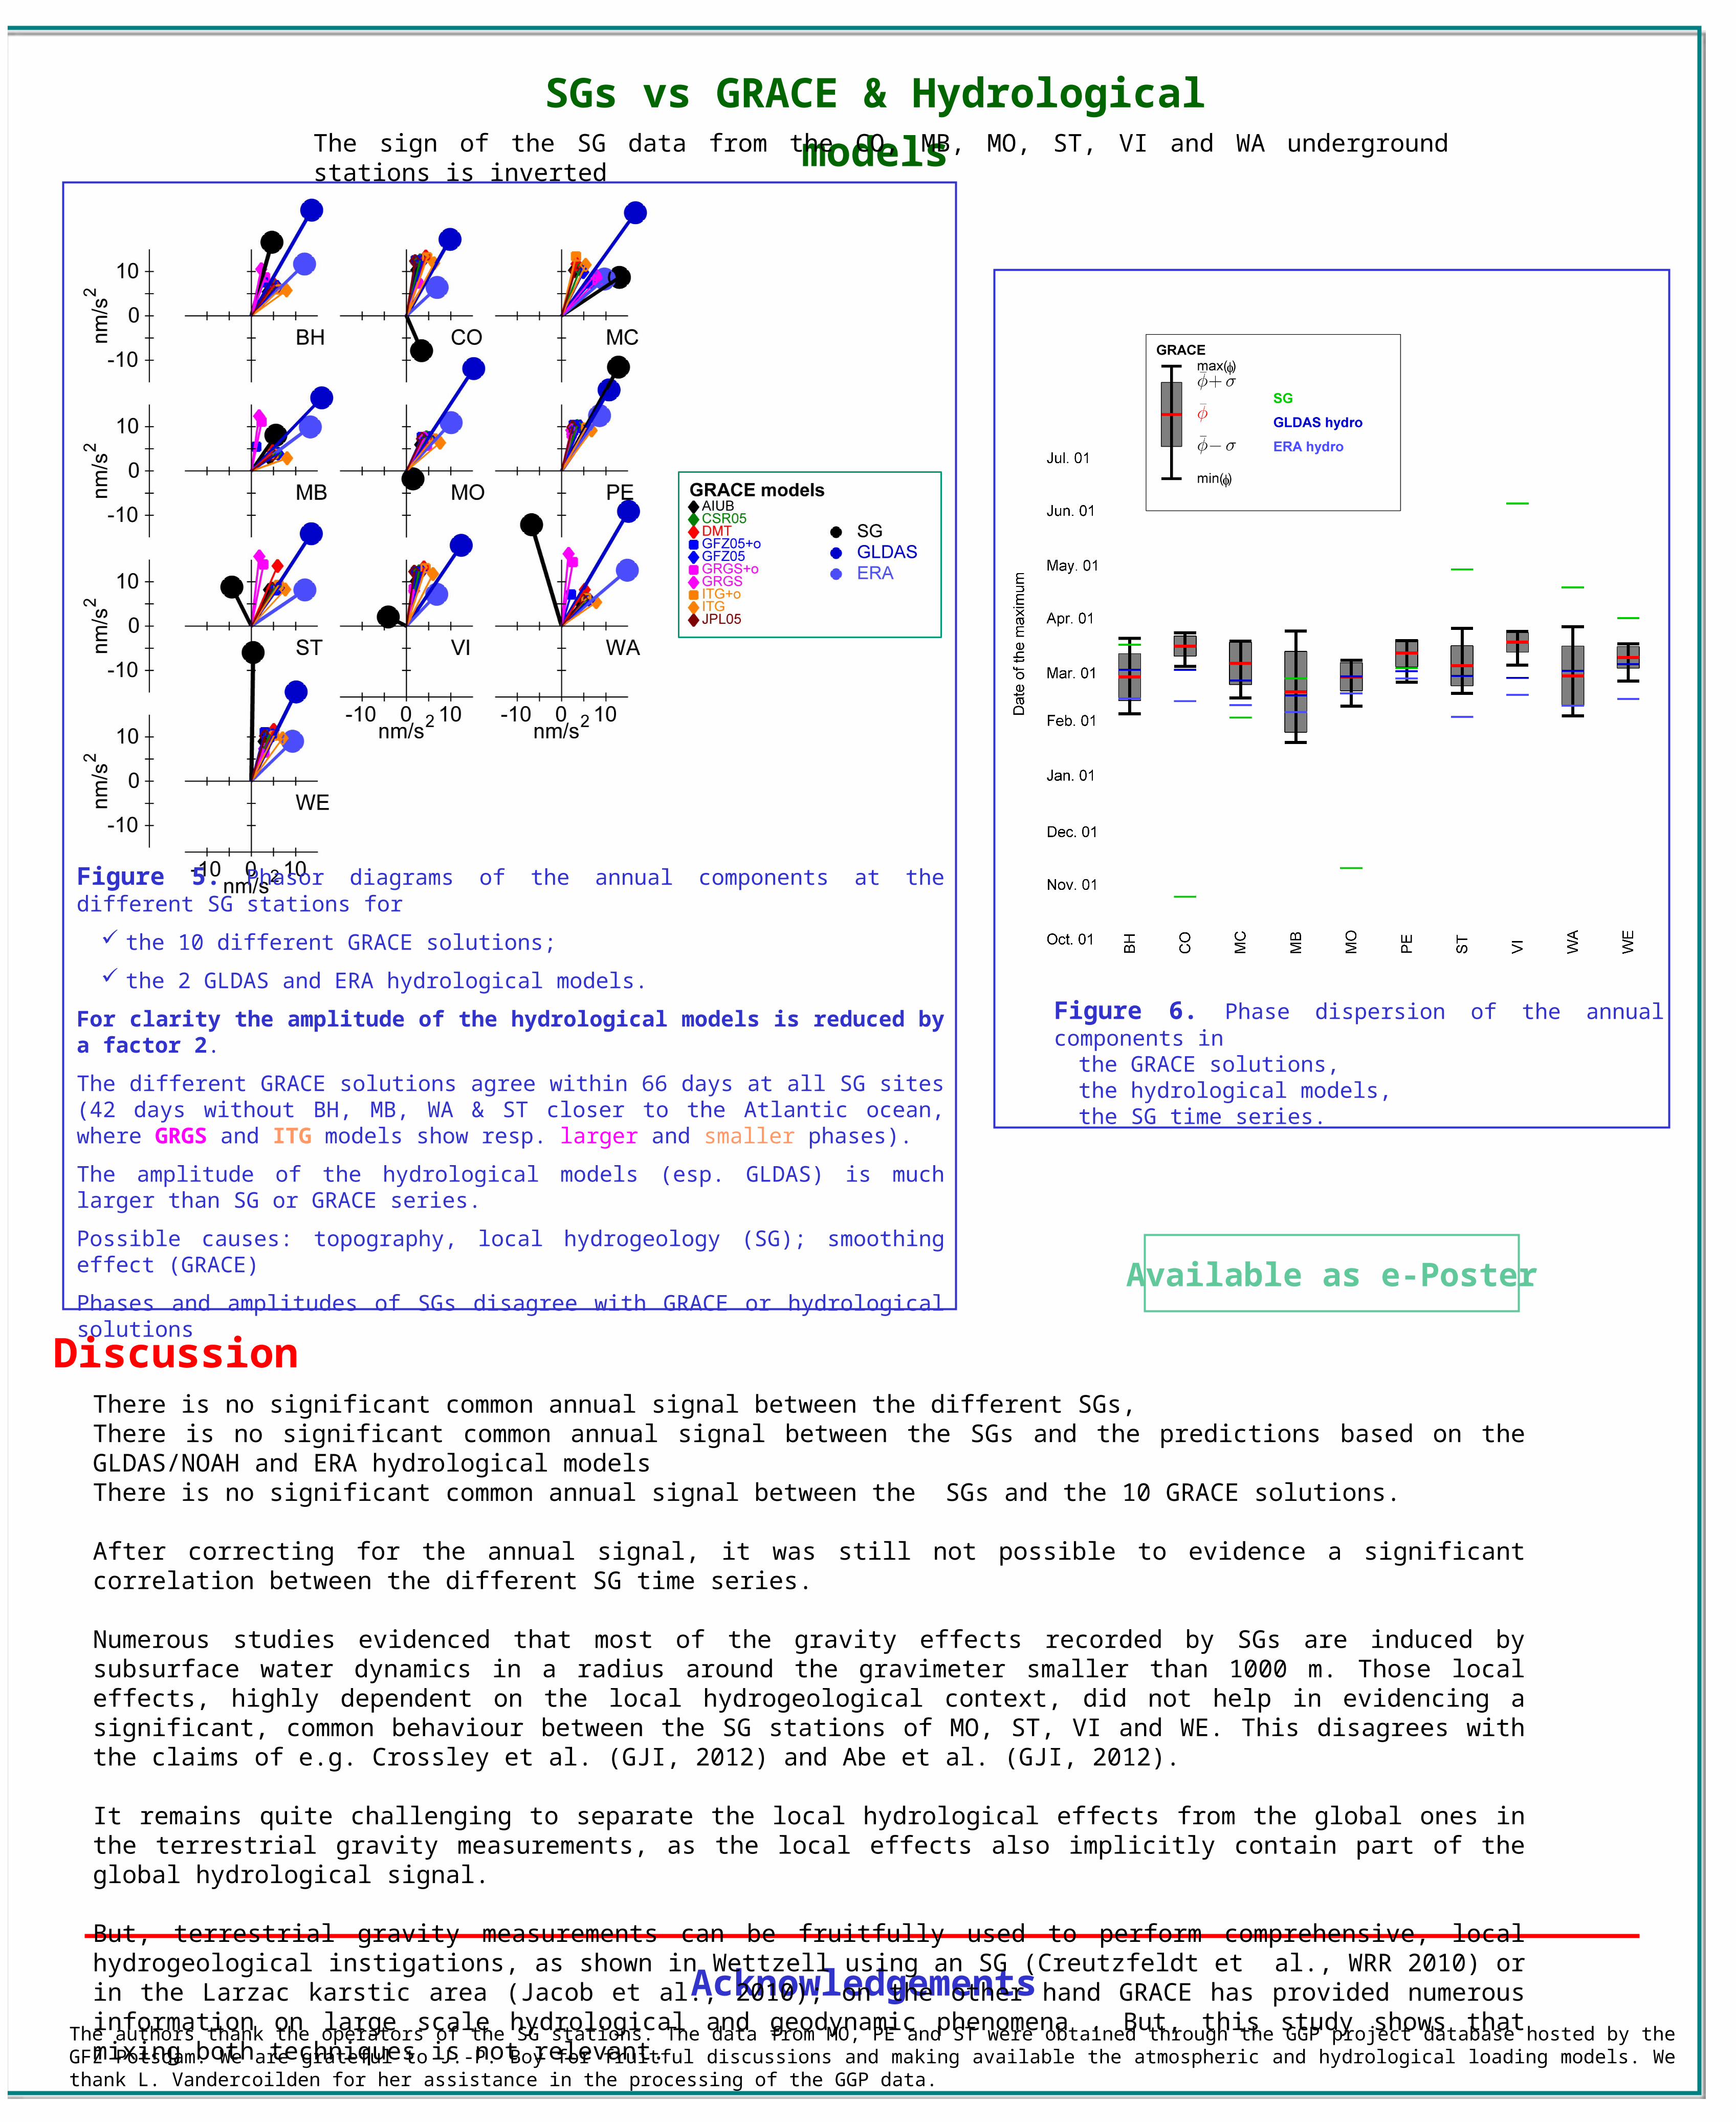
Figure 6. Phase dispersion of the annual components in
the GRACE solutions,the hydrological models,the SG time series.
There is no significant common annual signal between the different SGs, There is no significant common annual signal between the SGs and the predictions based on the GLDAS/NOAH and ERA hydrological models There is no significant common annual signal between the SGs and the 10 GRACE solutions.
After correcting for the annual signal, it was still not possible to evidence a significant correlation between the different SG time series.
Numerous studies evidenced that most of the gravity effects recorded by SGs are induced by subsurface water dynamics in a radius around the gravimeter smaller than 1000 m. Those local effects, highly dependent on the local hydrogeological context, did not help in evidencing a significant, common behaviour between the SG stations of MO, ST, VI and WE. This disagrees with the claims of e.g. Crossley et al. (GJI, 2012) and Abe et al. (GJI, 2012).
It remains quite challenging to separate the local hydrological effects from the global ones in the terrestrial gravity measurements, as the local effects also implicitly contain part of the global hydrological signal.
But, terrestrial gravity measurements can be fruitfully used to perform comprehensive, local hydrogeological instigations, as shown in Wettzell using an SG (Creutzfeldt et al., WRR 2010) or in the Larzac karstic area (Jacob et al., 2010); on the other hand GRACE has provided numerous information on large scale hydrological and geodynamic phenomena . But, this study shows that mixing both techniques is not relevant.
The sign of the SG data from the CO, MB, MO, ST, VI and WA underground stations is inverted
Figure 5. Phasor diagrams of the annual components at the different SG stations for
the 10 different GRACE solutions; the 2 GLDAS and ERA hydrological models.
For clarity the amplitude of the hydrological models is reduced by a factor 2.The different GRACE solutions agree within 66 days at all SG sites (42 days without BH, MB, WA & ST closer to the Atlantic ocean, where GRGS and ITG models show resp. larger and smaller phases).The amplitude of the hydrological models (esp. GLDAS) is much larger than SG or GRACE series. Possible causes: topography, local hydrogeology (SG); smoothing effect (GRACE)Phases and amplitudes of SGs disagree with GRACE or hydrological solutions
Available as e-Poster