what caused the decline in u. s. business cycle volatility? robert j. gordon northwestern university...
Post on 21-Dec-2015
213 views
TRANSCRIPT
What Caused the DeclineWhat Caused the Declinein U. S. Business Cycle in U. S. Business Cycle
Volatility?Volatility?
Robert J. GordonRobert J. GordonNorthwestern UniversityNorthwestern University
Presented at Reserve Bank of Presented at Reserve Bank of Australia, July 11, 2005Australia, July 11, 2005

Instant Obsolescence in Instant Obsolescence in MacroeconomicsMacroeconomics
Prosperity in 1960s bred conferences on Prosperity in 1960s bred conferences on “Is the Business Cycle Obsolete?”“Is the Business Cycle Obsolete?”
My 1984 conference came after the two My 1984 conference came after the two large recessions of 1974-75 and 1981-82large recessions of 1974-75 and 1981-82
But on the day of the conference, the But on the day of the conference, the business cycle changed again, continuing business cycle changed again, continuing the tradition of “instant obsolescence”the tradition of “instant obsolescence”
No disputing the decline in volatility since No disputing the decline in volatility since 1984, but why?1984, but why? Numerous participants in last week’s Fed Numerous participants in last week’s Fed
conference took it for granted that it was an conference took it for granted that it was an achievement of monetary policyachievement of monetary policy

Earlier Explanations of Postwar Earlier Explanations of Postwar Stability Compared to pre-1929Stability Compared to pre-1929
Increased share of government, Increased share of government, higher tax base creates automatic higher tax base creates automatic stabilizersstabilizers
Less procyclicality of money supplyLess procyclicality of money supplyFDIC, Other Financial Market ReformsFDIC, Other Financial Market Reforms
Stabilization Stabilization withinwithin Postwar, Postwar,before and after 1984before and after 1984
ShocksShocks Demand shocksDemand shocks
Federal government now the culprit not the Federal government now the culprit not the saviourFinancial and banking reformssaviourFinancial and banking reforms
Inventory managementInventory managementFinancial Market Deregulation stabilized residential Financial Market Deregulation stabilized residential
housinghousing Supply shocks, a main focus of this paperSupply shocks, a main focus of this paper
Improved monetary policyImproved monetary policy Of Lesser ImportanceOf Lesser Importance
Shifts in shares to servicesShifts in shares to services

Preview of PaperPreview of Paper
Composition analysis across 11 Composition analysis across 11 components of spending on GDPcomponents of spending on GDP Role of composition shifts vs. reduction in Role of composition shifts vs. reduction in
within-sector volatilitywithin-sector volatility Isolation of three sectors as most responsible Isolation of three sectors as most responsible
for improved stability; support for demand for improved stability; support for demand shocksshocks
Building a three-equation macro modelBuilding a three-equation macro model Inflation, Taylor Rule, Change in Output GapInflation, Taylor Rule, Change in Output Gap In the spirit of Stock-Watson two papers, but a In the spirit of Stock-Watson two papers, but a
more explicit interpretation of the shocks and a more explicit interpretation of the shocks and a surprising result about monetary policysurprising result about monetary policy

-4
-2
0
2
4
6
8
10
12
14
1945 1950 1955 1960 1965 1970 1975 1980 1985 1990 1995 2000 2005
Perc
en
t p
er
year
Actual Real GDP Growth
Average Real GDP Growth
Initial Evidence on Initial Evidence on Reduced Volatility (4-qtr Reduced Volatility (4-qtr
ΔΔ Real GDP) Real GDP)
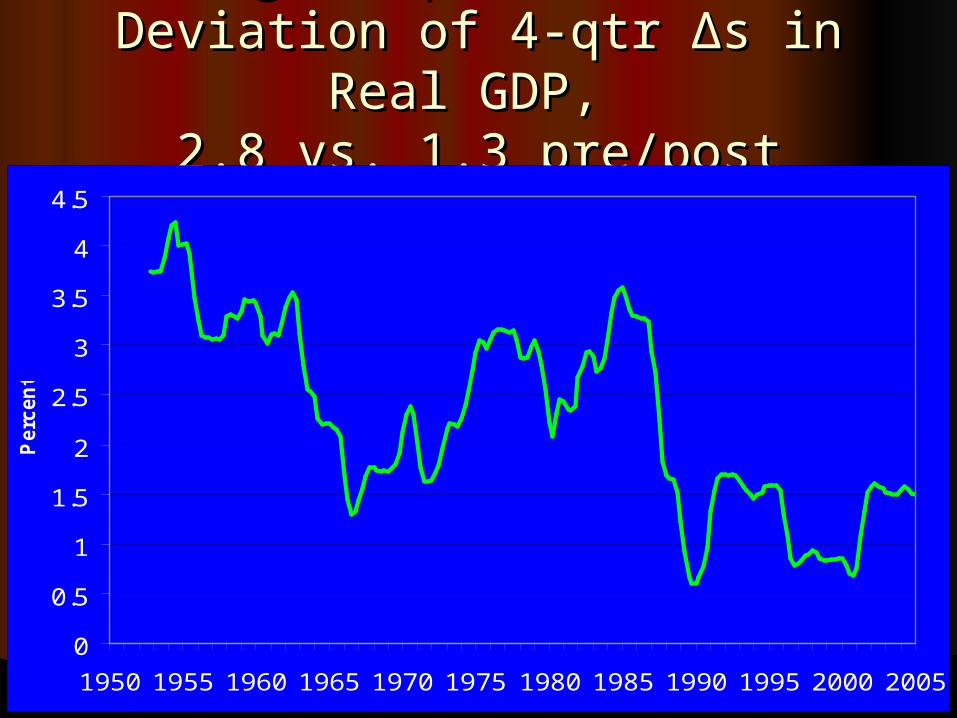
Rolling 20-quarter Standard Rolling 20-quarter Standard Deviation of 4-qtr Deviation of 4-qtr ΔΔs in Real s in Real
GDP, GDP, 2.8 vs. 1.3 pre/post 1988:Q12.8 vs. 1.3 pre/post 1988:Q1
0
0.5
1
1.5
2
2.5
3
3.5
4
4.5
1950 1955 1960 1965 1970 1975 1980 1985 1990 1995 2000 2005
Perc
en
t
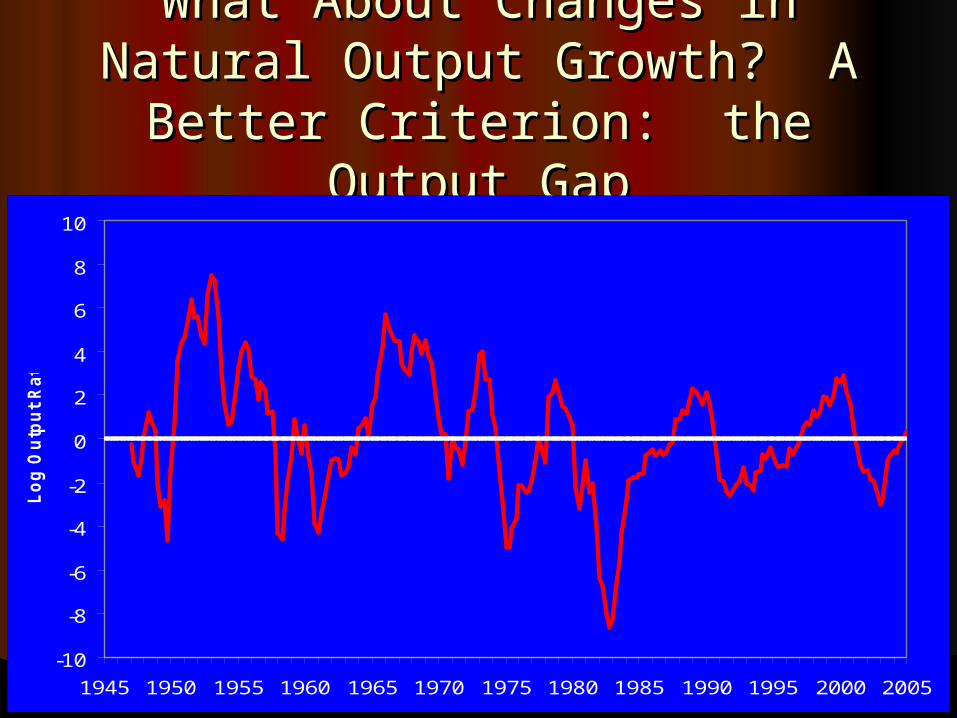
What About Changes in Natural What About Changes in Natural Output Growth? A Better Output Growth? A Better Criterion: the Output GapCriterion: the Output Gap
-10
-8
-6
-4
-2
0
2
4
6
8
10
1945 1950 1955 1960 1965 1970 1975 1980 1985 1990 1995 2000 2005
Lo
g O
utp
ut
Rati
o

Stability Less Obvious butStability Less Obvious butStill Significant, Decline 42% vs. Still Significant, Decline 42% vs.
57%57%
0
0.5
1
1.5
2
2.5
3
3.5
4
4.5
1945 1950 1955 1960 1965 1970 1975 1980 1985 1990 1995 2000 2005
Perc
en
t

Inflation vs. Output Volatility:Inflation vs. Output Volatility:Sometimes the Same, butSometimes the Same, but
Other Times DifferentOther Times Different
0
0.5
1
1.5
2
2.5
3
3.5
4
4.5
1950 1955 1960 1965 1970 1975 1980 1985 1990 1995 2000 2005
Real GDP Growth Volatility
Inflation Volatility
Turn to Tables for Turn to Tables for Decomposition AnalysisDecomposition Analysis
Table 1: Standard Deviations and Table 1: Standard Deviations and Shares of 11 SectorsShares of 11 Sectors
Table 2: Effect of Shifts in Shares Table 2: Effect of Shifts in Shares and Own-Sector Volatilityand Own-Sector Volatility
Table 3: Contributions to GDP Table 3: Contributions to GDP Change:Change:Emphasis on Residential Investment, Emphasis on Residential Investment,
Inventory Investment, and Federal Inventory Investment, and Federal SpendingSpending
Building the Three Equation Building the Three Equation ModelModel
Combines my “mainstream” or “triangle” Combines my “mainstream” or “triangle” approach to explaining inflationapproach to explaining inflation InertiaInertia Demand through output or U gapDemand through output or U gap Specific supply shocksSpecific supply shocks
““Taylor Rule” equation for Fed Funds rateTaylor Rule” equation for Fed Funds rate Coefficients allowed to change, 1979 and 1990Coefficients allowed to change, 1979 and 1990
Output gap equation with feedback from Output gap equation with feedback from interest rate changesinterest rate changes
The Inflation Equation: the The Inflation Equation: the Distinguishing FeaturesDistinguishing Features
Long 24-quarter lags on past inflationLong 24-quarter lags on past inflationNo pretense that these represent No pretense that these represent
expectations – some unknown combination expectations – some unknown combination of expectations, wage contracts, price of expectations, wage contracts, price contractscontracts
Demand enters through the Demand enters through the unemployment gapunemployment gapTime-varying NAIRU estimated as part of Time-varying NAIRU estimated as part of
equation estimationequation estimation““No-shock” concept of NAIRUNo-shock” concept of NAIRU

Supply-shock variablesSupply-shock variables
Changes in the relative price of Changes in the relative price of importsimports
The food-energy effectThe food-energy effectThe medical care effectThe medical care effectAcceleration and deceleration of the Acceleration and deceleration of the
productivity growth trendproductivity growth trendNixon-era controls, held down inflation Nixon-era controls, held down inflation
in 1971-72, boosted inflation in 1974in 1971-72, boosted inflation in 1974

Changes in Relative Import Changes in Relative Import PricesPrices
-15
-10
-5
0
5
10
15
1960 1965 1970 1975 1980 1985 1990 1995 2000
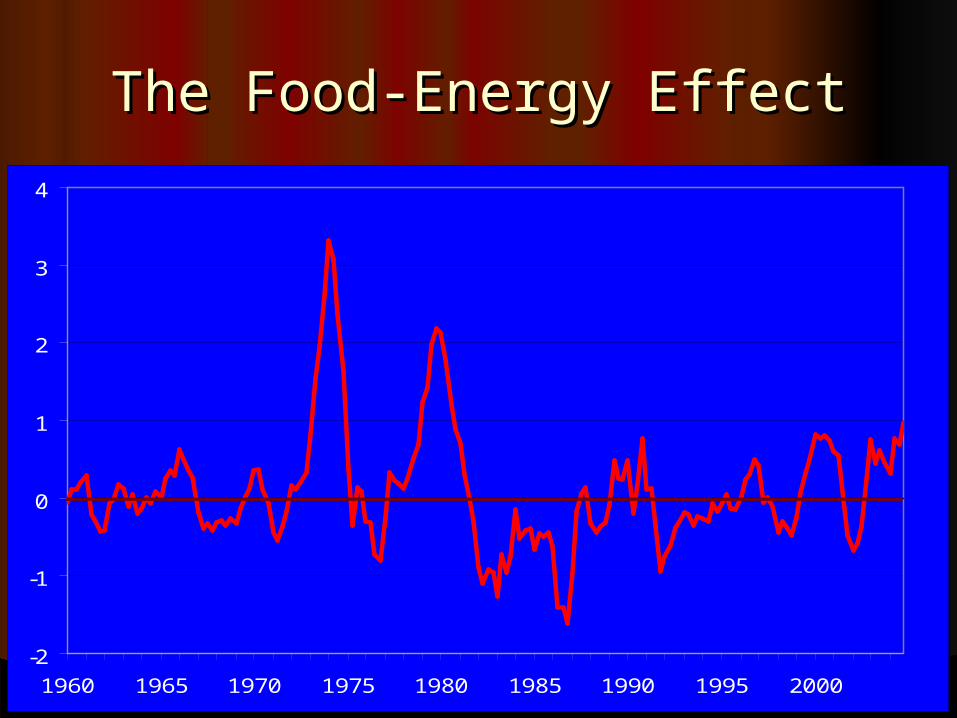
The Food-Energy EffectThe Food-Energy Effect
-2
-1
0
1
2
3
4
1960 1965 1970 1975 1980 1985 1990 1995 2000

The Medical Care EffectThe Medical Care Effect
-0.2
-0.1
0
0.1
0.2
0.3
0.4
0.5
0.6
1960 1965 1970 1975 1980 1985 1990 1995 2000
Pe
rce
nt
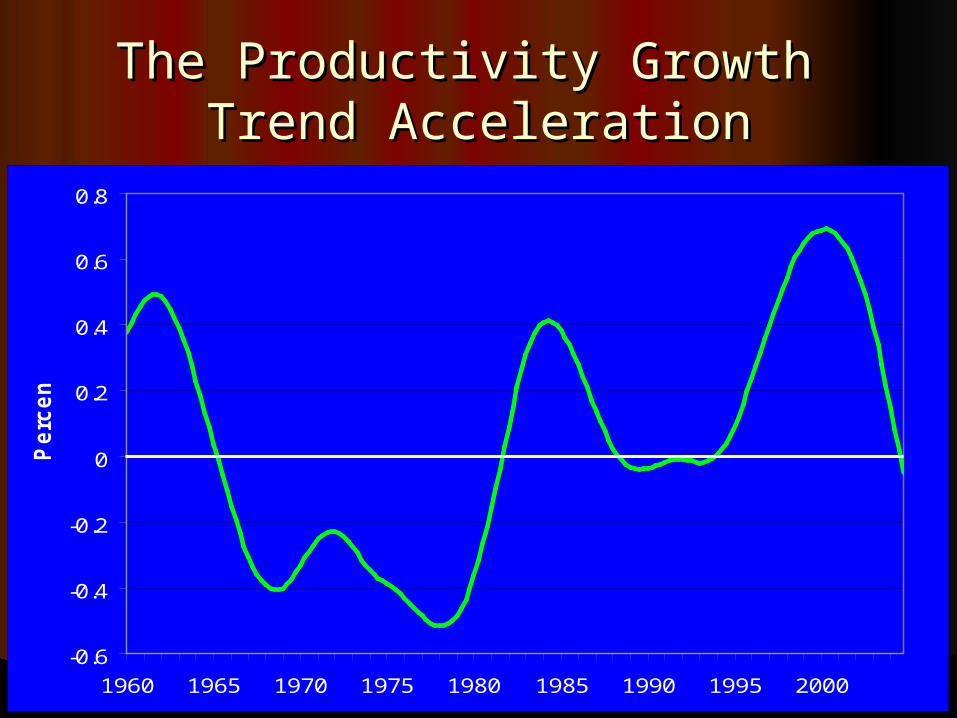
The Productivity Growth The Productivity Growth Trend AccelerationTrend Acceleration
-0.6
-0.4
-0.2
0
0.2
0.4
0.6
0.8
1960 1965 1970 1975 1980 1985 1990 1995 2000
Pe
rce
nt

Actual Unemployment RateActual Unemployment Rateand the Time-Varying NAIRU and the Time-Varying NAIRU
(TVN)(TVN)
0
2
4
6
8
10
12
1962:01 1967:01 1972:01 1977:01 1982:01 1987:01 1992:01 1997:01 2002:01
Actual Unemployment Rate
Time Varying NAIRU

Coefficients of Inflation Coefficients of Inflation Equation are in Table 4Equation are in Table 4
Brief Comments on Size and Sign of Brief Comments on Size and Sign of CoefficientsCoefficients
Importance of Testing Inflation Importance of Testing Inflation Coefficients with Dynamic SimulationsCoefficients with Dynamic Simulations
Results in Bottom of Table 4: Estimate Results in Bottom of Table 4: Estimate coefficients through 1994:Q4, coefficients through 1994:Q4, simulation 1995:Q1 to 2004:Q4 (40 simulation 1995:Q1 to 2004:Q4 (40 quarters)quarters)
Qualification: The Simulation Knows Qualification: The Simulation Knows the Time-Varying NAIRUthe Time-Varying NAIRU

A Longer Simulation:A Longer Simulation:160 Quarters Knowing the TVN 160 Quarters Knowing the TVN and the full-period coefficientsand the full-period coefficients
0
2
4
6
8
10
12
1960 1965 1970 1975 1980 1985 1990 1995 2000
Predicted Inflation w ith Actual Shocks, 1965-2004
Actual Inflation
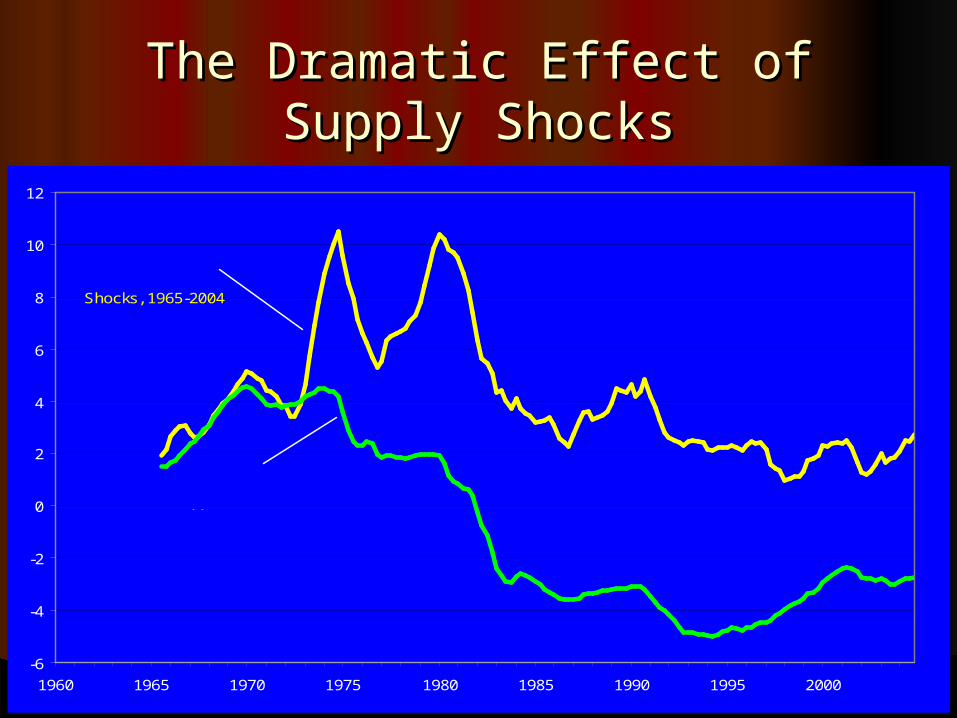
The Dramatic Effect of Supply The Dramatic Effect of Supply ShocksShocks
-6
-4
-2
0
2
4
6
8
10
12
1960 1965 1970 1975 1980 1985 1990 1995 2000
Predicted Inflation w ith Actual Shocks, 1965-2004
Predicted Inflation w ith ShocksSuppressed, 1965-2004
The Interest Rate EquationThe Interest Rate Equation
R = T* + p* + a(p-p*) + b(Ygap)R = T* + p* + a(p-p*) + b(Ygap)Estimated over three time intervalsEstimated over three time intervals
1960-791960-791979-901979-901990-20041990-2004
Coefficients presented in Table 5Coefficients presented in Table 5After 1979, Fed fought inflationAfter 1979, Fed fought inflationAfter 1990, Fed fought both infl & YgapAfter 1990, Fed fought both infl & Ygap

Actual and Predicted ValuesActual and Predicted Valuesof Fed Funds Rateof Fed Funds Rate
0
2
4
6
8
10
12
14
16
18
20
1965:01 1970:01 1975:01 1980:01 1985:01 1990:01 1995:01 2000:01
Actual
Predicted

Interest Rate Error:Interest Rate Error:Sustained after 1994Sustained after 1994
-5
-4
-3
-2
-1
0
1
2
3
4
1965:01 1970:01 1975:01 1980:01 1985:01 1990:01 1995:01 2000:01
Estimated Error Term

The Output Gap EquationThe Output Gap Equation
First Difference of Output Gap First Difference of Output Gap regressed onregressed onFirst Difference of Inflation RateFirst Difference of Inflation RateFirst Difference of Lagged Nominal Fed First Difference of Lagged Nominal Fed
Funds Rate, quarters 2-10 (why?)Funds Rate, quarters 2-10 (why?)Real vs. Nominal Rates?Real vs. Nominal Rates?An Central Concept in the Paper:An Central Concept in the Paper:
““The Output Error”The Output Error”
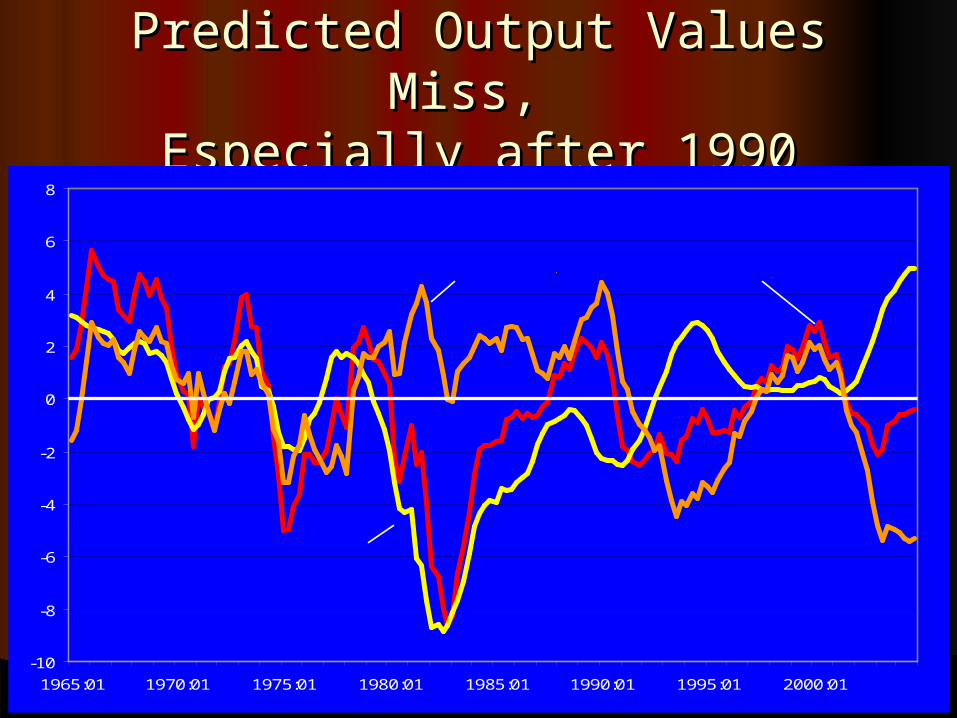
Predicted Output Values Miss, Predicted Output Values Miss, Especially after 1990Especially after 1990
-10
-8
-6
-4
-2
0
2
4
6
8
1965:01 1970:01 1975:01 1980:01 1985:01 1990:01 1995:01 2000:01
ActualEstimated Error
Predicted
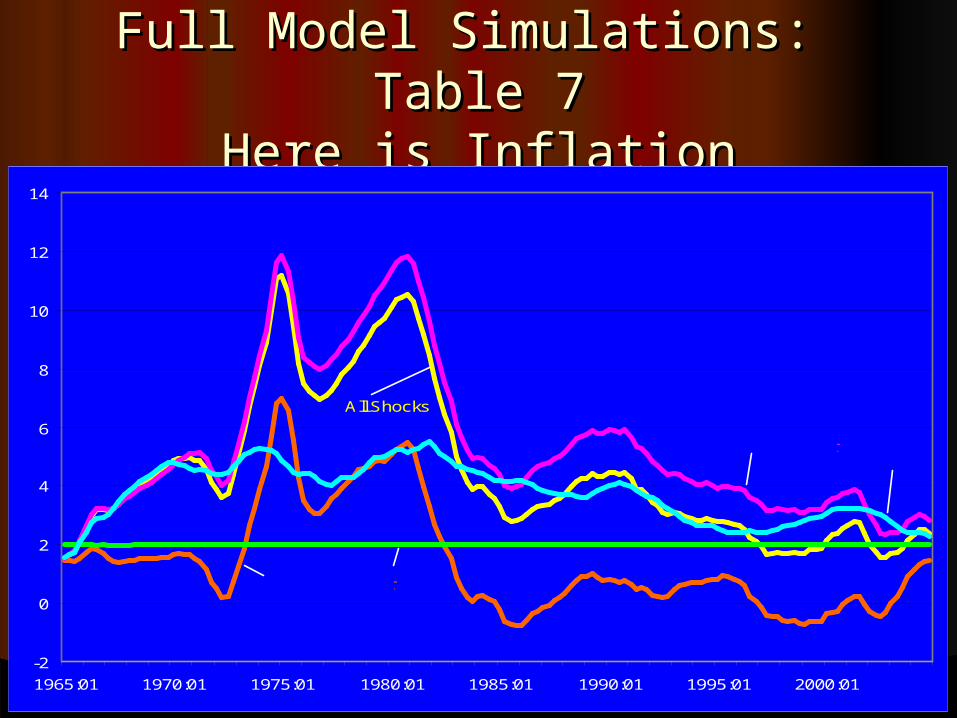
Full Model Simulations: Table 7Full Model Simulations: Table 7Here is InflationHere is Inflation
-2
0
2
4
6
8
10
12
14
1965:01 1970:01 1975:01 1980:01 1985:01 1990:01 1995:01 2000:01
All Shocks
No Interest Error
No Output ErrorNo Shocks
No Supply Shocks

Full-Model Simulation ofFull-Model Simulation ofthe Federal Funds Ratethe Federal Funds Rate
(Split Sample) (Split Sample)
0
5
10
15
20
25
1965:01 1970:01 1975:01 1980:01 1985:01 1990:01 1995:01 2000:01
All Shocks
No Output Error
No Interest Error
No Shocks
No Supply Shocks

The Basic Conclusion of the The Basic Conclusion of the Paper:Paper:
The Output Gap SimulationsThe Output Gap Simulations
-12
-10
-8
-6
-4
-2
0
2
4
6
8
1965:01 1970:01 1975:01 1980:01 1985:01 1990:01 1995:01 2000:01
All Shocks
No Output Error
No Interest Error
No Shocks
No Supply Shocks

Bottom of Table 7:Bottom of Table 7:Summary of Output Gap Summary of Output Gap
ConclusionsConclusionsStandard Deviation of Output GapStandard Deviation of Output GapAbsolute Value of Output GapAbsolute Value of Output GapSupply Shocks and the Output Error Supply Shocks and the Output Error
werewereRoughly equal culpritsRoughly equal culprits
No Role of Interest-rate Error No Role of Interest-rate Error
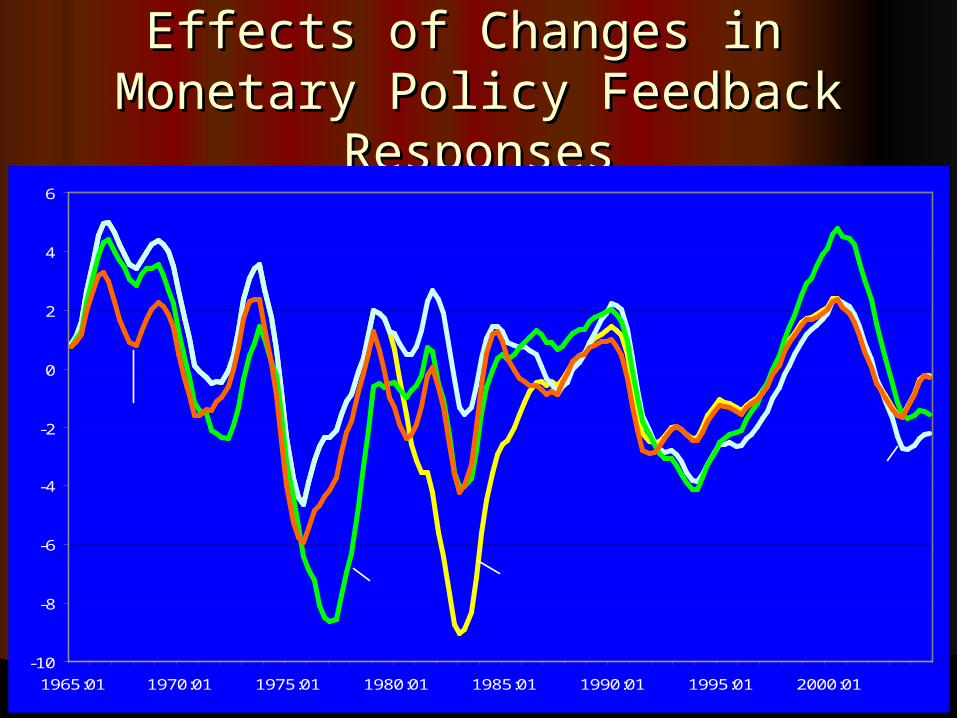
Effects of Changes in Effects of Changes in Monetary Policy Feedback Monetary Policy Feedback
ResponsesResponses
-10
-8
-6
-4
-2
0
2
4
6
1965:01 1970:01 1975:01 1980:01 1985:01 1990:01 1995:01 2000:01
60:1-79:2
79:3-90:2
90:3-04:4
Split Sample

ConclusionsConclusions
Demand and Supply Shocks both Demand and Supply Shocks both MatteredMatteredThe Major Demand Shocks were Military The Major Demand Shocks were Military
Spending, Financial Institutions that Spending, Financial Institutions that Destabilized Residential Investment, and Destabilized Residential Investment, and Primitive Inventory ManagementPrimitive Inventory Management
The Major Supply Shocks were Import The Major Supply Shocks were Import Prices (and Flexible Exchange Rates), Prices (and Flexible Exchange Rates), Food-Oil Prices, Medical Care Prices, Food-Oil Prices, Medical Care Prices, Productivity Trend, and Nixon ControlsProductivity Trend, and Nixon Controls
Role of Monetary PolicyRole of Monetary Policy
Accommodative Policy in the 1970s Accommodative Policy in the 1970s Allowed Inflation to Take offAllowed Inflation to Take off
Made 1981-82 Recession WorseMade 1981-82 Recession WorseVolcker Post-1979 Monetary Policy Volcker Post-1979 Monetary Policy
Created InstabilityCreated InstabilityBest Policy of All: Greenspan Policy Best Policy of All: Greenspan Policy
applied to entire postwar period!applied to entire postwar period!Combined inflation and output target Combined inflation and output target
beats a pure inflation target by every beats a pure inflation target by every criterioncriterion