what did the 1990s welfare reforms accomplish?
TRANSCRIPT
1
What Did the 1990s Welfare Reform Accomplish?
Rebecca M. Blank University of Michigan
December 2003
Revised: March 2004 Contact information: Gerald R. Ford School of Public Policy 611 Tappan Street, 440 Lorch Hall University of Michigan Ann Arbor, MI 48109-1220 734-763-2258 734-763-9181 FAX [email protected] This paper was written for the Berkeley Symposium on Poverty and Demographics, the Distribution of Income, and Public Policy, a conference honoring Gene Smolensky. Thanks are due to Heidi Shierholz and Cody Rockey for excellent research assistance.

2
Eugene Smolensky has spent his life thinking and writing about poverty and
income distribution (e.g., Danziger and Smolensky, 1983; Danziger, Gottschalk, and
Smolensky, 1985). In an earlier era, he was involved with evaluating and critiquing
President Carter’s welfare reform proposals (Danziger, Haveman and Smolensky, 1977).
It is only appropriate that a volume in his honor includes a paper discussing what we’ve
learned from the latest round of welfare reform.
In August 1996, the Congress passed and President Clinton signed the Personal
Responsibility and Work Opportunity Reconciliation Act (PRWORA). Many pieces of
legislation are heralded as “pathbreaking reform” when they are passed. PRWORA was
an exception in that such a claim has turned out to be correct. The changes that
PRWORA initiated, along with several related policy changes that occurred at the same
time, have fundamentally altered the ways in which we provide assistance to low-income
families in the United States. The implications of these changes are only beginning to be
understood. This paper reviews the provisions of PRWORA and its subsequent effects
on welfare programs, provides some simple empirical summaries of the changes in
behavior and well-being since the mid-1990s, summarizes the existing literature that
analyzes the effects of these reforms and discusses a set of key questions about the effects
of these reforms that are still unanswered.
I. What Did Welfare Reform Do?
Since the Reagan administration, there has been a growing interest in providing
welfare recipients with the assistance and the incentives to move rapidly off welfare into

3
employment. Experiments with welfare-to-work programs started in the 1980s. These
experiments became more dramatic in the early 1990s under the Clinton Administration.
States were encouraged to experiment with major changes to Aid to Families with
Dependent Children (AFDC), the cash welfare program that had been created as part of
the Social Security Act of 1936. The Department of Health and Human Services
received requests from states to run cash welfare programs that violated the federal
requirements for AFDC, but that tested alternative ways to increase work incentives for
women. By 1996, 27 states had major waivers in effect and a number of other states
were experimenting with smaller changes. These waivers allowed states to experiment
with time limits on cash assistance, with lower earnings disregards (allowing women who
went to work to keep benefits for a longer period of time, hence creating incentives for
women to take low-wage jobs), or with various other changes designed to encourage
work and discourage welfare use.
The 1996 passage of PRWORA enacted federal changes to cash assistance
programs.1 Most notably, it abolished AFDC and in its place Congress created the
Temporary Assistance to Needy Families (TANF) block grant. This had two major
effects.
First, it gave states much more discretion over program design. TANF is not a
federal welfare program, but a funding stream that the states can use (with restrictions).
AFDC was a cash assistance program with a variety of eligibility and payout rules
determined by the federal government, although program authority was shared and states
determined other parameters of the program. A key aspect of AFDC was that it was an
entitlement. Any individual who qualified for assistance under the combined 1 Weaver (2000) provides a detailed description of the history that led to the passage of PRWORA.

4
federal/state rules, had to be given cash assistance. Under TANF, states have a greater
ability to design their own cash support programs and to limit benefit availability. No
one has an entitlement to cash assistance; for instance, if states are under financial
pressure they can simply reduce or eliminate assistance to certain groups.
Second, TANF provides funds to state programs as a block grant, whereas AFDC
was funded through a matching grant. When states raised their AFDC spending, they
drew down more federal dollars, so state-initiated changes in benefits and eligibility were
partially funded by federal dollars. In contrast, the block grant is fixed and does not vary
as state spending levels change, meaning that the states bear the financial risk of cycles in
the need for assistance. In the years immediately following PRWORA, this worked to
the states’ benefit as caseloads fell but federal dollars remained unchanged. In times of
tight budgets, when demand for assistance rises, the states must finance this without
increases in federal dollars. Given the limits of state balanced budget requirements, most
states will not be able to expand their welfare spending in a recession, hence TANF-
funded programs are likely to provide less counter-cyclical support than did AFDC.2
In addition to the creation of the TANF block grant, the PRWORA legislation had
a number of other provisions that limited the availability of cash assistance and increased
the incentives for low-income families to move into work. PRWORA increased federal
work requirements, by mandating that states place an increasing share of their active
welfare recipients at work in order to receive their federal funds. By 2002, PRWORA
required states to have 50 percent of their caseload at work or in work programs.3 A
provision lowered these requirements on states with falling caseloads, however. Since all
2 For a more extended discussion of these issues, see Chernick (1998). 3 Work programs are typically designed to help welfare recipients prepare for or search for jobs.

5
states experienced rapid caseload declines after 1996, no state had to meet the original
requirement. In 2002, the average state had 38 percent of their caseload at work or in
work programs.4
PRWORA also enacted time limits, limiting an individual’s ability to receive
TANF-funded assistance to 60 months (cumulative over a lifetime.) States have the
ability to exempt a share of the caseload from these time limits and can always extend
assistance further using state dollars. The time limits were a particularly important
symbol of welfare reform, making a strong statement that cash assistance was no longer
an entitlement.
Finally, a variety of PRWORA provisions limited access to income assistance
programs among target groups. Immigrant access to TANF was restricted, as well as to
food stamps and Medicaid. (The big cost savings in PRWORA largely came from
limiting food stamps.) Certain types of disabilities were removed from eligibility for
Supplemental Security Income (SSI), the cash assistance program for the elderly and
disabled. Many of these provisions, especially those concerning immigrants, continued
to be debated and a variety of amendments to the 1996 law were enacted in the following
years to restore eligibility for certain groups. I will not focus on these issues further in
this paper except to note that they reinforced the sense that federal involvement in public
assistance programs would be more limited in the future.
II. How Did States Respond?
The devolution of program authority over cash assistance programs from the
federal to the state level provided states with both opportunities and challenges. Many 4 See www.acf.hhs.gov/programs/ofa/particip/2002/table01a.htm.

6
observers (myself included) expected that many states would largely continue “business
as usual”, renaming their old AFDC programs, making some changes to increase work
programs, but continuing to provide cash assistance in much the same way as before. As
it turned out, virtually all states made major changes in the structure of their cash
assistance programs, promoting work and limiting access. These changes are described
in more detail elsewhere5; I focus on a few key issues here.
As will be apparent, many states adopted a mix of new programs that reflected the
experimental changes that had been tested under waivers, although even those states with
waivers typically adopted additional program changes once they had full authority over
program design. Hence, for states with major waivers, TANF gave them more discretion
to push further in the direction they were already going. For states without major
waivers, it gave them authority to enact changes without the same degree of federal
oversight that waivers had required.
Welfare-to-work efforts. As expected, states greatly expanded their welfare-to-
work programs. In many cases, the administrative structure of (former) AFDC offices
was completely changed, so that women received encouragement to look for work from
the minute they stepped into the office. States talked about changing the “culture of
welfare”, and using TANF funds to create work-support programs rather than the AFDC
cash assistance programs.6
Earnings disregards. One way that states supported and encouraged work was to
lower the earnings disregards, that is, the rate at which cash benefits were reduced as
earnings increased. Under the old AFDC program, for many women earnings gains were
5 For instance, see Blank and Haskins (2001) for a description of state changes and their consequences, or (for more technical information) see U.S. House of Representatives (2000). 6 These administrative changes are discussed in more detail in Gais, et. al. (2001).

7
offset almost dollar-for-dollar by benefit declines once earnings rose above a (very low)
disregard level. Under TANF, the majority of states provided for slower declines in
benefits, allowing women to see greater income growth as their earnings grew. Blank
(2002, Table 2) shows the enormous variation in earnings disregards among the states by
the late 1990s.
Sanctions. Not only did states encourage women to work, they also enacted
sanctions, enforcing benefit losses on women who did not participate in state-required
programs. Sanctions were imposed most often for non-compliance with work programs,
but could be imposed on recipients for not following any of the state’s requirements.
States varied widely in the penalty imposed by such sanctions. In some states, repeated
infractions could result in permanent disqualification for any future benefits; in other
states, sanctions involved benefit reductions of increasing severity. Estimates of the
number of families affected by sanctions vary enormously across studies with somewhat
different methodologies. Around 20 percent of case closures seems to be due to
sanctions (Pavetti, Derr and Hesketh, 2003).
Time Limits. As noted above, the federal government imposed a 60-month time
limit on women’s eligibility for TANF-funded programs. A substantial minority of states
(17) set shorter time limits. States could choose to continue payments to any family
using state funds. Many states did not have administrative systems that easily tracked
months on welfare among women with multiple welfare spells. As a result, there appears
to be great diversity among states in how they are implementing time limits. As of early
2002, about 230,000 families had reached time limits, of which 40 percent had their case
closed and another 16 percent faced benefit reductions (Bloom, et. al., 2002).

8
Cash Benefits. The benefits available to women who qualified for cash welfare
support varied as widely across states in the TANF era as in the AFDC era. Under
AFDC, states set the benefit levels, resulting in wide variation in the cash payments a
woman on welfare could receive. These benefit variations were largely unchanged after
PRWORA was passed, with maximum monthly benefits in 2000 ranging from $164 in
Alabama to $923 in Alaska (family of three).
All of these changes have led to enormous divergence in the availability of cash
welfare across the states. Prior to 1996, state welfare generosity could typically be
measured by state benefit levels. After 1996, simple state rankings of more or less
generous states became much more difficult. States with high benefits might have low
earnings disregards. States with high disregards might have short time limits.
Comparative state rankings might be different among women in different life
circumstances.
A major effect of these changes has been a major shift in the uses of welfare
program dollars. The Department of Health and Human Services (DHHS) estimates that
state and federal welfare dollars spent on noncash assistance rose from 23 percent in 1997
to 56 percent in 2002, while the proportion of money spent on direct cash assistance
declined from 77 percent to 44 percent.7
7 These numbers are from a tabulation done by DHHS for the New York Times and reported in an article by Robert Pear on October 13, 2003 (pA1). They are consistent with estimates from the Urban Institute (2002) that indicate 76 percent of Federal and State welfare went to direct cash assistance in 1996; by 2000 this had fallen to 41 percent.

9
III. The Interaction with Other Programs
The transformation of state AFDC programs into TANF-funded programs was not
the only policy change occurring in the mid-1990s. A variety of other program changes
were implemented at about the same time, many of them closely related to the changes
induced by PRWORA. These other changes are important because in most cases they
supported and reinforced the effort states were making to move women off welfare and
into work.
Major expansions in child care subsidies were an important part of state changes.
As work increased, an increasing amount of TANF funds were directed to child care
subsidies among workers. But dollars from the Child Care and Development Fund
(created by PRWORA by merging several preexisting programs) also expanded over this
time, and in the late 1990s many states also increased their own dollars going to child
care assistance for low-income women. The Urban Institute (2002) estimates that
spending on child care increased from 4 percent to 19 percent of all Federal and state
welfare payments between 1996 and 2000.
AFDC receipt had long been closely tied to food stamp and Medicaid receipt. In
most cases, AFDC recipients were automatically eligible for these two other programs.
As states eliminated AFDC programs, women moved into work and welfare caseloads
fell. It is perhaps not surprising the food stamp receipt and Medicaid receipt fell as well.
For instance, between 1996 and 1998 food stamp caseloads fell as rapidly as TANF
caseloads, although many women leaving welfare for work still had incomes that should
have left them eligible for food stamps. By 1999, states were making major efforts to
inform and re-enroll eligible families in Medicaid and food stamps. This required them

10
to reach out to working poor families with these programs, a group that historically had
very low enrollment rates.
In the previous decade, Medicaid eligibility had become increasingly de-linked
from AFDC eligibility. Legislation enacted in the 1980s provided Medicaid coverage to
children in low-income families, sequentially covering older and older children in each
year. By 1999, all children in families with incomes below the poverty line were covered
by Medicaid.8 Unfortunately, relatively low usage of Medicaid services by these
families suggested that they had little awareness of these eligibility expansions. In 1997,
the Children’s Health Insurance Program (CHIP) was enacted to provide dollars to states
to expand the health care usage among low income children. Many states used CHIP
dollars to help increase the use of health care services for children whose mothers left
welfare for work.
Child care subsidies, food stamps, and health care all provide in-kind benefits to
working low-income families. Two other policy changes in the 1990s directly expanded
the cash income received by these families. In 1993, significant expansions in the Earned
Income Tax Credit (EITC) were enacted, as a result of the legislative proposals sent by
the Clinton administration to Congress to fulfill their campaign promise to “make work
pay.” The EITC is a refundable tax credit, which means that it can either reduce taxes
owed or (if no taxes are owed) pay subsidies to recipients.
The most important aspect of the EITC is that it is paid to low-wage workers in
low income families. By running the EITC through the tax system rather than as a
separate program, payment can be made conditional upon total family income. This
8 Children under 5 were covered if they lived in families with incomes below 133% of the poverty line. At their option, states could set higher eligibility lines and many states covered children in families with incomes up to 185% of poverty. For more information on Medicaid, see Gruber (2003).
11
means that the EITC is extremely well targeted to low income working poor families
(unlike the minimum wage which is received by all low-wage workers regardless of their
overall family income.) The EITC expansions of 1993 turned what had largely been a tax
reduction program into a program that provided substantial income subsidies to very low-
income working families. The maximum subsidy available rose from $1730 to $3888 (in
2000 dollars) for low-wage working families with two or more children between 1993
and 2000. These increased subsidy levels meant that the EITC had to be phased out over
a longer income range and affected families much higher in the income distribution. By
2000, families with two children with incomes as high as $31,152 could be eligible for
some tax reduction through the EITC.
Furthermore, for single-mother families on welfare, EITC dollars do not count as
income when states calculate TANF benefits. Welfare-to-work programs resulted in a
growing number of women who combined welfare and work, especially in those states
with higher benefit levels (where women could work part-time before losing all benefits)
or those states that enacted lower benefit disregards (allowing women to retain some
benefits as their earnings increased). In these states, the EITC functions like an
additional earnings disregard and increases the incentive to work.
Along with the EITC expansions, there were also minimum wage increases
enacted in the mid-1990s as well. Between 1993 and 1998, the minimum wage rose
from $4.25 to $5.15. Despite concern that this would reduce employer demand, several

12
studies in the mid-1990s concluded that these increases had small or zero effects on
employment of less skilled adults.9
The combined effect of increases in the minimum wage plus increases in the
EITC was to substantially increase the returns to work among low-wage workers. A
mother with two or more children who worked full time at the minimum wage would
have seen her real income increase from $10,568 in 1989 to $14,188 in 2000 (both
numbers in 2000 dollars), a 34.3 percent increase. (The equivalent increase for mothers
of one child was 19.7 percent, from $10,568 to $12, 653.) In 1990 these mothers
(whether with one or two children) would have had cash income below the poverty line,
while by 2000 they would have been above the poverty line.
The bottom line of all these other program changes is that they largely supported
and reinforced the welfare program changes being enacted by states. The minimum wage
and EITC changes increased the returns to work, particularly among low wage workers.
The growth in child care subsidies provided better in-kind support for single mothers who
left welfare for work, as did the expanded Medicaid and health insurance coverage for
children in low-income families. The only exception was signaled by the decline in food
stamps; if this reflected the (incorrect) belief by single mothers that food stamps were no
longer available to them after leaving welfare, this would have made the benefit loss of
welfare appear greater and the “cliff” that earnings needed to fill seem even larger,
providing less incentive to move rapidly into employment.
9 Bernstein and Schmitt (1998) find no evidence of employment-related effects following the minimum wage increases of the mid-1990s. Neumark (2001) finds effects only among young workers, and not among adult men or women.

13
IV. The Economy’s Role
Policy changes weren’t the only news in the last half of the 1990s. While the
economy grew slowly coming out of the recession of 1990-91, starting in 1995 the U.S.
entered a period of sustained high growth, rising productivity, and low unemployment.
By the time the expansion ended in 2001, it had become the longest period of continuous
economic growth in U.S. history.
The effect of this expansion was particularly noticeable for less-skilled workers.
Despite a consensus view in the early 1990s that the expected long-term unemployment
rate in the United States was between 5.5 or 6 percent, unemployment remained at or
below 5 percent from April 1997 through October 2001. Even among adult high school
dropouts – whose unemployment rates were in the double digits in the early 1990s –
unemployment fell to less than 7 percent.
Wages also rose throughout the wage distribution. This was particularly good
news for less-skilled (and especially male) workers, who had experienced substantial
wage declines for 15 years starting around 1979. Although the wage increases after 1995
did not make up all of the ground lost in the previous two decades, they clearly increased
the economic returns to work.
The result of this economic boom was a job-rich economy that offered more job
availability and better wages to low-skilled workers than at any time in the previous two
or three decades. This allowed states to largely ignore job availability concerns as they
redesigned their welfare-to-work programs and encouraged a growing number of welfare
recipients to seek work. States could focus on program design and implementation for
their new TANF-funded programs.

14
V. The Results
A substantial literature documents the dramatic changes in welfare and work
behavior over the 1990s. In this section I briefly highlight some of those changes and
discuss the research literature that attempts to measure how much of these changes were
due to policy efforts or to economic expansion.
Caseloads. Most discussed has been the dramatic decline in caseloads in the late
1990s. A sharp increase in caseloads in the early 1990s was a major impetus for states to
support welfare reform, but even the strongest supporters of welfare reform did not
forecast what actually happened. Figure 1 shows caseload changes between 1970 and
2003. After a long period of largely constant levels, AFDC caseloads rose steeply in the
early 1990s (one reason behind state support for welfare reform.) Caseloads began to fall
prior to the 1996 passage of PRWORA, but the decline accelerated in the late 1990s. By
the end of 2001, caseloads were at 42 percent of their level in 1994. Every state
experienced these dramatic declines.
The economy slowed in 2000 and was officially in a recession through much of
2001; since then, there has been slow growth and continuing higher unemployment rates.
Yet, while caseload declines appear to have stopped, caseloads have not risen,
particularly in comparison to the early 1990s when a mild recession was associated with a
large caseload increase. In part, the rise in caseloads in the early 1990s was explained by
other factors than the economy, particularly the increase in the availability of AFDC for
so-called “child only” cases, where AFDC dollars supported only the child, not the adult,
in the family (Blank, 2001). Yet, as I shall discuss later, the lack of increase in caseloads

15
in this period of slower economic growth is something of a mystery. In particular, it is
unclear if women want cash assistance but are not seeking it because they believe
themselves to be ineligible, or if women are remaining employed and able to avoid
returning to the welfare rolls.
One test of whether these caseload changes were significantly correlated with
policy changes is shown in Figure 2. Here I label as the “zero point” on the X-axis the
time when either a major waiver was adopted (caseloads among states with major
waivers are shown with a solid line) or when a TANF plan was adopted (caseloads
among states without a major waiver prior to TANF are shown with a dotted line.)
Essentially, I align caseload data for each state around the point where major policy
change was enacted, allowing me to show how caseloads changed in waiver and non-
waiver states immediately before and after new policies were adopted.
It is clear in Figure 2 that the enactment of waivers or of TANF are not a
sufficient explanation for caseload declines. For both groups of states, there were
significant caseload declines prior to the change in policy. In both cases, however,
caseload decline accelerated after the policy change.
Employment. The goal of welfare-to-work programs was not just to reduce
caseloads, but also to increase work. Employment rose sharply in the late 1990s,
especially among less-skilled single mothers, the group likely to have been most affected
by these policies. Figure 3 shows the share of single mothers who report any work over
the year from 1990 to 2002; the solid line is mothers with less than a high school degree,
the dashed line is mothers with a high school degree only and the dotted line is for those
with more than a high school degree. While employment among all groups of single

16
mothers rises over the late 1990s (as expected, given the very strong economy), it clearly
rose fastest among the less skilled. (These data also show faster increases among single
mothers than among married mothers.) Employment among single mothers without a
high school degree rose from 42 percent in 1993 to 65 percent in 2000, an enormous
increase over a very short period of time. With higher unemployment throughout the
economy, employment among less-skilled single mothers falls by four percentage points
by 2002, but remains far above its level of a decade earlier.
Figure 4 shows this trend in another way, graphing the share of women who
report employment in March of each year, among the sample of women who report
receiving some form of cash welfare assistance in the previous year. Figure 4 shows a
dramatic increase in the flow of welfare recipients into employment. (These women may
be on or off welfare in March when they make this report; the primary point is that an
increasing share of women with recent welfare income were entering work over time.)10
The economic slowdown of the early 2000s is clearly visible in these data,
combined with the effects of a steady caseload decline. The likelihood of moving into
work, conditional on receiving welfare in the previous year, declines in 2001 and 2002
(although it rises again in 2003). In part this reflects higher unemployment rates and a
more sluggish economy. In part it reflects the fact that the group of women who report
public assistance income in each year is shrinking over time, creating a progressively
smaller and more selected base sample.
Studies of women leaving welfare in the 1990s indicate that close to two-thirds of
welfare leavers were working at some future point (Cancian, et. al. 1999; Loprest, 2001).
10 If you break the data for Figure 4 into those who received welfare in almost every month of the past year and those who received it only a few months, both groups show large increases in work over time.

17
Martinson (2000) indicates that only 20 percent of leavers appear to never work in a four-
year follow-up of work programs in six sites. Data from 2002 indicate that a substantial
number of recent welfare leavers are working, but employment is lower and recidivism is
higher than among those who left welfare before 1999 (Loprest, 2003).
In all of these studies, however, it is clear that a significant minority of those who
leave welfare appear to be jobless. Between 1995 and 2001, welfare caseloads fell by
approximately 1.64 million. Employment among single mothers rose by approximately
820,000.11 This rough calculation suggests that for every 100 families leaving welfare,
50 women entered the labor force.
This calculation almost surely underestimates the overall employment gain for
two reasons: First, in 1995 some share of women on welfare were already working and
any increase in hours that they experienced would not be captured in this calculation.
Second, we know that job turnover is higher among less skilled workers, implying that
some share of this population might be employed over the year but not at work at the
time of any specific survey. Even with these caveats, however, these data together with
the results from surveys of welfare leavers suggest substantial non-employment among
those leaving welfare. We return to this issue below, because it to creates a puzzle about
how these women and their children are faring economically.
Income. Increases in employment may not leave women better off economically
if their loss of benefits is as great or greater than their increase in earnings and work
expenses. Most evidence suggests that single mothers’ income rose over the late 1990s,
although overall income rose less than earnings because of the loss of cash benefits.
11 These calculations are based on the Current Population Survey, March 1996 and 2002, respectively.

18
Table 1 provides a snapshot of income and its components among single mothers from
1985 through 2002.12
As the first column of Table 1 indicates, inflation-adjusted income rises very little
among this group during the economic expansion of the late 1980s. During the
expansion of the 1990s, however, income increases almost one-third between 1992 and
2000. These higher income levels are maintained in the economic slowdown, with
average income of $23,805 in 2002 among single mothers. There is an amazingly large
change in the components of total income over the 1990s as well. Public assistance falls
from almost one-quarter of total income to less than 5 percent. Own earnings by the
mother increases from just over half to two-thirds of income. There is a slight rise in
earnings by other members of the household as well. “Other income”, which includes
other transfer dollars (such as SSI or unemployment insurance), child support, as well as
any reported gifts or transfers from other households, also increases.
Between 1990 and 2002, mothers’ earnings in single mother households rise by
63 percent, driving the increase in overall income levels. But declines in public
assistance offset these earnings gains so that total income rises by only 29 percent. From
Table 1 one can calculate the average changes in welfare benefits, earnings, and overall
income among single mothers. Between 1995 and 2002, single mothers on average lost
$100 in welfare benefits, but experienced a $209 rise in average earnings and a $59
increase in other sources of income. The net result was a significant increase in income,
12 Top-coding of earnings changes over this period. For consistency, I top-code earnings for every year at its lowest level (in real dollars). This never effects more than 40 observations in any year, but does reduce the impact of a few high earners on these overall averages. Since my focus is on lower-income women, I view this as a plus rather than a minus. (I use averages rather than medians since I want to show how income component shares are changing within total income.)

19
with a $168 increase in average income despite the $100 decline in welfare benefits over
these years.13
Of course, averages can obscure distributional changes. Since only a share of
single mothers received welfare income, the benefit losses were concentrated among
welfare leavers, while women with more skills or better labor market connections were
probably able to make greater earnings gains. Yet, the evidence suggests that most single
mothers experienced some income increases, even among the least-skilled groups of
single mothers in the years after welfare reform was enacted.14 Poverty rates among
single mother households declined to 28.5 percent by 2000 and remained there through
2002. This is the lowest rate ever recorded and well below the 38 percent average
poverty rate among single mothers over the 1980s and early 1990s. At worst, it appears
that a small share of less-skilled women might have experienced income losses. For
instance, the limited evidence available on women who left welfare due to sanctions or
time limits seems to indicate that they experienced income losses (Kalil, et. al, 2002) .
One of the difficulties in interpreting these income changes, however, is that our
data are incomplete. First, particularly for working single mothers, work expenses might
be quite significant, primarily because of child care costs. Increases in earnings among
these families might be entirely used up by increased child care payments, leaving them
no better off. We have no fully adequate data set that allows us to calculate income
13 As discussed below, calculations that focus only on gross income may obscure important changes in disposable income. I could impute estimated EITC income, but to be accurate in estimating after-tax income, I would need to impute other state and federal taxes as well (in some states, state taxes on low income families are significant.) Similarly, I could impute Food Stamps, although there is substantial non-take-up of this program. To be accurate about in-kind income, I would also need to take account of child care subsidies, health insurance and housing subsidies as well. In short, coming up with an accurate disposable income calculation is quite difficult, which is the point made in the next few pages. 14 See Haskins (2001) for tabulations of cash income; Meyer and Sullivan (2001) for tabulations of consumption.

20
changes net of work expenses. The substantial expansion in child care subsidies,
described above, suggests that some of these work expenses are being offset. Giannarelli,
et. al. (2003) indicate that 34 percent of low income employed families with recent
welfare histories received some government assistance for child care in 1999, but more
than half of these also incurred out-of-pocket child care expenses. Fully 18 percent of
income went to child care expenses in 1999 among all employed families with children
whose incomes were below the poverty line.
Second, tax and transfer benefits might also be very important to this population.
The expansion of the EITC benefits might add as much as $3000 to the income of some
of these families, which the income data in most surveys does not account for. Offsetting
this, the decline in food stamp participation would take more resources away from these
households over the late 1990s than cash income suggests.
Third, cross-household transfers might be significant for this population. This
includes child support payments received by these mothers, particularly as many states
continue to try and increase child support collection. But it also includes support from
relatives and boyfriends. The strong economy of the 1990s would have provided more
income to all low wage workers and might have increased the inclination and ability of
others to share income with single mother families to which they felt an attachment. This
may be how welfare leavers who were not employed were surviving economically.
In order to assess the overall well-being effects of the changes of the 1990s, better
data for all of these issues are necessary. One alternative is to look at consumption rather
than income data, since consumption should reflect all of the concerns mentioned above.
Meyer and Sullivan (2001) find that total consumption of single mothers increased in the

21
mid-1990s, both in absolute terms and relative to women without children or to married
mothers.
Overall, the changes of the late 1990s were very dramatic for single mother
families. There were dramatic declines in caseloads, dramatic increases in work, and
(measured with less certainty) moderate increases in overall economic well-being. It is
striking that these gains do not appear to have been entirely eroded (based on data
available in early 2004) despite a mild recession and an extended period of low growth
and higher unemployment. Indeed, unemployment rates among less-skilled women have
remained low, relative to their past historical levels. In 1994, at the end of the 1990s
recession, unemployment among women without a high school degree was 16 percent.
This fell to 11 percent by 2000 and was at 12.5 percent in 2002.15
Did Some Groups Gain More than Others? An important question is whether the
average numbers for single mothers hide a great deal of variation in the experiences of
specific groups. In this section, I disaggregate some of these results by race and ethnicity
and by education level of the mother, and by children’s ages in the household. Table 2
provides comparisons among different groups of single mothers between 1995 and 2002.
The first part of Table 2 compares changes in earnings as a share of family
income with changes in public assistance as a share of family income, asking whether
some groups are better able to offset changes in public assistance with increases in work.
As indicated in column 1 of Table 2, different groups were substantially more reliant on
earnings in 1995. Single mothers with infants received only 45 percent of their income
from earnings, while single mothers with no preschoolers received over 60 percent of
15 Author’s tabulations of the Current Population Survey; this includes all less skilled women ages 16 to 64. The equivalent unemployment rates for single mothers with less than a high school degree are 29 percent in 1994, 16 percent in 2000, and 18 percent in 2002.

22
their income from earnings. Reliance on public assistance as a share of family income in
1995 (column 3) is the reverse of earnings reliance; groups with high earnings shares
have low public assistance shares and vice versa. Not surprisingly, it is those with high
public assistance shares who experience the greatest declines in public assistance
between 1995 and 2002 (column 4), and these are also the groups who gain the most in
terms of earnings shares (column 2).
The final column (column 5) shows the ratio of changes in earnings shares to
changes in public assistance shares. Because earnings increase while public assistance
declines, all of these ratios are negative. These ratios range between -0.71 and
-1.01. Women with younger children and less education have slightly lower earnings
gains relative to their loss of public assistance. It is surprising, however, how similar the
ratios in column 5 appear. Despite very different starting levels of earnings reliance and
public assistance usage, the ratio of welfare declines to work increases among groups is
quite similar. (Realize that the fact that these ratios are largely just below one does NOT
imply that public assistance losses were greater than earnings gains. This is because
income levels were rising at the same time. If you look at Table 1, you can see how
rising incomes mean that greater share declines in public assistance are more than offset
by smaller share increases in earnings.)
A striking result in Part 1 of Table 2 is the large gains in earnings shares among
women who have relatively low earnings shares in 1995. Single mothers without high
school degrees increase their earning share by 17 percentage points, those with infants by
16 percentage points, and black and Hispanic single mothers increase their earnings
shares by 15 to 18 percentage points. The result is a convergence over the late 1990s in

23
income sources (as well as in work and welfare behavior, seen in Part 2) among all these
groups of single mothers.
The second part of Table 2 compares changes in the percent working to changes
in the percent on welfare, essentially looking at participation effects rather than income
share effects. Again, there are substantial differences in the percent working, raging from
49 percent of those without a high school diploma to 85 percent of those with more than a
high school diploma. Those groups with a high percent working have a low percent on
welfare. As before, the groups that are more welfare-using in 1995 are likely to
experience greater welfare declines and bigger employment increases. Again, column 5
shows the ratio of changes in the percent working to changes in the percent on welfare.
This column indicates whether some groups were less able to find jobs relative to their
rate of welfare leaving. More disadvantaged women -- the less-skilled (no high school
diploma), black and Hispanic mothers, and mothers with small children, clearly make
greater employment gains (relative to their movement out of welfare) than do other
groups. Some of this is because more advantaged groups of single mothers are already
working at high levels (above 80 percent) in 1995. Even though these more advantaged
women significantly decrease their welfare usage (almost all of those on welfare go off,
according to these data), they may simply be constrained by how much more they can
move into work. Many of these more advantaged women who were on welfare may have
already been working in 1995.
Finally, the third part of Table 2 compares changes in poverty rates to changes in
work. Here the question is whether increases in work are mirrored by comparable
declines in the poverty rate for all of these groups. Among all single mothers there is

24
almost a one-for-one relationship between increases in work and declines in the poverty
rate. This varies significantly across groups, however, with more disadvantaged groups
being less able to translate work increases into poverty declines. For instance, among
those with no high school diploma, the percent working rises by 16 percentages points,
but their poverty rate declines by only 10 percentage points. In contrast, among those
with exactly a high school degree, the increase in work is almost exactly matched by the
decline in poverty. Similar patterns exist by age of the youngest child, with single
mothers with preschoolers less able to escape poverty as their work increases, relative to
single mothers with older children. Among different ethnic groups, there are fewer
differences in the changes in work versus changes in poverty.
The results in Table 2 suggest that there is little evidence that single mothers who
were more disadvantaged in the labor market (i.e., lower skill, ethnic or racial minority,
or with smaller children) had greater difficulty finding work. It is striking how much
public assistance usage and income shares converged across these different groups, In
fact, these more disadvantaged groups seemed better able to increase their work share
relative to their declines in welfare participation than other groups. These women did,
however, have greater difficulty translating their employment increases into poverty
declines, perhaps because they were further below the poverty line to start with and hence
needed greater gains before they could escape poverty.

25
VI. Interpreting These Results
A small industry has sprung up around estimating the impact of welfare reform in
the late 1990s. This work is well-summarized in several other places.16 Here I simply
highlight some of the main points of this literature.
Welfare Leavers Studies. One body of research has concentrated on following
individuals over time after they leave welfare to see how they are faring. This research is
interesting, because it often involved collecting new data, by locating women who were
identified as being on welfare at some point in the past. Many studies like this were done
within the states in the late 1990s, often with quite small samples and limited follow-up.
Several of these surveys have been much more extensive and useful, however.
Because these researchers actually fielded a new survey, it allowed these studies to
collect some information not typically available in our larger national datasets. For
instance, the National Survey of America’s Families (NSAF), has collected three waves
(1997, 1999, and 2002) of national survey data on about 40,000 households, with a focus
on changes affecting the low-income population. These data have provided us with
detailed information on the experience and well-being of low-income and welfare-leaver
families.17 In comparison, a very different snapshot is provided by the Women’s
Employment Survey (WES), which has followed about 700 single mothers in an urban
Michigan county who were all on welfare in February 1997. The survey is just now in its
fifth wave, and has very detailed information on these women’s lives, with particularly
good information on mental health issues.18
16 See Blank (2002), Grogger, Karoly, and Klerman (2002). 17 For more information about the NSAF, see www.urban.org/Content/Research/NewFederalism/NSAF/Overview/NSAFOverview.htm. 18 For more information about the WES, see www.fordschool.umich.edu/poverty/wes/index.htm.

26
These leavers studies are quite useful in providing information about the women
most directly affected by welfare reform, namely, those on welfare in the mid-1990s.
They provide clear evidence about work behavior, welfare recidivism, and income
changes within this population. For instance, the WES data suggest that close to 80
percent of their sample are working in August 2001 (the last available survey point),
although slightly less than 50 percent continue to receive some welfare-related assistance.
The NSAF indicates that point-in-time employment among welfare leavers in the late
1990s was around 50 percent, while welfare leavers in the early 2000s only had a 42
percent employment rate in 2002.
These leaver studies are less useful in providing any sort of overall evaluation of
welfare reform, since they provide no information on other populations that welfare
reform should have effected. If more limited availability of cash assistance and stronger
enforcement of work rules discouraged welfare entrants, or changed the behavior of non-
welfare recipients, then leavers studies provide only a very partial answer to the question
“what were the overall effects of welfare reform?”
Furthermore, the leavers’ studies do not make any effort to separate the effect of
policy changes from other changes occurring at about the same time. Some welfare
leavers would have left even in the absence of reform, particularly with the strong
economy of the late 1990s. These papers provide no good way to separately estimate the
behavioral changes due to policy versus those due to economic or other factors. In the
end, the information they provide is largely descriptive (which does not mean it is not
useful or interesting!)

27
Regression Estimates on Existing National Data Samples. An alternative
approach has been to use large national databases (such as the Current Population
Survey) to try and analyze the effects of welfare reform. The primary question in this
research has been to identify the role that policy played in reducing caseloads and raising
employment. Most papers explore this by looking at caseload and employment levels
using state panel data over the 1980s and 1990s, and controlling for both state and year
affects, as well as state unemployment rates and various demographic measures.19
“Policy” is specified by a series of dummy variables, indicating when states enacted
waivers or when TANF plans were implemented. Identification of the policy effect
depends upon variation in the timing of state enactment of reforms. (Blank (2002) and
Grogger, Karoly and Klerman (2002) provide a much more detailed discussion of these
studies and their contribution.) Essentially, these studies use regression techniques to do
(in a more sophisticated way) exactly what Figure 2 does, that is, to measure caseload
change following a major policy change.
This estimation strategy creates some problems. The impact of waivers on
caseloads is relatively well-determined since different states implemented waivers
between 1992 and 1996, providing quite a bit of variation in timing. But TANF plans are
all implemented between September 1996 and the end 1997. Hence, the identification of
TANF policy effects depends upon small variations in the timing of enactment. Not
surprisingly, TANF effects have been harder to identify.
The studies that rely upon these sort of estimations have somewhat varying
results. Most of them tend to indicate a significant role for both the policy changes as
19 For example, see Council of Economic Advisers (1999), Wallace and Blank (1999), Figlio and Ziliak (1999), Moffitt (1999), or Schoeni and Blank (2000).

28
well as economic trends over the 1990s. But several papers show little effect on policy
(Figlio and Ziliak, 1999; Ziliak, et. al., 2000). These papers tend to use somewhat shorter
data periods for estimation, and more complex specifications with multiple lagged
variables.
Two alternative approaches are perhaps slightly more persuasive. Schoeni and
Blank (2000) look not just at the variation over time, but also compare the differential
effects among more and less educated women.20 There results show larger caseload and
employment effects among the least-skilled, consistent with the expected effect of
welfare reform. Like other results, however, these studies have more difficulty
identifying the effects of TANF than of waivers.
An even better approach is to move from estimating levels to estimating changes
in the flows into and off welfare. Klerman and Haider (2001) indicate that the papers
with data on caseload levels are incorrectly specified, if one believes that the flows in and
out of welfare are the appropriate thing to model. Unfortunately, good data on entries
and exits from welfare are hard to come by. While states were required to report the
number of persons entering and leaving welfare in each month for AFDC, it is clear that
states defined these flows in different ways and the data across states is noncomparable.
Klerman and Haider have data for the state of California and estimate their model for that
state. Grogger (2003b) uses multiple waves of the Survey of Income and Program
Participation to look at entry and exit data. Both of these papers find that both policy and
economy matter in explaining caseload changes.
20 Kaushel and Kaestner (2001) use a similar method, but focus on the effects of individual policy changes rather than overall TANF implementation.

29
While it is very difficult to evaluate the effects of TANF policy implementation
because TANF was implemented in most states at about the same time, one might note
that “TANF” means something very different in different states. Hence there should be
ways to evaluate the effects of welfare reform components, based on the variation across
states in the types of reforms that different states enacted. While this is a theoretically
promising approach, it has proven hard to implement in a regression framework.
Several papers have included a series of variables that describe the type of policy
components enacted as part of welfare reform (earnings disregards, time limit
information, types of sanctions, etc) in lieu of a dummy variable indicating the overall
implementation of welfare reform. 21 For such a strategy to be convincing, the researcher
needs to be able to fully parameterize the set of welfare reform components, and this has
proven difficult. For instance, while we have relatively good information on the earnings
disregard rules across states, we have very limited information on the ways in which
states are running their mandatory welfare-to-work programs and how many people are
being assigned into such programs. Because there appear to be correlations in the types
of welfare reforms that states are enacting, if we only include information on the earnings
disregards without including information on the stringency of welfare-to-work mandates,
the earnings disregard coefficient may be biased if states with high earnings disregards
also happen to be states with more stringent work enforcement.22 In short, it’s hard to
draw policy conclusions about the included policy components in the absence of a full set
of components. In addition, the number of states that have implemented specific policies
21 For example, see Council of Economic Advisers (1999), Moffitt (1999), or Ziliak, et. al, (2000). 22 For example, Kaushal and Kaester (2001) control only for the implementation of time limits and family caps (a policy that limits cash payments to mothers who have additional non-marital births). Since other changes were implemented at the same time, this almost surely attributes some of the effects of these other changes to the two included policies.

30
are limited, and many policies have been implemented simultaneously, so that there are
serious problems identifying the effects of different policy components. Perhaps for this
reason, many of the papers that try to estimate the effects of policy components often find
perverse results on at least some of the coefficients.
One way around this problem is to search for some sort of natural experiment that
allows one to investigate the effect of a single policy component. Grogger (2003a) has
been successful in doing this to analyze the effects of time limits. Grogger notes that
families with younger children are more likely to hit future time limits than are families
with older children (whose welfare eligibility is likely to end even without an impending
time limit as the children age out of the household.) He compares the effects of time
limits in families with younger and older children and finds much stronger effects on the
behavior of families with younger children, as expected.
Despite their limitations, these regression results may be as close as we can come
to estimating the overall impact of the 1996 legislation. In general, they suggest that both
the economy and policy have played an important role in the caseload reductions and the
employment increases of recent years. Even with relatively complete specifications,
however, controlling for a large number of economic, demographic and policy-related
changes, as well as a host of fixed effects, these models still do not explain the full
magnitude of the behavioral changes among single mothers in the 1990s. For example,
the Council of Economic Advisers (1999) estimates a range of models and computes the
share of caseload change explained by these models. The models with the greatest
explanatory power indicate that 36 percent of the caseload changes between 1993 and
1996 appear to be explained by economic factors, and 15 percent by policy changes;

31
between 1996 and 1998, 10 percent is explained by economic factors and 36 percent by
the implementation of TANF. This is roughly similar to other estimates. A recent
contribution to this field (Grogger, 2003b) finds that changes in TANF, the Earned
Income Tax Credit, and a host of other economic variables explain only 31 percent of
caseload changes between 1993 and 1999.
In the next section, I discuss possible hypotheses about why we have been so
unsuccessful in fully explaining the caseload changes of the late 1990s in these
econometric efforts. At a minimum, it is hard to evaluate the effects of policy and
economic changes when they all occur essentially simultaneously. Between 1995 and
2000, we implemented TANF, raised the minimum wage, implemented major EITC
expansions, and at the same time the economy went into one of its strongest periods of
growth. We lack the tools to fully untangle these very closely-timed events that occurred
everywhere almost simultaneously.
Experimental data. No discussion of welfare reform evaluations is complete
without a discussion of the experimental evaluations. These evaluations grew out of the
federal requirement that states seeking to experiment with revised welfare plans in the
early 1990s had to provide a serious evaluation of the impact of their program changes.
The staff within DHHS, which oversaw these waivers, enforced this requirement in a
rigorous way. Rather than allowing states to simply tabulate administrative data, in most
cases they required randomized experiments. Their goal was to truly learn from these
waivers, providing highly credible evidence of which state experiments were working
more effectively than others. The result was a host of experiments across the states
between 1992 and 1996, in which some group of AFDC recipients were allowed to

32
continue as before while another group was placed into a revised program with various
provisions such as stronger work efforts, greater earnings disregards, strict enforcement
of sanctions, etc.
All of these experiments were conducted on policy changes implemented through
state waivers. Upon the passage of the 1996 legislation, states were mandated to
implement a new TANF-funded plan. State had no requirements to evaluate the
implementation of their TANF plans (nor much interest in doing so in most cases).
Hence, our experimental evidence is from the waiver period, although states with waivers
in place when PRWORA was passed were allowed to choose to continue the waiver for
some time before they had to implement an explicit TANF plan. States with more
extensive waivers typically chose this route, although many of them made other changes
to their welfare programs as well.
The results of these experiments have been summarized elsewhere.23 The waiver
experiments (and a host of predecessor experimental evaluations of welfare-to-work
programs in the 1980s) were quite important to the passage of PRWORA itself, since
they showed that welfare-to-work efforts could increase employment, decrease AFDC
participation, and could also save states money.
Because a wide variety of states ran experimental evaluations, we have evidence
on quite different programs. MDRC, a research evaluation firm that implemented many
of these evaluations, has worked to provide comparative information from across
multiple evaluations. Some of the key findings from this comparative work are
interesting.
23 See Blank (2002) and Grogger, Karoly, and Klerman (2002). See also Bloom and Michalopoulos (2001), Hamilton (2002), and Hamilton, et. al. (2001).

33
The research suggests that “work first programs” – that is, programs that place
women directly into employment without regard to its wage or skill level – can be more
effective than programs that provide job training. In part, of course, this is because
women placed immediately into jobs increase their employment faster and use less public
resources than women who spend a period of time in a training program before entering
employment. Even 3 to 5 year follow-ups, however, suggest that the women in job
training programs do not do better than the women in work-first programs (and the job
training programs were much more expensive to operate).24 Most interesting, these
results suggest that “combined” programs – those that provide job training to a selected
group of welfare recipients and place the others in work-first – are more effective than
only work-first or only job training efforts. This result indicates the importance of labor
market experience in helping less skilled women build employment and wage records.
The human capital acquired through experience seems to be worth at least as much as the
human capital acquired through more formal training.
Experimental evaluations focused on quite radically different programs than
AFDC in a few cases. For instance, Minnesota’s Family Investment Program (MFIP)
combined a strong work mandates program (enforced with sanctions) with a significantly
lower earnings disregard. The results from MFIP suggested that this combination was
particularly effective in both increasing employment and reducing poverty.25 The
employment increase was primarily due to the work mandates (which had little effect on
income since public assistance declined as earnings increased), while the lower earnings
24 Hotz, Imbens, and Klerman (2000) indicate that the two groups tend to converge in a nine-year follow-up. But for much of this period the controlled experiment was no longer operating and the previous control group was encouraged to enter the new program; this may bias the results. 25 For a full report on MFIP see Miller, et. al. (2000).

34
disregard helped reduce poverty (by providing an ongoing subsidy to very low-wage
work.) A variety of researchers have written about the MFIP program and other so-called
“financial incentive” programs that provide positive incentives to work as well as
negative incentives through sanctions and time limits (Blank, Card, and Robins, 2000;
Michalopolous and Berlin, 2001).
One of the most important results from these financial incentive programs is the
fact that there are policies which can BOTH increase work and increase income. This is
in stark contrast to the evaluations of the older Negative Income Tax programs, where
there was a trade-off assumed between labor force involvement and income
subsidization. With a combination of earnings subsidies and work mandates, these
programs raise employment and reduce poverty at the same time (albeit often with
somewhat higher costs.) 26
Another contribution from the experiments has been the data that they provided
on the link between work programs and child well-being. A variety of the experimental
studies included special surveys designed to capture any changes in children’s school
performance or behavioral outcomes as their mothers increased their work effort due to
welfare reform programs.27 Since we had virtually no prior information on the effects of
work programs on the children in single-mother families, this research received a great
deal of attention. The general results suggest relatively few effects on smaller children.
Some positive effects on behavior and achievement are visible for those children who are
placed in higher-quality child care settings. Among adolescents, the picture is more
mixed, with some negative behavioral and achievement effects visible. This attention to
26 Blank (2002) discusses the evidence behind this conclusion in much greater detail. 27 This literature is described and summarized in more detail in Morris, et.al. (2001) and Hamilton, et. al. (2000).

35
the effects of welfare policies on children has been a much-overdue addition to the
research literature.
Overall, the experimental evaluations of welfare reform have added a great deal to
our detailed knowledge of how these programs have worked in various states and what
their overall effects have been. The experimental design gave credibility to their
conclusions, and were important in convincing many skeptics that welfare-to-work
programs could be implemented by states and could produce employment gains without
major increases in economic need among mothers in the program.
The limitations of these experiments are also clear. They are expensive to run and
are best at evaluating a relatively simple program change. When used to evaluate more
complex programs, there is no easy way to distinguish the effects of different program
components. Hence, although the experiments evaluated programs in a number of states
that implemented time limits, we cannot use the experimental data to separate out the
effects of time limits on employment from the effects of other policy changes in these
states.
Experiments tend to be less than ideal for evaluating major national reforms.
Even if there had been funding to evaluate the implementation of full TANF plans in the
mid-1990s, it is not clear that experiment evaluations would have been useful.
Experiments need credible counterfactuals. Those in the control group (i.e., remaining on
AFDC) have to believe that this program is stable and unchanging, while those in the
experimental group (i.e., the reform group) have to understand the new program and
believe that it will continue for the near future. In a time of major debate about national
welfare reform, the control group is likely to realize that the world is changing around

36
them and may adapt their behaviors even if they are not personally facing program
changes.
Nonetheless, the welfare reform experiments of the past have been highly useful
for our understanding of which changes work in which ways. It would be useful for
federal and foundation funders to continue to invest in future experimental evaluations,
particularly through demonstration projects.
VII. What Have We Learned from Welfare Reform?
Despite limitations to all of our evaluation techniques, there are a number of
important lessons to emerge from the last decade’s efforts at welfare reform, some of
which I’ve highlighted above. As with many research projects, however, the answers to
the first round of questions leads to a second round of questions. In this section, I
summarize both what we’ve learned in some key areas, and three of the major research
issues that are now in front of us.
Interpreting the Caseload Decline and Employment Increase. Everyone was
surprised by the magnitude of change in caseloads and employment in the mid-to-late
1990s. Caseloads declined further and employment increased more than anyone would
have predicted…and I venture that this is true even if we had known in 1996 just how
good the U.S. labor market would be in the late 1990s. One major lesson from the 1990s
was the extent to which low-skilled single moms could enter employment. Even research
that focused on measuring the barriers to employment found that 62 percent of welfare
recipients with 2 to 3 barriers to employment entered the labor force after welfare reform
(Danziger, et.al., 2000).

37
The evaluation literature suggests that policy alone was not the primary reason for
this. The experimental studies from the early 1990s did not suggest that serious welfare-
to-work efforts would produce caseload or employment changes as large as actually
occurred in the late 1990s. And as noted above, the regression analyses suggest that
policy explains only a part of the caseload decline. But the strong economy does not
fully explain these changes either. For example, with a rich specification of state-level
economic and policy variables, Grogger (2003b) concludes that these variables explained
only 31 percent of the caseload change between 1993 and 1999.
This leaves us uncertain about what actually did cause these dramatic behavioral
changes. At least two hypotheses have been advanced. The first is that the 1990s
produced a moment of incredible synergy between economy and policy. All effects were
driving in the same direction. The long and sustained economic boom increased jobs and
wages. This interacted with the growing incentives for employment produced by
expansions in the EITC/minimum wage, and with the increased program efforts to reduce
welfare use among low-skilled women (sanctions, time limits, earnings disregards, verbal
encouragement by caseworkers, etc.) The strong economy made it easier to implement
work-oriented welfare reforms and created an optimism about employment opportunities.
This led women to respond to the positive incentives more quickly and to the negative
incentives with less resistance. In turn, the policies created greater incentives for this
population to learn about labor market opportunities and take advantage of the rise in job
availability. Our evaluation techniques are not well-designed to measure these interactive
effects and are designed to estimate separate economy and policy effects, which may
result in understating their full causal impact.

38
A second hypothesis focuses on the extent to which low-skilled women
(particularly those on welfare) made a behavioral shift, as they internalized the strong
anti-welfare message of the 1990s. This message – communicated implicitly and
explicitly inside welfare offices and through the public media – told women that cash
welfare was becoming increasing limited and welfare usage was publicly disapproved.
As we noted in Figure 2, caseloads fell even before reforms were enacted, consistent with
some sort of “pre-announcement” response to the local publicity about welfare reform
proposals designed to get women off welfare and into work.
Some of this response may be due to misinformation rather than a pro-active early
response to expected changes. Hearing about time limits, many women may have
assumed they were subject to them. Bloom and Michalopoulos (2001) note that in all the
experiments some control group members thought they were facing time limits, even
though they were not.
Many state and federal officials discussed the need to “change the culture of
welfare.” The evidence on caseload and employments changes is at least consistent with
the interpretation that they were successful. Furthermore, the fact that participation has
remained low even in the more sluggish economy of the 2000s is also consistent with this
behavioral shift story.
Dramatic behavioral shifts, such as we observed in the mid-1990s are relatively
unique. Policy alone rarely produces such a response. The 1990s give us an opportunity
to study exactly how and why such behavior changed. This is particularly crucial in
understanding the persistence of these changes into the future, the subject to which I turn
next.

39
Understanding the Effects of an Economic Slowdown Under the new Policy
Regime. Those who were most critical of the welfare reforms predicted that these
changes would have strong negative effects on the well-being of families as soon as jobs
became less available. Welfare reform both pushed women into work (often with only
limited assistance for child care or other work-related needs) and limited women’s ability
to return to cash assistance (due to time limits, diversion, sanctions, and greater state
discretion). When jobs were readily available, it is not surprising that women’s earnings
rose. Low wage work has always been strongly cyclical, however, and moderate
increases in overall unemployment typically translate into much larger unemployment
increases among the less skilled. Thus, it is a puzzle that by 2002 there was not a greater
return to welfare or a greater increase in economic need among women who became
unemployed.
The effects of the economic slowdown continue to appear relatively limited
among this population. While caseload declines have stopped, caseloads have risen little
and remain far below where they were a decade ago. While employment among less-
skilled single women has fallen, it still remains 4 to 5 points below where it was a decade
ago. While poverty is up, poverty rates among single mothers, or among persons of
color, are still very close to their historical lows and far below where they were a decade
ago. At this point, the interpretation of these data are unclear. Three quite divergent
hypotheses are possible.
First, there are those who claim this is exactly what welfare reform promised.
Women have found jobs, built job experience, and have a strong incentive to stay
employed; hence, they are retaining their jobs. Survey evidence from employers suggests

40
that they found ex-welfare recipients to be as good or better employees than other
workers in similar low-skilled jobs (Holzer and Stoll, 2001). Perhaps less-skilled
women have responded in exactly the right way to the changed public assistance system,
which supports work more than it provides support to non-workers.
Second, some claim that the economic slowdown has been relatively mild – a
short recession followed by low levels of growth. Unemployment among women has
remained relatively low; the sectors with the greatest economic problems have been
manufacturing and traded goods, not the retail and service sectors where women are
disproportionately employed. Hence, perhaps it is not surprising that less-skilled women
are retaining jobs. The current economy has not yet tested how well the new welfare
programs work in a truly job-short economy.
Third, there are those who claim that the data on caseloads and employment hides
economic pain that we are not measuring. The well-being of less-skilled women, forced
to move in with boyfriends or family members in order to survive on low wages and
unstable employment, may be poorly measured in our surveys. More crowded
households may create personal stress, or parenting tension between multiple adults. It
may mean increased domestic violence and abuse. Women may be taking multiple jobs
(or working in the illegal economy), unwilling to see their children suffer from hunger,
but meanwhile subjecting them to the stress of a too-often-absent parent and unreliable
child care. We have few adequate or timely measures of many of these potential
problems, which may mean that these effects are relatively invisible to the research
community.

41
Closely related to the effects of the economic cycle on the behavior and well-
being of low-income families, are the effects of state budget crises on the structure of
state welfare programs. So far (as of the end of 2003) there is limited evidence of major
restructuring of state welfare programs. Since most states claimed their revised welfare
programs were major policy successes only a few years ago, there may be a reluctance to
quickly revise them. As a larger share of state dollars to low-income families are spent
on work support rather than cash assistance to non-workers, this may make these
recipients appear more deserving, protecting them from cuts. Furthermore, the state
dollars in welfare remain relatively small, compared to the dollars spent on Medicaid and
other big budget categories. Nonetheless, many states are facing deficits that will require
major cuts in virtually all budget categories and public assistance has long been a target
of state cuts in times of tight budgets. It will be very interesting to see how this plays out
in the years ahead.
While the economic slowdown of the early 1990s seems to have had relatively
mild effects in the data on employment, caseloads and poverty that we have available so
far, the detailed studies and data necessary to fully assess the effects of a slower economy
on less skilled women are still unavailable. Whatever the final assessment, this particular
period of slower growth has lessened but not undone the increases in work, declines in
welfare participation, and declines in poverty that occurred over the late 1990s.
The Relation of Public Assistance Programs to Family Composition and Fertility.
Some of the supporters of welfare reform were more concerned with reducing non-
marital fertility and increasing marriage than they were with work incentives. By
making cash welfare less available to non-working single mothers and by promoting

42
work, welfare reform should have reduced the incentives to bear children as a single
mother since children increase the difficulty and the expenses associated with finding and
holding jobs.
There has long been a debate in the research literature about the extent to which
AFDC encouraged out-of-wedlock births. Murray (1994) argues that the aggregate trend
in out-of-wedlock births matches the aggregate trend in AFDC benefits (with a lag).
More methodologically nuanced microdata analysis shows smaller and more mixed
results. Hoynes (1997) claims there are no effects of AFDC benefit levels on fertility
once state and individual effects are controlled for. Rosenzweig (1999) uses an
alternative method to control for heterogeneity among welfare recipients and finds small
positive effects. In summarizing the research literature on AFDC, Moffit (1998, p5)
states “…if there were a sizable effect of welfare on demographic behavior it would
probably be more evident with the available statistical methods than appears to be the
case in the research literature.”
Figure 5 shows the trend in birth rates among unmarried women, ages 15 to 44.
The solid line indicates the overall trend. After many decades of a slowly increasing
trend, nonmarital birth rates peaked around 1994 and appeared to level off. The steady
nature of this trend made it hard to identify the effects of changing variables over this
time period. Nonmarital births among black women have long been much higher, as
Figure 5 shows. Birth rates among unmarried black women peaked in 1989 and have
fallen substantially since then, so that white and black nonmarital birth rates are closer
today than they have been for several decades.

43
Trying to discern the relationship between these recent changes in fertility and the
recent welfare reforms is as difficult as trying to discern the relationship between
employment changes and recent welfare reforms. The timing of changes in non-marital
birth rates among black women does not coincide with welfare reform efforts, although
the decline in nonmarital births among white women starts just as waivers and welfare
reform became major topics of public discussion. Horvath-Rose and Peters (2001)
indicate waivers had negative effects on nonmartial births. In one of the few papers to
use post-1996 data, however, Joyce, et. al. (2003) find that neither waivers nor TANF
appear to have consistent effects on nonmarital births. 28
Fertility is also closely linked to household composition, cohabitation, and
marriage. Evidence on the effects of welfare reform on household composition is mixed
and still quite limited. For instance, Fitzgerald and Ribar (2001) find waivers had few
effects on female headship, while Schoeni and Blank (2000) find a negative effect. This
issue is particularly important because of the emphasis of the Bush administration on
marriage promotion policies. As of this writing, there is pending legislation (which most
observers expect to pass) that will provide substantial funds to operate and evaluate
demonstration projects designed to promote marriage and marital stability.
Our ability to link policy changes with family structure and fertility changes
remains limited. In part this is because family structure choices are often affected by
deeply-engrained community and family norms, and sexual or marriage behavior may
respond much more slowly to policy changes than does employment behavior. In part,
the data often lack the nuanced control variables (such as the availability or willingness
28 Both Blank (2002) and Grogger, Karoly and Klerman (2002) review this literature in more detail. Seefeldt and Smock (2004) provide a broad summary of the recent research literature on family behavior and composition post welfare reform.

44
of potential marriage partners) that allow us to control for an individual’s expectations
and environment and to specify full models of fertility and marriage behavior.
Furthermore, the data often include only small samples of women making fertility or
family choices in any given year, making it hard to nail down affects within
subpopulations of interest by age, race, or education level.
Interest is likely to remain high, both regarding the effects of policy changes as
well as the potential effects of future policies designed to explicitly encourage marriage
or discourage nonmarital fertility. Finding ways to credibly evaluate future pro-marriage
policies is important, given the difficulty we’ve had in the past evaluating the impact of
welfare policies on marriage or fertility. Experimental evaluations of demonstration
projects are likely to be highly important.
VIII. Conclusions
Welfare reform provides an interesting case study not just for those who want to
understand the specific changes in behavior and well-being that it induced among low-
income populations. It is also an example of major policy reform. Following the
enactment of PRWORA, state public assistance programs changed fundamentally in a
wide variety of ways. Combined with other policy changes enacted at about the same
time, this nation transformed its assistance programs to poor families with children from
cash-assistance oriented programs aimed at providing income support, to work-assistance
programs aimed at encouraging and supporting work.
This transformation is hardly complete. Critics can argue that the changes have
left us with an inadequate safety net, in which an increasing number of families will be

45
unable to return for assistance due to time limits, past sanctions, and limited state funds.
Meanwhile, work requirements force women into unstable, difficult work situations with
low wages and inadequate support for child care, health care or other family needs.
Supporters can argue that the system has now worked for seven years. Due to a
mix of economic good fortune and well-designed policies, a substantial number of
women who would previously have been receiving welfare are now in employment
building a record of experience and demonstrating to their children the importance of
work preparation. Dire predictions about deep poverty and greatly increased
homelessness have not come to pass. Even if the work-support system is far from
perfect, it may be preferable to the poorly-functioning AFDC welfare system of the past.
It is striking that these arguments are as unsettled now as in 1996. In part, this is
because the five years after PRWORA was enacted were economically so unusual that it
is difficult to know if the behavioral changes during that time period were unique and
erodable or whether they signal a permanent change in the landscape of behavior and
expectations among less-skilled families.
One message that everyone should draw from the last decade of welfare reform
efforts is the importance of the economy to any discussion about low-skilled workers.
The availability of jobs is a necessary precondition for less-skilled women or men to find
work. Sustained high unemployment, such as we experienced in the late 1970s and early
1980s must necessarily erode the gains from the 1990s. Policy choices have clearly been
very important over the past decade, and the major policy changes that were enacted
appear to have been an important causal factor behind the behavioral change. But a very
important tool of anti-poverty policy remains economic growth policies. The healthier

46
the overall U.S. economy, the lower the unemployment rate, and the greater the demand
for less-skilled workers, the stronger will be the incentives for the less-skilled to find jobs
and the easier it will be for our direct anti-poverty programs to support low-skilled
families through work subsidies.
As I’ve highlighted at earlier places in this paper, there remain a number of
unanswered questions regarding the impact of the policy changes in welfare in the mid-
1990s. Let me underscore four particular areas for future research. First, it remains
unclear whether we can separate the effects of welfare reform from other economic and
policy changes in the mid-1990s. Over time, however, it may be increasingly possible to
analyze the impact of specific policy components, such as time limits, benefit reduction
rate changes, or particular work requirements. Indeed, some of the more interesting
recent work has tried to do a better and more detailed job collecting specifics on policy
components and estimating their particular effects.29 Creative research efforts that push
further along these lines can be important in allowing us to compare the impact of
different state welfare program choices.
Second, having shown that it is possible to substantially increase women’s labor
market involvement (and decrease their welfare use), we now need to better understand
the long-term implications of this greater reliance on labor market earnings. This
includes studies of the stability of employment and earnings among these single mothers,
as well as information on their opportunities for wage progression over time. A primary
question is whether, having increased the share of working poor families, we might
expect to see more of these families over time leave poverty. We should be particularly
concerned with following those groups of relatively more disadvantaged women (as seen 29 For instance, see Grogger (2003a), Danielson and Klerman (2004), or Fang and Keane (2004).

47
in Table 2) whose earnings shares have increased substantially while their welfare usage
has plummeted.
Third, all evidence continues to show that a substantial minority of single mothers
are not on welfare and not reporting employment. We need to know more about how
these women are managing to survive economically, and monitor broader measures of
their and their children’s well-being. This will almost surely require new research on
income sharing and household composition choices.
Last, there remain a series of questions about the impact of these program
changes, directed primarily at welfare and labor market behavior, on other aspects of
women’s lives and the lives of their children. Will these women work harder to retain
jobs and remain off welfare? Will this affect their future fertility and marriage choices?
Will their children be more likely to pursue labor market skills and future employment?
Any long-term evaluation of the effectiveness of the welfare changes in the mid-1990s
will require answers to these questions.

48
References
Bernstein, Jared and John Schmitt. 1998. “Making Work Pay: The Impact of the 1996-97 Minimum Wage Increase.” Washington, D.C.: Economic Policy Institute. Blank, Rebecca M. 2001. “What Causes Public Assistance Caseloads to Grow? Journal of Human Resources, Vol 36(1): 85-118. Winter. Blank, Rebecca M. 2002. “Evaluating Welfare Reform in the United States.” Journal of Economic Literature. Vol 40(4):1105-1166. December. Blank, Rebecca M., David Card and Philip K. Robins. 2000. “Financial Incentives for Increasing Work and Income Among Low-Income Families.” In Finding Jobs: Work and Welfare Reform, Rebecca M. Blank and David Card, eds. New York, NY: Russell Sage Foundation. Rebecca M. Blank and Ron Haskins. 2001. The New World of Welfare. Washington, D.C.: Brookings Institution. Bloom, Dan and Charles Michalopoulos. 2001. How Welfare and Work Policies Affect Employment and Income: A Synthesis of Research. New York: Manpower Demonstration Research Corporation. Bloom, Dan, Mary Farrell, and Barbara Fink, with Diana Adams-Ciardullo. 2002. Welfare Time Limits: State Policies, Implmentation and Effects on Families. Report submitted to the Department of Health and Human Services. New York City: MDRC. Cancian, Maria, Robert Haveman, Thomas Kaplan, Daniel R. Meyer, and Barbara Wolfe. 1999. “Work, Earnings, and Well-Being After Welfare,” In Economic Conditions and Welfare Reform, Sheldon H. Danziger, ed. Kalamazoo, MI: W.E. Upjohn Institute for Employment Research. Chernick, Howard. 1998. “Fiscal Effects of Block Grants for the Needy: An Interpretation of the Evidence.” International Tax and Public Finance. Vol 5(2):205-33. May. Council of Economic Advisers. 1999. “Economic Expansion, Welfare Reform, and the Decline in Welfare Caseloads: An Update. Technical Report.” Washington, D.C.: Executive Office of the President. August. Danielson, Caroline and Jacob Alex Klerman. 2004. “Why Did the Welfare Caseload Decline?” Unpublished manuscript, RAND.

49
Danziger, Sandra, Mary Corcoran, Sheldon Danziger, Coleen Heflin, Ariel Kalil, Judith Levin, Daniel Rosen, Kristin Seefeldt, Kristine Siefert, and Richard Tolman. 2000. “Barriers to the Employment of Welfare Recipients.” In Prosperity for All? The Economic Boom and African Americans,” R. Cherry and W. M. Rodgers, eds. New York: Russell Sage. Danziger, Sheldon and Eugene Smolensky. 1983. “Abrupt Changes in Social Policy: The Redistributive Effects of Reagan’s Budget and Tax Cuts” Public Finance and Social Policy. A.I. Culyer and G. Terney, eds. Detroit, MI: Wayne State University Press. P209-223.. Danziger, Sheldon, Robert Haveman, and Eugene Smolensky. 1977. “The Program for Better Jobs and Income: Guide and Critique.” Study prepared for the Joint Economic Committee, 95th Congress. Washington: U.S. Government Printing Office. October 17. Danziger, Sheldon, Peter Gottschalk, and Eugene Smoensky. 1985. “The Effects of Unemployment and Policy Changes on America’s Poor.” Journal of Social Policy. Vol 14(3): 313-31. July. Fang, Hanming and Michael Keane. 2004. “Assessing the Impact of Welfare Reform on Single Mothers.” Unpublished manuscript, Yale University. Figlio, David N. and James P. Ziliak. 1999. “Welfare Reform, the Business Cycle, and the Decline in AFDC Caseloads,” in Economic Conditions and Welfare Reform, Sheldon H. Danziger, editor. Kalamazoo, MI: W.E. Upjohn Institute for Employment Research. Fitzgerald, John M. and David C. Ribar. 2004. “Welfare Reform and Female Headship.” Demography. May, forthcoming. Gais, Thomas L., Richard P. Nathan, Irene Lurie, and Thomas Kaplan. 2001. “Implementation of the Personal Responsibility Act of 1996.” In The New World of Welfare, Rebecca M. Blank and Ron Haskins, eds. Washington, D.C.: Brookings Institution. Giannarelli, Linda, Sarah Adelman, and Stefanie Schmidt. 2003. Getting Help with Child Care Expenses. Assessing the New Federalism, Occasional Paper Number 62. Washington, D.C.: The Urban Institute. February. Grogger, Jeffrey. 2003a. “The Effect of Time Limits, the EITC, and Other Policy Changes on Welfare Usage, Work, and Income Among Female-Headed Families.” Review of Economics and Statistics. Vol 85(2): 394-408. May Grogger, Jeffrey. 2003b. “Welfare Transitions in the 1990s: The Economy, Welfare Policy, and the EITC.” National Bureau of Economic Research Working Paper No. 9472. Cambridge, MA: NBER. January.

50
Grogger, Jeffrey, Lynn Karoly, and Jacob Klerman. 2002. Consequences of Welfare Reform: A Research Synthesis. Document DRU-2676-DHHS, Prepared by RAND for the Agency for Children and Families, Department of Health and Human Services. Santa Monica, CA: RAND. Gruber, Jonathan. 2003. “Medicaid.” In Means-Tested Transfer Programs in the United States, Robert A. Moffitt, ed. Chicago: University of Chicago Press and NBER. Hamilton, Gayle. 2002. Moving People from Welfare to Work: Lessons from the National Evaluation of Welfare-to-Work Strategies. Report prepared for the U.S. Department of Health and Human Services, Administration for Children and Families and Office of the Assistant Secretary for Planning and Evaluation, and for the U.S. Department of Education, Office of the Under Secretary, Planning and Evaluation Service, and Office of Vocational and Adult Education. New York: MDRC. July Hamilton, Gayle, with Stephen Freedman and Sharon McGroder. 2000. Do Mandatory Welfare-to-Work Programs Affect the Well-Being of Children? A Synthesis of Child Research Conducted as Part of the National Evaluation of Welfare-to-Work Strategies. Report prepared for the U.S. Department of Health and Human Services, Administration for Children and Families and Office of the Assistant Secretary for Planning and Evaluation, and for the U.S. Department of Education, Office of the Under Secretary, Planning and Evaluation Service, and Office of Vocational and Adult Education. New York: MDRC. Hamilton, Gayle, Stephen Freedman, Lisa Gennetian, Charles Michalopoulos, Johanna Walter, Diana Adams-Ciardullo, and Anna Gassman-Pines. 2001. National Evaluation of Welfare-to-Work Strategies: How Effective are Different Welfare-to-Work Approaches? Five-Year Adult and Chid Impacts of Eleven Programs. Report prepared for the U.S. Department of Health and Human Services, Administration for Children and Families and Office of the Assistant Secretary for Planning and Evaluation, and the U.S. Department of Education, Office of the Deputy Secretary, Planning and Evaluation Service, and Office of Vocational and Adult Education. New York: MDRC. December. Haskins, Ron. 2001. “Effects of Welfare Reform on Family Income and Poverty.” In The New World of Welfare, Rebecca M. Blank and Ron Haskins, eds. Washington, D.C.: Brookings Institution. Holzer, Harry J. and Michael A. Stoll. 2001. “Job Performance and Retention among Welfare Recipients.” Institute for Research on Poverty, Discussion Paper No. 1237-01, University of Wisconsin. Horvath-Rose, Ann and H. Elizabeth Peters. 2001. “Welfare Waivers and Non-Marital Childbearing.” In For Better and For Worse: Welfare Reform and the Well-Being of Children and Families, Greg J. Duncan and P. Lindsay Chase-Lansdale, eds. New York: Russell Sage.

51
Hotz, V. Joseph, Guide W. Imbens, and Jacob A. Klerman. 2000. “The Long-Term Gains from GAIN: A Re-Analysis of the Impacts of the California GAIN Program.” National Bureau of Economic Research Working Paper No. 8007. Cambridge, MA: NBER. November. Hoynes, Hilary Williamson. 1997. “Does Welfare Play Any Role in Female Headship Decisions?” Journal of Public Economics. Vol 65(2): 89-117. August. Joyce, Theodore, Robert Kaestner, and Sanders Korenman. 2002. “Welfare Reform and Non-Marital Fertility in the 1990s: Evidence from Birth Records.” National Bureau of Economic Research Working Paper 9406. Cambridge, MA: NBER. Kalil, Ariel, Kristin S. Seefeldt, and Hui-Chen Wang. 2002. “Sanctions and Material Hardship Under TANF.” Social Service Review. Vol 76:642-62. Kaushal, Neeraj, and Robert Kaestner. 2001. “From Welfare to Work: Has Welfare Reform Worked?” Journal of Policy Analysis and Management. Vol 20(4): 699-719. Klerman, Jacob and Steven Haider. 2001. “A Stock-Flow Analysis of the Welfare Caseload: Insights from California Economic Conditions.” Unpublished manuscript. Santa Monica, CA: RAND. January. Loprest, Pamela. 2001. How Are Families that Left Welfare Doing? A Comparison of Early and Recent Welfare Leavers. Series B, No B-36, Assessing the New Federalism Project. Washington, D.C.: Urban Institute. April. Loprest, Pamela. 2003. Fewer Welfare Leavers Employed in Weak Economy. Snapshots of America’s Families, No. 5. Washington, D.C.: The Urban Institute. Martinson, Karin. 2000. The National Evaluation of Welfare-to-Work Strategies Evaluation: The Experience of Welfare Recipients Who Find Jobs. Written by MDRC for U.S. Department of Health and Human Services. Washington, D.C.: DHHS. December. Meyer, Bruce D. and James X. Sullivan. 2004. “The Effects of Welfare and Tax Reform: The Material Well-Being of Single Mothers in the 1980s and 1990s.” Journal of Public Economics. Vol 88(7-8): 1387-1420. July. Michalopolous, Charles and Gordon Berlin. 2001. “Financial Work Incentives for Low-Wage Workers,” In The New World of Welfare, Rebecca M. Blank and Ron Haskins, eds. Washington, D.C.: Brookings Institution. Miller, Cynthia, Virginia Knox, Lisa A. Gennetian, Martey Dodoo, Jo Anna Hunter, and Cindy Redcross. 2000. Reforming Welfare and Rewarding Work: Final Report on the Minnesota Family Investment Program. Vol 1: Effects on Adults. New York: MDRC. September.

52
Moffitt, Robert A. 1998. “Introduction.” In Welfare, the Family, and Reproductive Behavior, Robert A. Moffitt, ed. Washington, D.C.: National Research Council. Moffitt, Robert A. 1999. “The Effects of Pre-PRWORA Waivers on Welfare Caseloads and Female Earnings, Income, and Labor Force Behavior,” In Economic Conditions and Welfare Reform, Sheldon H. Danziger, ed. Kalamazoo, MI: W.E. Upjohn Institute for Employment Research. Morris, Pamela, Aletha Huston, Greg Duncan, Danielle Crosby, and Hans Bos. 2001. How Welfare and Work Policies Affect Children: A Synthesis of Research. New York: MDRC. Murray, Charles. 1994. “Does Welfare Bring More Babies.” The Public Interest. Vol 115: 17-30. Spring. Neumark, David. 2001. “The Employment Effects of Minimum Wages: Evidence from a Pre-Specified Research Design.” Industrial Relations. Vol 40(1): 121-144. January. Pavetti, LaDonna, Michelle K. Derr, and Heather Hesketh. 2003. Review of Sanction Policies and Research Studies: Final Literature Review. Report repared for the Department of Health and Human Services, Office of the Assistant Secretary for Planning and Evaluation, by Mathematica Policy Research, Inc. Washington, D.C.: Mathematica. Rosenzeig, Mark R. 1999. “Welfare, Marital Prospects, and Nonmarital Childbearing. Journal of Political Economy. Vol 107(6, pt2): S3-S32. Schoeni, Robert F. and Rebecca M. Blank. 2000. “What Has Welfare Reform Accomplished? Impacts on Welfare Participation, Employment, Income, Poverty, and Family Structure.” National Bureau of Economic Research Working Paper 7627. Cambridge, MA: NBER. Seefeldt, Kristin S. and Pamela J. Smock. 2004. “Marriage in the Public Policy Agenda: What Do Policy Makers Need to Know for Research?” National Poverty Center Working Paper #04-02. Ann Arbor, MI: National Poverty Center, University of Michigan. February. U.S. House of Representatives, Committee on Ways and Means. 2000. 2000 Green Book. Washington, D.C.: Government Printing Office. October. Urban Institute. 2002. Fast Facts on Welfare Policy: How Are TANF Dollars Spent? Washington, D.C. May. http://www.urban.org/content/Research/NewFederalism/Newsroom/FastFacts/Fiscal/FF_Fiscal.htm

53
Wallace, Geoffrey, and Rebecca M. Blank. 1999. “What Goes Up Must Come Down? Explaining Recent Changes in Public Assistance Caseloads,” In Economic Conditions and Welfare Reform, Sheldon H. Danziger, ed. Kalamazoo, MI: W.E. Upjohn Institute for Employment Research. Weaver, R. Kent. 2000. Ending Welfare As We Know It. Washington, D.C.: Brookings Institution. Ziliak, James P., David N. Figlio, Elizabeth E. Davis, and Laura S. Connolly. 2000. “Accounting for the Decline in AFDC Caseloads: Welfare Reform or the Economy?” Journal of Human Resources. Vol 35(3):570-86. Summer.

Total Income (in 2000 dollars)
Public Assistance Own Earnings Other Earnings Other Income
1985 $20,417 23.82% 49.03% 5.49% 21.66%1986 19,842 24.96 49.58 5.44 20.021987 18,445 23.55 51.94 3.86 20.651988 18,301 23.24 52.95 3.98 19.831989 19,090 20.72 54.78 3.92 20.581990 18,412 22.63 53.32 4.15 19.901991 18,442 23.81 53.22 3.37 19.601992 17,878 22.79 52.82 3.14 21.251993 18,155 22.70 52.07 2.97 22.261994 19,222 19.47 54.82 3.52 22.201995 20,026 16.46 56.52 3.63 23.391996 19,832 14.85 58.09 3.75 23.311997 20,593 12.13 61.32 3.68 22.871998 21,765 8.63 65.31 4.18 21.891999 22,953 7.10 66.21 4.50 22.192000 23,654 5.27 68.77 4.19 21.772001 23,741 4.71 67.56 4.29 23.452002 23,805 4.45 67.18 3.98 24.40
Source: Author's tabulations of the March Current Population Survey
Single Mothers' Income CompositionTable 1
Percent of Total Income
Note: Total income is the mean dollar value (in 2000 dollars) before taxes. Public Assistance is composed primarily of AFDC and TANF benefits. These calculations are pre-tax and do not include the inputed value of any in-kind benefits.

Earnings as a share of Family Income (1995)
Change from 1995 to 2002
Public Assistance as a share of Family
Income (1995)Change from 1995 to 2002
Ratio of Column (2) to
Column (4)
Part 1. (1) (2) (3) (4) (5)
All 0.531 0.091 0.018 -0.128 -0.711By EducationNo High School Diploma 0.366 0.169 0.342 -0.213 -0.793Only High School Diploma 0.582 0.098 0.173 -0.131 -0.748More than High School Diploma 0.648 0.069 0.084 -0.065 -1.062By RaceWhite (non-Hispanic) 0.613 0.064 0.105 -0.076 -0.842Black (non-Hispanic) 0.529 0.151 0.232 -0.179 -0.844Hispanic 0.479 0.176 0.284 -0.197 -0.893By Age of the Youngest ChildNo Preschooler 0.605 0.075 0.100 -0.074 -1.014Preschooler(s) (less than 6) 0.510 0.150 0.265 -0.187 -0.802Infant(s) (less than 2) 0.451 0.162 0.331 -0.225 -0.720
Percent Working (1995)
Change from 1995 to 2002
Percent on Welfare (1995)
Change from 1995 to 2002
Ratio of Column (2) to
Column (4)
Part 2. (1) (2) (3) (4) (5)
All 0.735 0.065 0.274 -0.182 -0.357By EducationNo High School Diploma 0.487 0.127 0.465 -0.274 -0.464Only High School Diploma 0.752 0.058 0.272 -0.183 -0.317More than High School Diploma 0.854 0.032 0.173 -0.118 -0.271By RaceWhite (non-Hispanic) 0.818 0.024 0.197 -0.129 -0.186Black (non-Hispanic) 0.671 0.125 0.356 -0.249 -0.502Hispanic 0.599 0.147 0.369 -0.240 -0.613By Age of the Youngest ChildNo Preschooler 0.808 0.037 0.188 -0.126 -0.294Preschooler(s) (less than 6) 0.646 0.110 0.381 -0.245 -0.449Infant(s) (less than 2) 0.560 0.114 0.425 -0.245 -0.465
Percent Below Poverty Line
(1995)Change from 1995 to 2002
Percent Working (1995)
Change from 1995 to 2002
Ratio of Column (2) to
Column (4)Part 3. (1) (2) (3) (4) (5)
All 0.402 -0.075 0.735 0.065 -1.154By EducationNo High School Diploma 0.682 -0.109 0.487 0.127 -0.858Only High School Diploma 0.413 -0.057 0.752 0.058 -0.983More than High School Diploma 0.241 -0.051 0.854 0.032 -1.594By RaceWhite (non-Hispanic) 0.291 -0.039 0.818 0.024 -1.625Black (non-Hispanic) 0.510 -0.117 0.671 0.125 -0.936Hispanic 0.566 -0.168 0.599 0.147 -1.143By Age of the Youngest ChildNo Preschooler 0.305 -0.052 0.808 0.037 -1.405Preschooler(s) (less than 6) 0.522 -0.104 0.646 0.110 -0.945Infant(s) (less than 2) 0.584 -0.093 0.560 0.114 -0.816
Source: Author's tabulation of the March Current Population Survey
Table 2Changes Among Single Mothers: 1995 to 2002

Figure 1Total AFDC/TANF Caseloads
0
1,000,000
2,000,000
3,000,000
4,000,000
5,000,000
6,000,000
1970
1972
1974
1976
1978
1980
1982
1984
1986
1988
1990
1992
1994
1996
1998
2000
2002
2003
Year
Num
ber o
f Hou
seho
lds
Rec
eivi
ng A
FDC
/TA
NF
Note: 2003 data is through June of 2003.Source: Website for Agency for Children and Families, Department of Health and Human Services (http://www.acf.dhhs.gov)
1996 Welfare Reform

Figure 2Total Caseloads
0
200,000
400,000
600,000
800,000
1,000,000
1,200,000
1,400,000
1,600,000
1,800,000
2,000,000
-6 -4 -2 0 2 4 6
Year Relative To Year of Implementation of Waivers or TANF
Num
ber
of H
ouse
hold
s R
ecei
ving
AFD
C/T
AN
F
Waiver States
Non-Waiver States
Source: March Current Population Survey. Information on waivers from Council of Economic Advisers (1999, Table A1).

Figure 3Percent of Single Mothers Reporting Work During the Year
0%
10%
20%
30%
40%
50%
60%
70%
80%
90%
100%
1988 1990 1992 1994 1996 1998 2000 2002 2004
Year
No High School Diploma
Only High School Diploma
More than High School Diploma
Source: Author's tabulations of the March Current Population Survey
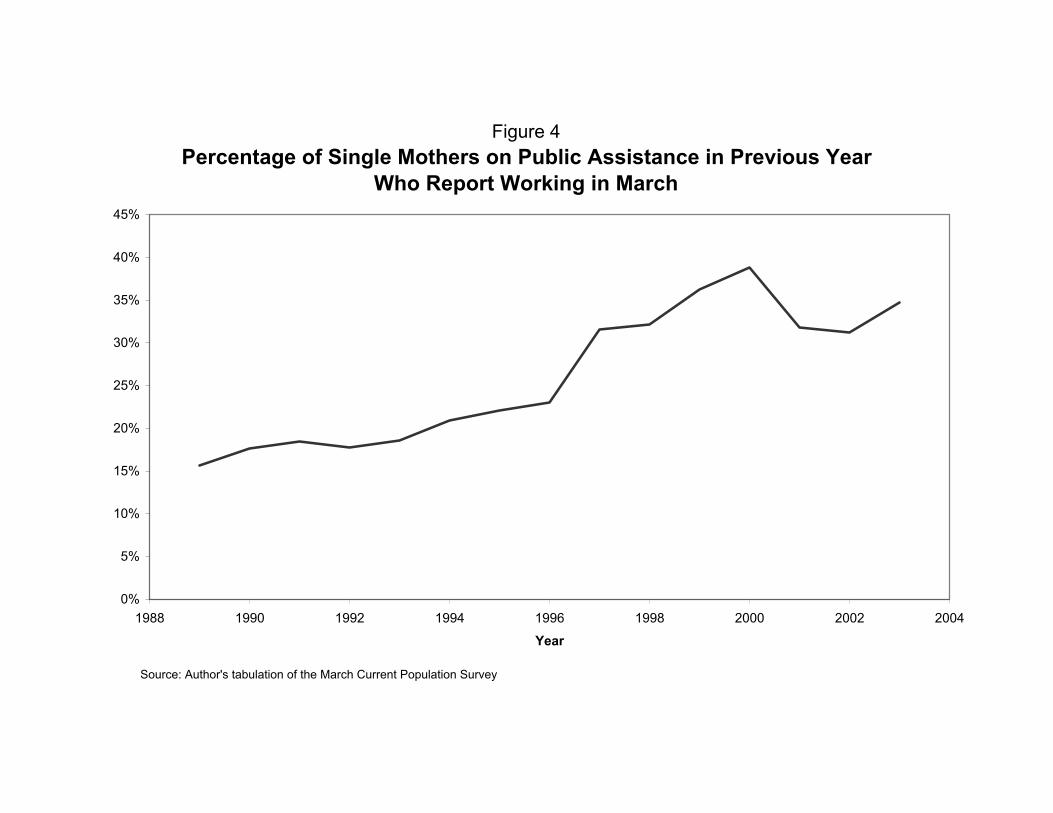
Figure 4Percentage of Single Mothers on Public Assistance in Previous Year
Who Report Working in March
0%
5%
10%
15%
20%
25%
30%
35%
40%
45%
1988 1990 1992 1994 1996 1998 2000 2002 2004
Year
Source: Author's tabulation of the March Current Population Survey

Figure 5Birth Rates for Unmarried Women, Age 15-44
0
10
20
30
40
50
60
70
80
90
100
1980 1982 1984 1986 1988 1990 1992 1994 1996 1998 2000
Year
Live
Birt
hs to
unm
arrie
d w
omen
per
1,0
00 u
nmar
ried
wom
en
Black
AllWhite
Source: Centers for Disease Control and Prevention. (2002). Births: Final data for 2000 (Table 18). National Vital Statistics Reports, 50(5).