what do good outcomes from he look like? - hesa€¦ · what do good outcomes from he look like?...
TRANSCRIPT

What do Good Outcomes from HE look like? Research to support the HESA review of
destinations and outcomes data for graduates
from higher education Dr Guy Birkin
Dr James Evans
Rachel Moreton

Page 2
Acknowledgements
This report has been produced by CFE Research on behalf of HESA and HEFCE.
CFE Research would like to thank Dan Cook and Rachel Hewitt at HESA and Darren
Watson at HEFCE for their support in helping produce this report.
Contact
For more information about this report please contact:
Rachel Moreton
CFE Research
Phoenix Yard
Upper Brown Street
Leicester
LE1 5TE
0116 229 3300
www.cfe.org.uk
© CFE 2016
Established in 1997, CFE is an independent not-for-profit company specialising in the
provision of research and evaluation services across a broad field of education,
employment and skills.

Page 3
Contents
Executive Summary ....................................................................................... 4
01. Introduction ............................................................................... 9
Background and Context ................................................................................ 9
Why We Need Data on HE Outcomes.......................................................... 10
Purpose of the DLHE Survey ........................................................................ 11
Aims and Scope of this Research .................................................................. 11
Method ..........................................................................................................12
Report Structure ...........................................................................................12
02. Measuring Outcomes from HE .................................................. 14
DLHE and Longitudinal DLHE ....................................................................14
Other Sources of Data on HE Outcomes .......................................................16
The Teaching Excellence Framework .......................................................... 20
03. Outcomes for Students and Graduates ...................................... 21
Employment and Employability ...................................................................21
Graduate Skills ............................................................................................. 25
HE as a Financial Investment ...................................................................... 28
Social and Cultural Capital ........................................................................... 31
Meaningful Work ......................................................................................... 33
04. Outcomes for Higher Education Providers ............................... 39
Graduates ..................................................................................................... 39
Teaching & Learning .................................................................................... 40
Research & Innovation ................................................................................. 43
Skills ............................................................................................................. 44
05. Outcomes for Employers ........................................................... 47
Demand for Graduates ................................................................................. 47
Use of Graduate Skills .................................................................................. 49
Human Capital ............................................................................................. 50
06. Outcomes for Society and the State ........................................... 53
Social Mobility ............................................................................................. 53
Political Engagement ................................................................................... 54
Economic Impact ......................................................................................... 54
Mapping HE’s Contribution to Society ........................................................ 56
HE Outcomes as Public/Private Goods ....................................................... 58
07. Conclusions .............................................................................. 63
Appendix 1: Search Terms and Parameters ....................................... 78

Page 4
Executive Summary
Introduction
HESA is conducting a review of destinations and outcomes data for graduates from higher
education (HE). This includes consultation on whether to replace or substantially re-develop
the current Destinations of Leavers of Higher Education (DLHE) survey – a key source of
data on graduate outcomes. This report summarises the findings of a review of evidence on
what are good outcomes from HE. The purpose is to support HESA’s review. The aim is to
consider a broad range of ideas to prompt and inform discussion.
Measuring Outcomes from HE
The DLHE survey is a key source of data on HE outcomes. The survey is administered by HE
providers to their graduates at 6 months after graduation. It is supplemented by the
Longitudinal DLHE, which is conducted 3½ years after graduation. Other sources of data on
outcomes from HE include: the annual National Survey of Students, which comprises
feedback on students’ satisfaction with various aspects of their HE experience; the
Futuretrack study; experience and engagement surveys carried out by the Higher Education
Academy; and the Labour Force Survey. In addition, it is now possible for tax and benefits
data on the UK population to be linked with other data to track students through education
and into the labour market. This provides a potentially powerful new source of information,
although access and usage is restricted.
The broadest studies of HE’s contribution map the range of outcomes from HE across a
number of domains. Typically, these cover the level (individual/societal) and type
(financial/non-financial) of benefits, the range of beneficiaries (graduate/employers/local
communities/national economies) and an assessment of the extent to which higher
education acts as a private or a public good.
While HESA’s review is focused on data on outcomes for graduates, it is important to
recognise that the DLHE data is used by and of interest to a much wider range of
stakeholders. Our review, therefore, explores HE outcomes from the perspective of HE
providers, employers, the state and wider society as well as graduates. In determining what
good outcomes look like we have attempted to focus on those outcomes that the evidence
suggests are most important for these different stakeholders.
Outcomes for Society and the State
Socioeconomic disadvantage and educational attainment are closely associated. People from
poor backgrounds do less well educationally, and there is a wealth of evidence that suggests
that lack of education is one of the main barriers that prevents people moving out of poverty.
HE in particular is frequently justified as a driver of social mobility. However, improving
social mobility requires more than higher education. Furthermore, some literature is more
sceptical, suggesting that education may simply reproduce or even entrench social
inequality.

Page 5
The ways in which HE benefits individuals also creates positive outcomes for the state and
wider society. People with graduate or higher education are more likely to be interested in
politics compared to those who have no formal qualifications and are more likely to take
political action (voting, donating, petitioning, etc.). This has clear benefits for both wider
society and for the value of personal agency it affords. The evidence indicates that graduates
generally have enhanced health and wellbeing as well as higher average salaries. This
generates benefits for the state through reduced demand for welfare services and increased
contributions through tax and loan-repayments.
Outcomes for Higher Education Providers
HE providers are also important sources of research, creating new knowledge which benefits
the economy, society, culture and wellbeing. HE providers also create outcomes as
institutions. HE providers have an influential role to play in the economic success of the
cities and regions in which they are situated. As Anchor Institutions, providers have strong
ties to geographic areas through invested capital, business relationships and employment
opportunities. Graduates are an obvious outcome for providers of HE too. They contribute to
building the providers’ reputation and act as ambassadors and peer mentors.
Learning outcomes - what graduates know and can do on graduation - represent providers’
core offer to students. However, there are difficulties inherent in making comparisons
between potentially highly diverse institutions with varied intakes of students. Learning gain
(how much is learned between two points in time) and/or added-value (how much is learned
in comparison to what was predicted at the start) go some way to addressing this issue and
begin to better identify the contribution of the HE experience. HEFCE is currently running a
programme of activities, including 13 pilot projects, to test and evaluate different approaches
to measuring learning gain.
Outcomes for Employers
The skills that employers say they want are not necessarily the same as what students say
they want or what graduates actually develop. General employability skills are often seen by
employers as more important than subject specific knowledge. These include
communication, IT, creativity and organisational and planning skills. In many cases the
skills that employers want from graduates are not different from what they want from the
wider workforce. Furthermore, the ‘skills’ employers say they are looking for in graduates are
often attributes, such as honesty, integrity, work ethic and social skills. An HE qualification
acts as an indication of these qualities; however, it is unclear whether this is because HE
develops these attributes or simply recruits people who already possess them.
Outcomes for Students and Graduates
Good outcomes from HE have traditionally been conceived and measured in terms of
employment rates and the proportion of graduates in high-skilled or graduate jobs. The key
here is how a graduate job is defined. Approaches include jobs that require the types of
higher level skills and specialist knowledge that HE develops, or simply using professional
and management jobs as a proxy. The jobs that require HE level skills are constantly
changing and definitions need to be regularly reviewed to keep up. However, employers do

Page 6
not just seek and value graduates because their skills are required for a particular job.
Graduate qualifications are used by employers as an indicator of quality and attributes that
they find attractive. Furthermore, even jobs that do not require graduate level qualifications
can be useful and attractive to graduates as a way to gain experience and develop further
skills to enhance their prospects.
HE can be a substantial investment for graduates and financial return is one way to measure
outcomes. However, it is only possible to calculate returns on average and retrospectively.
Evidence suggests financial value is important for students and graduates but that they value
education above this. Focusing just on graduate employment and wage returns presents a
narrow picture of what good outcomes from HE look like. While finding a good job is the
most important outcome from HE for most students, a good job does not necessarily mean a
high-paying one.
Factors such as flexibility and control are important factors in how people feel about their
work. Evidence indicates that meaningfulness is an important element of what makes a good
job – and this applies not just to graduates. Graduates value jobs that are interesting and
challenging. Characteristics of meaningful work include features such as feelings of
accomplishment and work that is meaningful for others too. It may be worth exploring
further what makes work meaningful for graduates and how this might be defined and
measured.
The main desired outcome of HE for students is not necessarily employment in a specific job
but improving their employability and career options more generally. We might see this as a
response to the current labour market, where multiple careers and occupations are the norm
rather than jobs for life. One way in which we might measure good HE outcomes, therefore,
is through the extent to which graduates have obtained the skills and knowledge that make
them more employable. Activities such as work experience, extra-curricular activities and
international experience, are known to boost employability. The extent to which students
engage in these activities is one possible way of measuring employability. However, access to
and participation in these experiences tends to vary by socio-economic background so this
also needs to be taken into account.
One way to bridge the gap between HE, graduates and employers may be to develop a
common approach to measuring and communicating skills. This could be used to show both
the extent to which graduates on different courses develop different types of skills and the
type and level of skills required for different jobs. Any such approach to measuring HE skills
outcomes should go beyond the instrumental knowledge specific to a particular courses and
include higher-level skills required for a knowledge-economy and the more generic skills that
employers want.
HE benefits students and graduates beyond acquiring knowledge and skills. The concept of
social and cultural capital are useful in focusing attention on some of the wider benefits.
Educational qualifications are a form of embodied cultural capital but so too are long lasting
dispositions. HE also provides opportunities to develop social capital – the networks and
contacts that help people get on and get by in life. There is agreement that HE provides an
effective means of developing social and cultural capital. However, there is also debate about
the extent to which HE generates these outcomes, or that these are pre-requisites that drive
educational achievement. What is clear is that social and cultural capital not only contributes

Page 7
to benefits for graduates, institutions and wider social good, but are attractive to employers
too.
Graduate satisfaction, while not an outcome from HE, is another way to consider measuring
the impact of HE as it relates to the extent to which the HE experience has met students’
expectations. Current statistics on satisfaction do not provide much differentiation between
institutions. An alternative approach to measuring satisfaction is the Net Promoter Score
(NPS). Widely used in market research, the NPS may potentially allow greater differentiation
but further research would be required to assess the potential of such a measure.
Outcomes from HE
The table below provides a summary of the outcomes from HE for key stakeholders explored
in this report.
Outcomes for Students and Graduates
Knowledge Subject specific, instrumental knowledge
General knowledge
Employment Employment in well-paid, high-skilled (graduate) roles
Meaningful work
Financial Higher earnings / graduate premium
Return on investment
Employability
Occupation-specific skills
Higher-level skills
Engagement in work experience and extra-curricular activities
Personal attributes and qualities
Social capital – networks that support and sustain
Cultural capital – HE qualification, cultural knowledge/sensitivity
Wellbeing Better health and wellbeing
Outcomes for Higher Education Providers
Graduates
Ambassadors
Providers of peer support
Fundraising
Enhance provider profile and reputation
Research & Innovation Knowledge, impact, reputation (REF)
Business-university collaboration
Learning Learning outcomes – knowledge, skills, attitudes
Learning gain – knowledge, skills, work-readiness
Added value
Skills Occupation specific
Higher-level skills

Page 8
Outcomes for Employers
Human capital Graduates as an asset to the company
Employees with knowledge, social skills and personal attributes
Employment skills
Skilled employees – occupational and generic employability skills
Employees with appropriate attitudes and dispositions
Graduates use the skills they developed during HE
Outcomes for Society and the State
Social mobility Enabling access to graduate jobs and professions
Social engagement Increased propensity for voting, donating, dialogue and discourse
Personal agency
Economic impact Contribution to GDP
Local, regional and community impact

Page 9
01. Introduction
This report has been commissioned by HESA and HEFCE to support the review of destinations and outcomes data on graduates of higher education. In this introductory chapter we set out the background, context and the aims of the literature review, including why good information on the outcomes of higher education is important. We also describe the method used and the report structure.
Background and Context
We do want students to get good outcomes from their time at university, and there is no
better way to improve your life chances than getting a good higher education, and we
want everyone who goes through our system to get a good outcome.
Jo Johnson, Minister for Universities and Science (Gill, 2016)
Just what is a ‘good outcome’ from higher education? That is the question at the core of this
literature review, conducted by CFE Research on behalf of the Higher Education Statistics
Agency (HESA) and the Higher Education Funding Council for England (HEFCE). This
review of evidence on outcomes from HE is designed to support HESA’s review of data on
destinations and outcomes for graduates from higher education.1 A consultation on the
future Destinations of Leavers of Higher Education (DLHE) survey is being undertaken as
part of that review.2 Together with consultation responses, evidence from this literature
review will support the review of DLHE. The aim is to present evidence for how outcomes
from HE benefit learners, providers and wider society.
The recently published higher education (HE) white paper, Success as a Knowledge
Economy, highlights social, economic, and cultural benefits from HE. It asserts that “Higher
education continues to be a sound financial and personal investment with a wide range of
societal benefits”, but it also notes that
…recent research suggests there is large variation in graduate outcomes across both
providers and subjects, and even for those that studied the same subject within the same
provider. (BIS, 2016c, p.8)
Graduates and postgraduates enjoy higher employment rates, lower unemployment rates,
higher median salaries and a greater likelihood of being in high-skilled employment
compared to non-graduates (BIS, 2016a, p5). But there is more to HE outcomes than
graduate labour market statistics. Graduates are also healthier, more politically engaged and
have greater life satisfaction (BIS, 2013b). HE providers (HEPs) also contribute to both the
national economy (UUK, 2014a) and local economies through expenditure, investment and
collaboration (Smallbone et al., 2012). Employers benefit from high-skilled candidates
(Pollard et al., 2015, p.60), and society as a whole benefits in a variety of ways (OECD, 2013).
1 https://www.hesa.ac.uk/pr/3686-review-of-data-on-destinations-and-outcomes-for-leavers-from-he
2 https://www.hesa.ac.uk/NewDLHE_Consultation

Page 10
Defining what good outcomes are and how they should be measured is of particular
importance in the context of current developments in the sector. For example, the
forthcoming Teaching Excellence Framework (TEF) will be used to provide information for
students and to set fee cap levels for HE providers. In addition to TEF data, future
prospective students will also be able to see enhanced data on graduate earnings. This will be
supported by the Small Business, Enterprise and Employment (SBEE) Act 2015, which
allows access to tax and benefits data from HMRC and DWP for the purposes of research and
evaluation throughout the UK (for more information on TEF and the SBEE Act see Chapter
2: Measuring Outcomes from HE). The purpose of the present review is to provide evidence
to support HESA’s review of DLHE, considering how it might take advantage of such
opportunities in order to better serve the needs of stakeholders in higher education. The
New DLHE consultation document (HESA, 2016) identifies four themes emerging from
prior work on the review that summarise its aims:
Future-proofing (taking account of trends in HE, labour market and policy)
Efficiency (minimising burden on data collectors, increasing value for money)
Fit-for-Purpose (ensuring methodology suits newly emerging contexts)
Supporting Legislation (e.g. HE Bill, SBEE Act, supporting government uses of data)
HESA are looking to see how a new DLHE could be re-shaped by incorporating new
measures of HE outcomes that are better suited to addressing these themes.
Why We Need Data on HE Outcomes
The purpose of data on HE outcomes is tied with the purposes of HE itself. For example, HE
outcomes data helps institutions measure the extent to which they fulfil their core functions:
education, research, service and engagement (Coates & Mahat, 2014, p.23). Just as
importantly, HE data informs the decision-making process of prospective students when
considering what and where to study. It enables public access to information that indicates
what knowledge is being learned and which skills are being developed. It also allows for the
sector to monitor and improve itself. As HE funding represents a substantial public
investment, outcomes data is important for transparently showing how this investment is
made and how this fits with national economic priorities.
Transparency and access to HE data are vital to maintaining quality and trust, and HE
providers collect data in order to meet various legal responsibilities. For example, Part C of
the UK Quality Code for Higher Education summarizes the purposes for which HE providers
produce this information:
to communicate the purposes and value of higher education to the public at large
to help prospective students make informed decisions about where, what, when and
how they will study
to enable current students to make the most of their higher education learning
opportunities
to confirm the achievements of students on completion of their studies

Page 11
to safeguard academic standards and assure and enhance academic quality. (QAA,
2016, p.4)
As this shows, HE outcomes data serves to support the HE system from top to bottom – from
the founding principles formalised in institutional mission and ethos, to the more practical
elements of supporting current and potential learners. At the same time, there is increasing
demand for new data on broader outcomes from HE beyond employment and salary.
The aim of this report is to understand the impact of HE by taking account of the different
outcomes that offer benefits both within and beyond the HE system. However, one challenge
with developing new measures of HE outcomes is that some of the most valued aspects of
university education are hard to measure, such as institutional prestige, social cachet, and
the development of cultural capital. Whether quantitative or qualitative, it is important that
the data collection process is not onerous and that the results are accessible and
understandable from the user’s point of view.
Purpose of the DLHE Survey
A key source of data on HE outcomes is the DLHE survey. DLHE data serves a range of
organisations and purposes. It is used by HESA for statistical analyses that provide the basis
for publicly-available reports and occasionally for national statistics (for further information
see Chapter 2: Measuring Outcomes from HE).
National organisations use the data to carry out public functions relating to HE. For
example, UNISTATS, the official source of data for undergraduate courses, is based on a
combination of employment, occupation and earnings data from DLHE and student
satisfaction ratings from the National Student Survey (UNISTATS, 2016). The UNISTATS
dataset is used by prospective students who are deciding what and where to study. Similarly,
The Higher Education Careers Services Unit (HECSU) produce an annual report, What do
graduates do? which is based on DLHE data and which is used by careers advisers.
DLHE is used by government departments and the devolved administrations, HE funding
bodies, research councils and the Office for Fair Access (OFFA). It is also used by third
parties for the purposes of journalism, research and equal-opportunities monitoring. For HE
providers, DLHE data also informs careers guidance and helps sustain commercial and
research links with industry.
Aims and Scope of this Research
The primary aim of this research report is to understand the range of outcomes from HE for
individuals and organisations in the UK. The secondary aim is to see how these outcomes
can be measured. The review explores HE outcomes in terms of benefits for different groups
– students and graduates, HE providers, employers and wider society. Evidence is reviewed
from various theoretical perspectives – including educational, sociological, and economic. As
well outcomes from undergraduate degrees the review also covers outcomes from
postgraduate and research degrees. The review is designed to be broad rather than deep,
covering a wide range of issues and showing how they relate to or interact with each other.
Page 12
Method
This review adopts a rapid evidence assessment (REA) approach. Compared with a
systematic literature review, the REA approach sacrifices some level of rigour in the
searching and review stages. By using focused search parameters and limiting the searches
and databases used, the process can be accelerated to deliver robust results within more
limited time and resource constraints. Because the aim is to inform discussion, the purpose
of this review is to consider a wide range of ideas, rather than gathering all available
evidence or mapping the field. The review comprised the following stages:
Search of academic and ‘grey’ literature to build database of potentially useful sources.
Search terms and parameters are listed in Appendix 1: Search Terms and Parameters.
Selection of material based on quick evaluation of relevance from titles and abstracts.
Review using the annotated bibliography method. The approach and key findings are
noted for each source along with potentially useful quotations.
Analysis through an in-depth reading of the material to understand the findings, identify
corroborations/inconsistencies and clarify implications.
Synthesis of findings and write up.
The review has been a collaborative and iterative process. CFE have worked with HESA to
refine search procedures, share evidence, and discuss the emerging structure and findings.
Report Structure
This report considers what the outcomes are for the people and organisations who have a
stake in HE – both participants in and beneficiaries of the HE system. The literature on
quality assessment in HE is useful because it considers how we can recognise and
understand outcomes in terms of who benefits and how. For example, Cheng & Tan (1997)
make a distinction between internal and external stakeholders. Internal stakeholders include
students and student-facing staff, whereas external stakeholders include prospective
students, institutional management, government bodies, professional bodies, and employers.
Because internal and external stakeholders may have different or even contradictory views of
what constitutes quality in HE (Becket & Brookes, 2005), this report is organised in separate
chapters for each group of stakeholders. From the literature in this review, we have identified
four main groups of stakeholders or ‘communities of interest’ who benefit from HE
outcomes: students and graduates, higher education providers, employers and society and
the state. These groups are useful for organising findings because each has a different
emphasis on what ‘good’ outcomes look like. In this report we:
review the measures currently used in data collections on HE outcomes (Chapter 2:
Measuring Outcomes from HE)
explore what students and graduates expect and want from HE, and what they actually get
from it (Chapter 3: Outcomes for Students and Graduates),
look at what higher education providers offer and how they themselves benefit from HE
outcomes (Chapter 4: Outcomes for Higher Education Providers),

Page 13
identify what employers perceive to be desirable graduate characteristics (Chapter 5:
Outcomes for Employers), and
consider how society and the state benefit from the HE system (Chapter 6: Outcomes for
Society and the State).

Page 14
02. Measuring Outcomes from HE
This chapter gives an overview of current data collections relating to outcomes from higher education. It covers who collects data, which data is collected and what measures are used. This provides context for the rest of the review by indicating the types of outcomes covered by current data collection, the scale and quality of data collection and where there might be gaps. We begin by focusing on the DLHE surveys as a key source and of particular interest to this review, before summarising other data collections.
DLHE and Longitudinal DLHE
The Destinations of Leavers of Higher Education (DLHE) is an annual census survey of
graduates. It is administered by UK HEPs approximately six months after leavers complete
their studies. A standard questionnaire is provided by HESA and in order to maximise the
responses providers can administer the survey online, by telephone or as a paper survey.
Data has been collected since 1994/95 (known as the First Destinations Supplement until
2002/03). Revisions to the survey in 2011/2012 mean that there is a break in the time series
at this point. There were 416,190 responses to the 2014/15 DHLE survey, which equates to a
response rate of 79%.3 In 2015/16 DLHE captured data from 269 HE providers, with FE
colleges offering HE provision through a separate mechanism.
The DLHE is supplemented by a follow-up survey, the Longitudinal DLHE (Long DLHE),
undertaken with a sample of leavers three and a half years after they complete their studies.
Unlike the DLHE, the longitudinal survey is administered by a central, independent survey
provider, and was first carried out in 2006/07. The latest available data (from the 2010/11
survey) comprises 81,640 responses.4 Both surveys collect a range of information that covers
the broad areas of:
current activity (including pay, as applicable)
contribution of the HE experience to preparing for work and further study
assessment of skills obtained through higher education, and
career satisfaction and course value for money.
The Long DLHE survey includes additional questions to collect data on other activities
completed since graduation, perspectives on the skills developed through the HE experience,
satisfaction with career to date, whether they would make the same HE choices again, and
views on course value for money. Together, the surveys are useful in providing a more
rounded picture of HE outcomes, as noted in a statistical review from the Futuretrack study:
Although the longitudinal survey of HE leavers’ destinations sheds more light on labour
market outcomes than the initial survey of leavers six months after graduation, the six-
3 https://www.hesa.ac.uk/sfr237
4 https://www.hesa.ac.uk/dlhelong1011_contents

Page 15
month survey data is useful for what it conveys about HE leavers’ relationships with
employers during their studies. (Mason, 2010, p.34)
As part of designing the TEF (more on which below), the government published a review of
data sources to be used for metrics to assess teaching quality and student outcomes which
includes the DLHE. The report by the Office of National Statistics finds that “The HESA
collection is a very substantial exercise and the systems for checking the data supplied by
HEIs are comprehensive.” (ONS, 2016a, p.16). However, it highlights that while response
rates for the DLHE are good, the survey does not collect outcomes from those who do not
complete their course. It also recommends that non-response also needs to be examined as a
potential source of bias.
Current Activity
Both DLHE surveys capture a snapshot of what leavers report they are doing on a particular
reference date. This includes working, further study, unemployment, travel or something
else. For those in employment the surveys collect additional data on job role, employer
contract type and pay. This data allows the calculation of employment rates and average
salaries for course and providers. This contributes to the Key Information Set (KIS), and is
used by a number of online information sources for prospective and current students
including Unistats, Which? University and Whatuni (Diamond et al. 2015). Publications
such as HECSU’s What do Graduates Do? and Vitae’s What do Researchers Do? provide
analyses of destinations by subjects and discipline. DLHE data on employment of leavers is
also one of the UK Performance Indicators of Higher Education.5 For example, one
frequently used statistic derived from DLHE is the proportion who go on to ‘graduate jobs’.
The Longitudinal DLHE, while collecting snapshot data on current activity, also asks about
the number of jobs held since graduating, periods of unemployment and additional
qualifications obtained. The Long DLHE also covers the extent to which the skills gained in
HE are used in their roles. It includes additional questions for those who completed research
degrees (for example, PhDs) to assess the extent to which they use key skills such as
conducting or critically evaluating research findings in their current role.
Contribution of the HE Experience to Employment
The DLHE asks respondents about the contribution of their qualification to gaining their
current employment – was it a formal requirement, did it give them an advantage or was not
required. This might also be considered a different way of identifying people in graduate jobs
– jobs where a degree is a formal requirement. However, this may not necessarily relate to
the need for graduate skills and knowledge in order to effectively complete the tasks involved
in the job.
The survey also asks which aspect of their qualification was most important to their
employer – the subject, level or related work experience. Further questions ask respondents
how well their course prepared them for employment, further study and starting their own
business. This is explored in greater detail in the Long DLHE which asks how well the HE
5 https://www.hesa.ac.uk/pis/emp

Page 16
experience prepared respondents for or helped progress their career aspirations, as well as
the contribution to self-employment / setting up own business.
Assessment of Workplace Skills
The shorter initial DLHE survey does not cover skills obtained but the Long DLHE does.
Respondents are asked to rate the extent to which their HE experience enabled them to
develop a range of workplace skills, including being innovative, communicating effectively,
making effective use of IT and taking initiative. Interestingly, most of the statements relate
not to the pure skill development to which HE may have contributed, but to the ability to use
skills in their current work. For example: “…to what extent has your higher education
experience enabled you to solve problems in your work.” There is the option to answer the
question by stating “not worked since finishing the course”.
Graduates of research degrees have a slightly different question here which includes
statements that cover not only applied skills as above (for example, influence the work of
others in the workplace”, but also the impact of the HE experience on status (extent to which
it enhances credibility or standing in the workplace) and on wider aspects of life (social and
intellectual capabilities, quality of life generally).
Career Satisfaction and Course Value for Money
These topics are not covered by the 6-month DLHE, although the National Survey of
Students (see below) does cover course satisfaction. However, questions about why
respondents took their current job also provide an indication of the extent to which
graduates are able to actively pursue their chosen career ambitions (It fitted into my career
plan) or are simply managing circumstances (It was the only job offer I received).
The Long DLHE includes questions on the likelihood of students making different choices of
subject, institution, qualification and HE study in hindsight, satisfaction with their career to
date and an assessment of the value for money of their course.
Other Sources of Data on HE Outcomes
National Student Survey
The NSS is an annual census survey of final-year HE students. It is commissioned by the UK
higher education funding bodies and is administered by an independent research provider.
The survey has been running since 2005. The 2016 NSS included responses from 451,782
students at 459 institutions (HEFCE, 2016a). Following a review of the NSS in 2014, HEFCE
will be trialling new versions of some questions from 2017 to align better with the DLHE
(HEFCE, 2015). The questionnaire gathers student’s views on six areas of the HE experience
(plus a question about overall satisfaction with the course):
Teaching
Assessment and feedback
Academic support
Organisation and management

Page 17
Learning resources
Personal development
Like the DLHE, NSS data is widely used to provide information to prospective students, e.g.
through Unistats. With the exception of the questions on personal development, however,
the survey does not address outcomes after graduation but mainly concerns satisfaction with
aspects of the academic experience during the course. The ONS (2016) review of TEF data
sources also considered the NSS, concluding that under-reporting of some groups is a
concern and is source of possible bias. It highlights as a weakness the fact that – like the
DLHE – the NSS survey excludes students who do not complete their course. On the other
hand, the NSS offers value as an HE data collection because it also captures qualitative data
from students in the form of open text responses. Currently this information is not released,
but HEFCE is considering options for publishing this information in future.6
Labour Force Survey
The LFS is a quarterly survey of a nationally representative sample of households from
across the UK. It is carried out by the ONS and focuses on employment circumstances,
providing the source for official measures of employment and unemployment. The sample
comprises approximately 100,000 individuals in 40,000 households (ONS, 2015). The
survey includes information on: level of education, and for those with a degree the subject
and class; employment, hours and earnings; as well as demographic information.
The LFS has been a valuable source for understanding how labour market outcomes for
graduates compare to other sections of the population. As it is representative of the whole
population and is repeated regularly, unlike the DLHE which records outcomes for graduates
at one point time after graduation, it is possible to use the LFS to understand longer-term
impacts of HE. LFS data has been used to estimate the impact of HE on employment and
earnings. Notably, Walker & Zhu (2013) used the LFS to estimate the impact of HE on net
lifetime earnings – see Chapter 3: HE as a Financial Investment). They supplemented the
LFS with data from another source, the British Household Panel Survey (BHPS) as this
provides additional information on HEP type and family educational background.
HMRC and DWP Data
The Small Business, Enterprise and Employment (SBEE) Act 2015 allows for HMRC and
DWP data to be linked to other sources to allow the tracking of students through education
and into the labour market.7 Tax and earnings data collected by HMRC for administrative
purposes provide a new and potentially powerful source of information. According to the
government fact sheet, it is hoped that the Act will allow for better understanding of the
impact of educational choices on labour market outcomes, provide information for
performance management purposes to educational providers and provide information to
inform student choices.
6 http://www.hefce.ac.uk/pubs/year/2015/201524/
7 http://www.legislation.gov.uk/ukpga/2015/26/contents/enacted

Page 18
The Institute for Fiscal Studies (IFS) have already made use of the HMRC data, linking it
with Student Loans Company data and HESA data to explore how graduate earnings vary by
university, subject, gender and family background (Britton, Dearden et al. 2016). The IFS
conclude that:
The latter [HMRC] is a particularly strong data source for modelling longitudinal effects
due to its massive sample sizes and lengthy time series with little drop-out. This is an
important advantage for modelling elements of the HE finance system which requires
good longitudinal data on graduates' earnings. (Britton, Shephard & Vignoles, 2015, p.41)
For analysis of HE data, the SBEE Act offers an increased level of detailed demographic
information and extended coverage in terms of timescale.
Futuretrack
One good source of information on outcomes from HE is Futuretrack. This is a longitudinal
study funded by HECSU and led by researchers from Warwick Institute for Employment
Research that aims to identify which factors affect graduate participation in work, and how.
The four-stage study looks at the HE experiences of a cohort of students who applied to enter
HE in the UK in 2005/06. Stage 1 examined applications, Stage 2 was conducted 18 months
later, and Stage 3 around the time of final examinations (BIS, 2013). Stage 4 aligns closely
with outcomes from HE, as it concerns transitions into employment and further study. The
Futuretrack survey covered almost the entire population of 2005/06 applicants to full-time
courses at UK HEPs – a population of 504,487 (Purcell et al., 2013, p.33).
Supply and demand for graduate skills is the focus of working paper 4 (Atfield & Purcell,
2010) from Stage 3 of the programme. The report from Stage 4 (Purcell et al., 2012) focuses
on outcomes from HE in terms of transitions into employment and further study five years
after graduation. This also looks at a range of other outcomes from HE, including which
subjects and qualifications led to employment or further study, organisations and industries
where graduates work, reasons for accepting jobs, job satisfaction and career prospects.
Outcomes for part-time students are also considered in a separate series of reports,8
including a literature review, a statistical analysis (Mason, 2010) and a report on impact two
years after graduation (Callender & Wilkinson, 2013).
Higher Education Academy
The Higher Education Academy (HEA) delivers four surveys that are relevant to this review.
HEPs opt to participate in these surveys, whose focus is on providing data to inform
enhancements to the learning and teaching experience. All four include some information on
outcomes.
The Postgraduate Taught Experience Survey (PTES), as the name suggests, is for
students undertaking Masters, Postgraduate Certificate or Diploma courses. It incorporates
some questions from NSS to allow for comparison between undergraduate and postgraduate.
8 http://www.hecsu.ac.uk/futuretrack_part_time_students.htm

Page 19
Coverage includes teaching and learning and skills development.9 Its counterpart, the
biennial Postgraduate Research Experience Survey (PRES) collects data from
postgraduate research students (PhD and Masters). PRES began in 2007 and includes
outcomes data on skills and professional development.10 In 2015, the PTES was based on
responses from 72,200 students at 100 institutions, and the PRES on 53,348 students at 123
institutions. The UK Engagement Survey (UKES) measures student engagement with
learning – that is, the time and effort invested in study. The survey was piloted in 2013 and
2014, with the first full-scale survey in 2015. It is based on the National Survey of Student
Engagement and focuses on educational activities known to contribute to effective learning.
(Buckley, 2015).
In addition, HEA in collaboration with the Higher Education Policy Institute (HEPI) conduct
the annual Student Academic Experience Survey. This survey has been running since
2006 and asks full-time undergraduate student about their experience of higher education.
It covers the areas of value-for-money, workload, teaching quality and well-being. The survey
is administered by YouthSight, with respondents drawn from their panel of 78,000 UK
undergraduate students. The 2016 survey received 15,211 responses (Neves and Hillman,
2016, p.6).
HEDIIP Inventory of HE Data Collections
The Higher Education Data & Information Improvement Programme established an
inventory in 2013 in order to help data collectors understand the collections being
undertaken. The database is available to download as a spreadsheet. It lists 486 different
data collections, categorised by name of collection and collector, geographical coverage,
subject, frequency and data type. DLHE collects only 1 of the 8 types of data – individual
student data. Figure 1 below shows how many data collections cover each of the various data
types, including aggregate student data, staff data, finance and research data. The
spreadsheet also shows that most (more than 300) data collections cover all four of the UK
regional administrations. While many of these data sets will not relate directly to HE
outcomes, the database demonstrates the volume of data already collected on aspects of HE.
Figure 1: Number of data collections for each data type. (HEDIIP, 2016)
9 https://www.heacademy.ac.uk/research/surveys/postgraduate-taught-experience-survey-ptes
10 https://www.heacademy.ac.uk/research/surveys/postgraduate-research-experience-survey-pres
0 50 100 150 200 250
Individual Student Data
Aggregate Student Data
Curriculum Information
Individual Staff Data
Aggregate Staff Data
Finance Data
Research Data
Other

Page 20
The Teaching Excellence Framework
The Teaching Excellence Framework (TEF) is not a source of data in the same way as the
collections described above, but is a forthcoming measure of HE outcomes constructed from
a variety of sources, including the NSS and DLHE. As the introduction of TEF will have a
significant impact on the HE sector and is a hotly debated policy, it is worth exploring here.
The government proposes that TEF should measure teaching quality. It is intended that the
results should support student’s informed choices and provide an incentive for institutions to
improve teaching quality by linking TEF to funding. However, as the HE white paper admits,
“Robust, comparable information about the quality of teaching – and the components that
contribute to it – is not currently available.” (BIS, 2016c, p.43). In the absence of recognised
measures of teaching quality, the proposal is to use other metrics as proxies of teaching
excellence (House of Commons BIS Committee, 2016, p.6). The HE white paper sets out the
expectation that “excellent teaching […] delivers excellent outcomes”, and proposes the
following core metrics as proxy measures of teaching excellence (BIS, 2016c, p.47):
Student satisfaction (NSS)
Retention (HESA UK performance indicators)
Proportion of students in employment or further study after six months (DLHE)
Participating HEPs will be invited to supply additional qualitative data to contextualise these
quantitative metrics. Unlike some other HE metrics, it is proposed that the TEF will “Be
benchmarked to take account of differences in student characteristics and mixture of
subjects taught at different providers” (BIS, 2016d, p.19). The Government is also consulting
on the inclusion of a ‘high-skilled employment’ metric. TEF scores will form the basis for
assessments by a panel comprising students, employers and widening participation experts
as to whether HEPs are ‘meeting expectations’, ‘excellent’ or ‘outstanding’. There are
concerns about extent to which these proxy measures will work as measures of teaching
quality (House of Commons BIS Committee, 2016, p.6). Rich (2015) argues that the TEF
should measure employability rather than employment, because DLHE is “the most proxy
proxy”. The House of Commons BIS Committee paper (2016) also highlights potential
unintended consequences of TEF metrics system, warning that institutions may make
courses less demanding in order to boost retention scores, thus undermining efforts to
improve quality. Whether or not DLHE data provides a suitable basis for TEF metrics, the
ONS (2016) analysis of TEF data sources is clear that DLHE is in itself a well-established,
substantial and comprehensive data collection.
Summary
This chapter has described the main data sources and measures of outcomes from HE.
Existing measures generally focus on quantifiable aspects of HE outcomes such as
attainment level and earnings), or otherwise classify outcomes in a way that can be
quantified (such as the proportion of leavers in graduate jobs). Data sources measure both
objective (e.g. salary) and subjective (e.g. satisfaction) outcomes from HE. Qualitative data is
collected less frequently (one example is the free text comments in the NSS), but provides a
way to add detail to quantitative measures and broaden understanding of HE outcomes,
though it requires greater time and resource for analysis.

Page 21
03. Outcomes for Students and Graduates
Students and graduates are central to HE and in this chapter we identify outcomes from their perspective. This includes what they want and expect from HE, and what they actually gain. This encompasses employment and employability skills and we explore how this relates to what employers seek in graduates. The chapter also considers financial returns, social and cultural capital and wellbeing and satisfaction as important outcomes for students and graduates.
Employment and Employability
Measuring Graduate Employment
Graduates and postgraduates have higher employment rates and lower unemployment rates
than non-graduates. These measures form a key part of current UK performance indicators
in HE.11 Amongst the working-age population (16–64 years old), graduates and
postgraduates have similarly high employment rates (87.1% and 87.5%, respectively)
compared with non-graduates (69.8%) (BIS, 2016c). But postgraduates are more likely than
graduates to be working in high-skilled employment (78% postgraduates compared with
66% of graduates).
Graduates have always had higher employment and higher earnings than non-graduates, but
in recent years there have been some changes. Earnings and employment rates for all
groups, whether graduates or not, were depressed by the financial crisis of 2008/09, but
have now returned to pre-crisis levels (BIS, 2016a, p.12). High skilled employment rates
follow a similar pattern, but despite an upturn in recent years they are still lower than they
were before the recession in 2006. These employment rates combined with the increase in
HE participation in the UK mean that a greater number of graduates are either not employed
or are working in non-graduate jobs (BIS, 2016c, p.9).
‘High-skilled employment’ and ‘graduate jobs’ are defined by Standard Occupation
Classification (SOC) groups 1 to 3,12 comprising: Managers, Directors and Senior Officials;
Professional Occupations; and Associate Professional and Technical Occupations. In their
response to the TEF consultation, the Royal Statistical Society (2016) say that SOC groups 1–
3 do seem to capture most high-skilled jobs, but also caution that
…it is important to ensure any classification keeps pace with new growth areas in the
labour market. We also share the concern mentioned in paragraph 71 of the consultation
document that many jobs included in groups 1 and (particularly) 3 are not necessarily
high value ‘graduate jobs’.
The recent Report of the Independent Panel on Technical Education (Blagden, Robinson,
West & Wolf, 2016) notes that HESA has refined the SOC codes system for some sectors by
increasing the number of digits from 4 to 5, thereby increasing the number of occupations
11 https://www.hesa.ac.uk/pis/emp
12 ONS Standard Occupational Classification (SOC)
http://www.neighbourhood.statistics.gov.uk/HTMLDocs/dev3/ONS_SOC_hierarchy_view.html

Page 22
that can be coded. The new codes make it “possible to have more granular descriptions that
are much closer to the way that employers conceive occupations” (p.65). The report also
notes that “in undertaking our analysis we were also struck by how little information is
collected in England about what knowledge, skills and behaviours are required for different
occupations”. We pick up on this issue in the next two sections which look at Employability
and Graduate Skills.
Employability
Rather than employment per se, the main desired outcome of HE is employability. Most
students undertake a degree to improve employment options more generally, rather than to
get a particular job. The exceptions in include legal and medical degrees that are focused
towards very specific career paths, as well as vocationally-oriented technical education and
higher apprenticeships. Evidence from a QAA-funded study of expectations and perceptions
of students in 2012/13 suggests that what students want from HE is not a specific job, but to
achieve ‘employability’ – that is, to develop skills and knowledge in order to increase the
chances of getting a ‘good job’:
Across all subjects of study, the primary purpose for students entering higher education
was to improve their career prospects and as a pathway for career enhancement.
(Kandiko & Mawer, 2012, p.9)
The desire to cultivate employability is a response to restructuring of the labour market
which is characterised by uncertainty, temporary contracts, flexible working and multiple
career paths instead of a job for life (Cascio, 2003). As a result of the decline in traditional
work, the “psychological contract” with work has changed, so that “employment security” has
replaced “job security”, according to one US study (Cascio, 2003, p.7). In the UK, 92% of
people think job security is important, but only 65% think they actually have it (NatCen,
2015, p.45). These conditions of the modern labour market partly explain the increased
importance of employability to students.
On the other hand, evidence from Futuretrack, a longitudinal study of students who applied
to enter HE in 2006, suggests that the “prime function” of HE remains “the inculcation of
knowledge, rather than the development of ‘employability skills’” (Purcell et al., 2013, p.21).
The Futuretrack analysis add much detail to understanding the education and training
outcomes that graduates bring to the labour market from higher education. It also finds that
Graduates value jobs which offer interesting and challenging work and continual skills
development and, in the current economic climate, are likely to be attracted by these to
provide them with useful experience of employment and the opportunity to create
evidence of developing employability skills, even in jobs which do not require their
qualifications or recognise these in the payment structure. (Purcell et al., 2013, p.70).
Therefore, simply measuring job type and salary of graduates may not fully capture the fact
that some may be working to progress career and other goals even if not in typical graduate
or high-paying roles.
Amongst graduates who studied part-time and who took part in Futuretrack, more than half
say that the course led to the career changes they hoped for (Callender & Wilkinson, 2013,
p.8).

Page 23
For students who with hindsight would choose to study a different subject in HE, the
predominant reason is that employment prospects were poor in that subject area (Purcell et
al., 2013, p.152). They would change to something that would give them more of an
advantage in the labour market, usually something more specialised, vocational or technical.
One way in which we might measure HE outcomes, therefore, is the extent to which
graduates have acquired the skills and knowledge that make them more ‘employable’.
Another way to view employability is to consider the extent to which students engage in
activities that help build employability. The Futuretrack study underscores the importance of
gaining work experience as part of studying at HE:
The results suggest that work-based learning combined with paid work was associated
with the most positive labour market outcomes while not undertaking any form of work
experience while studying was associated with the least positive labour market outcomes.
(BIS, 2013a, p.90).
While some students undertake unpaid work, only a minority of graduates do so, and those
who do spend little time on it. Participation in unpaid work and other activities varies with
socioeconomic status; graduates from relatively socially advantaged background are more
likely to access information about HE and career options such as unpaid work, and are more
likely to take advantage of those options (Purcell et al., 2013, p.64). Interestingly, unpaid
work has different effects on the employment outcomes, depending on when it is
undertaken:
Undertaking unpaid work during the course only compared to doing no unpaid work
increases the likelihood of being employed in an Expert or Communicator role by at least
one and a half times relative [to] being employed in a non-graduate job. However,
undertaking unpaid work after graduation diminishes the odds of being employed in all
three types of graduate jobs relative to a non-graduate job and relative to doing no
unpaid work at all. Interestingly, doing unpaid work both during the course and after
graduation also has a significant diminishing effect for being employed in an Expert role
relative to a non-graduate job (the effect is also diminishing but not significant for
Strategic and Communicator roles). (Purcell et al., 2013, p.xxiii. Original emphasis)
Part-time students tend to be employed before, during and after their HE course. In the
Futuretrack study, 78% of part-time students were employed full-time and most were
employed continuously (Callender & Wilkinson, 2013, p.6). So, although graduates who
studied part-time have good employment rates, this is often a continuation of existing
employment, and therefore this outcome cannot be attributed to the effect of HE study
alone. Part-time students also tend to have different career motivations for their HE study:
whilst many part-time students undertake their course to improve their level of
educational qualifications, many already have HE qualifications. For these students,
study is not about raising their level of educational qualifications but more about
developing or changing their careers. (Callender & Wilkinson, 2013, p.76)
Evidence from Futuretrack also suggests that engaging in activities alongside an HE course is
also a means to increase employability by adding to the labour market value of the
qualification: Both graduates and employers value such extra-curricular experience and use
it as a means to distinguish between candidates with similar academic qualifications (Purcell
et al., 2012, p.114).

Page 24
International experience is another form of extra-curricular activity that can contribute to
employability of graduates, but there is little research evidence for this, especially on the
causal links between experience and employability (King, Findlay & Ahrens, 2010, p.6). Like
unpaid work, access to international experience tends to vary with socioeconomic
background, with more opportunities for more privileged students (King, Findlay & Ahrens,
2010, p.27). People from poorer backgrounds are less likely to engage due to lack of money,
self-confidence and time. Unfortunately, “by failing to reap the benefits of the non-academic
aspects of HE” these less advantaged graduates “amplify their relative disadvantages” in the
labour market (Purcell et al., 2012, p.117). Conversely, participation in extra-curricular
activity offers a means for people from less advantaged backgrounds to access opportunities
similar to those that people more advantaged backgrounds are able to enjoy (Purcell et al.,
2012, p.103). These variations by socioeconomic group suggest that outcomes from HE are
highly contingent and personalised, even though as a statistical group graduates have a clear
(but diminishing) labour market advantage.
Employability can be considered as both a process and a product of learning in HE (Aamodt
& Havnes, 2008, in: Kandiko & Mawer, 2013, p.36). However, it should be noted that
although the evidence for the increased employability of graduates is clear, the basis for this
is not well-understood, particularly the question
…whether it is a function of the relevance of the knowledge and skills transmitted by
higher education or the use made by employers of educational credentials as a selection
device signalling potential and the possession of social and cultural capital. (Brennan,
Durazzi & Séné, 2013, p.23).
In relation to this issue, Hall (2012) cites the argument in Alison Wolf’s book Does
Education Matter? (2002), suggesting that “a higher education qualification is increasingly a
‘positional good’ that has value for competitive success in the labour market rather than for
the inherent qualities that a university education confers.” (Hall, 2012, p.24). This
conception of HE as a positional good fits with the understanding that employability is
gaining importance as a desired outcome from HE. Undertaking further research in this area
would not only address a gap in knowledge but, by focusing on the drivers of graduate
employability more specifically, would also offer the potential to improve data collections on
HE outcomes.
Entrepreneurialism
Not every graduate will end up being employed by an existing company; some will become
entrepreneurs and set up their own businesses. Entrepreneurship skills are distinct from but
closely associated with management and leadership skills, according to a literature and
policy review by Hull University Business School carried out on behalf of BIS:
Entrepreneurship skills are associated with competence in the process of opportunity
identification (and/or creation), the ability to capitalise on identified opportunities and a
range of skills associated with developing and implementing business plans to enable
such opportunities to be realised. (Johnson, Snowden, Mukhuty, Fletcher & Williams,
2015, p.26)
A compendium of pedagogies for teaching entrepreneurship, Gibb & Price (2014) defines
entrepreneurship as the application of enterprising skills – “having an idea and making it

Page 25
happen”, and as a precondition for innovation (Gibb & Price, 2014, p.6). Key entrepreneurial
skills and behaviours include: opportunity-seeking, initiative-taking, ownership of and
commitment to enterprise development, networking capacity, strategic thinking, negotiation,
persuasion, and incremental risk-taking (Gibb & Price, 2014, p.14).
The literature review conducted by Johnson et al (2015) reports that there is limited
evidence for the impact of education on business performance, and that “entrepreneurship
skills appear to be only loosely related to factors such as the demographic or educational
background of the entrepreneur” (Johnson et al., 2015, p.20). This suggests that higher
education has little impact on entrepreneurship. On the other hand, there is evidence that
entrepreneurship skills can be taught/learned, and that some entrepreneurship skills – such
as opportunity recognition – are associated with educational attainment. The evidence
suggests that entrepreneurs prefer to develop these skills through experiential learning
rather than a conventional didactic approach (Johnson et al., 2015, p.20).
A survey of entrepreneurship in higher education reports that in 2012 the average number of
new ventures per HE provider in England was 35, an increase from 28 in 2010 (NCEE, 2012,
p.4). The creation of new ventures is a positive outcome not only for those entrepreneurial
graduates, but also for HE providers since businesses generate revenue. In addition, new
businesses support the growth of new jobs, and contribute to the national GDP and to the
competitiveness of the UK. Entrepreneurial activity and innovation in HE therefore achieve
good outcomes for wider society as well as for individual entrepreneurs.
Innovation is more important in some subject areas, such as science and engineering, and is
closely associated with research activity in HE. The HE white paper states that there is
“insufficient innovation” in current HE courses (BIS, 2016c, p.8), and that the new single
research and innovation body, UK Research and Innovation (UKRI), will be established to
address this issue and improve the effectiveness of the current funding system. Further
information on how HE providers benefit from these outcomes is presented in Chapter 4, in
the section on Research & Innovation.
Graduate Skills
HE is often marketed in terms of the opportunity to become more employable by developing
the skills that employers want, but we know that this also varies by HE provider and course.
For example, the HE White Paper notes that there is “considerable variation in employment
outcomes and employability amongst subjects and across institutions” (BIS, 2016c, p.42).
But there is a distinction to be made between employability skills (what employers want) and
graduate skills (what graduate offer). This point is made in two recent reports on education
and employment in science, technology, engineering and mathematics (STEM) subjects – a
review of graduate employment and accreditation in computer science (Shadbolt, 2016) and
a review of STEM degree provision and graduate employability (Wakeham, 2016). The
Wakeham review finds evidence that part of the problem is that
… graduates may be suffering from sub-optimal employment outcomes owing to a lack of
awareness and understanding about how the skills and knowledge they have developed
during their degrees relate and map onto the jobs market. (Wakeham, 2016, p.3.)

Page 26
A survey by the Institute of Directors sheds light on what employer’s perceive to be the skills
that graduates offer, finding that its members are impressed with graduates’ honesty,
integrity, ICT skills, reliability and ability to work as part of a team (IoD, 2007, p.3). But only
one of these is actually a skill; the others are behavioural attributes or attitudes. (For more
on employer’s lack of distinction between graduate skills and attributes, see Chapter 5:
Demand for Graduates.) That employers seek attitudes rather than skills is supported by
evidence from the CBI/Pearson (2015) education and skills survey. Based on responses from
over 300 organisations, it reports that
… businesses look first and foremost for graduates with the right attitudes and aptitudes
to enable them to be effective in the workplace – nearly nine in ten employers (89%)
value these above factors such as degree subject. (CBI/Pearson, 2015, p.8)
The largest gap between employer demand and graduate supply is the ability to meet
deadlines – 98% said it was important, but only 66% thought graduates demonstrated this
‘always’ or ‘often’ (IoD, 2007, p.3). A report on the annual survey by the Association of
Graduate Recruiters suggests that “difficulties with attracting the right talent with the right
mix of skills are on the increase” (AGR, 2015, p.6). Beyond the employers’ perspective,
however, these ‘employability skills’ are seen as a necessary but not sufficient condition for
employment in graduate occupations:
we see what are often classified as ‘employability skills’ as the most basic levels of
capabilities; prerequisites for, but not themselves constituting knowledge or skills at a
level of complexity that requires or constitutes appropriate material for tertiary education
curricula. (Elias & Purcell, 2013, p.3)
In contrast, the higher-level skills that HE develops are quite different:
In HE these higher-level skills are generally related to the creation, evaluation, use and
communication of knowledge: problem-solving, critical assessment of evidence, logical
thinking, theoretical development and creativity. (Elias & Purcell, 2013, p.3).
Indeed this accords with what the HE white paper says are the type of skills required for
building a ‘knowledge economy’: “the skills that higher education provides – the ability to
think critically and to assess and present evidence” (BIS, 2016c, p.5). The HECSU journal of
Graduate Market Trends points out that there is evidence that the UK is in a uniquely
difficult position compared with the rest of the EU, because jobs growth is highest in low-
skilled occupations, whereas in most EU countries high-skilled jobs growth is twice that of
low-skilled jobs (Davy, 2016, p.12). Along these lines, Futuretrack uses a set of knowledge-
based graduate skills – rather than ‘employability skills’ – as the basis for defining graduate
jobs. Similarly, the SOC(HE) 2010 classification (based on an earlier iterations SOC(HE) was
developed by evaluating jobs
…in terms of their use of the knowledge and high level skills acquired through higher
education, defined as ‘expertise’, the use of communication skills developed as a part of a
degree course and a component we term ‘orchestration of knowledge’ – the requirement
a job makes on the incumbent in terms of high level evidence evaluation and decision-
making skills which again form part of a course curriculum. The resulting classification
has enabled us to identify more sharply the distinction between graduate jobs (‘experts’,
‘communicators’ and ‘orchestrators), and non-graduate jobs. (Purcell et al., 2013, p.xvii)
Page 27
Further details on this classification are available in Futuretrack Working Paper 5 (Elias &
Purcell, 2013). Using this definition, the Office for National Statistics shows that amongst
recent graduates who are employed the proportion in non-graduate jobs has increased,
rising from 37 per cent in 2001 to 47 per cent in 2013 (ONS, 2013). The cause is unclear:
“This may reflect lower demand for graduate skills as well as an increased supply of
graduates.” (ONS, 2013, p.10). ONS analysis also shows that more Russell Group graduates
work in high-skilled occupations. This may be explained by the fact that Russell Group
courses have a higher proportion of profession-oriented degrees (such as medicine and
dentistry) and because higher entry requirements makes them more selective (ONS, 2013,
p.16). Therefore, differential outcomes from different types of HE provider are not always
directly related to the quality of provision.
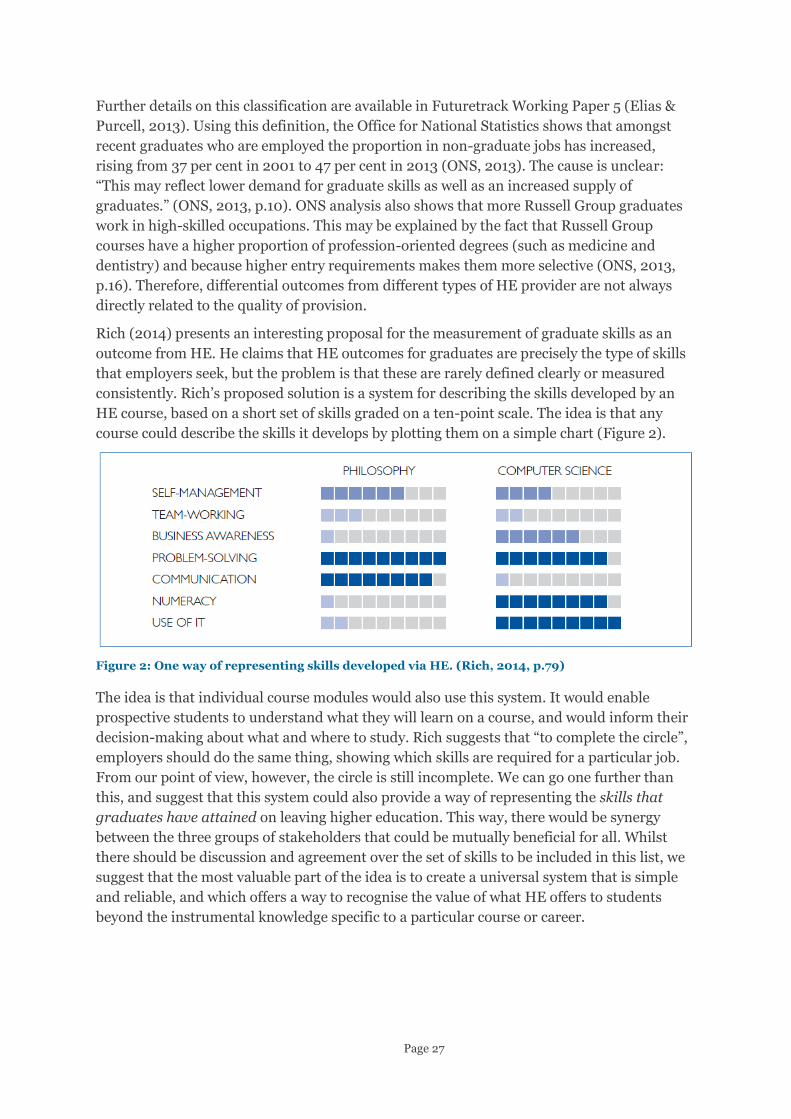
Rich (2014) presents an interesting proposal for the measurement of graduate skills as an
outcome from HE. He claims that HE outcomes for graduates are precisely the type of skills
that employers seek, but the problem is that these are rarely defined clearly or measured
consistently. Rich’s proposed solution is a system for describing the skills developed by an
HE course, based on a short set of skills graded on a ten-point scale. The idea is that any
course could describe the skills it develops by plotting them on a simple chart (Figure 2).
Figure 2: One way of representing skills developed via HE. (Rich, 2014, p.79)
The idea is that individual course modules would also use this system. It would enable
prospective students to understand what they will learn on a course, and would inform their
decision-making about what and where to study. Rich suggests that “to complete the circle”,
employers should do the same thing, showing which skills are required for a particular job.
From our point of view, however, the circle is still incomplete. We can go one further than
this, and suggest that this system could also provide a way of representing the skills that
graduates have attained on leaving higher education. This way, there would be synergy
between the three groups of stakeholders that could be mutually beneficial for all. Whilst
there should be discussion and agreement over the set of skills to be included in this list, we
suggest that the most valuable part of the idea is to create a universal system that is simple
and reliable, and which offers a way to recognise the value of what HE offers to students
beyond the instrumental knowledge specific to a particular course or career.

Page 28
HE as a Financial Investment
The Graduate Premium
One measure of the economic value of a degree is the ‘graduate premium’. This is the
economic advantage of an individual graduate compared with non-graduates who have a
secondary education (OECD, 2012). Graduates and postgraduates earn more than non-
graduates: Median salaries for non-graduates were £22,000 in 2015, compared with £31,500
for graduates and £39,000 for postgraduates (BIS, 2016c, p.11). Estimates of the graduate
premium vary, and appear to have fallen in recent years. Analysis based on data from the
Labour Force Survey estimates the mean net graduate premium at approximately £108,000,
which corresponds to a rate of return of 14.9% (Conlon & Patrigianui, 2011, p.12).13
The returns from HE vary with qualification, gender, and subject studied. The IFS has
undertaken the first study to take advantage of the new data-linking opportunity following
the SBEE Act 2015 (see section on HMRC and DWP Data in the previous chapter). The
analysis by Britton, Dearden, Shephard & Vignoles (2016) looks at graduate outcomes 10
years after graduation, linked with administrative tax records from HMRC. This leads to a
more refined analysis than has previously been possible, which is able to offer deeper
insights into the earnings by subject, institution, and socioeconomic background. The
analysis find that subjects such as Medicine, Economics, Law, Maths and Business deliver
substantial premiums over typical graduates, while other subjects such as Creative Arts
delivers earnings which are roughly typical of non-graduates. They also find that graduates
from richer backgrounds earn more than those from poorer backgrounds, even where they
studied the same degrees at the same institutions.
It is understood that the financial returns from HE vary with by institution and subject, and
that getting any degree is better than none at all. However, Kemp-King (2016) argues that
the graduate premium is generally over-estimated and has been eroding since the 2008
financial crisis. Because the graduate premium compares graduates with those who have two
A-levels, it misses out an intermediate group of people who take HNDs and diplomas and
who earn less than graduates but more than those with A-levels. Here, Kemp-King may have
identified one way to improve the data collection on HE outcomes.
Employment and wage returns to HE vary for different groups, as evidenced by a report for
the Joseph Rowntree Foundation (Tackey, Barnes & Khambhaita, 2011). The report includes
a useful table of data derived from Ramsey (2008), summarising the factors that affect
returns on a first degree. The table includes positive and negative factors, and shows which
factors correlate with ethnicity and gender (Figure 3).
13 The net graduate premium represents the present value of the benefits associated with an undergraduate degree relative to
an individual in possession of 2 or more GCE ‘A’ Levels (gross graduate premium) minus the present value of the costs
associated with acquiring a degree. These costs include the direct costs (such as tuition fees minus student support) and indirect
costs (such as foregone earnings). An equivalent figure can also be calculated for other qualifications. (Conlon & Patrigiani,
2011, p.9)

Page 29
Figure 3: Factors affecting return on first degree. (Tackey, Barnes & Khambhaita, 2011, p.10)
Return on Investment in HE
Participating in HE also involves direct costs – tuition fees, study resources and living costs.
Furthermore, time spent studying incurs what economists call ‘opportunity cost’ – the
amount of earnings that are forgone due to studying. These basic financial calculations are
necessary to estimate the return on investment in HE. In general economic terms, return on
investment (ROI) is the net benefit divided by the cost of the investment, where the net
benefit is the gain minus the cost:
return on investment = (gain from investment - cost of investment) / cost of investment
With regard to HE, ROI is earnings after graduation relative to the cost of attending HE.
Walker & Zhu (2013) simulate the predicted earnings (and employment status) of
individuals in their analysis of LFS and the British Household Panel Survey (BHPS) data to
produce estimates of net lifetime earnings. This analysis provides larger estimates than
previous studies.
Lifetime earnings net of tax and loan repayments, is large - in the order of £168k (£252k)
for men (women) on average. The social benefit to the government is also large (of the
order of £264k (£318k) from men (women) graduates – far in excess of likely exchequer
costs. (Walker & Zhu, 2013, p.5)
As Andrew McGettigan (2016a) notes, the cost of HE for an individual is not the total value
of student loans on graduation but the amount paid back over a lifetime. Conversely, the
cost of HE to governments is the reciprocal of this value – the amount of loans not paid pack.
It is only possible to estimate returns on average, and retrospectively, because neither the
costs nor the returns can be known beforehand. Similarly, opportunity cost is impossible to
state precisely because it involves a ‘counterfactual’ situation. For prospective students,
therefore, calculating their individual costs and returns is practically impossible – “There are
simply too many variables and anomalies” (Kemp-King, 2016, p.37). The only option is to
infer from data on graduate outcomes for previous cohorts (e.g. employment rate and
average earnings, by course and institution) but, as noted in the next section, this has risks.

Page 30
Behavioural Factors
In situations where rational judgement is impossible, behavioural psychology shows that
people adopt heuristics instead. Heuristics offer a rough-and-ready answer to such
challenges, but they tend to produce predictable errors and biases (Tversky & Kahneman,
1974). Behavioural studies of student decision-making show that “higher education is a
highly complex good with both the costs and outcomes subject to uncertainty, and accruing
over an extended period of time.” (Diamond, Jones, Vorley & Roberts, 2012, p.21). In
addition, there is evidence that HE is what economists call a ‘Veblen good’, whereby the
supply/demand model breaks down as preference for a product actually increases with price
(Vaidhyanathan, 2015). This happens because the price acts as an indicator of higher value
(Diamond et al., 2012, p.42). Evidence suggests that financial value is an important concept
for students and graduates, and that the marketisation of HE has engendered a consumerist
ethos in students which frames their expectations and perceptions of their HE experience
(Kandiko & Mawer, 2013). But the relative pricing of courses at different institutions is not a
determining factor in student choice: “there were no examples of cost being deployed as a
reason for choice of institution and the concept of a fees ‘market’ was almost entirely absent.”
(Kandiko & Mawer, 2013, p.22).
Because calculating individual returns on investment is practically impossible, and because
the only alternative is to use data aggregated at subject-level or institution-level, there is a
risk of what’s known as the ‘ecological fallacy’ (or ‘fallacy of division’) – that is, inferring
things about an individual based on data about a group.14 The desire to avoid this kind of
error is one important justification for the provision of individual-level data about student
outcomes (Coates & Mahat, 2014, p.21).
Research by YouGov (Adediran, 2015) reveals that whilst students take account of the costs
of university, they still value the education they receive above the cost of studying. But fewer
students now think that that going to university is essential for getting the career they want
(67% in 2015 compared with 81% in 2012). This research also shows the relative importance
of factors that affect the choice of where to study: course of study is the main factor (84%),
followed by institutional reputation (66%). As the level of fees has increased, so has its
importance in student choice, rising from 19% in 2012 to 23% in 2015. Although it remains a
secondary factor, its increasing significance appears to affect the importance of HE
outcomes:
Overall, this may suggest that the imposition of higher fees has made the cost of
education a higher priority and because of this the outcomes of education are also seen as
more important. (Adediran, 2015).
14 For example: If on average a group has a positive score, it would be fallacious to infer that an individual from that group is
more likely to have a positive score than a negative one (because there could be more individuals with negative scores in the
group – it just depends). If this doesn’t sound like a problem, consider the implications for data on crime and ethnicity: If data
says that 10% of a specific ethnic group commit criminal acts, it would be fallacious to say that any individual in that group has
a 1 in 10 chance of becoming a criminal (most people have a much lesser probability of committing a crime, some have much
higher probabilities).

Page 31
Debt
The calculation of financial returns to the investment in HE necessarily depends on its cost.
Most students bear this cost through the system of government-backed loans. This means
that one of the most significant outcomes of HE for today’s graduates is the burden of debt.
Because repayment is income-contingent, not everyone will repay the debt in full. The
difference is a cost borne by the government – the resourcing, accounting and budgeting or
RAB charge (see McGettigan, 2015 for a clear guide to the complex accounting and budgeting
of student loans). The average debt upon graduation for today’s students is £44,000
(Crawford & Jin, 2014). Therefore a ‘good’ outcome from HE could be the opportunity to
repay this debt by gaining a job that affords repayment, or to avoid repayment at all.
An IFS paper on impact of higher fees and loans says that in order for the new system not to
have a detrimental impact on participation, students from poorer backgrounds would need
to be well-informed and not debt-averse (Chowdry, Dearden, Goodman & Jin, 2012). Since
the students who have experienced the most recent hike in fees and loans have yet to
graduate, there is little evidence yet about the impact of this higher debt on the outcomes for
these students. What we do know is that “the switch from maintenance grants to
maintenance loans will result in substantially higher debt for the poorest students” (IFS,
2015). To date the evidence indicates that young participation in HE has not suffered from
the increase in fees and loans, although the picture is less positive in terms of mature and
part-time students.15
Social and Cultural Capital
Cultural Capital
Bourdieu’s (1986) sociological theory offers a number of useful ways of viewing outcomes
from HE that complement the idea of human capital (discussed in Chapter 5: Outcomes for
Employers). Bourdieu identifies three forms of capital:
Capital can present itself in three fundamental guises: as economic capital, which is
immediately and directly convertible into money and may be institutionalized in the
forms of property rights; as cultural capital, which is convertible, on certain
conditions, into economic capital and may be institutionalized in the forms of
educational qualifications; and as social capital, made up of social obligations
(‘connections’), which is convertible, in certain conditions, into economic capital and may
be institutionalized in the forms of a title of nobility (Bourdieu, 1986. Emphasis added)
Explicitly then, by these definitions, educational qualifications are a form of cultural
capital. But cultural capital manifests itself in three different ways:
Cultural capital can exist in three forms: in the embodied state, i.e., in the form of long-
lasting dispositions of the mind and body; in the objectified state, in the form of cultural
goods (pictures, books, dictionaries, instruments, machines, etc.), which are the trace or
realization of theories or critiques of these theories, problematics, etc.; and in the
15 See Independent Commission on Fees website: http://www.independentcommissionfees.org.uk/

Page 32
institutionalized state, a form of objectification which must be set apart because, as will
be seen in the case of educational qualifications, it confers entirely original properties on
the cultural capital which it is presumed to guarantee. (Bourdieu, 1986)
So, educational qualifications are an institutionalised form of cultural capital. Behavioural
economist David Halpern argues that there is a connection between cultural capital and good
outcomes for society: “communities with a good ‘stock’ of such ‘social capital’ are more likely
to benefit from lower crime figures, better health, higher educational achievement, and
better economic growth” (Halpern 2009b). Moreover, participation in HE generates wider
benefits than cultural capital, not only developing embodied capital (e.g. health benefits) but
also social capital (Vorhaus, Duckworth, Budge, & Feinstein, 2008).
Social Capital
Social capital is a concept that has becomes more widespread in the research literature, as it
has gained recognition as being an important outcome from education. For example, the
OECD is running a project on the measurement of social capital. The OECD defines social
capital as
networks together with shared norms, values and understandings that facilitate co-
operation within or among groups (OECD, 2007)
These networks can act either as: bonds e.g. between family, which are good for ‘getting by’;
as bridges between acquaintances and colleagues, good for ‘getting ahead’; or as links that
connect people at different levels in hierarchical structures (OECD, 2007, p.103). HE offers
students the opportunity to develop all three types of connection, depending on the extent to
which students and graduates engage in social participation, support networks, reciprocal
relations, and civic participation. But whilst higher education is widely acknowledged as
being an effective means of developing social capital, the way in which it does so is less than
clear (Miracle, 2013): “for some elements such as higher trust or better educational
achievement, there is debate whether they are outcomes or sources” (Harper, 2002, p.6).
Currently, very few metrics measure the contribution of HE to cultural and social capital. But
these are very important outcomes form HE, primarily for graduates, but also for employers,
because many of the employment characteristics that employers say they want to see in
graduates can be categorised as cultural or social capital. As such, there is potential for future
data collections in HE to measure these social and cultural outcomes from HE.
Habitus
Another aspect of Bourdieu’s (1984) social theory that helps us understand outcomes from
HE is the concept of habitus. It is somewhat more difficult to define than social and cultural
capital. Habitus describes the complex psychological dispositions of a social group, and it
reflects the context in which those dispositions have been developed. Habitus is therefore
both structural and processual; it is “a system of structured and structuring dispositions” as
well as the process by which those dispositions are acquired and generated (Smith, 2003,
p.464).
Sociologists working in the area of education, such as Reay, David & Ball (2005), argue that
HEPs have identifiable habituses that influence the decision-making, attainment and

Page 33
outcomes of a range of students including prospective and current HE students. In this
sense, habitus is like an institutional ethos; it shapes the sense of who and what staff and
students expect to be (Smith, 2003). Institutional habitus, therefore, has the potential to
influence who participates in HE and what outcomes they might expect to acquire. From the
point of view of a university vice-chancellor, for example, habitus is their “sense of the game”
– that is, an institutional “dance and struggle for their faculty and staff to win awards,
notability, athletic championships, Nobel prizes” (Vaidhyanathan, 2015). Such institutional
achievements are, of course, examples of cultural and social capital. They add value to not
only the institution, but also to the students and staff who take part. They are an important
way in which institutional habitus is accrued
Therefore, both social and institutional habitus shape the outcomes of HE for different
groups of graduates. This idea is valuable because it contributes to understanding student
choice and associated outcomes by offering an explanation for the way in which HE decision-
making behaviour is affected by the perceptions, aspirations and opportunities of the young
people within an institution’s sphere of influence.
Meaningful Work
Finding employment in a good job is the most important outcomes from HE for most
graduates. A good job, however, does not necessarily mean a high-paying job (Kandiko &
Mawer, 2012, p.24). So what does makes a job ‘good’? Evidence strongly suggests that what
matters most is finding work that is meaningful. This issue matters not least because a large
proportion of people think their job is meaningless – 37 per cent of British workers,
according to a recent YouGov survey (Dahlgreen, 2015). The latest British Social Attitudes
survey suggests that although more people are positive about their jobs than in the past, and
more would work even if they didn’t have to,
…there are also indicators that not everyone is finding work better than before – and
certainly not easier. In particular, people in routine and semi-routine occupations are
more likely to feel stress and less likely to have flexibility in the workplace than ten years
ago. This comes at a time when people in other occupations are more likely to feel they
have control over their working day. (NatCen, 2015)
The idea of meaningful work is nothing new. William Morris, the designer and socialist,
delivered a lecture on Useful Work versus Useless Toil in 1884. Morris understood that work
is necessary for survival, but he identified that “worthy” work involves three kinds of hope
that useless toil lacks: “hope of rest, hope of product, hope of pleasure in the work itself”
(Morris, 1993, pp.287–288).
Evidence from studies of the present-day labour market suggest that Morris’s intuitions were
correct. In a US study a survey was carried out at two different times (1973 and 1996), and
employees ranked the top 4 job characteristics. There was almost no change in the results: In
both surveys, the top-ranked job characteristic is “work is important and gives feelings of
accomplishment (intrinsic)”, i.e. work that is inherently meaningful. (Cascio, 2003, p.11).
After meaningfulness comes: 2) promotions, 3) income, 4) job security and 5) hours.
Recent research by Bailey & Madden (2016) identifies the characteristics of meaningful
work:

Page 34
1. Self-transcendent – work is meaningful when it matters to others, not just to self.
2. Poignant – meaningfulness is not just a sense of unalloyed joy, but is associated
with mixed, uncomfortable or even painful thoughts and feelings.
3. Episodic – work is never constantly meaningful, it comes in peaks and that cannot
be forced or managed, but these are usually memorable.
4. Reflective – meaningfulness is rarely experienced in the moment, but rather in
moments that afford retrospective reflection (such as this research).
5. Personal – meaningfulness is contextualised in personal life, and rarely features
organisations and management.
The need for meaningful work stems from “the evolution of social values as societies
becomes more advanced”, according to a report by The Work Foundation (Overell, 2008).
The expansion of HE increases the extent to which work is sought for identity-building
rather than as a means to an end. In an early vision of a knowledge economy, Drucker (1968)
argued that knowledge-based (i.e. graduate) work is not inherently more meaningful – this is
a point supported by Bailey & Madden’s (2016) evidence of meaningfulness across workers
in 10 different occupations (including retail assistants, priests, artists, lawyers, academics
and entrepreneurs). Rather, opportunities for meaningfulness may be diminished because
the greater choice in employment that HE affords leads to a greater prospect for
disenchantment (Overell, 2008, p.27).
The challenge in the context of HESA’s review is to define and operationalise the concept of
meaningful work in such a way that it can be measured either through a survey instrument
or analysis of secondary data. It would also be useful to explore what makes work meaningful
for graduates in particular.
Wellbeing & Satisfaction
Wellbeing
Participation in education appears to offer “a range of non-economic benefits that extend
beyond the classroom into personal life and into the community” (Feinstein, Hammond,
Woods, Preston & Bynner, 2003, p.iv). For example, graduates have better physical health
than the rest of the population. They are 70–80 per cent more likely to report ‘excellent’
health compared with similar individuals educated to level 2 or below (Bynner, Dolton,
Feinstein, Makepeace, Malmberg & Woods, 2003). Levels of obesity are lower than the
general population, are less likely to smoke and more likely to give up (Bynner et al., 2003).
Graduates have higher ratings of wellbeing in general, and lower occurrence and/or severity
of mental health issues such as depression (Bynner et al., 2003). Students, on the other
hand, are more likely to suffer mental health issues during the course of study: “On average,
attending higher education provides lifelong benefits, including better health, but the period
spent in higher education is a stressful and anxious time for many students.” (Neves &
Hillman, 2016, p.40). Students are notably more anxious than the general population,
caused by a combination of workload and worries about future careers.

Page 35
A large UK study based on 10,000 participants, finds that adult learning has positive effects
on a wide spectrum of health and social outcomes. The study reports statistically significant
effects for seven different outcomes.
These outcomes are changes in exercise taken, life satisfaction, race tolerance,
authoritarian attitudes, political interest, number of memberships, and voting behaviour.
(Feinstein, Hammond, Woods, Preston & Bynner, 2003)
However, the challenge for using this type of evidence as measures of HE outcomes, is that it
generally fails to attribute the differential benefits observed to HE. As Brennan, Durazzi and
Sene (2013) point out:
those who receive [HE] differ from those who don’t on many dimensions. Thus, in
viewing the literature on the differences between graduates and non-graduates,
the classic problem of distinguishing input factors from process factors remains.
The same is true of the literature on the broader effects of higher education. The
processes by which effects, intended and unintended, are achieved are often far
from clear. (Brennan, Durazzi and Sene, 2013, p.23)
In other words, we cannot easily tell whether improved health and wellbeing associated with
being a graduate is as a result of the HE experience, or some other factor that means
healthier people are more likely to participate in HE in the first place. This relates to the
broader issue of being able to establish which outcomes can be attributed to HE and which
are merely factors associated with the student intake. The problem is that “While there is
much evidence of impact, our understanding of the processes through which impact occurs is
more limited” (Brennan, Durazzi and Sene, 2013, pp.23–24). The work of HEFCE and the
UK Performance Indicators Steering Group (UKPISG) is focused on this issue, undertaking
to dissociate the effects of HE from associated factors, and disaggregating the relationship
between HE and its beneficial outcomes. UKPISG is seeking to establish indicators that
control for known characteristics (ethnicity, age, socioeconomic status, study mode, subject,
institutional entry tariff, etc.) and which are benchmarked/normalised for comparison
between institutions.16
In a report for QAA, Steuer & Marks (2008) argue that current approaches to quality are too
narrow, focusing on economic impacts and the interests of a narrow range of stakeholders.
Instead they suggest that the purpose of HE should be reconceptualised as transforming and
enhancing personal and collective wellbeing. They relate this to the fact that national
economic growth and increases in individual income do not lead to an inexorable rise in
wellbeing. They present an alternative vision of ‘graduateness’ made up of “seven things
every graduate should know if higher education is to be effective in fulfilling a transformative
role for individuals and for the world around them” (Steuer & Marks, 2008, p.13):
In-depth knowledge of favourite subject
How to apply knowledge
What makes a good life
16 http://www.hefce.ac.uk/data/ukpi/ukpisg/

Page 36
How others think
How change happens
The dynamics of power and influence
Global interdependence
Steuer & Marks (2008, pp.20–26) also suggest a number of “quality marks” (desirable
outcomes) that represent the “transformative, well-being dimensions of quality in higher
education”, and they outline how these could be measured. For data collection in HE,
building a better picture of wellbeing would seem to be an important area in improving
understanding of outcomes for graduates.
Satisfaction
Satisfaction is arguably not an outcome from HE, but as a metric based on graduates’
opinions it is relevant to this review. Satisfaction with the HE experience correlates with
prior expectations being met (Neves & Hillman, 2016, p.9). It therefore provides a
potentially useful proxy indicator for the extent to which graduates feel they have achieved
their desired outcomes from HE.
The HE white paper claims that “Many students are dissatisfied with the provision they
receive, with over 60 per cent of students feeling that all or some elements of their course are
worse than expected and a third of these attributing this to concerns with teaching quality”
(BIS, 2016c, p.8). But this claim is misleading, for two reasons: First, it is based on data from
the 2015 Student Academic Experience Survey, which shows that 28% are ‘very satisfied’ and
59% ‘fairly satisfied’ – a total of 87% satisfied (Buckley, Soilemetzidis & Hillman, 2015, p.10).
Second, amongst those students who feel that their course is worse than expected, the top
reason (chosen by 36% of these respondents) is the lack of effort they have put in. “This is an
important corrective to any sense that students see themselves as passive consumers; they
are aware that the quality of their experience depends on the efforts both of themselves and
their institution.” (Buckley, Soilemetzidis & Hillman, 2015, p.5).
Other surveys report similar figures: the 2016 Student Academic Experience Survey (Neves
& Hillman, 2016), a report on the TEF (HoC BIS Committee, 2016), and the National
Student Survey (HEFCE, 2016c) all report an overall satisfaction rate of 86%. So, the
evidence is consistent in regard to measures of student satisfaction. The ONS review of data
sources for TEF shows that NSS overall satisfaction ratings are clumped together: “For the
main body of institutions in the middle […], there does not appear to be any significant
difference in the outcomes” (ONS, 2016a, p.14). In summary, satisfaction ratings appear to
be consistent (and of course it is a good thing that most student are satisfied overall), but this
consistency is an issue for HE outcomes metrics, such as TEF, to the extent that it may not
allow sufficient differentiation between institutions.
Net Promoter Score
To what extent would you recommend XXX to a friend or colleague? In market research,
this is regarded as the ‘ultimate question’ for gauging customer satisfaction because it has
the strongest correlation with revenue growth (Reichheld, 2011). Based on a quantitative
response to that question on a scale from 0 to 10, this approach divides customers into three

Page 37
groups: ‘promoters’ (those who score 9–10), ‘passives’ (score 7–8) and ‘detractors’ (0–6).
The Net Promoter Score (NPS) score is then calculated as the proportion of promoters minus
the proportion of detractors: NPS = P% - D%.
This measure of consumer satisfaction is applicable to HE, as evidenced by the work of
YouthSight, who conduct the Student Academic Experience Survey on behalf of HEPI-HEA.
YouthSight (2013) undertook a study to compare the NPS of every HE provider in the UK,
based on the views of full-time undergraduates gathered in the Higher Expectations survey.17
The results show that HE generally scores quite highly overall, but there is a wide range of
scores, with institutions rated from -24 to +81. Looking at institutions by mission group, the
Russell Group scores highest, followed by 1994 group, University Alliance, and Million+. The
NPS appears to offer a simpler alternative to the more detailed and numerous questions that
make up similar HE satisfaction surveys. The wide variation in NPS scores compared with
the results of the National Student Survey, for example, suggest that the former approach
may be potentially more useful for differentiating between different institutions. This would
require further research to assess the potential for such a measure.
Summary
Employment rates and proportion of graduates in high-skilled or graduate jobs are key
outcomes of HE. However, the main desired outcome for students is not necessarily
employment in a specific job but improving their employability and career options more
generally. One way in which we might measure good HE outcomes, therefore, is through the
extent to which graduates have obtained the skills and knowledge that make them more
employable. A common approach to measuring skills could be developed to show both the
extent to which graduates on different courses develop different types of skills and the type
and level of skills required for different jobs. Any such measure should go beyond the
instrumental knowledge of a particular subject or career and include the higher-level skills
required for a knowledge-economy and the more generic skills that employers want. The
extent to which students engage in activities known to boost employability is also possible
way to measure outcomes – these activities include work experience, extra-curricular
activities and international experience. Access to these experiences tends to vary by socio-
economic background so this also needs to be taken into account.
HE can be a substantial investment for graduates and financial return is one way to measure
outcomes. However, it is only possible to calculate returns on average and retrospectively.
Evidence suggests financial value is important for students and graduates but that they value
education above this. While finding a good job is the most important outcome from HE for
most students, a good job does not necessarily mean a high-paying one.
Graduates also experience enhanced health and wellbeing. However, the evidence fails to
attribute these benefits to the HE experience and understanding of how HE generates such
impacts is limited.
Graduate satisfaction, while not an outcome from HE, is another way to consider measuring
the impact of HE as it relates to the extent to which the HE experience has met students’
17 http://www.youthsight.com/expertise/higher-education-research/higher-expections/

Page 38
expectations. Current statistics on satisfaction do not provide much differentiation between
institutions. One option would be to consider using Net Promoter Scores as an alternative
indication of satisfaction.
Table 1 provides a summary of the outcomes from HE for students and graduates discussed
in this chapter.
For Students and Graduates
Knowledge Subject specific, instrumental knowledge
General knowledge
Employment Employment in high-skilled or graduate roles
Meaningful work
Financial Higher earnings / graduate premium
Return on investment
Employability Occupation specific skills
Higher level skills
Personal
attributes
Social capital – networks that support and sustain
Cultural capital – HE qualification itself and attitudes/dispositions
Wellbeing Better health and wellbeing
Table 1: Overview of good outcomes from HE for students and graduates

Page 39
04. Outcomes for Higher Education Providers
Here we consider outcomes from HE that benefit providers. This includes the graduates themselves and their role in supporting and building the reputation of HE institutions, as well as the learning and skills that they gain. We consider different ways of measuring what HE providers offer to students in terms of skills development, and how the data generated by students could be used by providers. Another important outcome from higher education is research and innovation.
Graduates
It is almost so obvious that it could be missed, but the primary outcome for HE providers is
the achievement of graduates. Successful graduation depends not just on completion of a
course, but also on successful recruitment and retention. Graduation therefore represents
the culmination of a series of achievements by both institutions and individuals.
Students and graduates are assets for HE providers. Under the current UK HE policy,
students fund providers through the payment of tuition fees via the loan system. Income
from tuition fees paid by international students is an increasingly important source of
revenue for UK HE providers. Research by BIS (2011, p.9) estimates that the value of UK HE
exports was worth over £7 billion to the national economy in 2008/09, including £2.4 billion
from tuition fees from international students. BIS estimate that the value of international
education will continue to increase in future.
Students and graduates may act as ambassadors for the institution, for example during open
days and fresher’s week, or as part of outreach to widen participation. Students may also be
employed as peer mentors, where they offer advice and guidance on student skills such as
academic writing and statistical analysis. A research project by the University of Lincoln
called Student as Producer investigated how undergraduates could work with academics in
the design and delivery of their courses.18 The report illustrates how students and providers
can benefit from research-engaged teaching and learning, by highlighting the skills that are
developed from this type of participatory activity (Neary, Saunders, Hagyard & Derricot,
2015). The findings informed Lincoln’s current approach to teaching and learning, which
illustrates one more way in which institutions can benefit from their students.
After graduation, alumni benefit providers by raising the profile of institutions and by
contributing to fund-raising. This type of activity helps to build institutional reputation and
attract more students, sustaining the HE lifecycle. Evidence suggests that personal accounts
from friends and family are amongst the greatest influences on decisions about whether to
enter HE, and about where and what to study (Diamond et al., 2014). Therefore, graduates’
experiences – especially those that they recount to others – are an important element of
outcomes for HE providers in terms of building/maintaining institutional reputation and
ensuring institutional sustainability.
18 http://studentasproducer.lincoln.ac.uk/

Page 40
Teaching & Learning
Higher education providers are essentially facilitators of learning, and there are a number of
ways in which we might consider measuring the learning outcomes of HE. Here we discuss
three forms of data collection that relates to learning in HE: data about learning-related
activities (learning analytics), and data that measures learning itself – what is learned
(learning outcomes – qualitative) and how much is learned (learning gain – quantitative).
Learning Analytics
Learning analytics refers to the collection and analysis of data about progress in learning and
the context in which that learning occurs (Sclater, Peasgood & Mullan, 2016, p.4). This type
of data is a valuable outcome to HEPs because it is a rich resource for informing operations
and management of institutional services and systems. Evidence from case studies by Jisc19
suggests that it is mainly used “As a tool for assessing and acting upon differential outcomes
among the student population” (Sclater, et al., 2016, p.5). HE providers may also make data
available to students to support their own learning. The National Union of Students suggest
it could be used more widely and better:
This has massive power and potential to tackle some of the problems and challenges that
currently exist in UK higher education, such as avoiding unnecessary drop-outs, student
demotivation, reducing the number of exam resits, enabling more reflective learning and
engagement, and reducing inequalities such as the BME attainment gap. (NUS, 2016).
Learning analytics makes use of ‘big data’. It involves collecting data en masse from the
‘digital footprint’ of students’ activity, via their use of library systems, virtual learning
environments and other student information systems. Jisc is developing a national learning
analytics service for the HE sector, currently being piloted, which offers the potential to feed
into the forthcoming TEF. Even though learning analytics mainly relates to activity during
study rather than outcomes from HE, it offers some potential benefits for improving the
student experience and thereby indirectly improving outcomes:
Learning analytics has the potential to transform the way we measure impact and
outcomes in learning environments – enabling providers to develop new ways of
achieving excellence in teaching and learning, and providing students with new
information to make the best choices about their education. The UK should grasp this
opportunity to lead the world in the development and use of learning analytics. (Sclater,
Peasgood & Mullan, 2016, p.11).
The potential for learning analytics to transform outcomes from HE is explored in a recent
report by the Higher Education Commission, From Bricks to Clicks (Shacklock, 2016). The
report offers advice on how to use the ‘data footprint’ that students leave behind throughout
the course of their studies, and suggests how to design learning analytics systems to better
understand and support student learning. By doing so, learning analytics can help reduce
drop-out, improve feedback and enhance teaching and learning. Beyond complying with the
relevant legal requirements such as the Data Protection Act, From Bricks to Clicks
19 Jisc is a not-for-profit organisation for digital services and solutions for UK higher education, further education and skills
sectors.

Page 41
recommends ways in which HE providers can design systems with students’ input and
informed consent. Adopting this type of approach helps to address issues of ethics and
privacy in relation to student data. By reviewing their data collection systems, HEPs can
reduce the workload and also be better prepared for contributing to external data collections
such as DLHE and TEF. The report also includes some specific comments on HESA’s
reformed data collection process, drawing from the Data Futures Programme.20 The one
limitation of this useful report is the fact that it focuses on data about activity during study
rather than the outcomes of that study. But overall, the report is a timely and useful
contribution to the literature that can support HESA’s review of data collection procedures.
Learning Outcomes
The term ‘learning outcomes’ has two different meanings in the context of HE: It may refer
to a measurement of what students actually learn, or to what students are expected to learn
(Aamodt & Hovdhaugen, 2008, p.2). HEPs write the latter type of learning outcomes for
courses/modules, usually matched with course aims and objectives. Therefore, learning
outcomes represent the core educational output of an HEP’s offer to students (alongside
study support, pastoral care, accommodation, etc.). As such, learning outcomes represent
subject-specific knowledge (that is, instrumental or working knowledge which relates to an
occupation).
Bloom’s (1956) taxonomy provides a way of specifying learning outcomes. It is more often
used in primary and secondary than in HE, as earlier years’ education aims at delivering a
broad education whereas HE is focused on a more specific type of learning. However, it
provides a useful way to think about outcomes. It specifies three domains of learning:
cognitive (mental), affective (emotional) and psychomotor (physical). This set of outcomes is
also referred to as knowledge, skills and attitude (KSA).
Measurement of learning outcomes at an international level is part of a major research
project by the OECD – Assessment of Higher Education Learning Outcomes (AHELO). The
programme aims to develop a global measure of student outcomes – what they know and can
do on graduation - offering the potential for HEIs to benchmark their students’
achievements with other institutions across OECD member nations.
An initial feasibility study was completed in 2012. This developed assessments of generic
skills and discipline specific knowledge and skills in the fields of economics and engineering.
Contextual data on students, faculties and institutions was also collected through surveys.
The feasibility report concluded that it was possible to develop assessment instruments that
produced reliable and valid results across countries, languages, cultures and institutions
(OECD, 2013). However, concerns have been expressed about the endeavour, including
whether the results will be used for to rank institutions, and the difficulties inherent in
making appropriate comparisons between potentially highly diverse institutions.
Learning Gain
Learning outcomes focus attention at the output, at the end of a period of learning (McGrath
et al., 2015). Learning gain as a metric broadens this type of measurement. Instead of
20 https://www.hesa.ac.uk/datafutures

Page 42
measuring what is learned, learning gain focuses on how much is learned (usually between
two points in time). Definitions vary considerably, sometimes focusing only on gains in
knowledge, whilst others also include skills and work-readiness. The potential application of
learning gain metric to HE has been considered by BIS, HEFCE and the HEA. For example,
these measures are discussed in HEFCE’s latest proposals for quality assessment,21 and in
the HE Green Paper’s proposals for TEF:
A key focus of TEF should be the educational and employment outcomes of higher
education, and the gains made by students from different backgrounds. We will consult
on criteria in the technical consultation but purely as an example of what might be
considered, we could look at criteria such as:
• Students’ knowledge, skills and career readiness are enhanced by their education.
• All students receive effective support in order to achieve their educational and
professional goals and potential.
• Students get added value from their studies. (BIS, 2015a, pp.32–33).
HEFCE have recently been exploring learning gain metrics and methodologies as a way to
capture the ways students benefit from HE. An initial report from RAND Europe (McGrath
et al., 2015) explores different ways of measuring learning gain. Learning gain is
conceptualised here as ‘distance travelled’ or ‘the difference between the skills,
competencies, content knowledge and personal development demonstrated by students at
two points in time.’ The report identified 14 methods, within 5 broad groups, to measure
learning gain. The groups are:
Grades
Surveys
Standardised tests
Mixed methods
Other qualitative methods.
HEFCE are currently running a programme of activities, including funding 13 pilot projects
to test and evaluate these different approaches to measuring learning gain.22
The concept of value-added is a similar, but slightly different measure. Whereas learning
gain measures to the difference in performance between two points, value-added measures
the difference between performance predicted at the start and actual performance achieved
(McGrath et al., 2015). Whilst measures of learning gain potentially offers HE providers a
new diagnostic tool for institutional improvement (Douglas, Thompson & Zhao, 2012), they
can also be unreliable especially when self-reported (Porter, 2012).
21 http://www.hefce.ac.uk/reg/review/
22 http://www.hefce.ac.uk/lt/lg/projects/

Page 43
Research & Innovation
UK society doesn’t just benefit from the teaching function of HE but also from its research
and innovation activity. The distinction between the two is that research (i.e. the generation
of knowledge) provides the foundations for innovation (which applies research knowledge to
the development of new products, services and organisations). In the review of UK Research
Councils, Sir Paul Nurse (2015) argues that “for advanced nations such as the UK to prosper
as knowledge economies, scientific research is essential – both to produce that knowledge
and also the skills and people to use it.”
The research component of HE contributes in various ways to the UK’s economy, culture,
society and wellbeing. Most directly, it impacts on the local labour market as HE providers
employ researchers, technicians and administrative staff. More broadly, research activity
creates national and international links both between universities and through their
collaboration with business. According to the World Economic Forum, the UK ranks fourth
in the world for university-industry collaboration in research and development.23 But
research also has value even when it does not generate instrumental knowledge; it enriches
the culture of the UK and embodies the pursuit of knowledge for its own sake.
The system by which the quality of research is measured is the Research Excellence
Framework (REF).24 As a source of data collection on HE outcomes, REF plays an important
part in “showing the outcomes of public investment in research and making the case for
future investment” (Stern, 2016, p.8). REF data also serves to inform strategic decisions on
resource allocation for HE providers and the government. The aim of REF’s measure of
research ‘impact’ is to measure how universities benefit “the economy, society, culture,
policy, health, the environment and quality of life” (HEFCE, 2016b). HEFCE’s database of
REF impact case studies provides a rich source of data on the ways in which the HE research
outcomes benefit individuals and organisations outside academia. However, there is debate
over the suitability of the REF methodology, and concern about the cost and burden of data
collection on HE providers.
Innovation in UK HE providers is mainly concentrated in those institutions that excel in
research activity. But business-university collaborations are also an important part of further
education and vocational education, especially where these involve apprenticeships. One
new area currently in development is degree apprenticeships.25 Whereas there is a historical
divide between academic and vocational education that may make it difficult to combine or
switch between the two, degree apprenticeships offer the best of both worlds – combining a
bachelor’s or master’s qualification with hands-on, paid work experience (UUK, 2016). For
students, degree apprenticeships offer a way to improve employability. For HE providers,
degree apprenticeships also offer an important stream of income in the context of the
government’s commitment to create 3 million new apprenticeships by 2020.
The total value of knowledge exchange between UK universities and business is estimated to
be £4.2 billion in 2014-15 (HEFCE, 2016d, p.14). This collaborative activity offers a range of
23 http://reports.weforum.org/global-competitiveness-report-2014-2015/rankings/
24 http://www.ref.ac.uk/
25 http://www.hefce.ac.uk/kess/apprentice/faq/
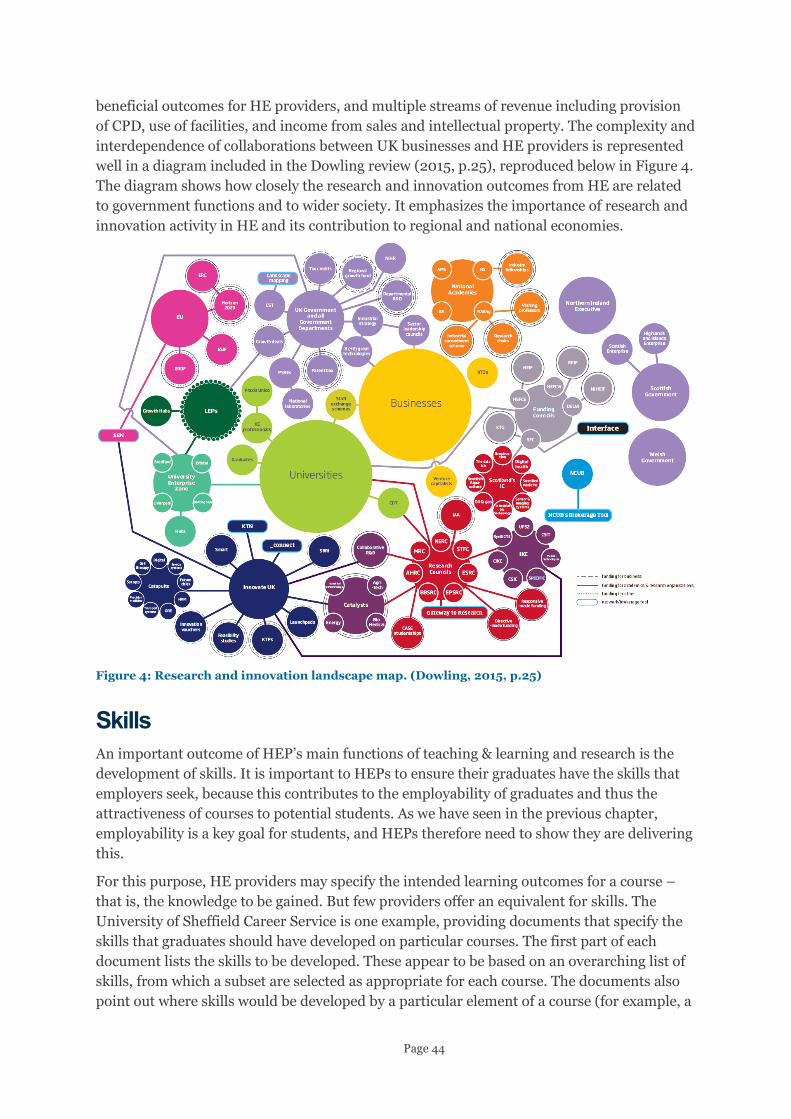
Page 44
beneficial outcomes for HE providers, and multiple streams of revenue including provision
of CPD, use of facilities, and income from sales and intellectual property. The complexity and
interdependence of collaborations between UK businesses and HE providers is represented
well in a diagram included in the Dowling review (2015, p.25), reproduced below in Figure 4.
The diagram shows how closely the research and innovation outcomes from HE are related
to government functions and to wider society. It emphasizes the importance of research and
innovation activity in HE and its contribution to regional and national economies.
Figure 4: Research and innovation landscape map. (Dowling, 2015, p.25)
Skills
An important outcome of HEP’s main functions of teaching & learning and research is the
development of skills. It is important to HEPs to ensure their graduates have the skills that
employers seek, because this contributes to the employability of graduates and thus the
attractiveness of courses to potential students. As we have seen in the previous chapter,
employability is a key goal for students, and HEPs therefore need to show they are delivering
this.
For this purpose, HE providers may specify the intended learning outcomes for a course –
that is, the knowledge to be gained. But few providers offer an equivalent for skills. The
University of Sheffield Career Service is one example, providing documents that specify the
skills that graduates should have developed on particular courses. The first part of each
document lists the skills to be developed. These appear to be based on an overarching list of
skills, from which a subset are selected as appropriate for each course. The documents also
point out where skills would be developed by a particular element of a course (for example, a

Page 45
placement in industry). The second part of the documents all have the same information,
drawn from the Institute of Directors Skills Briefing (IoD, 2007), which lists the top ten
graduate employability skills by their importance to employers (for the full list, see Chapter
3: Employment and Employability). Table 2 compiles some examples of the types of skills
developed by different disciplines at the University of Sheffield. This approach partly
achieves what Rich (2014) suggests could improve information on HE outcomes, but lacks
quantified measurement of the extent to which these skills are actually developed and used.
Chemistry Architecture Mechanical Engineering
Analytical Autonomous Working Autonomous Working/Time
management
Commercial Awareness Communication skills Commercial Awareness
Creativity & Innovation Creativity and innovation Communication
Data Collection &
interpretation Critiquing skills Creativity
Decision making Design skills Design
IT skills Influencing skills Information processing
Numerical ability Intellectual/analytical and
problem-solving skills Investigative and Experimental
Organisational ability Interpersonal skills I.T.
Project management IT literacy Numerical
Research skills Presentation skills Problem solving
Risk assessment Professional awareness Planning and Decision Making
Technical skills Research Team Working
Spatial awareness
Team work
Time management
Table 2: Skills developed by various disciplines. (University of Sheffield, 2008)
Summary
Graduates are an obvious outcome for providers of HE. They contribute to building the
providers’ reputation and act as ambassadors and peer mentors. HE providers are also
important sources of research, creating new knowledge which benefits the economy, society,
culture and wellbeing.
Students increasingly leave digital footprints throughout their time in higher education. This
provides a valuable resource for better understanding student learning and can be used to
enhance teaching and the student experience. While this will impact on student outcomes,
the focus is on data collected during rather than after HE.
Learning outcomes represent providers’ core offer to students. One way of thinking about
learning outcomes is to consider three ‘domains of learning’: knowledge, skills and attitudes
(Bloom’s taxonomy). The OECD AHELO study aims to develop global measure of student
outcomes – what they know and can do on graduation. However there are difficulties
inherent in making comparisons between potentially highly diverse institutions with varied

Page 46
intakes of students. One way to address some of these difficulties could be through
measuring learning gain (how much is learned between two points in time) and/or added-
value (how much is learned in comparison to what was predicted at the start). Measures of
learning gain might focus purely on knowledge or include skills and work-readiness too. It is
important for providers to ensure their graduates have the skills that will improve their
employability as this is likely to enhance the attractiveness of courses to potential students.
The key outcomes for providers of HE as described in this chapter are summarised in Table 3
below.
For Higher Education Providers
Graduates Ambassadors
Providers of peer support
Fundraising
Enhance provider profile and reputation
Research &
Innovation Knowledge, impact, reputation
Business-university collaboration
Learning Learning outcomes – knowledge, skills, attitudes
Learning gain – knowledge, skills, work-readiness
Added value
Skills Occupation / subject specific
Higher-level skills
Table 3: Overview of good outcomes from HE for Higher Education Providers.

Page 47
05. Outcomes for Employers
This chapter considers outcomes from HE from the employer perspective. It begins with demand for graduate skills and examines the possible mismatch between the skills graduates develop and what employers say they want. We then go on to explore the concerns with over-education and under-employment. The chapter concludes with a section on the concept of human capital and what this can offer in terms of a way of measuring HE outcomes.
Demand for Graduates
HE is often referred to as a key driver of the knowledge economy. The HE white paper states
that “employers in some of our most internationally competitive industries rely on graduates
to power their continued growth. […] However the outcomes that we observe from English
higher education are not consistently strong.” (BIS, 2016c, p.42). As Chapter 3 identified, the
skills that employers want from graduates are not necessarily the same as what students say
they want or what graduates actually develop. Part of the problem is
That it’s all a bit of a mystery. There is this vague quality ‘graduateness’ that recruiters
say they look for. And, of course, there’s always the possibility that universities aren’t
actually adding that quality, just admitting the students who’ve already got it. (Rich,
2014, p.76)
The Institute of Directors (IoD) carried out a survey of 500 directors in 2007, identifying the
graduate employability skills that employers demand. 90 per cent of IoD members believed
that the education system should do more to prepare young people for work. Even so, most
(71%) were satisfied with the quality of graduates they employed, and only a minority (12%)
were dissatisfied (IoD, 2007). 64 per cent said that graduates’ generic employability skills
were more important than the specific knowledge and skills associated with their degree. In
summary, the top ten graduate employability skills are:
1. honesty and integrity
2. basic literacy skills
3. basic oral communication skills (e.g. telephone skills)
4. reliability
5. being hardworking and having a good work ethic
6. numeracy skills
7. a positive, ‘can do’ attitude
8. punctuality
9. the ability to meet deadlines, and
10. team working and co-operation skills. (IoD, 2007, p.2)
However, this ranked list is derived from a longer list of 28 skills, all of which were rated by
more than 70 per cent of respondents as ‘quite important’ or ‘very important’ (IoD, 2007,
p.2). This suggests that the rank order of this list has little importance in identifying
outcomes from HE that matter to employers. In addition, there is not much difference
between the skills that employers want from graduates and the wider workforce. For

Page 48
example, Nesta (2016) recently published a chart of the skills most frequently sought by UK
employers. It uses data from Burning Glass,26 using a new approach that ‘scrapes’ data from
online job advertisements and classified them with the SOC system. Across all occupations,
the top skills are communication, planning, customer service, project management and
writing. They also identify skills in greatest demand within digital tech and creative
occupations, with the former including lots of specific software skills and the latter placing
greater emphasis on creativity. The advantage of this new approach is that it is based on a
large set of data with wide coverage. It doesn’t show skills shortages, however, and
presenting the results by rank order tells us less about the relative demand between skills
than a quantitative measurement scale could. But this kind of analysis could be a valuable
tool in measuring the rapidly-changing graduate labour market.
In addition to ‘graduate skills’, employers often call for ‘21st century skills’. These are the
skills that serve the needs of a “knowledge economy” in which higher education is a key
export sector (BIS, 2016c, p.8). For example, a report on the employability of graduates by
the European Commission lists the following as 21st century skills: communication in native
and foreign languages, mathematical and scientific competency, digital competency, self-
directed learning, social and civic competence, entrepreneurship, and cultural awareness and
expression (Humburg, van der Velden & Verhagen, 2013, p.3). Other studies of employers
agree on a broader categorisation of skills, such as creativity, critical thinking, organisation,
professionalism and social skills. These are ‘soft’ generic and transferrable skills rather than
‘hard’ subject-specific, cognitive skills. Christodoulou (2012) argues that so-called ‘21st
century skills’ aren’t new, and they provide (or should provide) the basis for any
comprehensive education:
To the extent that it [21st century skills] says that creativity and problem solving are
important, it is merely banal and meaningless; to the extent that it says such skills are
unique to the 21st century, it is false but harmless; to the extent that it proposes certain
ways of achieving these aims, it is actually pernicious. (Christodoulou, 2012)
Despite the continuing expansion of HE and more graduates entering the labour market than
ever before, employers increasingly voice concerns about graduates’ lack of employability,
frequently conceptualised as a “skills gap”.27 However, a US review of reports and other
evidence for the graduate ‘skills gap’ suggests that there is less of a problem than employers
often make out: “The real issue” argues Cappelli (2014a), “is that employers’ expectations
[…] have grown increasingly out of step with reality”. Cappelli (2014b) identifies three
variants of the argument: skills gap (a shortfall in basic skills), skills shortage (shortages in
specific occupations, like engineering or IT), and skills mismatch (over-supply or under-
supply more generally). The problem is that all three arguments are predicated on analogy
with supply-chain models (where matching input and output really matters), whereas most
26 http://burning-glass.com/
27 http://wonkhe.com/blogs/comment-skills-deficit/

Page 49
economics-based models of employment do not depend on the concept of skills shortages,
which are understood to occur only in cases of market failure (Cappelli, 2014b, p.254).28
In other words, the complaint is really that companies are having trouble finding
applicants at all career levels with the right work history, rather than not having enough
recent graduates with the skills to be hired. (Cappelli, 2014b)
Similarly, the economist Paul Krugman (2014) dismisses the “skills myth” on the basis of
lack of evidence. Krugman also notes that it has the effect of focusing attention away from
larger structural problems with the economy.
As identified in a recent report by the Social Mobility & Child Poverty Commission (2015),
professional jobs in ‘elite’ firms tend to be dominated by people from privileged
socioeconomic backgrounds. The report finds that these elite law and accountancy firms
recruit from a pool heavily dominated by affluent applicants, and that selection is based on
judgements of ‘talent’ defined in terms of personal attributes that are strongly associated
with middle-class status: drive, resilience, communication skills, confidence and ‘polish’. In
some cases, this lack of social mobility can happen when employers conflate skills and
attributes – saying that they want particular sets of skills but actually recruiting on the basis
of particular attributes. One recent strategy to avoid this bias is to introduce name-blind
recruitment and contextualised screening (Bridge Group, 2016). Given the difficulty of
separating social attributes from graduate skills, a similar contextualization of graduate
characteristics may be one solution to addressing this issue in HE data collection.
Use of Graduate Skills
Expressions of concern about over-education (and/or its complement, underemployment)
arise periodically, based on the expansion of HE and as more people become graduates. The
claim is that the number of high-skilled jobs does not match the increasing number of
graduates, sometimes expressed as a “waste” of resources invested in education (e.g. CIPD,
2015). The CIPD Chief Executive claims that “Simply increasing the qualification level of
individuals going into a job does not typically result in the skill required to do the job being
enhanced”.29 However, it not clear for whom this is a problem, given that (as this literature
review shows) HE offers clear benefits for the individual and society overall. Moreover,
better ways of measuring the skills that graduate have and especially the skills they use in the
workplace are needed in order to gain a better understanding of this issue. Existing measures
of over-education have issues because:
First, they tend to reflect what employers say they need, not what is actually required to
do the job. Second, “qualification inflation”, whereby employers upgrade the educational
requirements of the job but do not change their content, will lead to underestimates of
the incidence of true overeducation. Finally, some jobs have become more complex over
28 The key point here is that employers’ diagnosis of so-called ‘skills shortages’ are based on their experience of recruitment
issues. In short, there is a difference between recruitment difficulties and skills shortages. To properly identify measure skill
shortage
29 https://www.cipd.co.uk/pressoffice/press-releases/overqualification-190815.aspx#

Page 50
time yet continue to be associated with lower educational requirements. (Dolton &
Vignoles, 2000, p.180)
The first point is important, because most of the reports available on graduate skills
shortages are based on what employers say they need.
One way to focus attention on the extent to which graduate skills are important would be to
measure which skills are actually being used in work. The closest the current DLHE survey
comes to this is asking ‘Did you need the qualification you recently obtained to get the job?’
but it doesn’t specifically ask about skills. The Long DLHE survey explores this issue in
greater detail. Respondents are asked to rate the extent to which their HE experience
enabled them to develop a range of workplace skills, including being innovative,
communicating effectively, making effective use of IT and taking initiative. They are also
asked to rate the importance of various factors in gaining employment: subject, qualification
type, class/grade, evidence of skills and competencies, and work experience (results available
in Table 15). The results of Q16 are plotted in Figure 5, sorted in order of importance. This
shows that the most important factor for these leavers from HE is evidence of skills or
competencies. Because skills matter more than qualification, more information on skills
might be useful to future HE outcome data collection.
Figure 5: Results of Longitudinal DLHE 2010/11, Q16 (Table 15), total for all qualification levels
and subjects. Columns sorted in order of importance, left to right.30
Human Capital
The concept of human capital represents a way to consider the value of higher education for
employers. Adam Smith first described ‘human capital’ in The Wealth of Nations (1776) as a
way of describing non-monetary value. The idea of human capital developed into its current
30 Importance score = (% Formal requirement × 3) + (% Important × 2) + (% Not very important… × 1)
0
0.1
0.2
0.3
0.4
0.5
0.6
0.7
0.8
0.9
1
Evidence ofskills or
competencies
Qualificationgained
Workexperience
from previousemployment
Subject studied Class or gradeof qualification
obtained
Workexperience orplacement as
part ofqualification
Qualificationsobtained since
N/A Not important Not very important but helped Important Formal requirement

Page 51
economic meaning and was first linked with educational outcomes by Gary Becker. Becker
(1975) established the now-common idea that education and training is a form of investment
similar to business investments in equipment (physical capital):
The many forms of such investments include schooling, on-the-job training, medical
care, migration, and searching for information about prices and incomes. They differ in
their effects on earnings and consumption, in the amounts typically invested, in the size
of returns, and in the extent to which the connection between investment and return is
perceived. But all these investments improve skills, knowledge, or health, and thereby
raise money or psychic incomes. (Becker, 1975, p.9)
Becker’s theory that HE is an investment in human capital is widely accepted today:
The resulting human capital theory is still the basis of most research in the field today.
Human capital theory represented a distinct break from the past in that previously
education was largely considered to be a consumption good. […] It was the development
of human capital theory which suggested that in fact education should be seen primarily
as an investment good (Machin & Vignoles, 2005)
This conception of human capital has increasingly been used to frame HE policy, as
evidenced in the HE white paper (BIS, 2016c, p.7). But the Office for National Statistics
(Fender, 2014, p.6) notes that capital theory is contentious, with little agreement on
questions such as whether expenditure on education and training should be treated as
consumption or investment. The ONS adopts the OECD’s definition of human capital:
the knowledge, skills, competencies and other attributes embodied in individuals or
groups of individuals acquired during their life and used to produce goods, services or
ideas in market circumstances. (OECD, 2001)
This definition identifies the outcomes that investment in HE may generate. But these things
are difficult to measure, and so human capital is difficult to quantify. The Chartered Institute
of Personnel and Development has published a useful report that examines how UK FTSE
100 companies estimate value of human capital (CIPD, 2016). The report lists four key
elements of human capital that companies may measure:
Knowledge, skills and abilities (KSA)
Human resource development (HRD)
Employee welfare/stability
Employee equity
Fender (2014) identifies three main approaches to measuring HC: educational attainment,
value of ‘inputs’ (costs of training), and value of ‘output’ (labour market income). Fender
takes the output (income) based approach, as do most of the companies in the CIPD (2016)
report. But each approach has its limitations because education and training are not the only
determinants of human capital:
Some of an individual’s capital is innate to them and is in some sense, a non-produced
asset. Thus, the asset created by education could be regarded as improvements in human
capital by education and training. Another drawback of these measures is that they focus
on individual’s human capital and aggregate them to arrive at the population measure.

Page 52
This ignores spillovers between workers so that the whole may be more than the sum of
the parts. (Fender, 2013, p.9)
The ONS (2014) quantifies the value of human capital as the labour value of the workforce,
in terms of “the number of people in the workforce and the abilities they bring with them.”
ONS analyse the proportion of employed human capital by education level. They show that
human capital is concentrated in people with higher qualifications:
In 2014, 36.1% of the human capital stock was embodied in the 27.0% of the working
population whose highest educational attainment was a degree or equivalent. In contrast,
only 5.1% of the UK’s human capital stock was embodied in the 9.0% of the working age
population who have no formal qualifications. (ONS, 2014, p.15)
Finally, the study also makes the point that “human capital can also have social impacts, in
particular, improved health outcomes, lower crime rates, and higher rates of trust and social
participation” (ONS, 2014, p.3) These “social impacts” of human capital are also outcomes
from HE. Notably, these are outcomes that benefit wider society as much if not more than
the individuals who take part in HE. The social and public benefits of HE outcomes are
explored in the next chapter: Outcomes for Society and the State.
Summary
The skills that employers seek are not necessarily the same as those that students say they
want or that graduates actually develop. Overall, general employability skills are seen as
more important than subject specific knowledge, and in many cases the skills that employers
want from graduates are not different from those they want from the wider workforce.
Furthermore, the employability ‘skills’ that employers say they are looking for are often
attributes such honesty, integrity, reliability. There is not enough evidence to determine
whether these attributes are developed through HE or already held by graduates.
Concerns about possible over-education and/or under-employment arise periodically, but
the evidence is usually divided about the extent to which these issues actually exist. One way
to clarify this would be to measure which skills are being developed in HE and which are
actually being used in work.
Table 4 summarises the outcomes for employers identified in this chapter.
For Employers
Human capital Knowledgeable employees
Skilled employees – occupational and generic
employability skills
Employees with appropriate attitudes and dispositions
Graduates use the skills they developed during HE
Employment skills Skilled employees – occupational and generic
employability skills
Table 4: Overview of good outcomes from HE for employers

Page 53
06. Outcomes for Society and the State
In this final chapter we briefly consider some of the wider outcomes of higher education for society and the state. This includes social mobility and political engagement for individuals, and economic benefits generated by HE providers as employers and anchor institutions. We conclude with a review of the ways in which literature has presented different levels and types of outcomes from higher education.
Social Mobility
Socioeconomic disadvantage and educational attainment are closely associated. People from
poor backgrounds do less well educationally, and there is a wealth of evidence that suggests
that lack of education is one of the main barriers that prevents people moving out of poverty
(ESRC, 2012). HE in particular is frequently justified as an “engine of social mobility”, as
evidenced in the recent HE White Paper (BIS, 2016c, p.7). Amongst the government’s 19
indicators of social mobility, two of them are related to HE. One of these is explicitly linked
to HE outcomes: ‘graduate destinations’. The other is implicitly linked: ‘access to the
professions’ relates to graduate jobs.
16. Higher education – graduate destinations. The proportion of graduates in full-
time employment 6 months after graduating who are in ‘graduate jobs’, by social
background (defined as the occupational group of their highest earning parent)
17. Access to the professions. Proportion of working-age population employed in
managerial or professional positions (defined as NS-SEC 1 or 2) by social background
(defined using NS-SEC class of the main earner in the household when respondent was
14).31
On the graduate destinations measure of social mobility, the latest data (for 2012/13) shows
that the gap between the most and least advantaged groups is 6 percentage points. Factors
that are said to influence this indicator are access to HE courses that “give young people the
skills they need to access graduate jobs”, and recruitment practices of graduate employers
(such as graduate entry programmes and access to internships). In terms of the second
indicator, it is impossible to determine whether progress is being made due to changes in the
methodology that make current data incomparable with that of previous years. Other sources
tend to agree that in the UK social mobility has barely improved whilst social inequality has
worsened. Francis & Wong (2013) suggest that the key to improving social mobility is
improving social equality in education: “evidence shows that in the UK, education at best
replicates, and at worst exacerbates, existing inequality”. Francis & Wong identify the two
elements that impact social and educational inequality: material capital and social capital.
The suggestion is that the situation is unlikely to improve unless and until access to HE
becomes less segregated by socioeconomic status.
A literature review by the London School of Economics points out, however, that social
mobility depends on more than achieving higher education: Mobility requires ‘room at the
31 https://www.gov.uk/government/publications/social-mobility-indicators/social-mobility-indicators

Page 54
top’ for people to move up into, and/or it requires higher rates of downward mobility
(Brennan, Durazzi & Séné, 2013, p.19). Indeed, Francis & Wong (2013, p.2) recognise that
the whole concept of social mobility is predicated on the existence of an unequal and
meritocratic society (therefore, promoting social mobility is incompatible with the aim of
reducing inequality). Not everybody is driven towards constantly climbing the socioeconomic
ladder and ‘good’ outcomes differ. For many people, “‘getting on’ in life means getting a
decent job, a good place to live in a safe neighbourhood, and the ability to plan for the future”
(Van der Graaf et al., 2009, p.5). Moreover, it is unclear as to whether HE actually facilitates
social mobility or entrenches existing socioeconomic stratification (see Hall, 2012 for a good
discussion of this issue). It is understood that selective admissions policies in schools and
universities play a large part in reproducing social strata, which conforms with Bourdieu’s
(1984; 1986) sociological model. Behavioural studies of applications to HE suggest that the
answer is not simply to provide ‘better and more’ information, because this doesn’t
necessarily lead to more rational decision-making, and doesn’t serve everybody equally well
(Diamond et al., 2014). Applicants from middle-class families tend to make better use of the
social and cultural capital at their disposal to evaluate more information about HE, whereas
poorer students are more self-reliant (Reay, David & Ball, 2005).
Political Engagement
Engagement with politics is linked with educational attainment. This is more a benefit for
wider society than it is for individuals, but that’s not to discount the value of personal agency
it affords. There is clear evidence that political engagement varies with class, ethnicity, age
and education. People with graduate or higher education are just over twice as likely to be
interested in politics as those who have no formal qualifications (Fox, Blackwell, Boga
Mitchell, & Snare, 2016, p.37). Graduates are also four times more likely to take political
action (voting, donating, petitioning, etc.) compared with those without formal qualifications
(p.40).
Economic Impact
Universities UK (UUK) have estimated the economic impact of universities at regional and
national levels.32 The impact of universities on the UK economy identifies three main
beneficiaries of UK HE – individuals, the economy and society:
Higher education makes a fundamentally important difference – to individuals, through
improved life chances and opportunities; to the economy, through innovation and skills;
and to society, increasing our knowledge, through research discoveries and increasing
social mobility and cohesion. (UUK, 2014a, p.2)
UUK (2014a) estimate that in 2011-12 the HE sector accounted for 2.7 per cent of UK FTE
employment and contributed 2.8 per cent of UK GDP. Student expenditure supports £80bn
of the UK’s economic output (NEF, 2013); In Wales, student cash supports 2.6% of GDP and
32 A series of reports is available for various regions: http://www.universitiesuk.ac.uk/policy-and-
analysis/reports/Pages/economic-impact-higher-education-institutions-in-england.aspx

Page 55
35,000 jobs. And in Scotland it counts towards 1.26% of GDP and supports 109,000 jobs.
(NEF, 2013).33
HE providers in England now depend on the system of individual student finance, with fees
of up to £9,000 since 2012. While student loan debt is not a ‘good outcome’ from HE for
individual graduates, HEPs in England benefit from the higher fees and loans system
because their income has increased significantly, especially since student number controls
were abandoned. Overall, the post-2012 student finance system has impacted on the national
economy by adding to the national debt (McGettigan, 2015).
Amongst HEP’s income from student loans and teaching grants, transnational education
makes up an increasingly significant part. UK HE institutions have been amongst the most
popular destinations for international students, and the provision of HE to international
students is a significant part of the system’s economic sustainability. Non-EU students pay
more for their studies than EU counterparts (at least for now, while the UK is still in the EU).
International students benefit HEPs, business and the UK economy as a whole. For example,
one study shows that international students, who also pay more for their study, made a net
contribution of £2.3 billion to the economy through fees and spending (London First & PwC,
2015).
HEPs as Anchor Institutions
As well as making a significant contribution to the national economy, HEPs also benefit local
communities and economies. HEFCE has supported a number of research projects that
investigate the economic and social impact of HEPs on regional economies.34 For example, a
project by the University of Newcastle explores how universities engage with excluded
communities, and the Open University is investigating the impact of universities on social
cohesion, inclusion, citizenship, and disadvantage. In addition to the contributions made by
HE through institutional efforts, HE also benefits local social fabric through the actions of
students and graduates. Students act as catalysts for regional growth through the additional
roles they play: as workers, residents, consumers and contributors to social diversity and
enrichment (Munro, Turok & Livingston, 2010).
HEPs could be described as ‘anchor institutions’ – non-profit organisations that offer
geographical and economic stability amidst the pressures of commercial globalisation
(Community-Weath.Org). Axelroth Hodges & Dubb (2012) define anchor institutions as
institutions that
consciously and strategically apply the institution’s long-term, place-based economic
power, in combination with its human and intellectual resources, to better the welfare of
the community in which it resides.
UKCES identifies characteristics shared by anchor institutions:
33 http://www.nus.org.uk/Global/Student%20contribution%20to%20the%20UK%20economy.pdf
34 http://www.hefce.ac.uk/kess/regecon/

Page 56
Spatial immobility: these organisations have strong ties to the geographic area in
which they are based through invested capital, mission and relationship to
customers and employees
Size: anchor institutions tend to be large employers and have significant purchasing
power. Both these factors influence the level of impact these institutions can have on
the local economy
Non-profit: these institutions tend to operate not-for-profit; it is much simpler for
private businesses to move, meaning there is no guarantee they will continue serving
the local community in the long-term. However, there are examples of for-profit
organisations playing the role of an anchor. (Mosavi, 2015)
A literature review for UKCES provides further evidence on anchor institutions in the UK
(Smallbone et al., 2015):
HEIs might perform an anchor role through their activities in research, the provision of
knowledge-focused services to businesses and other employers, and educating people to
support the labour requirements of innovative local employers. This latter function might
include provision of management and leadership development support to small firms,
who constitute the vast majority of the business stock in every locality and are important
providers of goods and services, employment and income. (Smallbone et al., 2015, p.vii)
As part of its commitment of contributing to the government’s Science and Innovation
Strategy, HEFCE is collaborating with the Cities and Local Growth Unit to develop the role of
HEPs as regional anchor institutions (Allan, 2015). HEFCE’s Catalyst Fund supports
innovative models of HE provision as anchor institutions. Universities are contributing to
local economies through engagement with schools on outreach activities, with LEPs on skills
strategies, and through social enterprise collaborations and university-business interactions.
The ability of HEPs to act as anchors and to promote the local economy during times of
economic uncertainty is evidenced in a report commissioned by HEFCE (Coates-Ulrichsen,
2014). The report provides strong evidence for the impact of the Higher Education
Innovation Fund specifically, and the successes of higher education in supporting the
economy and society more generally, through the use of knowledge exchange (KE). This
study also involved an econometric analysis, with evidence of a positive and statistically
significant relationship between HEFCE KE funding and income from KE activity.
Econometric evidence from this and another study on non-monetised impact of KE (PACEC,
2015) show that HE providers have an important role as anchor institutions in supporting
small to medium-sized enterprises.
Mapping HE’s Contribution to Society
The broadest studies of HE’s contribution to society use different approaches to map the
outcomes from HE across a range of domains. Here we present some of the attempts to
summarise outcomes for wider society.
A literature review by the London School of Economics provides a comprehensive account of
evidence on the wider benefits of HE (Brennan, Durazzi & Séné, 2013). This review
categorises the benefits along two conceptual dimensions: the level at which benefits are
manifested (these are: individual and societal) and the type of benefits (market or non-

Page 57
market, i.e. financial and non-financial). On the basis of that literature review, a quadrant
model that summarises these outcomes was developed by BIS (2013b), reproduced below in
Table 5.
Society N
on
-Ma
rk
et
Greater social cohesion, trust and tolerance
Less crime
Political stability
Greater social mobility
Greater social capital
Increased tax revenues
Faster economic growth
Greater innovation and labour
market flexibility
Increased productivity of co-
workers
Reduced burden on public
finances from co-ordination
between policy areas such as
health and crime prevention
Ma
rk
et
Greater propensity to vote
Greater propensity to volunteer
Greater propensity to trust and tolerate others
Lower propensity to commit (non-violent) crime
Better educational parenting
Longer life expectancy
Less likely to smoke
Less likely to drink excessively
Less likely to be obese
More likely to engage in preventative care
Better mental health
Greater life satisfaction
Better general health
Higher earnings
Less exposure to unemployment
Increased employability and skills
development
Increased entrepreneurial activity
and productivity
Individual
Table 5: A quadrant model of the market and wider benefits of higher education to individuals and society. (BIS, 2013b, p.6)
Whilst this quadrant model is a useful summary of the various beneficial outcomes from HE,
this analysis does not provide any indication of the relative importance or the value of the
outcomes to different stakeholders. If a new DLHE is to better represent the outcomes from
HE, then it could be improved by focusing on the outcomes that are most important. Further
research is required in order to meet this challenge, however. The literature review by LSE
also identifies other areas where further research could contribute to what is known about
outcomes from HE:
In summary, what is known is that higher education makes considerable social, cultural
and economic impact but what is not known sufficiently is how it makes this impact, on
whom it makes its impact, when it makes its impact and the different forms which impact
takes from an increasingly diverse higher education system. There is a need to know

Page 58
these things in order that a large higher education system can be managed in ways that
will promote all of its functions and achieve the greatest benefits for the rest of society.
(Brennan, Durazzi & Séné, 2013, p.26)
In Degrees of Value, a report published by the New Economics Foundation, Shaheen (2011)
provides a useful assessment of the “broader social outcomes derived from universities”.
Figure 6 outlines these social outcomes in Shaheen’s logic chain, which identifies outcomes
from HE for four groups: students, employers, the local community, and state/society.
Figure 6. Social outcomes from higher education. (Shaheen, 2011, p.8)
However, this analysis fails to include the benefits that HE also offers for HEPs themselves,
which is an important part of understanding outcomes from HE. In addition, the groups
‘local community’ and ‘society’ could be combined, since they both represent public
communities of interest, and the difference between them is more a matter of geographic
scale than of difference in kind. On the other hand, society and state, which are grouped
together here, benefit in different ways from HE outcomes. For example, graduates make a
contribution through tax, which is a direct benefit for the state but an indirect one for
society. The distinction between public and private outcomes from HE is the subject of the
next section.
HE Outcomes as Public/Private Goods
In England, as in the US, changes to the funding system mean that the costs of HE are
increasingly borne by the individual rather than the state. But it is not clear that the benefits
of HE have altered from being more public to more personal.
Essentially, state legislators have been privatizing the cost of higher education and
putting the burden on students and university staff while still demanding that these

Page 59
institutions enrich the state with an educated labor force and more insect-resistant
tomatoes. (Vaidhyanathan, 2015).
It is difficult to make a distinction between private and public in HE, however, as found in a
study that attempted to identify the number of alternative HE providers in the UK (Hughes,
Porter, Jones & Sheen, 2013). This is partly because HE providers have various
characteristics that can be classified as either public or private (e.g. funding source, profit
motive, governance), and also because there is more than one way to define public and
private goods. To meet the challenge of mapping out the public/private nature of HE
outcomes, multiple authors have taken the approach of using a quadrant model. Next, we
examine four such quadrant models of HE as a public and private good.
Marginson (2016) takes the approach of combining two different ways of defining the
distinction between public and private goods. The economic definition is based on the
operation of the market (based on the economic theory of Paul Samuelson, 1954): Private
goods are those that circulate in the market; public goods are those that circulate outside the
market. The other definition is political (based on John Dewey, 1927): Public goods are those
funded by the state; private goods are those that are not. Marginson (2016) combines the
theories to form a quadrant model (Figure 7). The result is that it places the various aspects
of HE into different conceptual boxes, highlighting the extent to which outcomes from HE
research and teaching activities offer benefits for the individual or for wider society.
Marginson also notes that real-life HE providers do not fit into one quadrant only, because
they involve market and non-market outcomes for both public and private (to greater or
lesser degrees, depending on the national HE system and the particular HE provider model).
Figure 7: Four variations of public and private goods, based on economic (market/non-market) and political (state/non-state) conceptions of public/private goods. (Marginson, 2016, p.11).
Both of the two axial definitions of the public-private distinction are based on production (by
the state and by the market). An alternative approach is to make the distinction in terms of

Page 60
consumption – that is, instead of focusing on who produces, focus on who benefits. This is
the approach taken in another quadrant model of the public and private aspects of HE in a
report by former minister for universities David Willets. Willetts’ (2015) model combines
economic/non-economic and individual/wider axes to produce a model of the benefits from
HE outcomes (Figure 8).
Figure 8: Categorisation of the wider benefits of HE. (Willetts, 2015, p.9)
To describe ‘entrepreneurialism in HE’, Barnett (2014) uses a quadrant model based on
soft–hard entrepreneurialism on one axis, and open–controlled markets on the other. This
model is not populated with examples of HE outcomes so we do not reproduce it here.
Finally, in a special issue of the London Review of Education, Williams (2016) offers another
analysis of HE’s public good in terms of another conceptual pair. Williams’s conception of
public goods is based on the way in which the distinction is drawn in commercial culture
with respect to copyright law. Two attributes are used to make this distinction: Firstly, public
goods are ‘non-rivalrous’ in consumption, which means that one person’s use does not
deprive others of the opportunity to use the same resource. Knowledge produced by research
in universities falls into this category, for example – it does not get exhausted through use,
unlike most physical goods. Secondly, public goods are ‘non-excludable’, which means that it
is impossible to prevent other people from sharing the same resource. Knowledge from HE

Page 61
also fits this category too, since it is impossible to prevent people from using that
knowledge.35
The editorial in the special edition of London Review of Education discusses the issue of
public/private goods of HE in the context of its marketisation – that is, in a context in which
HE is increasingly privatised:
If, in that context, we ask ‘What is higher education?’ and ‘What is higher education for?’,
we might answer something like this. In a society dominated by the demands of the
market, by consumption, there is an absolute demand that higher education overall
should question itself and its relations to policy, whether it has as one of its central
principles the theoretical condition of knowledge. These will be principles focused on
ethics and, therefore, how these might be established. They are essential for any
legitimate higher education system to be confident in a market-dominated society.
(Filippakou, 2016, p.3)
These issues have also surfaced in a consultation on better use of data in government
(Cabinet Office, 2016). The government’s summary of responses to one question touches on
the issue in relation to the public benefits of research: What principles or criteria do you
think should be used to identify research that has the potential for public benefit, or
research that will not be in the public benefit?
Amongst specific suggestions as to what criteria could be use to determine public
interest, responses included research that could inform or evaluate public policy, or lead
to the improvement of health, education or economic and social wellbeing. Several
responses called for the explicit exclusion of research for private profit or gain, and a
number included the requirement that all findings should be made public. (Cabinet
Office, 2016, para.91)
These are live issues for policy-makers, and we do not attempt to settle these questions here.
The implications for data collection in HE is not only that the public benefits of HE are
important for justifying public expenditure on the system, but also that these issues offer a
way to improve understanding of HE outcomes and to refine data collection to better
represent the whole picture of what higher education contributes to wider society. A recent
report by The Bridge Group on social mobility summarises the challenges and opportunities
for HE data collection in relation to diversity in HE and its contribution to social mobility:
Problems collecting data from students and job candidates can make it difficult to build
understanding of patterns at a national level, let alone assist recruitment at the level of
individual firms. The use of different datasets between employers makes comparison
difficult, and the use of single or problematic datasets risks doing more harm than good.
Data should be used not only to monitor the diversity of new recruits, but to help
employers to understand in-firm progression and success from a diversity perspective.
(Bridge Group, 2016, p.5)
35 Except, that is, to the extent to which such knowledge is made inaccessible to the public, for example through publication and
copyright in specialist pay-for-access journals. This is a live debate in academia: whether public access to publicly-funded
research should be restricted in this way.

Page 62
Summary
Higher education provides outcomes not only for graduates, employers and providers
themselves. There are also a number of important wider outcomes which benefit society and
the state in general. These include outcomes which range from social mobility to the
economic impact of higher education on the UK economy.
Socioeconomic disadvantage and educational attainment are closely associated. People from
poor backgrounds do less well educationally. There is a wealth of evidence suggesting that
lack of education is one of the main barrier to people moving out of poverty. HE in particular
is frequently justified as driver of social mobility. However, improving social mobility
requires more than higher education. Furthermore, some literature is more sceptical,
suggesting that education may simply reproduce or even entrench social inequality.
People with graduate or higher education are more likely to be interested in politics
compared to those who have no formal qualifications and are more likely to take political
action (voting, donating, petitioning, etc.). This has clear benefits for both wider society and
for the value of personal agency it affords.
One of the most obvious outcomes from HE is the economic value it generates both
regionally and nationally. Nationally, the HE sector accounts for nearly 3% of UK GDP. HE
providers also have an influential role to play in the economic success of the cities and
regions in which they are situated. As Anchor Institutions providers have strong ties to
geographic areas through invested capital, business relationships and employment
opportunities.
The broadest studies of HE’s contribution to society use similar approaches to map the
outcomes from HE across a range of domains. In the majority of cases common themes
emerge – these range from understanding the level (individual/societal) and type
(financial/non-financial) of benefits to emerge, to the range of beneficiaries (student,
employers/local communities/national economies) to an assessment of the extent to which
higher education acts as a private or a public good.
The implications for data collection in HE are not only that the public benefits of HE are
important for justifying public expenditure on the system, but also that these issues offer a
way to improve understanding of HE outcomes and to refine data collection to better
represent the whole picture of what higher education contributes to wider society.
Table 6 summarises the outcomes for society and the state identified in this chapter.
For Society and the State
Social mobility Enabling access to graduate jobs and professions
Political
engagement
Voting, donating, dialogue and discourse
Personal agency
Economic
impact
Contribution to GDP
Local, regional and community impact
Table 6: Overview of good outcomes from HE for society and the state

Page 63
07. Conclusions
Here we conclude the report with a discussion centred on how good outcomes from HE can assist HESA in their review of destinations and outcomes data for graduates from higher education.
Employment rate and employment in a graduate or high-skilled job have traditionally
formed a key part of HE outcome measures. The ONS SOC classification, or tailored
variations such as SOC(HE) and SOC(DLHE), provide a pragmatic approach to identifying
graduate jobs based on job titles and descriptions. The roles that are classified as graduate or
high-skilled jobs need to be regularly reviewed and updated to ensure they remain
appropriate and relevant to the changing labour market.
However, rather than a specific job, a key objective of HE for many students is to enhance
their career prospects more generally and secure a good job. In measuring HE outcomes for
students it is important that the metrics link clearly to student's own objectives. As part of
developing improved measures of HE outcomes, we suggest it is worth exploring the effect of
HE on career prospects and the extent to which graduate feel they have a good job as a
result.
Taking career prospects first, a career is, by definition, something that takes place over time.
It is difficult to assess career progression or achievement based on what someone doing at a
particular point in time – particularly, as in the case of the DLHE, so soon after graduation.
This point made by the Royal Statistical Society in their response to the TEF consultation:
DLHE currently measures employment outcomes too early In particular, it is unrealistic
to expect employment in SOC group 1 (managers, directors and senior officials) within 6
months of graduation.” (Royal Statistical Society, 2016, p.3)
Furthermore, career pathways and outcomes are influenced by a range of factors, including
gender, ethnicity, socioeconomic background and subject studied. A more useful way to
consider successful outcomes is the extent to which graduates feel they feel they are on
course to achieve their goals and that their HE experience has made a contribution to their
journey.
Enhancing career prospects is about developing employability. But defining employability is
complicated; it entails a range of variables and there is a mismatch between what employers
say is needed and what graduates actually offer. While graduates are more employable
(based on employment rate compared to those without degrees), just what it is that makes
them so is harder to pin down – and thus measure. Employers identify a range of factors that
they value and look for in graduates, yet many of these appear to be basic generic skills or
behavioural attributes and attitudes. They are necessary but not sufficient for graduate
employment. The focus of HE is on developing skills relating to the use of knowledge –
assessing evidence, thinking critically, communicating complex ideas.
The massive expansion of HE in recent years, coupled with more recent challenging
economic climate, means the under-employment or over-education of graduates is an
ongoing debate. One way to capture this through HE outcomes is to explore the extent to
which graduates have the opportunity to use the knowledge and skills developed through HE

Page 64
in their work. The Long DLHE survey current goes some way down this route, but further
measures could be useful.
We should not dismiss employer’s concepts of employability though. Attributes such as
honesty, integrity and ability to work with others are clearly valuable assets. Furthermore,
these attributes will benefit graduates well beyond employment. In this regard, the employer
perspective is not so very distant from the wellbeing perspective, which focuses on the
development of skills for living as well as working. Collecting data to measure social and
cultural capital would be useful as many of the characteristics that employers say they want
to see in graduates can be categorised in this way.
The literature shows that a variety of personal and societal benefits from better health to
greater political engagement are associated with HE. What is less well understood is how
these benefits are transmitted by the HE experience. Understanding more about the
activities that build positive attributes will be helpful as it then opens up the option to
measure participation in those activities that contribute to employability. For example, the
evidence suggests that engagement extra-curricular activities such as work-experience and
international experience, helps to build employability.
As objectives for HE are likely to be subjective and specific to the individual, another way of
assessing the extent to which graduates feel their aims have been achieved, is through
measuring satisfaction. Current measures of satisfaction offer little differentiation between
HEPs however. The Net Promoter Score (NPS) appears to offer an alternative. Further
research would be needed to assess the potential for such a measure.
Turning to the objective of achieving a good job, meaningful employment is important for
graduates, but the challenge is in defining and operationalising this such that it can be
measured. This is unlikely to be achieved in the same way as measuring graduate jobs due to
the personal nature of meaningfulness. But asking whether work is important to the
employee and others and gives feelings of accomplishment may be a useful starting point.
Certainly, it would appear this could offer an opportunity to explore a different dimension of
HE outcomes from what has been achieved previously.
While salary is not necessarily the most important concern of students, it is a consideration,
and is important in terms of the wider economic benefits of HE in that it relates to the
repayment of income-contingent loans and contributions to tax revenues. HEFCE make the
case for continued attention to labour market outcomes:
Although employment opportunities are only one of the reasons students go to higher
education, for many it is an important part of that decision. Also, in view of the public
investment made in higher education, and the potential for increased private
contributions, it is important that information is available to students and policymakers
about the return on that investment, alongside the broader personal, social and economic
benefits of higher education. To inform broader policymaking there is also a need to
investigate whether specific groups of students are experiencing comparative
disadvantage in the labour market. (HEFCE, 2011, p.4)
Following the SBEE Act, access to robust and longitudinal salary and benefits data is much
improved, and it makes sense for this to be a key source. However, as Charlie Ball for

Page 65
WonkHE (2016) points out that salary data alone is not sufficient as a metric of HE
outcomes and university performance.
A space remains for a sector-owned, population level outcomes survey, collected from an
audience with their knowledge and consent, which can address the current sector needs.
The most troublesome aspect of DLHE – the collection of salary data – is no longer vital.
Everything else […] is up for grabs. (Ball, 2016)
In this review we have identified a number of areas where a revised DLHE could provide
some useful new insights to help inform the ongoing development of HE and understanding
the outcomes it generates and how.

Page 66
References
Aamodt, P.O. & Hovdhaugen, E. (2008). Assessing Higher Education Learning Outcomes as a Result of Institutional and Individual Characteristics. Organisation for Economic Cooperation and Development. http://www.oecd.org/site/eduimhe08/41217853.pdf
AGR (2015). The AGR Graduate Recruitment Survey 2015: Winter Review. https://www.abdn.ac.uk/careers/documents/AGR_Winter_Survey_2015_Results.pdf
AHA (2016). Response to consultation on HE Green Paper. http://artsandhums.org/wp-content/uploads/2016/01/AHA-response-to-Green-Paper-consultation.pdf
Allan, T. (2015). Universities as anchor institutions. HEFCE blog, 16 March 2015. http://blog.hefce.ac.uk/2015/03/16/universities-as-anchor-institutions/
Ashworth-Hayes, S. & Sippitt, A. (2015). Have the government’s tuition fee reforms worked? Full Fact, 21 July 2015. https://fullfact.org/education/have-governments-tuition-fee-reforms-worked/
Axelroth Hodges, R. & Dubb., S. (2012). The Road Half Travelled: University Engagement at a Crossroads. Michigan State University Press.
Bailey, C. & Madden, A. (2016). What Makes Work Meaningful – Or Meaningless. MIT Sloan Management Review, 01 June 2016. http://sloanreview.mit.edu/article/what-makes-work-meaningful-or-meaningless/
Ball, C. (2016). Has DLHE had its day? WonkHE blog, 8th February 2016. http://wonkhe.com/blogs/future-of-dlhe/
Baum, S., Ma, J. & Payea, K. (2013). Education Pays 2013: The Benefits of Higher Education for Individuals and Society. College Board. https://trends.collegeboard.org/sites/default/files/education-pays-2013-full-report.pdf
Becker, G. (1975). Human Capital: A Theoretical and Empirical Analysis, with Special Reference to Education, Second Edition. Out of print. Available online at: http://econpapers.repec.org/bookchap/nbrnberbk/beck75-1.htm
Becket, N. & Brookes, M. (2005). Analysing Quality Audits in Higher Education. Brookes eJournal of Learning and Teaching, 1(2). http://bejlt.brookes.ac.uk/paper/analysing-quality-audits-in-higher-education/
BIS & Johnson, J. (2016). Statement on higher education and research following the EU referendum. https://www.gov.uk/government/news/statement-on-higher-education-and-research-following-the-eu-referendum
BIS (2011). Estimating the Value to the UK of Education Exports. BIS Research Paper Number 49. https://www.gov.uk/government/uploads/system/uploads/attachment_data/file/32395/11-980-estimating-value-of-education-exports.pdf

Page 67
BIS (2013a). Learning from Futuretrack: The Impact of Work Experiences on Higher Education Student Outcomes. Dhttps://www.gov.uk/government/publications/learning-from-futuretrack-impact-of-work-experiences-on-he-student-outcomes
BIS (2013b). The Benefits of Higher Education Participation for Individuals and Society: key findings and reports “The Quadrants”. BIS Research paper No. 146. https://www.gov.uk/government/uploads/system/uploads/attachment_data/file/254101/bis-13-1268-benefits-of-higher-education-participation-the-quadrants.pdf
BIS (2015a). Fulfilling our potential: Teaching Excellence, Social Mobility and Student Choice. HE Green Paper. https://www.gov.uk/government/uploads/system/uploads/attachment_data/file/474266/BIS-15-623-fulfilling-our-potential-teaching-excellence-social-mobility-and-student-choice-accessible.pdf
BIS (2015b). Impact Assessments: Summary Document. Small Business, Enterprise and Employment Act. https://www.gov.uk/government/uploads/system/uploads/attachment_data/file/418684/bis-15-276-small-business-enterprise-and-employment-act-impact-assessement-summary.pdf
BIS (2015c). Freezing the student loan repayment threshold. Government response to the consultation on freezing the student loan repayment threshold. https://www.gov.uk/government/uploads/system/uploads/attachment_data/file/479539/bis-15-626-freezing-student-loan-repayment-threshold-government-response.pdf
BIS (2016a). Graduate labour market statistics: 2015. https://www.gov.uk/government/statistics/graduate-labour-market-statistics-2015
BIS (2016b). Summary of Consultation Responses. Fulfilling our potential: Teaching Excellence, Social Mobility and Student Choice. https://www.gov.uk/government/uploads/system/uploads/attachment_data/file/523420/bis-16-261-he-green-paper-fulfilling-our-potential-summary-of-responses.pdf
BIS (2016c). Success as a Knowledge Economy: Teaching Excellence, Social Mobility & Student Choice. https://www.gov.uk/government/publications/higher-education-success-as-a-knowledge-economy-white-paper
BIS (2016d). Teaching Excellence Framework: Technical Consultation for Year Two. https://www.gov.uk/government/consultations/teaching-excellence-framework-year-2-technical-consultation
Blagden, S., Robinson, B, West, S. & Wolf, A. (2016). Report of the Independent Panel on Technical Education. https://www.gov.uk/government/uploads/system/uploads/attachment_data/file/536046/Report_of_the_Independent_Panel_on_Technical_Education.pdf
Boliver, V. (2013). How fair is access to more prestigious universities? The British Journal of Sociology, 64(2): 344–364.
Boliver, V. (2015). Are university admissions fair? Researchers need access to non-personal applicant data to find out for sure. http://www.dur.ac.uk/resources/profiles/9700/Areuniversityadmissionsfair.pdf

Page 68
Bourdieu, P. (1984). Distinction: A Social Critique of the Judgement of Taste (R. Nice, trans.). Cambridge, Massachusetts: Harvard University Press. 1996 edition available online: https://monoskop.org/images/e/e0/Pierre_Bourdieu_Distinction_A_Social_Critique_of_the_Judgement_of_Taste_1984.pdf
Bourdieu, P. (1986). The Forms of Capital. [Online] https://www.marxists.org/reference/subject/philosophy/works/fr/bourdieu-forms-capital.htm
Brennan, J., Broek, S., Durazzi, N., Kamphuis, B., Ranga, M. & Ryan, S. (2014). Study on innovation in higher education: final report. European Commission Directorate for Education and Training Study on Innovation in Higher Education, Publications Office of the European Union, Luxembourg. ISBN 9789279350818. http://eprints.lse.ac.uk/55819/1/__lse.ac.uk_storage_LIBRARY_Secondary_libfile_shared_repository_Content_Durazzi,%20N_Study%20innovation_Durazzi_Study%20innovation_2014.pdf
Brennan, J., Chanfreau, J., Finnegan, J., Griggs, J, Kiss, Z & Park, A. (2015). The effect of Higher Education on graduates’ attitudes: Secondary analysis of the British Social Attitudes Survey. Department for Business, Innovation and Skills. https://www.gov.uk/government/publications/graduates-attitudes-effect-of-higher-education
Brennan, J., Durazzi, N. & Séné, T. (2013). Things we know and don’t know about the Wider Benefits of Higher Education: A review of the recent literature. BIS research paper 133. https://www.gov.uk/government/publications/wider-benefits-of-higher-education-literature-review
Bridge Group (2016). Inspiring Policy: Graduate Outcomes and Social Mobility. http://www.thebridgegroup.org.uk/wp-content/uploads/2015/08/BG-Employability-Report-FINAL.pdf
Britton, J., Crawford, C. & Dearden, L. (2015). Analysis of the higher education funding reforms announced in Summer Budget 2015. IFS Briefing Note BN174. http://www.ifs.org.uk/uploads/publications/bns/BN174.pdf
Britton, J., Dearden, L., Shephard, N., & Vignoles, A. (2016). How English domiciled graduate earnings vary with gender, institution attended, subject and socioeconomic background. IFS Working Paper W16/06. http://www.ifs.org.uk/publications/8233
Britton, J., Shephard, N. & Vignoles, A. (2015). Comparing sample survey measures of English earnings of graduates with administrative data during the Great Recession. IFS Working paper W15/58. http://www.ifs.org.uk/publications/7997
Buckley, A. (2015). UKES 2015 - Students’ perceptions of skills development. York: HEA. https://www.heacademy.ac.uk/sites/default/files/ukes_2015.pdf
Buckley, A., Soilemetzidis, I. & Hillman, N. (2015). The 2015 Student Academic Experience Survey. HEPI / HEA. http://www.hepi.ac.uk/wp-content/uploads/2015/06/AS-PRINTED-HEA_HEPI_report_print4.pdf
Burke, P.J. (2015). Widening Participation in Higher Education: Racialised Inequalities and Misrecognitions. In: Alexander, C & Arday, J (Eds.), Aiming Higher: Race, Inequality and Diversity in the Academy (pp. 21–23). London: Runnymede Trust.

Page 69
Bynner, J., Dolton, P., Feinstein, L., Makepeace, G., Malmberg, L & Woods, L. (2003). Revisiting the benefits of higher education. http://dera.ioe.ac.uk/5167/1/rd05_03.pdf
Cabinet Office (2016). Better Use of Data in Government: Consultation. A Government Summary of Responses. https://www.gov.uk/government/uploads/system/uploads/attachment_data/file/534994/better_use_of_data_in_government_response_final.pdf
Callender, C. & Jackson, J. (2005). Does the fear of debt deter students from higher education? Journal of Social Policy, 34(4): 509–540. ISSN 1469-7823
Callender, C. & Wilkinson, D. (2013). Futuretrack: Part-Time Higher Education Students: The Impact of Part-Time Learning Two Years after Graduation. Higher Education Careers Services Unit. http://www.hecsu.ac.uk/assets/assets/documents/Part_time_FT_Wave_2.pdf
Campbell, L.M. (2016). NewDLHE – personal reflections on measuring success. Open World, 6 July 2016. http://lornamcampbell.org/higher-education/newdlhe-personal-reflections-on-measuring-success/
Cappelli, P. (2014a). What employers really want? Workers they don’t have to train. The Washington Post, 5 September, 2014. https://www.washingtonpost.com/news/on-leadership/wp/2014/09/05/what-employers-really-want-workers-they-dont-have-to-train/
Cappelli, P. (2014b). Skill Gaps, Skill Shortages and Skill Mismatches: Evidence for the US. Industrial & Labor Relations Review, 68(2): 251–290. https://www.lexisnexis.com/uk/legal/auth/bridge.do?rand=0.5836671026499809
CBI/Pearson (2015). Inspiring Growth: CBI-Pearson Education and Skills Survey 2015. http://www.cbi.org.uk/reports/education-and-skills-survey-2015/
Cheng, Y.C. & Tam, W.M. (1997). Multi-models of Quality in Education. Quality Assurance in Education, 5(1): 22–31.
Chowdry, H., Dearden, L., Goodman, A. & Jin, W. (2012). The distributional impact of the 2012-13 higher education funding reforms in England. Fiscal Studies, 33(2): 211–235.
Christodoulou, D. (2012). Why 21st century skills are not that 21st century. The Wing to Heaven blog, 8 January 2012. https://thewingtoheaven.wordpress.com/2012/01/08/why-21st-century-skills-are-not-that-21st-century/
CIPD (2015). Over-qualification and skills mismatch in the graduate labour market. http://www.cipd.co.uk/binaries/over-qualification-and-skills-mismatch-graduate-labour-market.pdf
CIPD (2016). Reporting Human Capital: Illustrating your company’s true value. http://www.cipd.co.uk/hr-resources/research/reporting-human-capital-companys-true-value.aspx
Civil Service (2014). Rapid Evidence Assessment Toolkit. http://webarchive.nationalarchives.gov.uk/20140305122816/http://www.civilservice.gov.uk/networks/gsr/resources-and-guidance/rapid-evidence-assessment

Page 70
Coates, H. & Mahat, M. (2014). ‘Advancing learning outcomes’, in: Hamish Coates (ed.) Higher Education Research and Policy, Volume 6: Higher Education learning Outcomes Assessment: International Perspectives, pp.15–31. Frankfurt am Main, DEU: Peter Lang AG.
Coates, H. & Richardson, S. (2011). An international assessment of bachelor degree graduates’ learning outcomes. Higher Education and Management Policy, 23(3): 51–69.
Coates-Ulrichsen, T. (2014). Knowledge Exchange Performance and the Impact of HEIF in the English Higher Education Sector. HEFCE. http://www.hefce.ac.uk/pubs/rereports/year/2014/keheifimpact/#d.en.86940
Coiffait, L. (Ed.) (2014). Blue Skies: New thinking about the future of higher education. Pearson. http://pearsonblueskies.com/download-the-book/
Conlon, G. & Patrigiani, P. (2011). The Returns to Higher education Qualifications. BIS Research Paper 45. https://www.gov.uk/government/uploads/system/uploads/attachment_data/file/32419/11-973-returns-to-higher-education-qualifications.pdf
Crawford, C. & Jin, W. (2014). Payback Time? Student debt and loan repayments: what will the 2012 reforms mean for graduates? IFS Report R93. Institute for Financial Studies. http://www.ifs.org.uk/comms/r93.pdf
Dahlgreen, W. (2015). 37% of British workers think their jobs are meaningless. YouGov, 12 August 2015. https://yougov.co.uk/news/2015/08/12/british-jobs-meaningless/
Davy, N. (2016). Tertiary education, social mobility and the labour market in the UK: a call for change. Graduate Market Trends, Summer 2016, pp.12–13. http://viewer.zmags.com/publication/8878e13d#/8878e13d/1
Dearden, L., Machin, S. & Vignoles, A. (2009). Economics of education research: a review and future prospects. Oxford Review of Education, 35(5): 617–632.
DELNI (2016). Higher Education Policy. https://www.economy-ni.gov.uk/articles/higher-education-policy
Diamond, A., Roberts, J., Vorley, T., Birkin, G., Evans, J., Sheen, J. & Nathwani, T. (2014). UK Review of the provision of information about higher education: Advisory Study and Literature Review. HEFCE. http://www.hefce.ac.uk/pubs/rereports/Year/2014/infoadvisory/Title,92167,en.html
Dowling, A. (2015). The Dowling Review of Business-University Research Collaborations. Department for Business, Innovation and Skills. https://www.gov.uk/government/publications/business-university-research-collaborations-dowling-review-final-report
Elliott-Bowman, J. (2016). Understanding the alternative HE sector: the first HESA release. WonkHE, 7 July 2016. http://wonkhe.com/blogs/data-understanding-the-alternative-he-sector-the-first-hesa-release/
Emmerich, W. (1997). Distributed System Principles. http://www0.cs.ucl.ac.uk/staff/ucacwxe/lectures/ds98-99/dsee3.pdf

Page 71
Fender, V. (2014). Measuring the UK’s Human Capital Stock. Methodology Guidance. Office for National Statistics. http://www.ons.gov.uk/ons/guide-method/user-guidance/well-being/publications/human-capital---methodology-paper.pdf
Fox, R., Blackwell, J., Boga Mitchell, L. & Snare, T. (2016). Audit of Political Engagement 13: The 2016 Report. Hansard Society. https://www.hansardsociety.org.uk/publications/audit-of-political-engagement-13-the-2016-report
Francis, B. & Wong, B. (2013). What is preventing social mobility? A review of the evidence. http://www.ascl.org.uk/download.0621F643-3196-4A73-BFEA9F2ABB3C1383.html
Gill, J. (2016). HE White Paper: Five key talking points. Times Higher Education, 16 May 2016. https://www.timeshighereducation.com/blog/he-white-paper-five-key-talking-points
Hall, M. (2012). Inequality and higher education: marketplace or social justice? Leadership Foundation for Higher Education. http://www.salford.ac.uk/__data/assets/pdf_file/0015/76110/Inequality-and-Higher-Education-published-Jan-2012.pdf
Harrison, N. & McCaig, C. (2015). An ecological fallacy in higher education policy: The use, overuse and misuse of low participation neighbourhoods’. Journal of Further and Higher Education, 39(6): 793–817. http://eprints.uwe.ac.uk/20669/
HEDIIP (2015). HEDIIP New Subject Coding System Project: Summary Report. http://www.hediip.ac.uk/wp-content/uploads/HEDIIP_NSCS_Summary_Report_2015-12-15.pdf
HEFCE (2015). National Student Survey: The future. http://www.hefce.ac.uk/lt/nss/future/
HEFCE (2016a). National Student Survey results 2016. http://www.hefce.ac.uk/lt/nss/results/2016/
HEFCE (2016b). REF Impact. http://www.hefce.ac.uk/rsrch/REFimpact/
HEFCE (2016c). 2016 National Student Survey summary data. http://www.hefce.ac.uk/media/HEFCE,2014/Content/Learning,and,teaching/NSS/Data/2016/NSS2016_summary_data.xlsx
HEFCE (2016d). Higher Education – Business and Community Interaction survey. 2014-15. http://www.hefce.ac.uk/pubs/year/2016/201619/
HESA (2016). Consultation on Principles and Future Requirements for the UK’s Public Interest Data about Graduates. https://www.hesa.ac.uk/dox/publishing/consultations/NewDLHE_Consultation_May_2016.pdf
HM Treasury (2015). Spending Review and Autumn Statement 2015. https://www.gov.uk/government/uploads/system/uploads/attachment_data/file/479749/52229_Blue_Book_PU1865_Web_Accessible.pdf
House of Commons BIS Committee (2016). The Teaching Excellence Framework: Assessing quality in Higher Education.

Page 72
http://www.publications.parliament.uk/pa/cm201516/cmselect/cmbis/572/572.pdf
House of Commons Committee of Public Accounts (2014). Student Loan Repayments. Forty-Fourth Report of Session 2013–14. http://www.publications.parliament.uk/pa/cm201314/cmselect/cmpubacc/886/886.pdf
Hughes, T., Porter, A., Jones, S. & Sheen, J. (2013). Privately funded providers of higher education in the UK. BIS Research Paper No. 111. https://www.gov.uk/government/uploads/system/uploads/attachment_data/file/207128/bis-13-900-privately-funded-providers-of-higher-education-in-the-UK.pdf
Humburg, M., van der Velden, R. & Verhagen, A. (2013). The Employability of Higher Education Graduates: The Employer’s Perspective. European Commission. http://www.dges.mctes.pt/NR/rdonlyres/658FB04A-909D-4D52-A83D-21A2AC4F2D38/8096/employabilitystudy_final.pdf
IES & REAP (2015). Understanding provision for students with mental health problems and intensive support needs. HEFCE. http://www.hefce.ac.uk/pubs/rereports/Year/2015/mh/Title,104768,en.html
IFS (2015). Budget’s student finance proposals will reduce government spending on higher education, but will raise debt for poorer students and repayments for most graduates. Press Release, 21 July, 2015. http://www.ifs.org.uk/publications/7905
IoD (2007). Institute of Directors skills briefing – December 2007. Graduates’ employability skills. http://aces.shu.ac.uk/employability/resources/policy_paper_graduates_employability_skills.pdf
Johnson, S., Snowden, N., Mukhuty, S., Fletcher, B. & Williams, T. (2015). Entrepreneurship Skills: literature and policy review. BIS. https://www.gov.uk/government/uploads/system/uploads/attachment_data/file/457533/BIS-15-456-entrepreneurship-skills-literature-and-policy-review.pdf
Kandiko, C.B. & Mawer, M. (2013). Student Expectations and Perceptions of Higher Education. London: King’s Learning Institute. http://www.kcl.ac.uk/study/learningteaching/kli/People/Research/DL/QAAReport.pdf
Kemp-King, S. (2016). The Graduate Premium: manna, myth or plain mis-selling? The Intergenerational Foundation. http://www.if.org.uk/archives/8403/the-graduate-premium-manna-myth-or-plain-mis-selling
Kleiman, P. (2015). Excellence in Diversity. Guild HE blog. http://www.guildhe.ac.uk/blog/excellence-in-diversity-a-report-celebrating-the-diversity-of-uk-higher-education/
London Economics (2014). The Higher Education fees and funding reforms in England. What is the value of the RAB charge on student loans for Treasury to break even? http://londoneconomics.co.uk/wp-content/uploads/2014/03/Whats-the-breakeven-associated-with-the-reforms-of-Higher-Education-Final-Version-docx.pdf

Page 73
London First & PwC (2015). London Calling: International students’ contribution to Britain’s economic growth. http://londonfirst.co.uk/wp-content/uploads/2015/05/London-Calling-report.pdf
Machin, S. & Vignoles, A. (2005). What’s the good of education? CentrePiece, 10(1). http://cep.lse.ac.uk/pubs/download/CP171.pdf
Mason, G. (2010). Part-time Higher Education Students in the UK: Statistical Review. http://www.hecsu.ac.uk/assets/assets/documents/Part-time_HE_students_in_the_UK_Statistical_Review_April_2010.pdf
McGettigan, A. (2015). The accounting and budgeting of student loans. HEPI Report 75. http://www.hepi.ac.uk/2015/05/21/accounting-budgeting-student-loans/
McGettigan, A. (2016a). The “cost” of student loans. Critical Education, 30 April 2016. https://andrewmcgettigan.org/2016/04/30/the-cost-of-student-loans/
McGettigan, A. (2016b). Human capital: interview with author of IFS graduate earnings study. WonkHE, 17 April 2016. http://wonkhe.com/blogs/human-capital-interview-with-an-author-of-ifs-study-of-graduate-earnings/
McLean, C. (2016). …and justice for all? Basic income and the principles of gender equity. Juncture, 22(4): 284–288. http://onlinelibrary.wiley.com/doi/10.1111/j.2050-5876.2016.00875.x/epdf
Morris, W. (1888). New from Nowhere and Other Writings. (Ed. C. Wilmer). London: Penguin Books.
Mosavi, S. (2015). UKCES explains: What is an anchor institution? UKCES. https://ukces.blog.gov.uk/2015/03/19/ukces-explains-what-is-an-anchor-institution/
Mountford-Zimdars, A., Sabri, D., Moore, J., Sanders, J, Jones, S & Higham, L. (2015). Causes of differences in student outcomes. HEFCE. http://www.hefce.ac.uk/pubs/rereports/Year/2015/diffout/Title,104725,en.html
Munro, M., Turok, I. & Livingston, M. (2010). Students as catalysts for City and Regional Growth. University of Strathclyde Glasgow. https://ewds.strath.ac.uk/Portals/8/ImpactReport_no4.pdf
NatCen (2015). British Social Attitudes 33: Introduction. http://www.bsa.natcen.ac.uk/latest-report/british-social-attitudes-33/introduction.aspx
National Audit Office (2014). Investigation into financial support for students at alternative higher education providers. London: Department for Business, Innovation and Skills. https://www.nao.org.uk/wp-content/uploads/2014/12/Investigation-into-financial-support-for-students-at-alternative-higher-education-providers.pdf
NCEE (2012). Enterprise and Entrepreneurship in Higher Education: England 2012 Survey. The National Centre for Entrepreneurship in Education. http://ncee.org.uk/wp-content/uploads/2014/06/NCEE__2012_Mapping_Report.pdf
Neary, M., Saunders, G., Hagyard, A. & Derricot, D. (2015). Student as Producer: research-engaged teaching, an institutional strategy. Higher Education Academy.

Page 74
https://www.heacademy.ac.uk/project/student-producer-research-engaged-teaching-and-learning-institutional-strategy
Nesta (2016). A Top 30 Skills Chart. Nesta blog, 11 February 2016. http://www.nesta.org.uk/blog/top-30-skills-chart
Neves & Hillman (2016). The 2016 Student Academic Experience Survey. http://www.hepi.ac.uk/wp-content/uploads/2016/06/Student-Academic-Experience-Survey-2016.pdf
Nurse, P. (2015). Ensuring a successful UK research endeavour: A Review of UK Research Councils. Department for Business, Innovation and Skills. https://www.gov.uk/government/uploads/system/uploads/attachment_data/file/478125/BIS-15-625-ensuring-a-successful-UK-research-endeavour.pdf
NUS (2016). Learning analytics: a guide for students’ unions. http://www.nusconnect.org.uk/resources/learning-analytics-a-guide-for-students-unions
OBR (2015). Fiscal sustainability report. June 2015. http://budgetresponsibility.org.uk/fsr/fiscal-sustainability-report-june-2015/
OECD (2012). What are the returns on higher education for individuals and countries? Education Indicators in Focus, 2012/6 (June). http://www.oecd.org/edu/skills-beyond-school/Education%20Indicators%20in%20Focus%206%20June%202012.pdf
OECD (2013). What are the social benefits of education? Education Indicators in Focus, 2013/01. https://www.oecd.org/education/skills-beyond-school/EDIF%202013--N%C2%B010%20(eng)--v9%20FINAL%20bis.pdf
ONS (2013). Graduates in the UK Labour Market: 2013. http://www.ons.gov.uk/employmentandlabourmarket/peopleinwork/employmentandemployeetypes/articles/graduatesintheuklabourmarket/2013-11-19
OECD (2013). Assessment of Higher Education Learning Outcomes: Feasibility Study Report. Volume 2: Data Analysis and National Experiences. http://www.oecd.org/edu/skills-beyond-school/AHELOFSReportVolume2.pdf
ONS (2014). Human capital estimates: 2014. http://www.ons.gov.uk/peoplepopulationandcommunity/wellbeing/articles/humancapitalestimates/2015-08-25/pdf
ONS (2015). Quality and Methodology Information for the Labour Force Survey. http://webarchive.nationalarchives.gov.uk/20160105160709/http://www.ons.gov.uk/ons/guide-method/method-quality/quality/quality-information/social-statistics/quality-and-methodology-information-for-the-labour-force-survey--lfs-.pdf
ONS (2016a). Teaching Excellence Framework: Review of Data Sources – Interim Report. https://www.gov.uk/government/uploads/system/uploads/attachment_data/file/523291/bis-16-269-teaching-excellence-framework-review-of-data-sources-interim-report.pdf
ONS (2016b). Migration Statistics Quarterly Report: May 2016. https://www.ons.gov.uk/peoplepopulationandcommunity/populationandmigration

Page 75
/internationalmigration/bulletins/migrationstatisticsquarterlyreport/may2016#immigration-to-the-uk
ONS (2016c). Population Briefing. International student migration: What do the statistics tell us? https://www.ons.gov.uk/file?uri=/peoplepopulationandcommunity/populationandmigration/internationalmigration/articles/longterminternationalmigration/internationalstudentmigrationwhatdothestatisticstellus/internationalstudentmigrationtcm77431150.pdf
Overell, S. (2008). Inwardness: The rise of meaningful work. Provocation Series, 4(2). The Work Foundation. http://www.theworkfoundation.com/DownloadPublication/Report/32_32_inwardness_final.pdf
Podolny, J.M. & Hill-Popper, M. (2004). Hedonic and transcendent conceptions of value. Industrial and Corporate Change, 13(1): 91–116.
Purcell, K., Elias, P., Atfield, G., Behle, H., Ellison, R., Luchinskaya, D., Snape, J., Conaghan, L. & Tzanakou, C. (2012). Futuretrack Stage 4: transitions into employment, further study and other outcomes. HECSU. http://www.hecsu.ac.uk/assets/assets/documents/Futuretrack_Stage_4_Final_report_6th_Nov_2012.pdf
QAA (2016). UK Quality Code for Higher Education. Part C: Information about Higher Education Provision. http://www.qaa.ac.uk/assuring-standards-and-quality/the-quality-code/quality-code-part-c
Rich, J. (2014). ‘Threading employability into the tapestry of higher education.’ In: L. Coiffait (Ed.), 2014, Blue Skies: New thinking about the future of higher education. Pearson. http://pearsonblueskies.com/wp-content/uploads/2012/09/4136.BlueSkies_A5_Web.pdf
Rich, J. (2015a). Why TEF must measure employability not employment. WonkHE blog, 10 December 2015. http://wonkhe.com/blogs/employability-johnsons-tef/
Rich, J. (2015b). Employability: degrees of value. HEPI occasional paper 12. http://www.hepi.ac.uk/2015/12/10/2928/
Rienties, Bart; Johan, Novie and Jindal-Snape, Divya (2015). A dynamic analysis of social capital building of international and UK students. British Journal of Sociology of Education, 36(8): 1212–1235.
Royal Society (2016). Changes to the research, higher education and innovation landscapes. https://royalsociety.org/topics-policy/publications/2016/statement-on-changes-to-the-research-higher-education-and-innovation-landscapes/
Royal Statistical Society (2016). Response to the Department for Business Innovation and Skills’ Technical Consultation (year 2) on the Teaching Excellence Framework. http://www.rss.org.uk/Images/PDF/influencing-change/2016/RSS-response-to-BIS-Technical-Consultation-on-Teaching-Excellence-Framework-year-2.pdf
Sclater, N. & Bailey, P. (2016). Code of practice for learning analytics. Bristol: Jisc. https://www.jisc.ac.uk/guides/code-of-practice-for-learning-analytics

Page 76
Sclater, N., Peasgood, A., & Mullan, J. (2016). Learning Analytics in Higher Education: A review of UK and international practice. Bristol: Jisc. https://www.jisc.ac.uk/reports/learning-analytics-in-higher-education
Shacklock, X. (2016). From Bricks to Clicks: The Potential of Data and Analytics in Higher Education. Higher Education Commission. http://www.policyconnect.org.uk/hec/research/report-bricks-clicks-potential-data-and-analytics-higher-education
Shadbolt, N. (2016). Review of Computer Sciences Degree Accreditation and Graduate Employability. BIS & HEFCE. https://www.gov.uk/government/publications/computer-science-degree-accreditation-and-graduate-employability-shadbolt-review
Shaheen, F. (2011). Degrees of Value: How universities benefit society. New Economics Foundation. http://www.neweconomics.org/publications/entry/degrees-of-value
Shury, J., Adamas, L., Barnes, M., Huntly Hewitt, J. & Oozerally, T. (2016). Understanding the Market of Alternative Higher Education Providers and their Students in 2014. London: IFF Research. https://www.gov.uk/government/uploads/system/uploads/attachment_data/file/524453/he-alternative-providers-2014.pdf
Sierra, C. (2016). Report on ‘Blockchains for Social Good’. European Commission. http://ec.europa.eu/newsroom/dae/document.cfm?action=display&doc_id=16436
Smallbone, D., Kitching, J., Blackburn, R. et al. (2015). Anchor institutions and small firms in the UK: A review of the literature on anchor institutions and their role in developing management and leadership skills in small firms. UKCES. https://www.gov.uk/government/uploads/system/uploads/attachment_data/file/414390/Anchor_institutions_and_small_firms.pdf
Smith, E. (2003). Ethos, Habitus and Situation for Learning: An Ecology. British Journal of Sociology of Education, 24(4): 463–470.
Social Mobility & Child Poverty Commission (2015). A qualitative evaluation of non-educational barriers to the elite professions. https://www.gov.uk/government/uploads/system/uploads/attachment_data/file/434791/A_qualitative_evaluation_of_non-educational_barriers_to_the_elite_professions.pdf
Stern, N. (2016). Building on Success and Learning from Experience: An Independent Review of the Research Excellence Framework. Department for Business, Energy & Industrial Strategy. https://www.gov.uk/government/uploads/system/uploads/attachment_data/file/541338/ind-16-9-ref-stern-review.pdf
Steuer, N. and Marks, N. (2008). University Challenge: Towards a well-being approach to quality in higher education. London: New Economics Foundation http://www.healthyuniversities.ac.uk/uploads/files/qualitywellbeing_qaa.pdf
The Panel on Fair Access to the Professions, (2009). Unleashing Aspiration: The Final Report of the Panel on Fair Access to the Professions. London: Cabinet Office. http://webarchive.nationalarchives.gov.uk/+/http:/www.cabinetoffice.gov.uk/media/227102/fair-access.pdf

Page 77
Thomas, J, Newman, M & Oliver, S. (2013). Rapid evidence assessments of research to inform social policy: taking stock and moving forward. Evidence & Policy, 9(1), 5-27.
Turner, G. (2016). PRES 2015: The research student journey. Higher Education Academy. https://www.heacademy.ac.uk/sites/default/files/pres_2015.pdf
Tversky, A. & Kahneman, D. (1974). Judgement under Uncertainty: Heuristics and Biases. Science, New Series, 185(4157): 1124–1131.
UNISTATS (2016). About Unistats: About the data. https://unistats.direct.gov.uk/find-out-more/about-the-data/
University of Sheffield (2008). Skills acquired by Chemistry Graduate. http://www.careers.dept.shef.ac.uk/students/skills/skillschm.pdf
UUK (2014a). The impact of universities on the UK economy. http://www.universitiesuk.ac.uk/policy-and-analysis/reports/Pages/impact-higher-education-institutions-uk-economy.aspx
UUK (2014b). International Students in Higher Education: The UK and its Competition. http://www.universitiesuk.ac.uk/policy-and-analysis/reports/Pages/international-students-uk-he-its-competition.aspx
UUK (2016). The Future Growth of Degree Apprenticeships. http://www.universitiesuk.ac.uk/policy-and-analysis/reports/downloads/FutureGrowthDegreeApprenticeships.pdf#search=degree%20apprenticeships
Vaidhyanathan, S. (2015). A Study in Total Depravity. The Baffler, 28. http://thebaffler.com/salvos/study-total-depravity
Vorhaus, J., Duckworth, K., Budge, D. & Feinstein, L. (2008). The Social and personal benefits of learning: A summary of key research findings. Centre for Research on the Wider Benefits of Learning, Institute of Education, University of London, London. http://eprints.ioe.ac.uk/3177/
Walker, I. & Zhu, Y. (2013). The Impact of University Degrees on the Lifecycle of Earnings. BIS research paper 1112. https://www.gov.uk/government/uploads/system/uploads/attachment_data/file/229498/bis-13-899-the-impact-of-university-degrees-on-the-lifecycle-of-earnings-further-analysis.pdf
Wakeham, W. (2016). Review of STEM Degree Provision and Graduate Employability. BIS & HEFCE. https://www.gov.uk/government/publications/stem-degree-provision-and-graduate-employability-wakeham-review

Page 78
Appendix 1: Search Terms and Parameters
Search Terms
Measure / metric / indicator / key performance indicator (KPI) / (learning/graduate)
outcome / rating / ranking / evaluation / appraisal / assessment / survey / review / audit
Higher education / university / graduate
Knowledge / learning / student satisfaction / value-for-money
Skills / higher skills / skills usage / skills measurement / human capital
Social capital / cultural capital / esteem / prestige / networking /
Non-academic learning outcomes / Non-quantifiable learning outcomes / informal
learning outcomes / non-formal learning outcomes
Future (graduate) jobs market / Graduate trends / labour market trends / geographical
variation / local labour market
Employment rate / unemployment rate / high-skilled employment rate / graduate
earnings / annual earnings / salaries / return on investment / graduate labour market
stats / economic activity
Search Parameters
Language (English only)
UK mainly, also EU, US, AU
Published in last 10 years (mainly, not exclusively)
Articles and reports only (not journals or databases)
Search within titles only (when results are otherwise too many)
Search Results: Academic Database
Table 7 summarises the results of using the search terms listed above in academic databases.
This provides an indication of the size and scope of academic material available. The column
on the right has fewer results because it is based on stricter search parameters (searching for
terms only within titles of articles).

Page 79
Articles only Articles only
In last 10 years In last 10 years
Search Term 1 + Search term 2
Search in titles only
"Learning outcomes" - 8877 1236
"Learning outcomes" "higher education" 2745 409
"Learning outcomes" university 3032 532
"Learning outcomes" graduate 829 222
"Learning gains" - 793 70
"Learning gains" "higher education" 83 3
"Learning gains" university 180 1
"Learning gains" graduate 38 0
"Learning outcomes" skills 4372 16
"Learning outcomes" "social capital" 42 4
"Learning outcomes" "cultural capital" 20 1
"Learning outcomes" "human capital" 46 0
"Learning outcomes" informal 339 5
"Learning outcomes" non-formal 96 4
"Graduate outcomes" - 18 13
"University outcomes" - 22 6
Table 7: Summary of search results from academic databases.