what drives meatier returns? - changing...
TRANSCRIPT

What Drives Meatier Returns?Ana Ananthakumar, Jackie Laine, Iris Tian, Shirley Xue
Analytical Consulting LabMarch 10, 2016

Our TeamAna Ananthankumar
University of Moratuwa ‘11, CFAManufacturing Excellence
Former: Manufacturing Excellence Manager, Unilever
At Kellogg: Strategy & Operations
Iris TianHarvard University ’11Environmental Science & Public Policy
Former: Teach For America, KIPPAt Kellogg: Finance
Jackie LaineNorthwestern University ‘08Communication and Film
Former: TV ProducerAt Kellogg: Marketing & Analytics
Shirley XueUniversity of Virginia ‘11
Economics
Former: Consultant, Bain & Co.At Kellogg: Finance

Executive Summary• Consumer tastes have been changing, specifically:
– Consumers have been switching from red meat to alternative sources of protein– Within those who consume red meat, consumers are trading up to higher-quality meat
• The regression results indicate that: – An increase (1.0%) in the beef content is associated with a decrease (-1.4%) in ROE– An increase (1.0%) in the beef content in a quality meat restaurant, is associated with a
decrease (-0.42%) in ROE, which is a smaller decrease than for traditional restaurants
• Industry expert interviews:– We interviewed executives from Chipotle, Sonic and Panera, who confirmed that
demand for red meat is weakening– Individual restaurants have their own ways of improving the perception of quality
• Business implications:– The results of this study have different implications for various stakeholders – QSR
companies, suppliers, consumers, public health and environmental institutions

Agenda
• Background & Research Hypothesis
• Consumer Insights: Changing dietary preferences
• Analytical Insights: Meatiness and profitability
• Quality Initiatives: Interviews with restaurant executives
• Business Implications

Research Topic: Does meat drive meatier returns?Context: • Much has been made in recent years about the environmental impact of meat and the
impact of climate change and water on meat and livestock production
• A growing number of consumers are looking to eat more plant-based foods, foregoing a meat for a few meals per week or seeking options with smaller amounts of meat• New restaurants like Chipotle, Sweet Greens and Roti Grille use meat as a condiment and
offer a range of plant-based options
What drives meatier returns?

Our Hypothesis
Hypothesis Meat-light restaurant chains in the US are delivering higher shareholder values than their meatier counterparts.
Drivers Changing Consumer Tastes
Higher Returns from Going “Meat-light”
Sustainability & Social Responsibility
Research method Quantitative Quantitative Qualitative
1 2 3

Included vs. Excluded in Our Research
Types of Meat Beef Chicken Pork Turkey Seafood Other
Types of Restaurants Quick Service Casual Dining Fine Dining Catering
Services
Location US WesternEurope Asia South America Middle East Rest of the
World
DataAvailability
Publiclytraded Private
In Scope

Agenda
• Background & Research Hypothesis
• Consumer Insights: Changing dietary preferences
• Analytical Insights: Meatiness and profitability
• Quality Initiatives: Interviews with restaurant executives
• Business Implications

Changing Consumer Tastes
• American dietary preferences have seen significant shifts over the past decade; ~25% millennials prefer a vegetarian burger, more than earlier generations
• Publications on health risks associated with red meat led to a sharp decline in consumption; white meat became American’s top choice over the past 30 years
• Higher-quality red meat and vegetarian options are propping up strong sales for premium joints like Shake Shack, while traditional joints see stagnant growth
• The same trend can be observed across other quick-service restaurants; quality meat is becoming an increasingly important profit driver - Subway announced its intention to source 100% antibiotic-free beef and pork by 2025- Chick-fil-A pledged to go 100% antibiotic-free by 2019 (currently 20% antibiotic-free)
Quantity of red meat consumption declined
Stronger demand for higher-quality meat
A
B

Millennials prefer meatless options more than other
generations
Meat-Light: Significantly higher percentage of millennials prefer a vegetarian diet
Source: Passport – The Protein Report (US) Jan 2015; veganstreet.com; Restaurant Branding Roadmap
A

Chicken Wins: White meat surpassed red meat as the most popular source of protein
Source: ISBS report on beef and pork wholesaling; The Huffington Post
US Meat Consumption Per Cap Per Year (lbs)Beef consumption declined while chicken replaced it as a primary
source of protein
POTENTIAL DRIVERS
• Affordability- In 2012, chicken sold for $2.03 per
pound; beef for $5.02 per pound
• Dietary recommendations to reduce red meat consumption- Red meat is linked to heart disease
and diabetes
• Environmental impact of grazing- Millennials grew up with the concept
of “sustainability consciousness”
A

Organic Meat: Both supply and demand on the rise
According to data compiled by the Wallace Center of the Winrock Foundation, retailsales of domestically produced grass-fed beef topped $400 million in 2013,compared to less than $5 million in 1998 when only about 100 beef producerswere seriously involved in grass-fed beef production. In the past 10 years, thedemand for grass-fed beef has grown at an annual rate of 25-30%. Recentconsumer research indicates that this pace will not slow down significantly any timein the near future.
Source - mosesorganic.org, 2014 Aug edition
B

First Impressions of Revenue CAGR: Within burger joints, consumers trading up for higher-quality options
TRADITIONAL BURGER JOINTS “THE BETTER BURGER” JOINTS
RestaurantChain Price Range* 2014 Revenue Revenue CAGR
(2010-2014)McDonald’s $2.00 - $4.49 $35.4B 2.3%
Wendy’s $4.19 - $6.09 $8.5B 0.5%
Burger King $2.19 - $6.29 $8.6B 0.1%
Whataburger $2.19 - $6.09 $1.8B 10.1%
Culver’s $2.99 - $6.79 $1.0B 5.3%
Sonic $3.89 - $5.49 $4.1B 3.2%
RestaurantChain Price Range* 2014 Revenue Revenue CAGR
(2010-2014)Five Guys $4.99 - $8.69 $1.2B 14.0%
In-N-Out $2.10 - $3.45 $1.9B 5.5%
Shake Shack** $5.19 - $9.49 $0.1B 54.1%
Smashburger** $5.29 - $7.59 $0.2B 22.2%
Habit Burger $3.30 - $5.95 $0.2B N/A
Bareburger** $9.65 - $13.25 $0.03B N/A
* Price of a cheeseburger or hamburger without meal option
Source: fastfoodmenuprices.com (except for Bareburger); QSR Magazine (The QSR 50, 2010 and 2014); Business Insider; Company Websites
** 2014 Revenue is estimated by Business Insider and company website
B

Addressing Changing Tastes: Expert interviews reveal that solution differs by restaurant (1 of 2)Kellogg Marketing Professor
“The desire to eat healthy is not unique to millennials. New burger joints such as Five Guys or Shake Shack appeal to consumers by putting on a healthy façade. Antibiotic-free or grass-fed meat offsets the guilt of eating a calorie-packed burger.”
“Chipotle created a strategy that McDonalds can not replicate. There simply is not enough organic beef for McDonald’s to source. Plus, McDonald’s core strengths are consistency and speed. It will never be as healthy.”
Local Fast Casual Restaurant Owner
“The problem with serving high-quality meat is that it gets really expensive. We had to price our grass-fed steak 50% higher than our other menu items.”
“It was our highest-food-cost item, and profit margin was significantly lower – our usual cost of goods is about 27%, but our steak was between 40% and 50%. Depends on what kind of quality you want to offer, in terms of profitability.”
Serving quality meat is NOT the “one size fits all” winning strategy for all QSRs, given differences in brand perception, price sensitivity and operational capabilities.

Addressing Changing Tastes: Various approaches to designing quality offerings (2 of 2)
• Supplier Relationships: Maintains a “one-on-one in person relationship” with all current suppliers for its 50-60 core ingredients
• Local Sourcing: In each market, Shake Shack incorporates an additional 300 or so specialty ingredients from local and artisanal suppliers to become a part of the community
• Fine Dining: Management team has heritage in fine dining and hospitality services
Sources: Interview w/Jeffrey Amoscato, 2015; Interview w/Cliff Hudson, 2015; CNBC: “Sonic CEO: McDonald’s all-day breakfast no big deal” & “Chicken sandwiches, candy slushes & shakes with Sonic”
• Customization: “We don’t make any of the food until the customer orders it. The customer knows that they can customize every single order…and that makes a difference”
• Diversification: Hamburgers are only 17% of sales, drinks are 30%, chicken is pushing 10%
• Transparency: Provides a transparent menu to allow guests to choose how they want to eat, the first national restaurant to voluntarily disclose caloric content on menu panels
• Ingredient Process: Committed to sourcing and serving high-quality ingredients without artificial preservatives and livestock and poultry that have been raised responsibly

Implications on Analysis: Quality & quantity levers
• Our research points to two meat-related levers that we believe can improve business outcomes:
Quality & Quantity
• Our hypothesis is that restaurants can improve business outcomes by pulling at least one lever:
- Restaurants that can credibly or feasibly increase quality can do so to improve outcomes
- Restaurants that can’t increase quality should look to decreasing quantity to improve outcomes
- Some restaurants may be able to pull both levers
Quality(Better meat)
Quantity(Less meat)
Business Outcome

Agenda
• Background & Research Hypothesis
• Consumer Insights: Changing dietary preferences
• Analytical Insights: Meatiness and profitability
• Quality Initiatives: Interviews with restaurant executives
• Business Implications

Our Metrics & Analysis
% of total menu items that contain beef as:• Main item in the dish• First ingredient listed• Part of the dish’s name on menu
Quality Meat:• Dummy variable indicating whether a company serves
grass-fed, hormone-free, or antibiotic-free meat o Yes (value of 1) = “quality meat restaurant”o No (value of 0) = “traditional restaurant”
X-Variables
Profitability measured using:• ROE (TTM)• 5-Year ROE
Y-Variable
• Statistical regression using proposed x-and y-variables and potential other x-variables to account for omitted variable bias (age of restaurant, health-related scandals in past 5 years)
• Qualitative study including interviews with restaurant executives about sustainability practices and challenges of using quality meats
Analysis
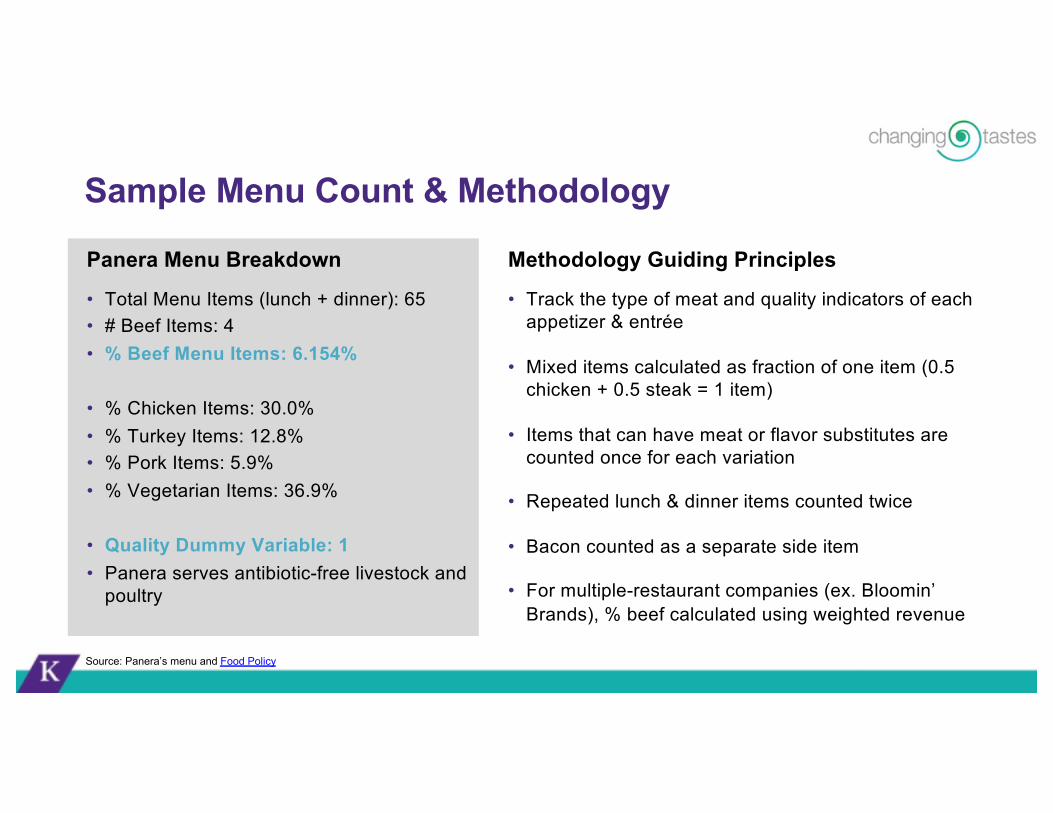
Sample Menu Count & Methodology
Panera Menu Breakdown
• Total Menu Items (lunch + dinner): 65• # Beef Items: 4• % Beef Menu Items: 6.154%
• % Chicken Items: 30.0%• % Turkey Items: 12.8%• % Pork Items: 5.9%• % Vegetarian Items: 36.9%
• Quality Dummy Variable: 1• Panera serves antibiotic-free livestock and
poultry
Methodology Guiding Principles
• Track the type of meat and quality indicators of each appetizer & entrée
• Mixed items calculated as fraction of one item (0.5 chicken + 0.5 steak = 1 item)
• Items that can have meat or flavor substitutes are counted once for each variation
• Repeated lunch & dinner items counted twice
• Bacon counted as a separate side item
• For multiple-restaurant companies (ex. Bloomin’ Brands), % beef calculated using weighted revenue
Source: Panera’s menu and Food Policy

Restaurant Selection and Sample• Eliminated out-of-scope
restaurants: ice cream, pizza, high-end concepts, no US operations
• Included publicly traded restaurant companies on the QSR MagazineTop 50 list
• Included in-scope companies from the NASDAQ BITE index
• Added additional publicly traded companies to strengthen data set
• Eliminated companies with fewer than 63 restaurants for statistical significance

A Glimpse at Our Data SetCompany % Meat 5YR ROE Brands Name % Meat 5YR ROE Brands
Shake Shack* 65.38% -12.66% Bloomin’ Brands* 20.00% 44.12% Outback, Bonefish Grill, Fleming’s, Carrabba’s
Carrols Restaurant Group* ★ 59.3% -10.36% Burger King Famous Dave’s 19.60% 13.44%
Texas Roadhouse * 43.55% 13.84% Fiesta Restaurant Group* 18.34% 173.50% Pollo Tropical, Fiesta Cantina
Chipotle* ★ 40.00% 23.69% Bob Evans* 16.90% 5.96%
Luby’s Inc. 39.19% 0.63% Luby’s, Fuddruckers, Cheeseburger in Paradise
Bravio Brio Restaurant Group 16.66% 14.59% Bravo!, BRIO Tuscan Grille,
Bon VieHabit Burger* 39.13% -0.19% Noodles & Company 16.50% 6.08%Red Robin* 38.81% 8.66% BJ’s Restaurant* 14.00% 8.37%Nathan’s Famous Hot Dogs 37.88% 21.87% The Cheesecake Factory
Inc.* 12.44% 18.45% The Cheesecake Factory, Grand Lux Café, RockSugar
Jack in the Box Inc.* ★ 35.47% 21.87% Jack in the Box, Qdoba Potbelly* 10.95% 1.04%Wendy’s* ★ 29.73% 2.61% Ruby Tuesday* 9.90% -2.97%Restaurant Brands International* ★ 28.79% 34.00% Burger King, Tim Horton’s Zoe’s Kitchen* 9.09% -6.00%
Sonic* ★ 26.92% 97.74% YUM Brands* ★ 8.79% 64.99% Taco Bell, KFC, (Pizza Hut)DineEquity Inc.* 26.46% 35.69% Applebee’s, IHOP Buffalo Wild Wings* 8.25% 16.98%Chuy’s Holdings 26.32% 29.95% Panera* ★ 6.15% 22.99%McDonald’s* ★ 26.32% 36.28% Bojangles ★ 2.27% 66.85%Brinker International* 23.07% 40.53% Chili’s, Maggiano’s El Pollo Loco* ★ 0.00% 18.94%Cracker Barrel* 21.93% 29.86% Popeye’s* ★ 0.00% 233.7%
Bold = Menu includes quality meat
Source: Yahoo Finance; Company Websites; YCharts * BITE Index (as of 03/07/16) ★ QSR Top 50 (2015)

Outliers Removed from AnalysisCOSÌ DENNY WINGSTOP
• Food offering comparable to Panera and Chipotle
• However, stock went down 85% between 2007 -2012
• Frequent change in top management led to poor operating performance
• Started trading on Nasdaq in June 2015
• Insufficient historical public data for comparison against other QSRs in the database
• Huge fluctuation in ROE from 2013 onwards
• Between 2011 and 2015:- Max ROE: 17,464%- Min ROE: -5,256%- Average: 1,180%
• Range is significantly wider than other stocks
Source: Yahoo Finance; NASDAQ.com

Regression Analysis
Regression #2
Regression #4
Regression #5
Regression #1
Regressions X-Variables
%Beef
%Beef
%Beef, Quality, QualityBeef
%Beef, Quality, QualityBeef, Scandal, Age
An increase in % beef decreases ROE, but less so for quality meat.
Y-Variables
TTM ROE
5Y Avg ROE
5Y Avg ROE
5Y Avg ROE0
0.2
0.4
0.6
0.8
1
1.2
1.4
1.6
1.8
Regression #1 Regression #2 Regression #3 Regression #4 Regression #5
Decrease in ROE associated with a 1% increase in beef on menu
Beef Quality Beef
Most significant and concise regression
Regression #3 TTM ROE%Beef, Quality, QualityBeef

Regression #4: 5Y ROE vs. % Beef & Quality
1% increase in beef associated with 1.45% decrease in 5YR ROE
1% increase in beef associated with 0.42% decrease in 5YR ROE for quality meat restaurants
Our results are statistically significant
-20
020
4060
80
Avg
5Y R
OE
0 20 40 60 80% Beef
Non-Quality Quality
Avg.
5-Y
ear R
OE
Regression: 5Y ROE vs. % Beef, Quality, Quality * %Beef
• Below ~45% beef, serving high-quality meat is associated with a lower 5Y ROE (this makes sense because of the cost of high-quality meat)
• But as the amount of beef offered increases, companies that offer high-quality meat see a slower decrease in 5Y ROE, suggesting that beef-heavy restaurants may benefit from serving high-quality meat

Regression Conclusions and Caveats
Conclusions• Increase in % beef on menu associated with decrease in ROE for all restaurants in sample• For restaurants that offer high-quality meat, % beef on menu associated with a smaller
decrease in ROE
Caveats• Small Sample: The study only focuses on 34 companies (encapsulating 49 restaurant
brands), this has given somewhat robust and significant results but the addition of restaurants would warrant better results. • Limited Publicly-Traded Quality Restaurants: Most restaurants with quality meat are not
publicly traded. Therefore, our analysis includes only 6 restaurants with quality meat• Volatility: Some of the restaurants have had very volatile ROEs.
Agenda
• Background & Research Hypothesis
• Consumer Insights: Changing dietary preferences
• Analytical Insights: Meatiness and profitability
• Quality Initiatives: Interviews with restaurant executives
• Business Implications

A Study of Quality Initiatives: Interviews with industry experts
• We interviewed executives from three companies in our data set to explore the following questions:
– What are are the most important quality-increasing initiatives that your company has taken? Why did your company decide to undertake them?
– How are customers reacting? Is this reflected directly or indirectly in your sales results?
– What are the challenges of pursuing these quality-increasing initiatives?

• Chipotle’s focus on quality ingredients started as founder Steve Ells focused on improving the taste of his carnitas; developed relationship with Niman Ranch and became passionate about the cause
– Focus spread to all meat and dairy products (where taste difference most apparent), then to GMO-free ingredients and some organic ingredients
• Sonic’s focus is on innovating to adapt to changing consumer tastes and cravings; opened its Culinary Innovation Center in 2014
– High value on authenticity: “unmasked flavors, clean supply chain, authentic messages”
• Panera focuses on “serving food that consumers would like to be served” and the human questions and concerns behind eating choices; less emphasis on consumer trend reports
– Panera’s consumers value transparency, which has driven the company’s initiatives in caloric transparency and antibiotic-free / grass-fed meats
Different Drivers of Quality
Sources: Interviews, Bloomberg Business: “How Chipotle Got Religion on Sustainable Pork”; Food Business News: “Sonic opens culinary innovation center”

Perspectives on Beef: Same trend, different reactions
Source: Interviews
• The executives we interviewed noted a general trend away from red meat due in part to: – Volatility in price– Changing consumer taste and perception of red meat as more unhealthy– Consumer price constraints
• They identified potential movement towards two different types of “quality” meat defined by:– Part: guests will want better cuts of meat (ex. filet mignon)– Process: increasing focus on how meat is raised and treated (ex. antibiotic-free, grass-fed)
• But their companies have reacted differently to this trend– Panera has upgraded to “pasture-fed steak” to appease customers but is shifting towards plant-
based protein (ex. tofu, quinoa) on the whole– Sonic will never be a tofu-and-sprouts kind of a place, but they are capitalizing on chicken as an
alternative source of protein

• Executives noted the challenge in pinpointing exactly how much quality-increasing initiatives moved the needle in terms of revenue or number of transactions
– We believe this speaks to the importance of high-quality ingredients / sustainability as part of an overall branding strategy for companies that can credibly brand as “quality”
• They varied in terms of how much they think their customers value high quality– One executive said he doesn’t think most customers care about how their food was raised,
especially in the context of their need state, convenience, time, and price– Another said that her customers expect “clean ingredients;” this preference sets the bar for the
restaurant’s supply chain
• But concepts of “clean,” “quality,” and “sustainable” ingredients are often conflated– Chipotle’s customers have given it a halo effect, assuming that all ingredients are organic (all
ingredients are GMO-free but only a portion of vegetable items are organic)– Each restaurant has its own definition of what these terms mean, and one executive noted that
“sustainability” has become a catch-all term that is used in numerous different ways
Consumer Reactions: A hazy halo effect
Source: Interviews, Chipotle’s Ingredient Statement

• Consistent supply is a key challenge– Chipotle’s early growth outpaced its suppliers’ ability to increase production– Managing supplier relationships key to maintaining and improving ingredient quality
• Other challenges:– Association between scaling sustainable supply chains and food safety issues, although food
safety issues are largely operational and not rooted in supply chain / sustainability practices– Customers may stop thinking of high-calorie quality ingredients as de facto healthier options– Shared concern that major levers for change are outside food industry (legislation, regulation)
• What factors help restaurants raise quality?– Menu simplicity (ex. Shake Shack’s eight meaty menu items)– Companies opening up high-quality ingredient supply chains for one another (ex. Chipotle and
Panera share chicken suppliers and buy different parts)– Being “at the tip of the iceberg” – companies like Sonic have not historically played in the quality
space and have unique opportunities to tap into this area
Challenges of Increasing Quality
Source: Interviews; Food Tank Summit Interview w/Chipotle’s Josh Brau, 2015; Bloomberg Business “Inside Chipotle’s Contamination Crisis”

Takeaways from Industry Expert Interviews
Source: Interviews
• Restaurants are successfully adapting to the trend away from red meat in different ways that reflect their individual DNAs and are credible with their brands and competencies
– Sonic focusing on chicken, diversifying menu instead of introducing grass-fed beef products
• The exact effect of quality-increasing initiatives is difficult to quantify, and it is hard to define the terminology around high-quality / sustainable ingredients and processes
– We believe this reinforces that companies should change their menus in ways that match their brands, as quality initiatives seem to contribute to a halo effect for the brand overall
• Key challenges are consistent supply, operational food safety, legislation, and the possibility that consumers may start to prioritize calorie count above ingredient quality
• We also asked who is winning at high quality and sustainability. Some responses:

Agenda
•Background & Research Hypothesis
•Consumer Insights: Changing dietary preferences
•Analytical Insights: Meatiness and profitability
•Quality Initiatives: Interviews with restaurant executives
•Business Implications

Business Implications for Restaurant Companies
High
Mea
tines
sLo
w M
eatin
ess
Traditional Restaurant Quality Meat Restaurant
• Diversify: Promote sales of higher margin non-entrée items (e.g. beverages, desserts)
• Go Meat-Light: More chicken and alternative protein entrées
• Keep Up: Selectively introduce sustainability and quality-increasing initiatives (e.g. cage-free eggs)
• Signal Healthy: Provide transparent nutritional or caloric information on menu items, expand low-calorie options
• Signal Quality: Highlight freshness via “open-kitchen” concept
• Keep Up: Selectively introduce sustainability and quality-increasing initiatives (e.g. responsibly raised chicken)
• Iterate on Quality: Introduce more premium cuts of meat to raise prices of beef items and improve margin
• Reduce Costs: Serve burgers with mushrooms mixed into patty
• Signal Healthy: Launch initiatives to strengthen perception of healthiness in terms of calorie count
• Innovate Alternative Proteins: Become first adopters of new plant-based proteins
• Pivot with Trends: Respond early to shifts in health trends• Keep Leading: Innovate quality-raising or sustainability
initiatives to strengthen brand (e.g. restaurant operations)
Companies must innovate in quality and sustainability or get left behind as tastes change and competitors adapt.
Make sure your initiatives are consistent with your brand, values, and consumers

Business Implications for SuppliersPRODUCTION
DECISION ANIMAL TREATMENTSTRONGER
PARTNERSHIPOPPORTUNITY FOR
COORDINATION
• Demand for different types of proteins and methods of treatment (e.g. organic) changes periodically with consumer taste• Tracking and
anticipating demand shifts allow suppliers to stock accordingly
• Higher awareness of animal welfare within supply chain practices• Increasingly important to
eradicate animal cruelty and raise farm animals in a humane manner
• Restaurants selectively trade up meat offerings• Suppliers will become
more integrated with restaurants to serve their individual needs
• Opportunity exists for suppliers to build a portfolio of restaurant customers with demand for different cuts of the same type of meat

Implications for Consumers• Consumers stand to benefit from restaurants’ reactions to current trends towards higher-
quality ingredients and more transparent and humane animal-raising processes
• But knowledge is key! Understand what restaurants offer and know what you value in terms of menu options and “quality” products:
PARTS vs. PROCESSQuality meat could mean:
A high-quality cut of meat (ex. filet mignon)
A high-quality method of raising meat (ex. free range, hormone-free)
QUALITY = ?Terms used to describe quality (like “clean” or “sustainable”) mean different things at
different restaurants.Clarify what they mean where you love to eat.
QUALITY vs. CALORIEHigher-quality is not
necessarily healthier, especially in terms of
calorie count.(i.e. a grass-fed burger is
still a burger)
KEEP LEARNINGLearn about how to build a healthy diet (however
you define “healthy”).Explore food issues
(ex. contamination reflects operations, not
sustainable processes)

• Championing the business case behind reducing and moving away from red meat for health & environment benefits
• Standardizing measurement of quality (organic, hormone-free) and educating the general public
Business Implications for Public Health and Environmental Institutions
• Sharing a variety of best practices in meat-light menu design to restaurants and catering services in the US
• Promoting application of “the sustainable mindset” to the entire value chain: sourcing, processing, labor management, etc.

Thank you!

Appendix

Regression #1: ROE (TTM) vs. % Beef
2025
3035
TTM
RO
E
0 20 40 60 80% Beef
Increase in % beef items on menu correlated with decrease in ROE
P value of .709 not statistically significant – not surprising because yearly ROE is volatile for restaurant
companies

Regression #2: 5Y ROE vs. % Beef
-20
020
4060
Avg
5Y R
OE
0 20 40 60 80% Beef
Avg
. 5-Y
ear R
OE
Stronger evidence of negative correlation between % beef and ROE
P value of .061 statistically significant at a 10% significance level – reflects
that a restaurant company’s ROE over 5-year horizon is more stable than ROE over 12-month horizon

Regression #3: TTM ROE vs. % Beef+ Meat Quality + Quality * %Beef
1% increase in beef associated with 0.20% decrease in TTM ROE for traditional restaurants (no quality meat)
1% increase in beef associated with 0.15% decrease in TTM ROE for quality meat restaurants
Also note that having higher-quality meat correlated with a decrease in TTM ROE by 27%
P-values are high, so not statistically significant
Serving quality meat correlated with lower decrease in ROE per 1% increase in beef

Regression #4: 5Y ROE vs. % Beef+ Meat Quality + Quality * %Beef
1% increase in beef associated with 1.45% decrease in 5YR ROE for traditional restaurants (no quality meat)
1% increase in beef associated with 0.42% decrease in 5YR ROE for quality meat restaurants
Also note that having higher-quality meat correlated with a decrease in 5YR ROE by 47%
Our results are statistically significant
Statistically significant evidence that increase in % beef for quality meat restaurants is associated with a smaller drop in ROE than for traditional restaurants

Regression #5: 5Y ROE vs. % Beef+ Meat Quality + Quality * %Beef + Scandals + Age
1% increase in beef associated with 1.59% decrease in 5YR ROE for traditional joints
1% increase in beef associated with 0.32% decrease in 5YR ROE for quality meat restaurants
Also note that having higher-quality meat correlated with a decrease in 5YR ROE by 48%
P values are somewhat greater, but robustness is confirmed
The relationship between 5Y ROE, % Beef, and Quality holds up