what drives the market value of firms in the defense industry?
TRANSCRIPT

HAL Id: halshs-00115655https://halshs.archives-ouvertes.fr/halshs-00115655
Submitted on 22 Nov 2006
HAL is a multi-disciplinary open accessarchive for the deposit and dissemination of sci-entific research documents, whether they are pub-lished or not. The documents may come fromteaching and research institutions in France orabroad, or from public or private research centers.
L’archive ouverte pluridisciplinaire HAL, estdestinée au dépôt et à la diffusion de documentsscientifiques de niveau recherche, publiés ou non,émanant des établissements d’enseignement et derecherche français ou étrangers, des laboratoirespublics ou privés.
What drives the market value of firms in the defenseindustry?
Gunther Capelle-Blancard, Nicolas Couderc
To cite this version:Gunther Capelle-Blancard, Nicolas Couderc. What drives the market value of firms in the defenseindustry?. 2006. �halshs-00115655�

Maison des Sciences Économiques, 106-112 boulevard de L'Hôpital, 75647 Paris Cedex 13http://mse.univ-paris1.fr/Publicat.htm
ISSN : 1624-0340
Centre d’Economie de la SorbonneUMR 8174
What drives the market value of
firms in the Defense industry!?
Gunther CAPELLE-BLANCARD
Nicolas COUDERC
2006.37

What drives the market value offirms in the Defense industry?‡
Gunther Capelle-Blancard*
Nicolas Couderc**
First version: Dec. 2005
This version: 12 April 2006
‡ The authors thank Stéphanie Monjon, Julien Vauday and Sylvain Daffix for helpfulcomments. We also would like to thank Betsy Annen and Christine Stachowiak for excellentresearch assistance. Any remaining errors are ours. Financial support from the Observatoireéconomique de la défense (French Ministry of Defense) is acknowledged.* EconomiX Université Paris X Nanterre, CES Université Paris 1 & CNRS. Email:[email protected].** Corresponding author. Centre d’Economie de la Sorbonne (CES), Université Paris 1 &CNRS. 106-112 Bd de l’Hôpital 75647 Paris Cedex 13. Phone: 33 1 44 07 82 71. Email:[email protected].

2
Quels évènements influencent la capitalisation boursière
des entreprises de la Défense ?
Résumé: Cet article vise à mesurer l’influence relative de différents types d’informations sur
le cours boursiers d’entreprises du secteur de la Défense, au moyen d’une étude d’évènements
systématique sur 58 grandes entreprises de la Défense, sur la période 1995-2005. Dans un
premier temps, nous identifions les rendements boursiers anormaux statistiquement
significatifs pour chaque entreprise. Dans un second temps, nous procédons à une recherche
d’informations susceptibles d’expliquer ces rendements anormaux. Nos résultats montrent que
les cours boursiers des entreprises de la Défense sont affectés, comme ceux des autres
secteurs, par les annonces de bénéfices et de résultats, par la publication de recommendations
d’analystes, etc. Le secteur de la Défense possède toutefois plusieurs spécificités, puisque les
évènements géopolitiques, les informations liées aux contrats, et celles liées aux opérations de
fusion-acquisitions pèsent d’un poids particulier sur les cours de ces entreprises.
Mots-clés : Etude d’évènements, marchés financiers, secteur de la Défense, publication
d’informations, modèles GARCH.
Classification JEL : G14, G34, L64.
What Drives the Market Value of Firms in the Defense Industry?
Abstract: This paper investigates the relative importance of different types of news in driving
significant stock price changes of firms in the defense industry. We implement a systematic
event study with a sample of the 58 largest publicly listed companies in the defense industry,
over the time period 1995-2005. We first identify, for each firm, the statistically significant
abnormal returns over the time period, and then we look for information releases likely to
cause such stock price movements. We find that stock price movements in the defense
industry are, in many ways, influenced by the same events as in other industries (key role of
formal earnings announcements or analysts’ recommendations) but this industry also has
some specific features, in particular the influence of geopolitical events and the relevance and
frequency of bids and contracts on stock prices.
Keywords: Event study, financial markets, defense industry, information releases, GARCH
models.

3
1. Introduction
This paper investigates the relative importance of different types of news in driving
significant changes in firms’ market value in the defense industry. Many studies place great
emphasis on the changing nature of the defense industry. Since the end of the Cold War,
almost all defense firms have been affected by liberalization and far-reaching structural
changes and concentration processes, and one can argue that defense firms have now lost their
singular status. However, some specific features of the defense industry remain: the oligopoly
structure of the market, the close relationships between defense firms and governments, the
key role of public budgets devoted to military expenditure, the high level of R&D, the
influence on firms of geopolitical events, etc.
While many studies focus on the specificities of the defense industry (see, for instance,
Markusen and Costigan, 1999; Susman and O’Keefe, 1999), none of them, to our knowledge,
examine this issue from the financial market point of view. But as financial markets play an
increasingly significant role in resource allocation, there is a need for a better understanding
of investor behavior vis-à-vis the defense industry. Therefore, this paper attempts to
contribute to the debate by addressing the following question: are the specific features of the
defense firms important from the investor point of view? In other words, does the stock
market react differently for defense firms than for other firms?
In particular, we analyze the relative impact of rumors, formal announcements, and
unforeseeable events on the stock returns of defense firms. We study also whether investors in
defense firms react more to firm-specific news or to general news (geopolitical instability,
announcements of military expenditures, etc.), and whether they react more to financial or to
industrial concerns. We finally assess the relative significance of seventeen categories of news
(news related to bids, earnings, company restructuring, new contracts, etc.) in driving the
market value of defense firms.
Given our goals, one would conduct a standard event study. Event study is a tool widely used
in finance to investigate the reaction of the stock market to a specific type of news or event
(such as mergers, seasoned equity offerings, earnings forecasts, etc.). However, we cannot
adopt the traditional event study methodology, focusing on a single or even several a priori
defined types of news because there is no way of being sure to capture the news items that are
the strongest stock price movers, all the more so since the defense industry is expected to be

4
specific. In addition, the results would always be conditional on the initial definition of the
categories. We therefore adopt a different research design, based upon a new methodology,
following Ryan and Taffler (2004). With this approach, we are not constrained by an a priori
determined set of information events. We first identify, for a given firm, the statistically
significant abnormal stock returns over the time period. We then look for for information
releases likely to cause such abnormal returns, focusing on the largest variations (the five
largest increases and the five largest decreases). On the methodological side, the contribution
of this paper is twofold: we consider time-varying beta estimates by implementing rolling
regressions and we use a GARCH process to model the volatility.
Our main results can be summarized as follows. First, changes in the market value of firms in
the defense industry are, in many ways, driven by the same forces as in other industries. The
most important news categories for explaining abnormal returns are roughly the same
(earnings announcements, analysts’ recommendations, etc.), and one third of the largest
significant stock price changes are not related to an information release (i.e. are unexplained),
which is consistent with the results of Ryan and Tafler (2004) on a broad sample of firms.
Nevertheless, three specific features of the defense industry must be underlined: i) The high
frequency of bid-related news: nearly 15% of our sample of the largest abnormal returns are
related to such announcements. ii) The relevance of geopolitical events: 8.1% of our sample
of the largest abnormal returns is due to such events. iii) The importance of public military
spending: 5.4% of our sample of the largest abnormal returns is driven by this type of news.
The paper proceeds as follows. The next section (section 2) presents the sample selection,
while Section 3 is about methodology. Section 4 provides both a quantitative and a qualitative
analysis of our results. The final section serves as the conclusion.
2. Data
The first step in conducting the study is to define the sample of defense-related firms. In order
to have a representative sample and to avoid any selection bias, we start with the 2003 edition
of the “World Top 100 Defense Firms”, a ranking published annually since 1991 by Defense
News Media Group, a subdivision of Army Times Publishing Company. The ranking is based
on annual defense sales. The average defense revenue is about USD 2.4 billion and the

5
standard error is above USD 5 billion (see Table 1 for descriptive statistics). The biggest
defense firm is Lockheed Martin1; its defense revenue is more than USD 30 billion. At the
other end of the spectrum, Baltiisky Zavod has defense revenue of USD 260 million. If US
firms represent nearly half of the population (42 firms out of 100 and 5 of the top 6), firms
from 18 other countries also figure in the ranking: 19 firms from continental Europe, 11 from
the UK, 8 from Japan, 7 from Russia, etc. US firms also account for nearly 2/3 of the total
defense revenue (USD 160 billion), followed by UK firms (27 billion).
In order to obtain a coherent sample for our study, we apply some exclusion criteria. As we
are only interested in publicly listed companies, we drop out of the sample:
- fully and partly state-owned firms (6 firms: DCN, Israel Aircraft Industries, GIAT
Industries, Ruag Suisse, Rafael Armament Development Authority, Israel Military
Industries);
- family-owned firms (2 firms: Krauss-Maffei Wegmann and Diehl Stiftung);
- firms with one dominant shareholder or with a low (below 25%) free float rate (3 firms:
IZAR Construcciones Navales, Fincantieri, QinetiQ).
As a second criterion, we drop out of the sample all firms with defense revenue below 10% of
their total revenue in 2003 (10 firms: General Electric, Bechtel Group, Mitsubishi Electric,
Electronic Data Systems, NEC, Ericsson, Toshiba, Komatsu, Ishikawajima-Harima Heavy
Industries and Fuji Heavy Industries). After these exclusions, 79 firms were left in the sample.
We use daily stock returns for each firm. The stock prices series are extracted from
Datastream (Thomson Financial). After dropping 21 firms2 for which no data was available in
Datastream, we were left with the 58 firms that constitute our sample. The time period
extends from January 1995 to May 2005. Stock prices are adjusted for dividend payouts and
stock splits. The 58 firms are listed in Appendix 1.3
1 The biggest firm overall in the ranking is General Electric but its defense revenue only accounts for 2.3 % of itstotal revenue (USD 134 billion).2 Hindustan Aeronautics, Korea Aerospace Industries, Engineered Support Systems, MITRE, Denel, TheAerospace Corp., ADI, Aerospace Equipment, Battelle, Irkut, Ufa MPO, Tenix Defence, ARINC,Uralvagonzavod, MMPP Salyut, Baltiisky Zavod, Computer Sciences Corp., Science Applications InternationalCorp., Aviation Holding Company Sukhoi and Booz Allen Hamilton.3 Additional statistics about stock market capitalization, traded volume, P/E ratio, book-to-market ratio, etc.extracted from Datastream are available upon request.

6
Table 1. Descriptive statistics
Initial sample
(World Top 100 Defense)
Final sample
(58 publicly listed defense firms)2003
(USD millions) Totalrevenue
Defenserevenue
%Total
revenueDefenserevenue
%
Minimum 310 260 1 460 272 10
Maximum 134,200 30,097 100 50,500 30,097 100
Median 1,968 843 51 2,433 1,111 58
Mean 8,575 2,458 53 7,715 3,591 60
Standard Error 16,926 5,040 32 10,752 4,363 26
3. Methodology
We present in this section the general methodology of event studies, then the methodology we
adopted, focusing on the distinguishing features of our methodology compared to the
traditional one.
3.1. The general methodology of event studies
The event study methodology is designed to investigate the reaction of the stock market to
news or events concerning a firm, an industry or the whole stock market. The basic
underpinning of event studies is the efficient market hypothesis (Fama, 1969), which states
that as new information becomes available, it is fully taken into account by investors
assessing its current and future impact. Under this hypothesis, stock price changes reflect the
discounted value of current and future firm performance. Investors’ reaction to a given
information release (i.e. a news item) can be measured simply by comparing the observed
return during a given time period following the event to the expected return in absence of any
event; this difference is called the “abnormal return”. If investors react (un)favorably to an
event, we would expect (negative) positive significant abnormal stock returns. The strength of

7
the event study approach is that it is based on the overall assessment of many investors who
quickly process all available information in assessing each firm’s market value.
Event study methodology has been widely used in finance (see Brown and Warner, 1985;
MacKinlay, 1997; Binder, 1998; Kothari and Warner, 2005). Kothari and Warner (2005) list
more than 565 event studies published between 1974 and 2000 in the 5 leading finance
journals. The number of papers per year increased in the 1980’s and has been quite stable
since then. For instance, numerous event studies have been devoted to the impact of shares
distributions, earnings and/or dividends, mergers, technological accidents, massive layoffs,
etc.
Two critical points in the conduct of an event-study are: the estimation of the expected
(theoretical) returns and the selection of the events to be studied. First, one must use a model
to estimate the expected returns for each stock. In general, the market model is chosen.
Second, one must be careful in defining the nature of the event and the precise date of the
information release, which is not necessarily the event date (Henderson, 1990). Moreover, the
choice of news source is important: Glascock, Davidson and Henderson (1987) show that the
Wall Street Journal, often chosen as the news source, does not publish all the news, and
publishes some news with a delay, introducing a bias in the sample. Practically-speaking, a
lack of precision in dating and selecting the events can cause a loss of power of the statistical
tests of significance (Brown and Warner, 1980, 1985).
Since we want to identify the main type of news driving stock price changes and assess the
relative importance of this news, the traditional event study methodology is not really
suitable, because we cannot content ourselves with one a priori defined type of news.
Following the methodology introduced by Thompson, Olsen and Dietrich (1987)4, with
twelve a priori categories of news, would not be consistent with our goals: with such a priori
defined categories, there is no way of being sure to capture the news events that are the
strongest stock price movers; furthermore, the results would always be conditional on the
initial definition of the categories5.
4 Same or similar methodology is adopted by Pritamani and Singal (2001) with seven a priori categories ofnews. See also Cutler, Poterba and Summers (1989).5 Another concern with this approach is that the authors consider raw returns instead of abnormal returns, that isthey do not take into account the general trend on the market and the idiosyncratic risk of each stock.

8
3.2. A time varying GARCH event study
In this paper, we adopt an alternative methodology to the traditional one. Instead of
conducting our study with an a priori defined type of event, we investigate all the abnormal
returns for each stock during the time period under study. We then search for explanations of
these abnormal returns. The advantages of this methodology are that we can really investigate
what kind of news is really driving the stock price movements, without any prior framework,
and that we are free from selection bias in the definition of events. We follow a two-step
estimation strategy. We first perform a set of rolling regressions to estimate expected returns
for each stock and each trading day from 1995 to 2005 and compute the daily abnormal
returns. Then, we select the dates where the daily abnormal returns are statistically significant
and we search for plausible explanations.
Here we closely follow Ryan and Taffler (2004) (see also Lardic and Mignon, 2002), but we
improve their methodology in two ways: we take into account conditional heteroskedasticity,
and we implement time-varying estimations.
A market model with conditional heteroskedasticity
For each of the 58 firms of our sample, we apply the following method over a (maximum)
time period of 10 years (1995 to 2005). We implement a methodology that incorporates time-
varying market risk and time-varying heteroskedastic error structure into the baseline market
model. For any stock, the market model is estimated on a 120-day window:
jijmiiji RR ,,, eba ++= with j = -120,…, -1 (1)
with jiR , the daily stock return of stock i at time j, jmR , the daily market return at time j, ia
and ib two parameters to be estimated, and ji,e the residuals, with a zero mean normal
distribution and a 2, jis variance.
The parameters of the market model are usually estimated using OLS regression. These
parameters are then used to calculate abnormal returns. But such a method is based on strong
statistical assumptions. In particular, it is assumed that the error term ji,e is temporally
uncorrelated and follows a normal distribution with constant variance. However, there is

9
overwhelming evidence that these assumptions are not fulfilled: individual stocks are
correlated, with large returns (whatever sign) that tend to be followed by further large returns
(of either sign) and variance is heteroskedastic (Henderson, 1990; Campbell, Lo and
MacKinlay, 1997). Brown and Warner (1980, 1985) point out that the power of tests can be
improved by appropriately modeling the volatility process. A number of studies (Boehmer,
Musumeci, and Poulsen, 1991; De Jong, Kemna, and Kloek, 1992; Brockett, Chen and
Garven, 1999; Savickas, 2003; Harrington and Shrider, 2006) have proposed event study
methodologies that extend the basic market model methodology to include either ARCH or
GARCH structures (Bollerslev, 1986).
In this study, a GARCH(1,1) framework is used to estimate the market model (i.e. we assume
a non-constant variance during the time period under review). In this framework, equation (1)
is the mean equation, and the conditional variance equation is:
21,
21,
2, -- ++= jiijiiiji cba ess (2)
with 2
1, -jie the lagged squared residuals of equation (1) and a, b and c three parameters which
are estimated by the maximum likelihood method.
The rolling regression routine
The aim of the paper is to examine information events that drive significant stock price
changes for the defense industry. Prior studies usually assume that the beta is constant over
time.6 However, the beta may change after significant price movements. Accordingly, we
adopt a time-varying coefficient market model. More precisely, for each firm in our sample,
we compute 120-day rolling regression estimates, incremented by 1 day. That is, for each
firm, the market model parameters are estimated on a time-varying window j = [-120; -1] for
each day t.
jtijtmtitijti RR +++ ++= ,,,,, eba (3)
6 For instance, Ryan and Taffler (2004) used betas from the London Business School Risk Measurement Servicewhich are computed on the previous calendar year, i.e. before the beginning of their sample.

10
We obtain a maximum of 2,575 estimates per firm (2,695 returns between January 1995 and
May 2005 minus 120 days), that is, about 125,000 estimates in total.
For the whole time period, the average return of firms included in the sample is above the
average market return: in annualized figures, nearly 12% against only 6% for the market (see
Appendix 2). The highest return rate is for United Defense Industries (+45.5% per year on
average, between 2001 and 2005). At the other extreme, the market capitalizations of
Kawasaki Heavy Industries, Mitsubishi Heavy, Silicon Graphics and Bearing Point decreased
over the time period. For the whole time period, the annual average volatility, measured by a
GARCH(1,1) process, is at a conventional level, from 3.50% for Ultra Electronics to 17.5%
for Silicon Graphics. The average systematic risk is 0.66, from 0.16 for VT Group to 1.37 for
Bearing Point.
The abnormal returns
Once the parameters of both equations are estimated, one can obtain the expected or
theoretical return for each stock i on day t, just by using the following equation:
tmtititi RR ,,,,ˆˆˆ ba += (4)
and, as usual, the abnormal returns at time t are simply the difference between the expected
and the observed returns at this time:
tmtitititi RRAR ,,,,,
^ˆˆˆ ba --= (5)
In this study, since our ultimate goal is to determine the events that drive stock prices in the
defense industry, we are not interested in cumulative abnormal returns (CAR) or average
abnormal returns (AAR). But we still have to compute the t-stat indicating the significance of
each daily abnormal return. As we use a GARCH structure, the t-stat takes into account the
fact that the variance is not constant:
ti
ti
ti
ARstatt
,
,
^
, s=- (6)

11
Under the null hypothesis that the abnormal return is zero, this statistic is distributed as the
normal standard distribution.
3.3 Matching of largest abnormal returns to news
To explore the information events which drive stock market capitalization in the defense
industry, we have to assign abnormal returns to one information release. In this paper, we
adopt a conservative approach as we match the 10 largest significant price changes (5 up and
5 down) for each stock to news events. One can interpret our objective as to find, for each
abnormal return, a related piece of news or announcement likely to explain it.
The information source we used is the Lexis-Nexis database (Reed-Elsevier), a database of
more than 11,000 newspapers and magazines, including some specifically devoted to the
defense industry (e.g. Aerospace Daily, Air Force Times, Aviation Week’s Homeland Security
& Defense, Avionics, Defense Daily, Defense News, Defense and Security, IAC Aerospace &
Defense, Inside the Pentagon, etc.) and all the major world financial newspapers (Wall Street
Journal, Financial Times, etc . ) .7 Following an usual procedure, we constrain our
investigations to an event window of 10 days centered on the day of the stock price movement
to avoid potential data mining. To ensure an unbiased and reliable matching, we first collect
all the news concerning the firm under review for the relevant time period. Then we analyze
the information, searching for all the possible explanations of the stock price movement and
excluding general information, such as business history, interviews with the managers in
which no new information is provided, etc.8
The next step was to create homogenous groups of news, assigning each news release to one
of the news categories detailed in Appendix 2. This typology was established following prior
research (Thomson, Olsen and Dietrich, 1987; Pritamani and Singal, 2001; Ryan and Taffler,
2004) and extended to specific areas closely related to the defense industry (e.g. geopolitical
events, military budget changes, etc.). When a news release does not correspond to any
existing category, a new category was added to the typology. At the end, there are seventeen
7 The sample considered by Ryan and Taffler (2004) consists of all industrial companies in the FTSE 100 andFTSE Mid-250 indices (excluding financials) for the two-year period (1st January, 1994 to 31st December, 1995).They use the following data sources: the London Stock Exchange Regulatory News Service, the FinancialTimes, and McCarthy Information.8 Complete results of the matching process are available on request.

12
news categories including: “information available but non-related to the defense industry”
(e.g. Saab announces an increase in its car sales) plus a “no information available” category.9
4. Empirical results
Prior to examining what type of news influences stock prices in the defense industry, we first
have to investigate the overall distribution of the significant abnormal returns. In a second
step, we elaborate a broad typology where we distinguish between i) rumors, announcements
and unforeseeable events; ii) general and firm-related events; iii) financial and industrial
news. In a third step, we refine the previous typology and use a seventeen item classification
to underline the respective relevance of bids, strategic alliances between firms, and company
restructuring as stock movers. Finally, we focus on the impact of the September 11 terrorist
attacks on defense firms.
4.1. Overall analysis of significant abnormal returns
Table 2 gives some descriptive statistics about the distribution of all daily abnormal returns.
We consider three panels: i) abnormal returns significant at 5%, ii) abnormal returns
significant at 1%, and iii) the five largest abnormal increases and the five largest abnormal
decreases for each firm.
For the whole sample, 7,530 daily abnormal returns are significant at 5% and 3,230 at 1%.10
Of these 7,530 significant abnormal returns, 56% are positive, 25% are below –4.46% and
25% are above 5.26%. We obtain approximately the same proportions with the abnormal
returns significant at 1%. The distribution of the event sample exhibits a characteristic two-
peak distribution (see figure 1), since we drop out of the sample all the abnormal returns non-
significant at 5%.
9 This matching between a news release and the category that describes it best was done by hand, by the twoauthors, independently. In more than 94% of the cases, the two researchers chose the same news category.Nevertheless, the choices for the remaining 6% of cases were not the same. For all these cases, an agreement wasfound after meeting and discussion between the two researchers; see also Ryan and Taffler (2004). The resultsdetailed and discussed in section 4 remain unchanged if we exclude these cases from the sample.10 For a total number of observations (number of firms times number of days in the time period) ofapproximately 150,000. This means that about 5% of the abnormal returns are significant at 5% and 2% aresignificant at 1%.

Table 2. Frequency and distribution of significant abnormal returns, 1995-2005
Observed
returnAbnormal returns
significant at the 5% levelAbnormal returns
significant at the 1% levelLargest abnormal returns
all up down all up down all up down
Mean 0.70% 0.6% 5.8% – 5.9% 0.8% 7.3% – 7.8% – 0.8% 12.1% – 13.8%
Minimum – 77.7% – 75.6% 0.5% – 75.6% – 75.6% 0.7% – 75.6% – 75.60% 2.6% – 75.60%
First quart. – 4.4% – 4.5% 3.7% – 6.7% – 5.7% 4.6% – 9.0% – 11.5% 8.0% – 14.9%
Median 2.7% 2.9% 4.9% – 4.8% 3.8% 6.3% – 6.3% – 0.4% 10.4% – 11.5%
Third quart. 5.4% 5.3% 6.9% – 3.6% 6.8% 8.6% – 4.6% 10.4% 13.8% – 8.5%
Maximum 56.7% 56.8% 56.8% – 0.6% 56.8% 56.8% – 1.0% 56.8% 56.8% – 3.5%
Nb. 7,530 4,211 3,319 3,230 1,845 1,385 580 290 290
% 100% 56% 44% 100% 57% 43% 100% 50% 50%
By firm (avg.) 121 68 54 52 30 22 10 5 5
Note: Abnormal returns are computed given the market model parameters which are estimated with conditional heteroskedasticity GARCH(1,1)by the maximum likelihood method through the estimation window [-120; -1] in event time. Largest abnormal returns are defined as the fivelargest abnormal increases and the five largest abnormal decreases for each firm. The sample contains 58 publicly listed firms included in the“World Top 100 Defense firms”. The time period extends from January 1995 to May 2005.

Figure 1. Significant abnormal returns distribution, all sample, 1995-2005
0%
2%
4%
6%
8%
10%
12%
-75%
-70%
-65%
-60%
-55%
-50%
-45%
-40%
-35%
-30%
-25%
-20%
-15%
-10% -5
% 0% 5% 10%
15%
20%
25%
30%
35%
40%
45%
50%
55%
Note: All significant abnormal returns at the 5% level in our sample. Abnormal returns are computed given themarket model parameters which are estimated with conditional heteroskedasticity GARCH(1,1) by themaximum likelihood method through the estimation window [-120; -1] in event time. The sample contains 58publicly listed firms included in the “World Top 100 Defense firms”. The time period extends from January1995 to May 2005.
Concerning the distribution over time, (cf. Figure 2), quite surprisingly, 2001 is not the year
with the highest number of significant abnormal returns. But the concentration of the events is
consistent with common sense, with 83 abnormal returns in the 10-day period following the
9-11 events (nearly 10% of all the 2001 abnormal returns). The other terrorist attacks are not
followed by such a high number of abnormal returns: in the 10 days following the terrorist
attack on Madrid train stations (March 2004), there are 12 abnormal returns, less than the
average on the year.

15
Figure 2. Significant abnormal return distribution by year, 1995-2005
470
598
682
828 813
908873
931
667
591
368
0
100
200
300
400
500
600
700
800
900
1000
1995 1996 1997 1998 1999 2000 2001 2002 2003 2004 2005
Note: Number of significant abnormal returns at the 5% level in our sample for each year. Abnormal returns arecomputed given the market model parameters which are estimated with conditional heteroskedasticityGARCH(1,1) by the maximum likelihood method through the estimation window [-120; -1] in event time. Thesample contains 58 publicly listed firms included in the “World Top 100 Defense firms”. The time periodextends from January 1995 to May 2005. For 2005, the observed figure for the first half of the year istransformed into an annual figure.
We focus in the following analysis on the five largest abnormal increases and five largest
abnormal decreases of the stock price for each firm. This focus was made in order to avoid the
data mining problem which would arise if we tried to match each abnormal return with an
event. With our restrictive definition of the sample (580 events: 10 events for 58 firms), we
are almost certain that these large stock price movements have an explanation, that they are
not just noise.
4.2 What type of news influence stock prices?
Table 3 summarizes the results of the matching process between the largest abnormal returns
and news. First, we present the percentage of the largest abnormal returns related to publicly
available news. Then, we consider three criteria: Is the news a rumor, an announcement or an
unforeseeable event? Is the news general or firm-related? Is the news related to financial or
industrial concerns? In the following subsection we refine our typology, breaking it down into
seventeen categories.

16
Table 3. What type of news causes a stock price change?
All events Good news Bad news Good minus Bad
No news 29.9% 25.9% 33.8% -7.9% **
News 70.1% 74.1% 66.2% 7.9% **
Of which…
Rumor 11.3 % 12.5% 9.9% 2.6%
Announcement or news 80.7 % 81.7% 79.9% 1.8%
Unforeseeable event 8.0 % 5.8% 10.2% -4.4% *
Of which…
General news 11.1% 9.2% 13.0% -3.8%
Firm-related news 88.9% 90.8% 87.0% 3.8%
Of which…
Financial news 60.2% 52.6% 68.8% -16.2% **
Industrial news 23.8% 33.0% 13.5% 19.5% **
Other news 16.0% 14.4% 17.7% -3.3%
In columns 2, 3 and 4 we give the percentage of total abnormal returns the category represents. In the lastcolumn, we use the following Z-statistics for the difference between two proportions:Z = (p1 – p2) / ÷ [ p1(1 – p1)/N1 + p2(1 – p2)/N2 ].
** and * indicate significance at the 1% and the 5% level.
To what extent does publicly available news drive abnormal returns? Despite our
conservative approach in the selection of abnormal returns, it is striking to note that when
analyzing the type of news driving the largest significant stock price changes, the ratio of
significant abnormal returns not related to news is very high: nearly a third of all stock price
changes remain unexplained. Our results are in line with those of Ryan and Taffler (2004): in
their study, 35% of the stock price movements are not related to firm-specific news, this
figure increasing to 45% for the smallest firms of their sample (firms listed in the FTSE-
Mid250). Two alternative explanations can be proposed to explain the high ratio of significant
abnormal returns not related to news. First, one could argue that our methodological approach
does not allow us to capture all the pertinent sources of publicly available information about
defense products, costs or prospects. It is a well-known fact that disclosure of information is
directly related to firm size (Grant, 1980; Atiase, 1985). Indeed, some firms included in our
sample are quite small. But, the number of newspapers and other sources of information
included in the Lexis-Nexis database seems to invalidate this explanation. Second, given the

17
size of the significant abnormal returns (the five largest increases and the five largest
decreases), it is reasonable to assume the existence of non-publicly available information. The
higher percentage of “no news” for the largest negative abnormal returns relative to the
largest positive abnormal returns (34% against 26%, a difference that is statistically
significant at the 1% level) is also puzzling.
Is the news a rumor, an announcement or an unforeseeable event? In 11% of all the largest
abnormal returns that can be related to an information release, the information is provided in
the conditional mode, i.e. subject to confirmation, not verified or affirmed. This figure,
together with the high percentage of unexplained stock price changes, makes it reasonable to
assume the existence of private information able to influence stock prices. We also note that
8% of the events are totally unforeseeable, such as the terrorist attacks. Given our sample time
period (1995-2005), it is not surprising that negative unforeseeable events are significantly
more frequent than positive ones (10% against 6%).
Is the news general or firm-related? Turning to the general characteristics of news
influencing the stock prices of defense industry firms, we observe that firm-related news is far
more frequent (nine news items out of ten) than news related to the defense industry or to
geopolitical or macroeconomic matters (one out of ten).
Is the news related to financial or industrial concerns? More interesting is the predominance
of finance-related news (60%) over industry-related news (24%). This result is not the
consequence of an initial bias in the news sample because, for a particular firm during a given
month, the number of news items related to financial matters is roughly equal to the number
related to industrial matters.11 One explanation can be given in terms of stock market
anticipations. Since industrial news consists essentially of announcements of new contracts,
new products or new investments, and given that the time period needed to do a deal or to
launch a new product in the defense industry is long, this news is more easily anticipated by
stock market investors. More difficult to anticipate are, for instance, earnings revisions,
analysts’ recommendations, or bid announcements.
11 Given the size of the initial sample of news in Lexis-Nexis, a systematic analysis of this point could not bedone. We have only checked the total number of news items related to each firm for a random month during thewhole time period under review. Considering all firms, the ratio of financial news to industrial news (neglectingthe ‘other’ news) ranges between 0.70 and 1.5, far below the ratio of 3 between the financial news and theindustrial news driving a significant abnormal return (60.2% against 23.8%).

18
4.3 The relative importance of earnings, bids and other news releases
We analyze in this subsection the precise type of news driving the stock prices of firms in the
defense industry (see Table 4).12
Table 4. News categories influencing stock price changes
All events Good news Bad news Good minus Bad
EARNINGS 66 16.2% 32 14.7% 34 18.0% -3.3%
BIDS 59 14.5% 41 18.8% 18 9.5% 9.3%
CONTRACT 55 13.5% 48 22.0% 7 3.7% 18.3% *
ANALYST 48 11.8% 24 11.0% 24 12.7% -1.7%WARNING 34 8.4% 0 0.0% 34 18.0% -18.0% **
POLITICS 33 8.1% 15 6.9% 18 9.5% -2.6%PUBSPEND 22 5.4% 13 6.0% 9 4.8% 1.2%SHAREDEAL 21 5.2% 8 3.7% 13 6.9% -3.2%PRODUCT 15 3.7% 10 4.6% 5 2.6% 2.0%PROSPECT 11 2.7% 4 1.8% 7 3.7% -1.9%FINANCE 11 2.7% 6 2.8% 5 2.6% 0.2%MANAG 10 2.5% 7 3.2% 3 1.6% 1.6%STRAT 7 1.7% 5 2.3% 2 1.1% 1.2%LEGAL 6 1.5% 2 0.9% 4 2.1% -1.2%RESTRUCT 4 1.0% 2 0.9% 2 1.1% -0.2%NODEF 3 0.7% 0 0.0% 3 1.6% -1.6%LABOR 2 0.5% 1 0.5% 1 0.5% 0.0%Total 407 100.0% 218 100.0% 189 100.0%
In columns 3, 5 and 7 we give the percentage the category represents of total abnormal returns. In thelast column, we use the following Z-statistics for the difference between two proportions: Z = (p1 – p2)/ ÷ [ p1(1 – p1)/N1 + p2(1 – p2)/N2 ]. ** and * indicate significance at the 1% and the 5% level.
A parsimonious set of news categories explains a high proportion of all the largest abnormal
returns. The first category accounts for 16% of all the explained price changes. When looking
only at the top 4 categories, the figure goes up to 56%. We find, in this top 4, earnings
announcements, bid announcements or published rumors about bids, news related to the
conclusion or cancellation of contracts and analysts' recommendations. Our subsequent
analysis will mainly focus on the items accounting for more than 5% of the sample (i.e. the
first eight news categories). The figures for the other items are clearly too weak. Moreover, an

19
analysis of the differences between the median abnormal return by news category was
conducted, but did not produce any clear differences between the various news categories. We
therefore do not reproduce these results.
EARNINGS related news releases are the most frequent factor influencing the market value
of firms in the defense industry. This category includes all the formal accounting releases,
earnings forecast revisions by the firm – excluding earnings forecasts and recommendations
published by analysts (ANALYST) and profit warnings (WARNING). If the key role of
earnings forecast revisions was expected, it is surprising to note that nearly one third of all the
news releases included in the EARNINGS category are formal accounting releases: although
they are likely to be anticipated, they have a significant impact on share prices. The key role
of profit warnings (WARNING) on share prices can be analyzed in the same way. They
represent 18% of the ‘bad news’ influencing stock prices, the most frequent type of news
related to a decrease in a stock price (and no profit warning is associated with an increase in
the stock price, following common sense). This demonstrates how formal accounting releases
or forecast revisions have a significant effect on the market’s consensus forecasts.
The BIDS category accounts for 14.5% of the total number of the largest abnormal returns
explained by publicly available information (and 70% of the bid-related news is ‘good’ news).
For the general sample used by Ryan and Taffler (2004) the equivalent figure is only 8.3%. It
would appear, then, that bids and take-over related news are more frequently stock price
movers in the defense industry than in other industries. This is consistent with the movement
of structural change observed over the past 15 years in the defense industry. Besides, for a
given firm, the proportion of news releases reporting an announcement or rumor of a bid
associated with a significant stock price variation is higher than for every other news
category13. Note also that private information appears to be prominent in the case of bids.
This category is the one with the highest number of news items reporting speculations or
rumors (more than 60%). And for this category, more than 75% of the news releases
explaining the stock price change are published some days after the change. This proportion
is higher than for any other category. The structural changes in the defense industry, analyzed
from the investor’s point of view, are mainly the work of bids. Company restructurings
12 News classification and examples are provided in Appendix 3.13 On average, a significant stock price variation is associated with more than 40% of the news items relating to abid announcement or rumor.

20
(RESTRUCT) or labor force reductions (LABOR) each account for less than 1% of the
sample.
Industry-related news is not very frequent in our sample. CONTRACT, that is announcements
or speculation about new contracts or cancellation of existing contracts, represents 13% of the
total number of cases. PRODUCT, that is news related to new products and expectations
regarding product launch or recall, accounts for less than 4%. One should note, however, that
these categories do not appear in the principal news categories in Ryan and Taffler (2004), as
their respective weight is under 4.7%. Accordingly, we can say that news about contracts and
new products has a larger influence on stock prices in the defense industry than in other
industries. A plausible explanation is simply that in the defense industry, only a few contracts
are concluded each year, each of them worth several USD millions.
The ANALYST category (recommendations and earnings forecasts that do not occur
simultaneously with any other news release) is the fourth market mover category. Analysts
contribute to the efficiency of stock markets by compiling, analyzing and processing (public
or private) information. As the ANALYST category accounts for nearly 12% of the news in
our sample, our results confirm that analyst recommendations add value and convey new
information to the market. There is no clear difference here in the value added by analysts for
investors in the defense industry compared to other industries, as Ryan and Taffler (2004)
report a figure of 10.5% with their diversified sample of firms with a comparable definition of
the category.
Geopolitical and macroeconomic events (POLITICS), probably due to a strong unforeseeable
dimension and the choice of our time period, have a clear effect on defense industry firms.
Among the main geopolitical events listed, we find the September 11 terrorist attacks (see
next sub-section), the concerns about the war in Iraq and in Afghanistan, and oil price related
news. News related to public spending (PUBSPEND) also play a significant role in significant
abnormal stock price changes. A skeptical reader may dismiss these results as simply
confirming the obvious, given the key role of the government as a customer of the defense
industry. We, in contrast, consider this result an important specific feature of the defense
industry. Ryan and Taffler (2004), with their heterogeneous sample of firms, do not even
mention this category, probably because they consider that firm-specific news are the main
market movers. Our results show that macroeconomic and geopolitical news cannot be
neglected for understanding market price changes in the defense industry.

21
The last category which accounts for more than 5% of our sample is SHAREDEAL. This
category groups together all information releases related to a significantly larger than average
trading volume in a firm’s stock that is not related to a bid: for instance, the sale of all the
shares owned by the dominant shareholder, or director share dealing. Comparing these results
with those of Ryan and Taffler (2004), we see that this category is less important for defense
firms than for other firms: 5.2% against 15.3% (8.5% for director share dealing + 6.8% for
other share dealings).
4.4 What is the effect of September 11?
Only two firms, out of our sample of 54 top firms in the defense industry14, were not affected
by the September 2001 terrorist attacks: Alvis, a British company ranked 62 in 2003 by
Defense News, and Kongsberg Gruppen, a Norwegian company ranked 78 in 2003. For all the
others, we find significant abnormal returns (either positive or negative) at the 5% level
around the date of the terrorist attacks.15 Table 5 presents these results.
Almost all firms in the defense industry reacted significantly to the terrorist attacks, but the
reaction is very different from one firm to another. Indeed, the reaction to the terrorist attacks
was positive for half of the 52 firms, and negative for the other half. For the 52 firms,
abnormal returns are large: the mean daily abnormal return is +14% for the former and –9%
for the latter (Panel A). These results illustrate the widespread co-existence of civil and
military activities. No one would be surprised to observe that Boeing and EADS (Airbus), for
instance, incurred a loss in their stock market capitalization. Moreover, we observe a strong
correlation between abnormal returns and the percentage of revenue from defense. When this
percentage is lower than 49%; the mean daily abnormal return is –3% while for the other half,
the mean daily abnormal return is 8% (Panel B).
14 The stock price time-series extracted from Datastream for Anteon, ManTech International, United DefenseIndustry, and Washington Group International begins after September 2001.15 As we compute daily abnormal returns, some firms exhibit several significant abnormal returns in September2001. For each firm, we only consider the first significant daily abnormal return following the terrorist attacks.Daily abnormal returns following September 11, 2001 are provided in Appendix 4. For more details, seeCapelle-Blancard, Couderc and Stachowiak (2006).

22
Table 5. Daily significant abnormal returns following September 11, 2001
Daily abnormalreturns
Revenue fromDefense
Daily abnormalreturns
Revenue fromDefense
Panel A Positive impact Negative impact# of firms 26 26Mean 14% 62% -9% 37%Median 11% 63% -7% 32%SD 8% 24% 6% 21%Min 3% 12% -28% 10%Max 35% 95% -3% 80%Panel B Revenue from Defense < 49% Revenue from Defense ≥ 49%# of firms 26 26Mean -3% 28% 8% 71%Median -5% 26% 8% 71%SD 12% 12% 14% 16%Min -28% 10% -16% 49%Max 22% 46% 35% 95%Panel C US + Canada Other countries# of firms 28 24Mean 6% 51% -2% 48%Median 10% 48% -4% 48%SD 16% 27% 7% 25%Min -28% 11% -20% 10%Max 35% 95% 9% 94%
Another interesting point is the stock market reaction of North American firms compared to
the others (Panel C). The mean daily abnormal return is 6% for the US and Canadian firms
against -2% for the others (the difference between the median is even larger).16 Chen and
Siems (2004) show that the decline in the U.S. and Canadian capital market, though
significantly different from zero, was not as great as eight of the other nine largest world
markets.17 They attribute this result to the depth of the North American stock market, the
calming effect of the closing of the U.S. capital markets until September 17 2001, and the
stability of the banking and financial sector. Another explanation could be the positive impact
of the terrorist attacks on several US firms which might benefit more from the new
geopolitical context.
16 Note that this result cannot be attributed to a different percentage of revenue from defense.17 For an examination of the impact of terrorism on stock markets, see also Karolyi and Martell (2005).

23
5. Conclusion
This study seeks to determine whether defense firms’ largest stock price changes are driven
by macroeconomic, microeconomic, or non-economic events, or just noise. The distinctive
features of the defense industry motivate such a study.
The traditional method of event studies is limited by the necessary a priori definition of the
categories of events. Therefore, we adopt an alternative methodology to explore the
relationship between information events and stock price changes. We first identify, for a
given firm, the statistically significant abnormal returns over the time period. Secondly, we
look for information releases likely to cause such abnormal returns. Moreover, we consider
time-varying beta estimates and a GARCH process to model the volatility. Our sample
consists of the 58 largest listed firms in the defense industry. For each firm, we focus mainly
on the 10 largest significant abnormal returns (5 up and 5 down) over the 1995-2005 time
period.
We show in this paper that the news driving the market value of defense firms is roughly the
same as for other industries. Formal accounting releases (earnings announcements, profit
warnings, etc.) play a key role in explaining the largest stock price changes. There is also
some evidence in favor of the existence of transactions motivated by private information,
since one third of the largest stock price changes are not related to an information release.
Nevertheless, the defense industry presents some specific features that distinguish it from
other industries. Firstly, the most striking difference is probably the key role played by bid
announcements or rumors, which account for nearly 15% of the stock prices changes.
Secondly, public military spending plays a key role as a driving force of stock prices in the
defense industry. This role is probably due to the relationship between public spending and
the number of contracts to be concluded with the defense industry. And the contract-related
news are an important stock price mover. Thirdly, the geopolitical context and geopolitical
events clearly influence stock prices of the defense industry in a specific way. In fact, nearly
all the firms react to geopolitical events, but the reaction is not uniform. In the September 11
case, the stock price reaction is largely correlated to the relative weight of the military and
civilian activities in each firm.

24
ReferencesAsquith P. R., R. F. Brunner and D. W. Mullins, 1983, The gains to bidding firms from merger,
Journal of Financial Economics, 11(1–4), 121-140.
Atiase R. K., 1985, Predisclosure Information, Firm capitalisation, and security price behaviouraround earnings announcements, Journal of Accounting Research, 23(1), 21-36.
Binder J. J., 1998, The event study methodology since 1969, Review of Quantitative Finance andAccounting, 11, 111-137.
Boehmer, E., J. Musumeci and A. Poulsen, 1991, Event study methodology under conditions of eventinduced variance, Journal of Financial Economics, 30, 253-272.
Bollerslev T., 1986, Generalized Autoregressive Conditional Heteroskedasticity, Journal ofEconometrics, 31, 307-327.
Brockett P. L., H. M. Chen and J. R. Garven, 1999, A new stochastically flexible event methodologywith application to Proposition 103, Insurance: Mathematics and Economics, 25, 197-217.
Brown S. and J. Warner, 1980, Measuring security price performance, Journal of FinancialEconomics, 8, 205-258.
Brown S. and J. Warner, 1985, Using daily stock returns, the case of event studies, Journal ofFinancial Economics, 14, 3-31.
Campbell J., A. Lo, and C. MacKinlay, 1997, The econometrics of financial markets, PrincetonUniversity Press, New Jersey.
Capelle-Blancard G., N. Couderc and Ch. Stachowiak, 2006, The impact of terrorism on stock marketcapitalization in the defense industry, Working Paper, University Paris 1 Panthéon-Sorbonne.
Chen A.H. and T.F. Siems, 2004, The effects of terrorism on global capital markets, European Journalof Political Economy, 20, 349–366.
Cutler D., J. Poterba and L. Summers, 1989, What drives stock prices, Journal of PortfolioManagement, 15, 4-12.
De Jong, F., A. Kemna, and T. Kloek, 1992, A Contribution to event study methodology with anapplication to the Dutch stock market, Journal of Banking and Finance, 16, 11-36.
Glascock J. L., W. N. Davidson and G. V. Henderson, 1987, Announcement effects of Moody’s bondrating changes on equity returns, Quarterly Journal of Business and Finance, 26, 67-78.
Grant E. B., 1980, Market implications of differential amounts of interim information, Journal ofAccounting Research, 18, 255-268.
Harrington S. and D. Shrider, 2006, All events induce variance: Estimating abnormal returns wheneffects vary across firms, Journal of Financial Quantitative Analysis, forthcoming.
Henderson G. V., 1990, Problems and solutions in conducting event studies, Journal of Risk andInsurance, 57(2), 282-306.
Karolyi G. A. and R. Martell, 2005, Terrorism and the stock market, Working Paper, The Ohio StateUniversity.
Kothari S.P. and J.B. Warner, 2005, Econometrics of event studies, in The Handbook of CorporateFinance: Empirical Corporate Finance, B. Espen Eckbo (ed.), Elsevier/North-Holland.
Lardic S. and Mignon V., 2002, Etude d’évènements sur données intraquotidiennes françaises: Lesréactions des actionnaires aux annonces, Revue d’Economie Financière, 66, 335-340.
MacKinlay A. C., 1997, Event studies in economics and finance, Journal of Economic Literature, 35,1, 13-39.
25
Markusen A.R. and S.S. Costigan, 1999, Arming the future: A defence industry for the 21st Century,Council on Foreign Relations Press, New York.
Pritamani, M. and V. Singal, 2001, Return predictability following large price changes andinformation releases, Journal of Banking and Finance, 25, 631-656.
Ryan P. and R.J. Taffler, 2004, Are economically significant stock returns and trading volumes drivenby firm-specific news releases?, Journal of Business Finance and Accounting, 31(1-2), 49-82.
Savickas R., 2003, Event-induced volatility and tests for abnormal performance, Journal of FinancialResearch, 26(2), 165-178.
Susman G. and S. O’Keefe, 1999, The defense industry in the post-Cold War era, Elsevier Science,Oxford.
Thompson R., C. Olsen and J. R. Dietrich, 1987, Attributes of news about firms: an analysis of firm-specific new reported in the wall street journal index, Journal of Accounting Research, 25(2),245-274.

26
Appendix 1 – Firms included in the sample
Rank2003
Company Country
2003DefenseRevenue
(US$)
2003Total
Revenue(US$)
2003Revenue
fromDefense
(%)
End 2003FFNOSH
(%)
19 Alliant Techsystems U.S. 2,102.0 2,366.0 89 4362 Alvis U.K. 620.7 620.7 100 4944 Anteon U.S. 927.0 1,042.0 89 nd.63 Babcock Internat. Group U.K. 602.6 753.2 80 444 BAE Systems U.K. 17,159.0 22,359.3 77 6594 BearingPoint U.S. 328.5 3,139.3 11 4581 Bharat Electronics India 434.2 620.2 70 1002 Boeing U.S. 27,360.0 50,500.0 54 6767 CACI U.S. 536.3 843.1 64 4789 CAE Canada 361.6 835.9 43 8755 Cobham U.K. 742.7 1,480.8 50 5888 Cubic U.S. 365.1 634.0 58 7323 Dassault Aviation France 2,009.1 4,143.8 49 5043 DRS Technologies U.S. 940.2 1,001.3 94 388 EADS Netherlands 8,036.5 37,796.6 21 10082 EDO U.S. 415.0 460.7 90 5650 Elbit Systems Israel 848.0 898.0 94 619 Finmeccanica Italy 5,895.5 10,856.8 54 676 General Dynamics U.S. 12,782.0 16,617.0 77 5728 GKN Group U.K. 1,533.7 7,668.7 20 6934 Goodrich U.S. 1,300.0 4,383.0 30 5116 Halliburton U.S. 2,700.0 16,271.0 17 4940 Harris U.S. 1,100.0 2,093.0 53 4012 Honeywell U.S. 4,200.0 23,100.0 18 6065 Indra Sistemas Spain 567.3 1,232.3 46 10025 ITT Industries U.S. 1,790.9 5,626.6 32 5573 Jacobs Engineering Group U.S. 494.0 1,884.8 26 5041 Kawasaki Heavy Industries Japan 1,096.5 10,986.2 10 8978 Kongsberg Gruppen Norway 456.1 991.5 46 3611 L-3 Communications U.S. 4,369.2 5,061.6 86 391 Lockheed Martin U.S. 30,097.0 31,824.0 95 3560 ManTech International U.S. 639.9 701.6 91 3395 Meggitt U.K. 314.6 715.0 44 6017 Mitsubishi Heavy Industries Japan 2,667.4 22,473.6 12 933 Northrop Grumman U.S. 18,700.0 26,200.0 71 4859 Oshkosh Truck U.S. 657.0 1,926.0 34 485 Raytheon U.S. 16,896.0 18,100.0 93 4722 Rheinmetall DeTec Germany 2,014.1 5,334.2 38 2635 Rockwell Collins U.S. 1,270.0 2,542.0 50 6018 Rolls-Royce U.K. 2,489.9 9,959.6 25 6630 Saab Sweden 1,380.0 1,725.0 80 5296 Silicon Graphics U.S. 314.0 962.0 33 8647 Singapore Tech. Engineer. Singapore 903.6 1,655.1 55 3526 Smiths Industries U.K. 1,778.2 4,235.2 42 7324 Snecma (Sagem) France 1,845.9 8,036.5 23 4979 Stewart & Stevenson U.S. 446.0 1,175.0 38 44

27
Rank2003
Company Country
2003DefenseRevenue
(US$)
2003Total
Revenue(US$)
2003Revenue
fromDefense
(%)
End 2003FFNOSH
(%)
98 Tadiran Communications Israel 272.2 1,192.1 23 nd.85 Teledyne Technologies U.S. 387.0 841.0 46 5827 Textron U.S. 1,600.0 9,859.0 16 657 Thales France 8,476.0 13,310.4 64 5739 ThyssenKrupp Werften Germany 1,110.0 6,152.9 18 9938 Titan U.S. 1,113.0 1,800.0 62 6383 Ultra Electronic Holdings U.K. 399.0 505.1 79 4821 United Defense Industries U.S. 2,052.6 2,052.6 100 5710 United Techologies U.S. 5,300.0 31,034.0 17 6536 URS U.S. 1,230.0 3,200.0 38 5849 VT Group U.K. 857.8 1,225.4 70 6542 Washington Group Internat. U.S. 1,048.0 2,501.0 42 97
Source: 2004 World Top 100 Defense Firms, Defense News Media Group and Datastream(FFNOSH, Free Float Number Of Shares). Figures expressed in USD millions. Currencyconversions for non-U.S. firms calculated using prevailing rates at the end of each firm’sfiscal year.

28
Appendix 2 – Return and market model results
CompanyTime
PeriodMarketIndex b̂
Annualizedprice
return
Marketannualized
pricereturn
GARCH(1,1)volatility
Alliant Techsystems 95-05 S&P 500 0.32 17.7% 9.0% 5.6%Alvis 95-05 FTSE All 0.20 20.5% 4.3% 6.2%Anteon 02-05 S&P 500 0.83 25.7% -0.1% 4.3%Babcock Intern. Group 95-05 FTSE All 0.23 -0.6% 4.3% 6.5%BAE Systems 95-05 FTSE All 0.81 8.4% 4.3% 7.8%Bearing Point 01-05 S&P 500 1.37 -26.6% -3.1% 7.9%Bharat Electronics 95-05 India BSE 0.24 15.3% 5.6% 11.7%Boeing 95-05 S&P 500 0.96 9.0% 9.0% 6.9%CACI 95-05 S&P 500 0.65 26.4% 9.0% 8.8%CAE 95-05 S&P/TSX 0.71 4.4% 7.8% 8.0%Cobham 95-05 FTSE All 0.32 13.4% 4.3% 4.5%Cubic 95-05 S&P 500 0.57 14.9% 9.0% 8.2%Dassault Aviation 95-05 SBF 120 0.22 28.7% 7.5% 7.3%DRS Technologies 95-05 S&P 500 0.38 24.9% 9.0% 9.0%EADS 00-05 SBF 120 1.13 4.8% -10.4% 6.1%EDO 95-05 S&P 500 0.57 22.4% 9.0% 9.5%Elbit Systems 98-05 Israel TA 100 0.90 12.0% 11.3% 4.8%Finmeccanica 95-05 Milan Global 1.11 2.9% 8.2% 8.7%General Dynamics 95-05 S&P 500 0.59 15.8% 9.0% 5.6%GKN Group 95-05 FTSE All 0.95 5.5% 4.3% 6.8%Goodrich 95-05 S&P 500 0.91 6.4% 9.0% 6.9%Halliburton 95-05 S&P 500 0.88 9.7% 9.0% 9.9%Harris 95-05 S&P 500 0.84 11.2% 9.0% 7.2%Honeywell 95-05 S&P 500 1.18 7.2% 9.0% 7.5%Indra Sistemas 95-05 Ibex 35 0.55 29.4% 10.5% 10.7%ITT Industries 95-05 S&P 500 0.75 16.5% 9.0% 5.7%Jacobs Eng. Group 95-05 S&P 500 0.59 16.8% 9.0% 6.1%Kawasaki Heavy Indus. 95-05 Topix 1.07 -7.% -2.9% 9.2%Kongsberg Gruppen 95-05 Oslo SE 0.54 9.3% 7.3% 6.1%L-3 communications 98-05 S&P 500 0.53 25.9% 0.6% 6.3%Lockheed Martin 95-05 S&P 500 0.48 8.6% 8.4% 6.3%ManTech International 02-05 S&P 500 0.43 10.0% 2.2% 6.6%Meggitt 95-05 FTSE All 0.35 13.9% 4.3% 5.8%Mitsubishi Heavy 95-05 Topix 0.94 -8.9% -2.9% 7.1%Northrop Grumman 95-05 S&P 500 0.47 9.4% 9.0% 5.9%Oshkosh Truck 95-05 S&P 500 0.55 32.9% 9.0% 8.4%Raytheon 95-05 S&P 500 0.55 1.7% 9.0% 7.9%Rheinmettall DeTec 95-05 Dax 30 0.20 10.6% 6.8% 8.1%Rockwell Collins 01-05 S&P 500 0.95 17.6% -1.1% 4.4%Rolls-Royce 95-05 FTSE All 1.09 3.1% 4.3% 7.7%Saab 98-05 Affarsvarlben 0.34 4.3% 1.2% 5.3%Silicon Graphics 95-05 S&P 500 1.33 -22.5% 9.0% 17.5%Singapore Tech. Eng. 97-05 Singapore ST 0.71 8.2% 3.4% 6.2%Smiths Industries 95-05 FTSE All 0.72 6.4% 4.3% 5.9%Snecma (Sagem) 95-05 SBF 120 0.48 6.9% 7.5% 8.2%Stewart & Stevenson 95-05 S&P 500 0.73 -3.2% 9.0% 9.4%

29
CompanyTime
PeriodMarketIndex b̂
Annualizedprice
return
Marketannualized
pricereturn
GARCH(1,1)volatility
Tadiran Com. 00-05 Israel TA 100 0.88 41.9% 4.2% 7.7%Teledyne Technologies 99-05 S&P 500 1.12 25.0% -3.3% 9.1%Textron 95-05 S&P 500 0.87 10.7% 9.0% 6.2%Thales 95-05 SBF 120 0.81 2.4% 7.5% 8.0%ThyssenKrupp Werften 95-05 Dax 30 0.79 -0.4% 6.8% 6.8%Titan 95-05 S&P 500 0.94 12.6% 9.0% 12.6%Ultra Electronics 96-05 FTSE All 0.16 13.0% 2.2% 3.5%United Defense Indus. 01-05 S&P 500 0.32 45.5% 0.7% 4.0%United Technologies 95-05 S&P 500 0.97 18.9% 9.0% 6.3%URS 95-05 S&P 500 0.60 17.8% 9.0% 8.9%VT Group 95-05 FTSE All 0.16 7.2% 4.3% 3.9%Washington Group Int. 02-05 S&P 500 0.42 6.3% 0.7% 3.8%
Note: In this table, market model parameters are estimated with conditional heteroskedasticityGARCH(1,1) by the maximum likelihood method on the whole time period. The sample contains 58publicly listed firms included in the “World Top 100 Defense firms”. The time period extends fromJanuary 1995 to May 2005.

Appendix 3 – News categoriesWe detail in this appendix the news categories used to classify all the information releases which are likely toinfluence stock prices of defense firms. An example of a news release classified in each category is provided.
Geopolitical event and macroeconomic news (POLITICS): News items related to geopolitical, political ormacroeconomic events. Even as the major U.S. equity averages plunged Monday in the wake of the Sept. 11terrorist attacks, investors bid up shares of companies expected to benefit from a more-security-conscious, less-peaceful world.
Info
rmat
ion
rele
ases
of
gene
ral
inte
rest Changes in public spending related to defense (PUBSPEND): Announcements or rumors related to changes in
public spending in defense. Elbit Systems, a maker of defense electronics, fell 4.5% to NIS 65.80. Defense Newssaid Israeli military exports will drop 40% to $ 2.5 billion this year, citing an official in the defense ministry
Indu
stri
al
Company restructuring (RESTRUCT): Announcements or rumors related to firms’ reorganizations and disposalof subsidiaries. This category does not include the announcements related to capital restructuring. The HarrisCorporation, which is moving to concentrate on communications equipment, said late yesterday that it would spinoff Lanier Worldwide.
Labor related issues (LABOR): News items relating to lay-offs, employees’ pay settlements, new incentiveschemes, etc. Textron Inc. will lay off 1,200 employees in its Cessna Aircraft unit, citing a reduction in the orderplaced by one of its two major business jet customers and worldwide economic concerns.
Contracts (CONTRACT): News items relating to negotiation, conclusion or breach of contract. Harris Corp.received $222 million contract from U.S. Army Communications-Electronics Command (CECOM) for 205Lightweight Multiband Satellite Terminals (LMSTs), company said.
Product information (PRODUCT): News items relating to capabilities, expectations about success, marketpotentials of existing or news products. The U.S. Army reports that its next-generation RF electronic combat suitedeveloped by ITT-Industries took its first flight on March 23, 1999. ITT Industries, Avionics Division is the primecontractor for the AN/ALQ-211 SIRFC system.
Review of company prospects – other than analysts (PROSPECT): Issues relating to the review of a company’sprospects not published by a sell-side analyst. The Oshkosh Truck Corporation said yesterday that its commercialsales will be lower than expected amid a softening in North America's concrete-placement market.
Strategic alliance between two firms for developing a new product (STRAT): News items relating to theannouncement or the rumor about a strategic or industrial alliance between firms (this category excludes the casefor financial alliances, included in the bid category). Finmeccanica SpA unit Alenia Difesa said it and DeutscheAerobus AG unit Dornier signed a memorandum of understanding to jointly develop an anti-submarine MPAaircraft to replace the Breguet Atlantic 1150.
Fina
ncia
l
Bids and speculation about bids (BIDS): Announcements or published rumors in relation to take-overs,acquisitions and mergers. DRS Technologies, Inc. today confirmed that it has held discussions with a financialbuyout group concerning the possible acquisition of DRS. These discussions have been terminated.
Financing issues (FINANCE): News items relating to issuance of shares or bonds, capital restructuring, sharerepurchase, etc. The company was in crisis talks with its bank syndicate after it breached its agreed debt level of 3.5times its cash-flow for a loan worth 358 mln eur.
Analysts (ANALYST): Sell-side analysts’ recommendations and forecasts. Cobham advanced 67-1/2 pence to 787-1/2 buoyed by news CSFB had reiterated its 'buy' rating with a 900 pence price target.
Earnings related news (EARNINGS): News items relating to a (formal or not) announcement by the firmregarding its current or expected earnings, excluding the special case of a formal profit warning. CACI said itsprofits rose 54 percent from the same period in the previous fiscal year.
Profit warning (WARNING): Firm announcements regarding expected profits. Textron Inc. officials announcedSept. 26 that the company is lowering its earnings estimates for the third and fourth quarters of this year.
Share deals (SHAREDEAL): News items relating to large trading activity in a firm’s shares (institutionalpurchases or sales). According to information obtained by Handelsblatt, U.S. investor Guy Wyser-Pratte hasacquired 5.054% of Rheinmetall's ordinary shares and 1.1% of its pre-ference shares. A spokesman for Rheinmetallconfirmed that Wyser-Pratte had acquired a stake in the group. However, he said it was too early to comment onthe matter.
Firm
-spe
cifi
c in
form
atio
n re
leas
es
Oth
er
Management issues (MANAG): News items relating to appointments, dismissals, retirements or compensationschemes of top managers. Northrop Grumman Corp. stumbled along with other defense firms Thursday, a day afterthe company announced a change at the top of its executive ladder.
Legal issues (LEGAL): Legal issues, trials, penalties. ManTech International Corp. said yesterday that the DefenseDepartment last month subpoenaed company information related to a contract for security and personnelbackground checks.
No relevantinformationreleases
Firm-specific news, but not related to the defense industry (NODEF).
No news at all (not included in the sample).
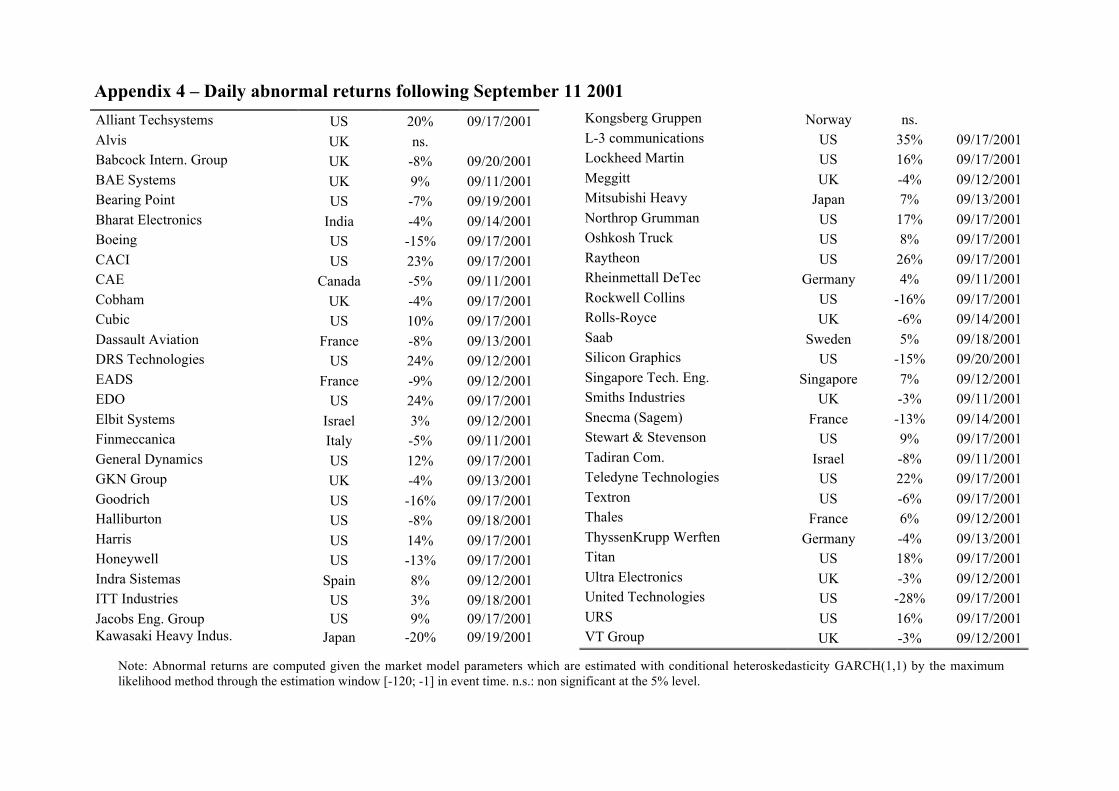
Appendix 4 – Daily abnormal returns following September 11 2001
Alliant Techsystems US 20% 09/17/2001Alvis UK ns.Babcock Intern. Group UK -8% 09/20/2001BAE Systems UK 9% 09/11/2001Bearing Point US -7% 09/19/2001Bharat Electronics India -4% 09/14/2001Boeing US -15% 09/17/2001CACI US 23% 09/17/2001CAE Canada -5% 09/11/2001Cobham UK -4% 09/17/2001Cubic US 10% 09/17/2001Dassault Aviation France -8% 09/13/2001DRS Technologies US 24% 09/12/2001EADS France -9% 09/12/2001EDO US 24% 09/17/2001Elbit Systems Israel 3% 09/12/2001Finmeccanica Italy -5% 09/11/2001General Dynamics US 12% 09/17/2001GKN Group UK -4% 09/13/2001Goodrich US -16% 09/17/2001Halliburton US -8% 09/18/2001Harris US 14% 09/17/2001Honeywell US -13% 09/17/2001Indra Sistemas Spain 8% 09/12/2001ITT Industries US 3% 09/18/2001Jacobs Eng. Group US 9% 09/17/2001Kawasaki Heavy Indus. Japan -20% 09/19/2001
Kongsberg Gruppen Norway ns.L-3 communications US 35% 09/17/2001Lockheed Martin US 16% 09/17/2001Meggitt UK -4% 09/12/2001Mitsubishi Heavy Japan 7% 09/13/2001Northrop Grumman US 17% 09/17/2001Oshkosh Truck US 8% 09/17/2001Raytheon US 26% 09/17/2001Rheinmettall DeTec Germany 4% 09/11/2001Rockwell Collins US -16% 09/17/2001Rolls-Royce UK -6% 09/14/2001Saab Sweden 5% 09/18/2001Silicon Graphics US -15% 09/20/2001Singapore Tech. Eng. Singapore 7% 09/12/2001Smiths Industries UK -3% 09/11/2001Snecma (Sagem) France -13% 09/14/2001Stewart & Stevenson US 9% 09/17/2001Tadiran Com. Israel -8% 09/11/2001Teledyne Technologies US 22% 09/17/2001Textron US -6% 09/17/2001Thales France 6% 09/12/2001ThyssenKrupp Werften Germany -4% 09/13/2001Titan US 18% 09/17/2001Ultra Electronics UK -3% 09/12/2001United Technologies US -28% 09/17/2001URS US 16% 09/17/2001VT Group UK -3% 09/12/2001
Note: Abnormal returns are computed given the market model parameters which are estimated with conditional heteroskedasticity GARCH(1,1) by the maximumlikelihood method through the estimation window [-120; -1] in event time. n.s.: non significant at the 5% level.