what entrepreneurs are up to - babson college entrepreneurs are up to 2008 national entrepreneurial...
TRANSCRIPT

G lo ba l E n t r E p r E n E u r s h i p m o n i to r2008 national Entrepreneurial assessment for the united states of america
What Entrepreneurs Are Up To
Abdul Ali • I. Elaine Allen • Candida Brush • William D. Bygrave • Julio De Castro
Julian Lange • Heidi Neck • Joseph Onochie • Ivory Phinisee • Edward Rogoff • Albert Suhu
Executive Report

1
Globa l En t rep reneursh ip Mon i to r
2008 National Entrepreneurial Assessment for the United States of America
Executive Report
Abdul Ali, I. Elaine Allen, Candida Brush, William D. Bygrave,
Julio De Castro, Julian Lange, Heidi Neck, Joseph Onochie,
Ivory Phinisee, Edward Rogoff, Albert Suhu
What Entrepreneurs Are Up To

2
3
Globa l En t rep reneursh ip Mon i to r
What Entrepreneurs Are Up To
2008 National Entrepreneurial Assessment for the United States of America
Executive Report
The authors thank the Consortium of GEM National Teams who participated
in 2008: Angola, Argentina, Belgium, Bolivia, Bosnia and Herzegovina, Brazil,
Chile, Colombia, Croatia, Denmark, Dominican Republic, Ecuador, Egypt,
Finland, France, Germany, Greece, Hungary, Iceland, India, Iran, Ireland,
Israel, Italy, Jamaica, Japan, Latvia, Macedonia, Mexico, Netherlands, Norway,
Peru, Republic of Korea, Romania, Russia, Serbia, Slovenia, South Africa, Spain,
Turkey, United Kingdom, United States, and Uruguay.
Although GEM data were used in the preparation of this report, their
interpretation and use are the sole responsibility of the authors.
© 2009 by Babson College, Baruch College, Abdul Ali, I. Elaine Allen, Candida
Brush, William D. Bygrave, Julio De Castro, Julian Lange, Heidi Neck,
Joseph Onochie, Ivory Phinisee, Edward Rogoff, Albert Suhu and the Global
Entrepreneurship Research Association (GERA).

4
List of Tables 5
List of Figures 5
Executive Summary and Key Findings of the GEM 2008 U.S. Report 7
Introduction 9About GEM 9GEM Data Collection: The Adult Population Survey 10Defining Entrepreneurship 10GEM Website and Data Availability 11
GEM Terminology 12
Part 1 Why Do People Start Businesses In The United States? The Nature Of Start-Ups 14Why Do People Start Businesses in the United States? 21
Part 2 International Comparison: The United States and other Countries 24Activity 25Attitudes 31Aspirations 34
Part 3 Who Starts A Business? 35Women’s Entrepreneurship 35Immigrant Entrepreneurship 37
Part 4 How Do People Start Businesses? 46Financing 46Innovation 47Social Entrepreneurship 52
Part 5 Public Policy In the United States 55
Appendix 62
GEM Sponsors 63
Contacts 64
About the Authors 65
Table of Contents

55
List of TablesTable 1A Prevalence Rates in Percentage of Entrepreneurial Activity and Business Owner-Managers
Across GEM Countries in 2008, for the 18-99 Age Group, by Phase of Economic Development 26
Table 2 Start-Up Motivation, 2008 35Table 3 Prevalence Rates in Percentage of Entrepreneurial Activity for Immigrant
and Non-Immigrant Ethnic Groups 38Table 4 Social Entrepreneurship by Age 53Table 5 Recession Duration, Depth and Diffusion 59Table 6 U.S. Growth Rates by Industry 59Table 7 Change in U.S. Employment, Business Establishments and Firms* 59Table 8 U. S. Dynamism 61Table 1B Prevalence Rates in Percentage of Entrepreneurial Activity and Business Owner-Managers
Across GEM Countries in 2008, for the 18-64 Age Group, by Phase of Economic Development 62
List of FiguresModel 1 The GEM Conceptual Model 9Model 2 The Entrepreneurial Process and GEM Operational Definitions 10Figure 1 U.S. Entrepreneurial Prevalence 14Figure 2 U.S. Early-Stage Entrepreneurial Trends (18-99 Age Group) 15Figure 3 Expects to Start-Up a Business in Three Years (18-99 Age Group) 15Figure 4 GEM 2008 U.S. Entrepreneurial Prevalence Rates by Age Group 16Figure 5 Age Distribution Per Year, TEA 17Figure 6 Age Distribution Per Year, Established Businesses 17Figure 7 Total Early-Stage Education Levels by Year 18Figure 8 Percentage Distribution of Entrepreneurs by Education Levels (TEA) 18Figure 9 Percentage Distribution of Entrepreneurs by Education (Established Businesses) 19Figure 10 Entrepreneurs by Income Segments (TEA) 20Figure 11 Entrepreneurs by Income Segments (Established Business Owners) 20Figure 12 Respondent Perceives Good Opportunities in the Next Six Months (18-99 Age Group) 21Figure 13 Respondent Has Knowledge to Start a Business (18-99 Age Group) 22Figure 14 Fear of Failure Prevents Start-Up (18-99 Age Group) 22Figure 15 Current Start-Up Jobs 23Figure 16 Expected Jobs from Start-Up in Five Years 23Figure 17 Early-Stage Entrepreneurial Activity (TEA) for 43 Nations in 2008,
by Phase of Economic Development, Showing 95% Confidence Intervals 25Figure 18 Sector Distribution Early-Stage Entrepreneurial Activity (18-64 Age Group) 27Figure 19 Sector Distribution Established Businesses (18-64 Age Group) 28Figure 20 Early-Stage Entrepreneurial Activity for Separate Age Groups, 2008 29Figure 21 Early-Stage Entrepreneurial Activity Rates by Gender, 2008 (18-64 Age Group) 30Figure 22 Early-Stage Entrepreneurial Activity (TEA) Rates for 2001-2008 (18-64 Age Group) 30Figure 23 Necessity-Driven TEA Rates for 2001-2008 (18-64 Age Group) 31
Table of Contents

66
Figure 24 Perceived Opportunities for Starting a Business, 2001–2008 32Figure 25 Fear of Failure Among Those Who Perceive Good Start-Up Opportunities, 2001–2008 32Figure 26 Perceived Skills and Knowledge to Start a New Business, 2001–2008 33Figure 27 Intentions to Start a New Business in the Next Three Years, 2002–2008 33Figure 28 High-Growth Expectation Early-Stage Entrepreneurial Activity by Country 34Figure 29 Perceptions of Good Opportunities, Female vs. Male, 2008 36Figure 30 Fear of Failure Rates, Female vs. Male, 2008 36Figure 31 Personally Knows an Entrepreneur Rates, Female vs. Male, 2008 37Figure 32 Personally Knew Entrepreneur in the Past Two Years 39Figure 33 Perceive Good Opportunities for Start-Ups in Six Months 40Figure 34 Have Knowledge to Start a Business 40Figure 35 Fear of Failure Prevents Start-Up Effort 41Figure 36 Expect to Launch Start-Up in Three Years 41Figure 37 Shut Down Business in the Past 12 Months 42Figure 38 Immigrants Personally Knew Entrepreneur in Past Two Years 42Figure 39 Immigrants Perceive Good Opportunities for Start-Ups in Six Months 43Figure 40 Immigrants Have Knowledge to Start a Business 43Figure 41 Fear of Failure Prevents Start-Up Effort by Immigrants 44Figure 42 Immigrants Expect to Launch Start-Up in Three Years 44Figure 43 Immigrants Shut Down Business in Past 12 Months 45Figure 44 Percentage of Business Entities with New Products: Customer Unfamiliarity 48Figure 45 Percentage of Business Entities with New Products: Competitive Offerings 48Figure 46 Percentage of Business Entities Active in Medium- or High-Technology Sector 50Figure 47 Percentage of Business Entities Using Various Types of Technology in 2008 50Figure 48 Percentage of Business Entities Spending on Technology in 2008 51Figure 49 Percentage of Entrepreneurs Self-Identifying as Social Entrepreneurs 52Figure 50 Social Entrepreneurship and Gender 53Figure 51 Perception of Social Opportunities in Six Months 54Figure 52A U.S. 2008 Entrepreneurial Trends with Real GDP 57Figure 52B Percent Change: U.S. Real GDP and Key Components 58Figure 53 GEM U.S. National Expert Survey – Mean Response for New Firm Entrepreneurship Opportunity 60Figure 54 GEM U.S. National Expert Survey – Mean Response for Available Funding 61
Table of Contents

77
Executive Summary and Key Findings of the GEM 2008 U.S. Report
One of the great advantages of a research program such as GEM is that it systematically examines entrepreneurship issues through annual surveys, allowing for examination of the characteristics of entrepreneurship, actions and qualities of individual entrepreneurs and factors in the environment impacting entrepreneurship in diverse economic conditions. The global economic crisis that started in 2007 presents a different set of economic conditions than in the prior periods of GEM examination. As such, this 2008 report is particularly important, because it begins to tell the story of entrepreneurial behavior in times of economic distress. However, a note of caution is warranted.
This year’s report examines entrepreneurial activity for those in the 18-99 age group. Traditionally, GEM has examined entrepreneurial behavior for those in the 18-64 age group. Given growing evidence of entrepreneurial behavior past the age of 64, and the likelihood that all GEM countries will move to this new convention, the GEM U.S. team decided to make this change immediately in order to have a fuller picture of entrepreneurship in the United States. When appropriate, comparing the United States to other GEM countries, this report uses data from the 18-64 age group. The data on entrepreneurial activity in the United States in 2008 show some positive signs.
For the 18-99 age group, the GEM 2008 U.S. data set shows a slight increase in TEA (Total Entrepreneurial Activity) compared to 2007 (8.7% vs. 8.3%), and while the TEA for men shows a slight decrease (9.8% to 10.7%), the TEA for women shows a marked increase (7.5% to 6.1%). Another interesting point is that the size of the ventures entrepreneurs are thinking about is changing: From 2007 to 2008, the number of jobs entrepreneurs expected to create from their start-ups decreased in all categories (no jobs, 1-5 jobs, 6-19 jobs), except in the category of 20+ jobs. Opportunity continues to be the main driver for entrepreneurs in the United States; 87% started their businesses due to an opportunity, opposed to 13% who started their businesses out of necessity.
One important trend to note is the change in the age distribution of entrepreneurs. For the total entrepreneurship and the established firms measures, the results indicate a marked reduction (around 8% to 9%) in entrepreneurial activity for individuals in the 18-44 age group and an increase of a similar amount in the 45-99 age group. While previous reports pointed toward this trend, this year’s data indicate the need to follow this trend closely because of the possible implications it could have for entrepreneurial behavior in the United States.
The results of this year’s survey indicate that the United States continues to be at or near the top of the group of innovation-driven economies in terms
of early-stage entrepreneurial activities. Looking at particular sectors of entrepreneurial activity, U.S. activity is more concentrated in the business services sector and less concentrated in the transforming sector than the activities of other countries in the innovation-economy group, for both early-stage and established firms. This indicates a continuation of the trend toward a business service-economy and away from a manufacturing-economy.
Also significant this year are the changes with respect to fear of failure. While fear of failure has increased appreciably in the United States and in the rest of the GEM countries, perceived opportunity has declined in the United States and in the other innovation-driven countries. It is important to note, however, that the decrease in perceived opportunity is only off its high levels of 2007. Thus, perceived opportunity is still substantial despite a greater fear of failure. This contrasts with the marked decrease across-the-board in GEM countries for individuals who expect to start a business in the next three years.
When comparing women and men entrepreneurs, two of the most striking differences are the amount of funding available and the type of business started. Women start ventures with eight-times less funding than their male counterparts. Moreover, men and women differ on the businesses they start. Men are more likely to start business-service businesses than consumer-oriented businesses (47% vs. 24%), while women are more likely to start a consumer-oriented rather than a service-oriented business (52% vs. 26%). However, for established businesses, roughly one-third of businesses started by men and women are consumer-oriented and service businesses. Finally, men are substantially more motivated than women by opportunity (93% vs. 68%) as opposed to necessity (5% vs. 21%), and in the realm of established business, women entrepreneurs have reported greater fear of failure and lower perceptions that business success leads to higher status than male entrepreneurs.
The data sets on ethnicity and immigration are consistent with those of previous years. African Americans have higher levels of start-up activities than whites (13.9% vs. 8.4%) while having significantly lower rates of established ventures (8.1% vs. 1.8%), whereas the activities of non-Mexican Hispanics are near those of whites for start-ups (8.6% vs. 8.4%), but for established firms are lower (5.5% vs. 8.1%). With few exceptions, this pattern continues when breaking the data down by immigration status.
In terms of financing, the number of adults reporting that they had invested in someone else’s business increased (to 5%), as did the amount they financed ($17,500); yet those numbers are countered by the precipitous decline in SBA lending. In terms of technology, the 2008 survey data indicate that while

88
early-stage entrepreneurs continue to be cautious when it comes to developing technology products, the number of entrepreneurs involved in the technology sector—either by starting an internet business and/or using web marketing or being willing to spend more than $1,000 on new technology—all increased in 2008.
With respect to social entrepreneurship, largely driven by women entrepreneurs, the survey data indicate a market change away from mostly economic goals (2007) toward a combination of economic and social goals (2008). The most popular sectors for social entrepreneurs are healthcare, education, urban development and the environment.
The trends highlighted earlier with respect to age distribution and entrepreneurial behaviors are prevalent in social entrepreneurship activities, with an increase in later-in-life social entrepreneurs. Finally, in the opinion of the national experts, there is a decline in both the perception of good opportunities and in the availability of funding for entrepreneurs.

99
Introduction
AboUt GEM
Although it is widely acknowledged that entrepreneurship is one of the most important forces shaping the changes in the economic landscape, the understanding of the relationship between entrepreneurship and national growth is far from complete. There is a lack of cross-national harmonized data sets on entrepreneurship. Since 1997, the Global Entrepreneurship Monitor (GEM) research program has contributed to increasing knowledge in this area by collecting relevant harmonized data on an annual basis. GEM focuses on three main objectives:
• To measure differences in the level of entrepreneurial activity between countries
• To uncover factors determining national levels of entrepreneurial activity
• To identify policies that may enhance national levels of entrepreneurial activity
Traditional analyses of economic growth and competitiveness have tended to neglect the role played by new and small firms in the economy. GEM takes
a comprehensive approach and considers the degree of involvement in entrepreneurial activity within a country. GEM views national economic growth and the aggregate level of economic activity in a country as being associated with newer and smaller firms as well as established firms, but its focus lies on early-stage entrepreneurial activity. Small and newer firms generate innovations, fill market niches, and increase competition, thereby contributing to resource reallocation in economic activity. By considering the complementary nature of economic activity among different groups of firms, GEM links a nation’s economic activity to the interplay of established and new and smaller firms, allowing a clearer understanding of why entrepreneurship is vital to the whole economy. Figure 1 presents the conceptual framework that guides GEM data collection. The GEM model maintains that established business activity at the national level varies with General National Framework Conditions (GNFC), while entrepreneurial activity varies with Entrepreneurial Framework Conditions (EFC). GEM’s unique contribution is its cross-national data sets that enable detailed study of the lower half of the conceptual framework. In the framework, EFCs reflect major features of an economy and host society that are expected to impact the entrepreneurial sector but are not captured in the General National Framework Conditions.i
Model 1. The GEM Conceptual Model
Social, Cultural,Political Context
General National Framework Conditions
Entrepreneurial Framework Conditions
Micro, Small and Medium Firms(Secondary Economy)
Entrepreneurial Opportunities
EntrepreneurialCapacity
•Skills
NewEstablishments
Early-stageEntrepreneurial Activity
MajorEstablished Firms(Primary Economy)
National Economic Growth(Jobs andTechnicalInnovation)

10
Model 2. The Entrepreneurial Process and GEM Operational Definitions
Introduction
GEM DAtA CollECtioN: thE ADUlt PoPUlAtioN SUrvEy
GEM takes a broad view of entrepreneurship and focuses on the role played by individuals in the entrepreneurial process. A key GEM indicator is the prevalence rate of early-stage entrepreneurial activity (also known as the TEA index), represented by the shaded box in Model 2.
DEfiNiNG ENtrEPrENEUrShiP
Entrepreneurship is a complex phenomenon that spans a variety of contexts. The varied definitions in entrepreneurship literature reflect this complexity. In line with its objectives, GEM takes a broad view of entrepreneurship and focuses on the role played by individuals in the entrepreneurial process. Unlike most entrepreneurship data sets that measure newer and smaller firms, GEM data studies the behavior of individuals with respect to starting and managing a business. This differentiates GEM data from other data sets, most of which record firm-level data on (new) firm registrations (see Model 2). New firms are most often started by individuals, and individuals typically determine the entrepreneurial attitude of established businesses, regardless of size. From the start of the project in 1999, GEM has viewed entrepreneurship as a process and has considered people in entrepreneurial activity in different phases, from the very early phase when businesses are in gestation to the established phase and possibly discontinuation of the business.
An individual entrepreneur who has succeeded in maintaining a business has gone through a process, and the characteristics of his or her actions are a very useful way to study entrepreneurial behavior. The entrepreneurial process starts before the firm is operational. Someone who is just starting a venture and trying to make it in a very competitive market is an entrepreneur despite not having high-growth aspirations. On the other hand, an established business owner may have been in business for
quite a number of years and still be innovative, competitive and growth-minded; this person is also an entrepreneur. GEM provides an umbrella under which a wide variety of entrepreneurial characteristics—such as motivations, innovativeness, competitiveness and high-growth aspirations—can be systematically and rigorously studied.
Within this context, the GEM data collection covers the life cycle of the entrepreneurial process and looks at individuals at the point when they commit resources to start a business they expect to own themselves (nascent entrepreneurs); when they currently own and manage a new business that has paid salaries for more than three months but not more than 42 months (new business owners); and when they own and manage an established business that has been in operation for more than 42 months (established business owners). Model 2 summarizes the entrepreneurial process and GEM operational definitions.
For GEM, the payment of any wages for more than three months to anyone, including the owners, is considered to be the “birth event” of actual businesses. Thus, the distinction between nascent entrepreneurs and new business owners depends on the age of the business. Businesses that have paid salaries and wages for more than three months and less than 42 months may be considered new. The cutoff point of 42 months has been made on a combination of theoretical and operational grounds.ii The prevalence rate of nascent entrepreneurs and new business owners taken together may be viewed as an indicator of early-stage entrepreneurial activity in a country. It represents dynamic new firm activity; even if a
Potentialentrepreneur:opportunities,knowledge, and skills
Nascententrepreneur:involved in settingup a business
Owner-managerof a new business(up to3.5 years old)
Owner-managerof an establishedbusiness (morethan 3.5 years old)
Conception Firm birth Persistence
Early-Stage Entrepreneurial Activity (TEA)
Introduction

11
Introduction
fair share of nascent entrepreneurs do not succeed in getting the business started, their actions may have an effect on the economy since they can put pressure on incumbent firms to perform better.
Business owners who have paid salaries and wages for more than 42 months are classified as “established business owners.” Their businesses have survived the liability of newness. High rates of established business ownership may indeed indicate positive conditions for firm survival. However, this is not necessarily the case. If a country exhibits a high degree of established entrepreneurship combined with a low degree of early-stage entrepreneurial activity, this indicates a low level of dynamism in entrepreneurial activity.
GEM WEbSitE AND DAtA AvAilAbility
GEM is a consortium of national teams participating in the Global Entrepreneurship Research Association. Thanks to the effort and dedication of hundreds of entrepreneurship scholars as well as policy advisors around the globe, the GEM consortium consists of a unique network building a unique data set. Contact details and national teams’ micro-sites can be found on www.gemconsortium.org, which also contains a selection of GEM data. The GEM website provides an updated list of the growing number of peer-reviewed scientific articles based on GEM data.
Introduction

12
GEM Terminology
Nascent entrepreneur A nascent entrepreneur is one who is actively planning a new venture. Such an entrepreneur has done something during the previous 12 months to help start a new business that he or she will own, at least in part. Activities such as organizing the start-up team, looking for equipment, saving money for the start-up, or writing a business plan would all be considered active commitments to starting a business. Wages or salaries will have been paid for no more than three months; nascent entrepreneurs are often still employed full-time elsewhere.
New firm entrepreneur A new firm entrepreneur is an entrepreneur who, at least in part, owns and manages a new business that is between four and 42 months old and has not paid salaries for longer than this period.
Established business owner In addition to those individuals who are currently involved in the early stages of a business, there are also many individuals who have set up businesses that they have continued to own and manage for a longer time. These individuals are included in the established business owner index, which captures the percentage of individuals in a population who have set up businesses that they continue to own and manage and who have paid wages or salaries for more than 42 months.
New business ownership rate Percentage of the 18-99 age group who are currently owner-managers of new businesses, i.e., owning and managing a running business that has paid salaries, wages or any other payments to the owners for more than three months but not more than 42 months.
Dynamism As used in this report, dynamism is defined as the ratio of early-stage entrepreneurship to established business ownership. This ratio shows the relative activity levels among early-stage entrepreneurs compared to the prevalence of established business owners. Low levels of dynamism indicate a less entrepreneurial environment.
Total early-stage entrepreneurial activity (TEA Rate)
As its name implies, total early-stage entrepreneurial activity refers to the total rate of early-stage entrepreneurial activity among the adult population aged 18–64 years, inclusive. In some instances, this rate is less than the combined percentages for nascent and new firm entrepreneurs. This is because, in circumstances where a respondent qualifies as both a nascent and a new firm entrepreneur, he or she is counted only once.
Overall entrepreneurial activity rate Percentage of the 18-99 age group who are currently engaged in early-stage entrepreneurial activity or owner-manager of an established business (as defined above).
Business discontinuation rate Percentage of the 18-99 age group who have, in the past 12 months, discontinued a business, either by selling, shutting down or otherwise discontinuing an owner-management relationship with the business. Note: This is not a measure of business failure rates.
Fear of failure rate Percentage of the 18-99 age group with positive perceived opportunities (individuals involved in any stage of entrepreneurial activity excluded) who indicate that fear of failure would prevent them from setting up a business.
Entrepreneurial intention Percentage of the 18-99 age group (individuals involved in any stage of entrepreneurial activity excluded) who intend to start a business within three years.
Perceived capabilities Percentage of the 18-99 age group (individuals involved in any stage of entrepreneurial activity excluded) who believe they have the required skills and knowledge to start a business.

13
GEM National Expert Survey* (NES): National Framework Conditions
1. Financial Support (availability of financial resources, equity and debt for new and growing firms including grants and subsidies)
2. Government Policies (the extent to which government policies concerning taxes, regulations and their applications are size neutral and/or whether these polices discourage or encourage new and growing firms)
3. Government Programs (the presence of direct programs to assist new and growing firms at all levels of government: national, regional and municipal)
4. Education and Training (the extent to which training in starting or managing small, new or growing business features in the educational and training system and the quality, relevance and depth of such education and training in creating or managing small, new or growing businesses)
5. Research and Development Transfer (the extent to which national research and development leads to new commercial opportunities and whether or not R&D is available for new, small and growing firms)
6. Commercial and Professional Infrastructure (the influence of commercial, accounting and other legal services and institutions that allow or promote new, small or growing businesses)
7. Market Openness/Barriers to Entry (the extent to which commercial arrangements are prevented from undergoing constant change and re-deployment, preventing new, smaller and growing firms from competing and replacing existing suppliers, subcontractors and consultants)
8. Access to Physical Infrastructure (access to physical resources—communication, utilities, transportation, land or space—at a price that does not discriminate against new, small or growing firms)
9. Cultural and Social Norms (the extent to which existing social and cultural norms encourage, or do not discourage, individual actions that may lead to new ways of conducting business or economic activities and, in turn, lead to greater dispersion in wealth and income)
GEM Terminology
*over the few years, there have been various terms used interchangeably to define the GEM national “interviewees.” terms include: key informant (K), expert informants, expertrespondents and national experts. Despite these variations in terminology, the role and methods have remained unchanged. Going forward, National Expert Survey (NES) is the term of choice. for more information on the National Expert Survey, visit: http://www.gemconsortium.org/about.aspx?page=re_expert_surveys

14
Entrepreneurial Activity
The estimated prevalence rates from the GEM 2008 Adult Population Survey (APS) are shown in Figure 1. The figure makes distinctions among the population by gender, stage of entrepreneurial activity and
reason for starting the venture in order to provide a broad and detailed profile. The group with the highest rate of entrepreneurial activity in the United Sates is males involved in early-stage businesses followed closely by males involved in established businesses.
Part 1 Why Do People Start Businesses in the United States? The Nature of Start-Ups
0%
2%
4%
6%
8%
10%
12%
14%
Nascent New Business TotalEntrepre-
neurialActivity
TotalEntrepre-
neurialActivity
MALE
TotalEntrepre-
neurialActivity
FEM
EstablishedBusinesses
(EST)
EstablishedBusinesses MALE
EstablishedBusinesses
FEMALE
TotalEntrepre-
neurialActivity
Opportunity
TotalEntrepre-
neurialActivity
Necessity
Stage and Type of Prevalence Rates
Figure 1. U.S. Entrepreneurial Prevalence
Source: GEM U.S. 2008 Adult Population Survey (APS)
1Changes in the GEM questionnaire and in the U.S. survey methodology have improved the estimation procedure particularly for the established businesses in 2008. these changes reveal that previous years’ established business prevalence rates may have contained a downward bias. this downward bias was corrected in the 2008 survey methodology.
The data on entrepreneurial behavior in the United States show a number of positive signs. The established business ownership rate (combined male and female) is 7.7%. The established businesses are those businesses that are older than 42 months. These data sets provide some support for the staying power of new businesses. Businesses that make it to 42 months are most likely to sustain long-term viability. Moreover, while the TEA for males shows a decline (10.7% to 9.8%), the TEA for women shows a marked increase (6.1% to 7.5%), which although not strong enough to overcome the decline in males, indicates the gap between genders may be closing, and the increase in women starting businesses could be a way for the United States to overcome decline. The section on women entrepreneurs addresses this topic in more depth.
The United States continues with the trend of businesses being started by entrepreneurs that recognize an opportunity rather than businesses being started out of necessity (87% vs. 13%). Given the 2008/09 financial crises and its possible impact on likely entrepreneurs, it will be important to analyze these variables in next year’s report to assess any possible changes to the trend.
Figure 2 presents historical prevalence rates of early-stage entrepreneurial activity using the same groupings as used in the previous figure (gender, stage of entrepreneurial activity and reason for starting the venture).1 The total early-stage entrepreneurial activity among the adults in the 18-99 age group was estimated to have increased in the United States to 8.7% in 2008 from 8.3% in 2007. Figure 2 illustrates that three groups of activity peaked in 2005 and began their declines in the following year: Total early-stage activity, male early-stage activity and early-stage opportunity entrepreneurial activity.
Figure 3 shows the three year projections for starting businesses by both entrepreneurs and non-entrepreneurs in the United States for each year for the period 2002 to 2008. The decline in the expectations to start-up a business in 3 years is significant and Figure 3 illustrates that it dips from around 65% in 2005 to a little over 50% in 2008. This is important because fewer people are expecting to start new ventures in the future. Figure 3 illustrates that the long term outlook was also significantly less optimistic overall for all three groups – Early-stage entrepreneurs, Established business owner entrepreneurs and non-entrepreneurs – in 2008 compared to all prior years going back to 2002. Surely the economic recession played a major role in these less optimistic expectations in 2008.

15
Figure 2. U.S. Early-Stage Entrepreneurial Trends (18-99 Age Group)
Figure 3. Expects to Start-Up a Business in Three Years (18-99 Age Group)
Why do People Start Businesses in the United States? The Nature of Start-Ups
0.0%
2.0%
4.0%
6.0%
8.0%
10.0%
12.0%
14.0%
16.0%
2001 2002 2003 2004 2005 2006 2007 2008
Years
Perc
enta
ge E
ntre
pren
euria
l Act
ivity
Total Early-Stage Entrepreneurial Activity Male Entrepreneurial Activity
Female Entrepreneurial Activity Opportunity Entrepreneurial ActivityNecessity Entrepreneurial Activity Disconnect Activity
0%
10%
20%
30%
40%
50%
60%
70%
80%
2002 2003 2004 2005 2006 2007 2008
Perc
enta
ge W
ithin
Eac
h Ca
tego
ry
Early-StageEstablishedNo Business
Source: GEM U.S. 2002-2008 Adult Population Survey (APS)
Source: GEM U.S. 2002-2008 Adult Population Survey (APS)
Given the importance of new ventures and start-ups for the U.S. economy, this is a serious concern and one that has to be paid attention to in the future. It will be important to watch whether the total early-stage and established business entrepreneurs continue to follow the declining trends that started in 2007 for early-stage entrepreneurs and continued in 2008 for all entrpreneurs.
Figure 2 also shows that the early-stage business discontinuation rate began to increase in 2007 at the start of the U.S. recession. The GEM data for 2008 were collected in the first half of the year, making it likely that the prevalence rates have changed significantly during the last half of 2008 and for 2009. We may want to see how the early-stage discontinuation rate changes in 2009 compared to 2008.

16
Figure 4. GEM 2008 U.S. Entrepreneurial Prevalence Rates by Age Group
Why do People Start Businesses in the United States? The Nature of Start-Ups
The estimated rate for dynamism for the U.S. 18-99 age group in 2008 using GEM data is 1.3. The ratio of total early-stage activity (TEA) to the total established business prevalence rate measures dynamism in an economy. Table 8 in the Public Policy section at the end of this report provides historical data on the dynamism rate for the United States from 2001 through 2008.
Entrepreneurial Activity and Age Distribution
The results for age distribution for early-stage and established business owners in the United States in 2008 indicate that younger adults in the 18-44 age range have higher prevalence rates in early-stage activity, while older adults in the 45-99 age
range have higher prevalence rates in established business activity (Figure 4). Furthermore, an in-depth examination of age distribution by comparing the 2007 data and determining the percentages per age group for both TEA (Figure 5) and for established businesses (Figure 6) yields some interesting results. With respect to the TEA, the data indicate marked decreases in the activity rate for the 18-24 age group (10.5% vs. 14%) and the 35-44 age group (20.2% vs. 25.1%), but increases in the older age groups (45-54 years, 27.7% vs. 21.8%; 55-64 years, 10.5% vs. 9.5%; 65-99 years, 4.3% vs. 3.4%). This indicates a shifting pattern of entrepreneurial activity. The share distribution of the TEA for the 18-44 age range decreased by 8% while the share distribution of the TEA for the 45-99 age range increased by 7.8% for 2008 compared to 2007.
0%
2%
4%
6%
8%
10%
12%
14%
16%
Early-Stage Established Business
Perc
enta
ge o
f Adu
lt Po
pula
tion
in A
ge G
roup
18-24 YRS25-34 YRS35-44 YRS45-54 YRS55-64 YRS65-99 YRS
Source: GEM U.S. 2008 Adult Population Survey (APS)
As illustrated in Figure 6, this pattern is similar for established firms, decreasing for the 18-24 age group (1.9% vs. 3.4%) and the 35-44 age group (14.6% vs. 23.9%), while it has increased for the older age groups (45-54 years, 37.5% vs. 30.7%; 65-99 years, 11.1% vs. 8.0%). The share distribution of the established business owner decreased a total 9.6% for the 18-44 age group while it increased 9.6% for the 45-99 age group in 2008 compared to 2007.
The results of the comparison between 2008 and 2007 indicate a significant shift in early-stage and established business owners’ share of entrepreneurial activity by age with increases for older age groups and decreases for younger age groups of around 8% for the TEA and 9.5% for the established businesses. This is clearly an area to examine in the future (to determine if this is a temporary or more permanent change) as well as the possible relationship between this shift and the economic situation of 2008. The strength of the current information in Figures 5 and 6 is, however, strong enough to provide significant food for thought.

17
Why do People Start Businesses in the United States? The Nature of Start-Ups
Figure 5. Age Distribution Per Year, TEA
0%
10%
20%
30%
40%
50%
60%
2001 2002 2003 2004 2005 2006 2007 2008
18-24 YRS25-34 YRS35-44 YRS45-54 YRS55-64 YRS65-99 YRS
Source: GEM U.S. 2001-2008 Adult Population Survey (APS)
Source: GEM U.S. 2001-2008 Adult Population Survey (APS)
Figure 6. Age Distribution Per Year, Established Businesses
0%
10%
20%
30%
40%
50%
60%
2001 2002 2003 2004 2005 2006 2007 2008
18-24 YRS25-34 YRS35-44 YRS45-54 YRS55-64 YRS65-99 YRS
Entrepreneurial Activity and Education
Historical GEM data and information from a significant number of other sources indicate that education is an important determinant of the supply of entrepreneurs in societies. Figure 7 measures the distribution of general education levels for early-stage entrepreneurs. The results in Figures 7-9 with respect
to education indicate changes in level of education and entrepreneurial activity for both the TEA and EST indicators. For 2008, the results indicate that for the TEA, 71.4% of entrepreneurs had post-secondary or graduate education (post-secondary, 25.8%; graduate education, 45.8%), and for the established business measures, 76.4% of entrepreneurs had post-secondary or graduate education (post-secondary,

18
Source: GEM U.S. 2001-2008 Adult Population Survey (APS)
Figure 7. Total Early-Stage Education Levels by Year
0%
10%
20%
30%
40%
50%
60%
70%
80%
90%
100%
2001 2002 2003 2004 2005 2006 2007 2008
Some SecondarySecondary DegreePost-SecondaryBachelors Degree or Higher
Figure 8. Percentage Distribution of Entrepreneurs by Education Levels (TEA)
0%
10%
20%
30%
40%
50%
60%
70%
2001 2002 2003 2004 2005 2006 2007 2008
Some Secondary
Secondary Degree
Post-Secondary
Bachelors Degree or Higher
Source: GEM U.S. 2001-2008 Adult Population Survey (APS)
25.6%; graduate education, 51.8%). This surprising result, combined with a large drop in the percentage of entrepreneurs with secondary degrees from 2007 to 2008 for both the TEA (38.2% to 17.1%) and established business measures (20.5% to 13.8 %), requires further assessment to determine the reasons behind this shift and to determine whether it is a temporary or permanent phenomenon.
This change may reflect the current economic crisis, with more educated workers opting to start their own firms. However, more data are needed to determine whether this is the case. Nevertheless, a trend to observe is the percentage increase of entrepreneurs with graduate education for both the TEA and the established business measures (Figures 8 and 9). For both measures, the increase of percentages of entrepreneurs with graduate education has been both consistent and significant.
Why do People Start Businesses in the United States? The Nature of Start-Ups

19
Figure 9. Percentage Distribution of Entrepreneurs by Education (Established Businesess)
0%
10%
20%
30%
40%
50%
60%
70%
2001 2002 2003 2004 2005 2006 2007 2008
Some Secondary
Secondary Degree
Post-Secondary
Bachelors Degree or Higher
Source: GEM U.S. 2001-2008 Adult Population Survey (APS)
Entrepreneurial Activity and Income Distribution
Finally, this report looks at distributions for different phases of U.S. entrepreneurial activity based on the income classification of entrepreneurs. The classifications for income are high, medium and low. High, medium and low represent the percentages of entrepreneurs that rank in the upper, middle or lower third of the income levels for the U.S. 18-99 age group for each year from 2003 to 2008. The results for those entrepreneurs in the total early-stage (TEA) and established business ownership (EST) phases of entrepreneurship are contained in Figures 10 and 11, respectively. Figure 10 illustrates that in the earlier
years, 2003–2004, the early-stage entrepreneurs had the highest percentage of entrepreneurial activity from the high-income U.S. population. Participation of the low- and middle-income early-stage entrepreneurs increased relative to the high-income early-stage entrepreneurs in 2005. In 2008, 31.8% of early-stage entrepreneurs are estimated to be in the lowest third income category, 36.8% are in the middle third and 31.3% are estimated to be in the highest third income category for early-stage entrepreneurial activity. Those numbers are consistent with and show little variation from data from the previous year, 2007. The middle-income category has maintained the highest distribution for activity in the early-stage phase from 2005 to 2008.
Why do People Start Businesses in the United States? The Nature of Start-Ups

20
0%
10%
20%
30%
40%
50%
60%
70%
80%
2003 2004 2005 2006 2007 2008
Lowest 33rd Percentile
Middle 33rd Percentile
Upper 33rd Percentile
Figure 11. Entrepreneurs by Income Segments (EST)
Source: GEM U.S. 2003-2008 Adult Population Survey (APS)
Figure 11 illustrates that the established business owners have the highest number of entrepreneurs in the high-income category for each year from 2003 to 2008. As was the case for the early-stage entrepreneurs, the low- and medium-income categories gained shares of the percentage of activity for the established business entrepreneurs, but the
high-income category declined in 2003 and 2004. However, the low-income category of entrepreneurs has been declining in percentage distributions since 2006 in the established business phase, whereas the middle-income category of entrepreneurs has increased its distribution in 2008 in the established business phase.
0%
10%
20%
30%
40%
50%
60%
70%
2003 2004 2005 2006 2007 2008
Lowest 33rd Percentile
Middle 33rd Percentile
Upper 33rd Percentile
Figure 10. Entrepreneurs by Income Segments (TEA)
Source: GEM U.S. 2003-2008 Adult Population Survey (APS)
Why do People Start Businesses in the United States? The Nature of Start-Ups

21
Why Do PEoPlE StArt bUSiNESSES iN thE UNitED StAtES?
Whether or not individuals start a new business depends on a complex series of factors. Intentions and perceptions are important determinants in the decision making process. Entrepreneurs who aspire to create jobs are of special interest in this troubled economic period. The intention to create jobs is an integrated measure of both an entrepreneur’s ability as a manager and of his/her perception of characteristics in the environment being conducive to entrepreneurial activity. Individual perceptions of skills and fear of failure also play important roles in the number and types of entrepreneurs entering the marketplace.
Attitudes and Perceived Opportunities for Starting a Business
A different picture emerges when differentiating between early-stage (TEA) and the non-early-stage (non-TEA) populations. Figure 12 indicates that in 2008, we see the highest percentage of good opportunities to start a business in six months for the non-early-stage population and the lowest percentage of positive responses for the early-stage entrepreneurs. This trend of less optimism in 2008 is also seen for start-ups of new businesses in three years by early-stage entrepreneurs and by established business entrepreneurs as well as the non-early-stage respondents.
0%
20%
40%
60%
80%
100%
2001 2002 2003 2004 2005 2006 2007 2008
Perc
enta
ge Ye
s
Non TEA TEA
Figure 12. Respondent Perceives Good Opportunities in the Next Six Months (18-99 Age Group)
Source: GEM U.S. 2001-2008 Adult Population Survey (APS)
The perception of good opportunities for starting new businesses in the United States in six months during the 2001—2007 period ranged from 61.1% to 72.5% (post-9/11) for early-stage entrepreneurs and from 21.1% to 30.3% for the rest of the population. Those involved in early-stage entrepreneurship were twice as optimistic about the opportunities to start a business in the near term for the 2001–2007 period.
Attitude and Perceptions of Knowledge and Skills to Start a Business
Figure 13 shows that there is a very high perception by early-stage entrepreneurs concerning their skills and knowledge to start and manage a business in the United States. The last two years, 2007 and 2008, however, have dipped below 90% for the early-stage entrepreneurs, perhaps indicative of the recession and financial crisis in the United States. Half of the non-early-stage entrepreneurs feel they have the knowledge to run a business over the 2001–2008 period.
Why do People Start Businesses in the United States? The Nature of Start-Ups

22
0%
20%
40%
60%
80%
100%
2001 2002 2003 2004 2005 2006 2007 2008
Perc
enta
ge Ye
s
Non TEA TEA
Figure 13. Respondent Has Knowledge to Start a Business (18-99 Age Group)
Source: GEM U.S. 2001-2008 Adult Population Survey (APS)
Attitude and Perceptions of Fear of Failure
Figure 14 illustrates the fear of failure as a consideration in starting or running a business. In 2008, there is an increase in the fear of failure to start a business for the overall U.S. population compared
to 2007. When examining the strength of the entrepreneurial ethos in the United States, scholars have centered on the notion that less concern for fear of failure would be a key driver of entrepreneurial behavior in the United States.
Aspirations and Expected Jobs from Start-Up
Figure 15 shows the historical number of jobs created during the start-up phase of entrepreneurship. The start-up phase includes the nascent and new business entrepreneur. From 2001 to 2006, the number of start-up businesses with no current jobs hovered around 80%. In 2007, based on the GEM data, there was a substantial decrease to 50% for the current
number of startups with no jobs. One definition of a high-growth entrepreneur is one that expects to create 20 or more jobs in five years. In 2007, we see over 10% of the start-up businesses with 20+ current jobs and over 8% in 2008. Figure 16 shows job creation numbers for start-up businesses expected in five years. The aspirations are that about 25% of the start-up businesses expect to create 20 or more jobs in five years in 2008, compared to less than 20% in 2007.
0%
5%
10%
15%
20%
25%
30%
35%
40%
2001 2002 2003 2004 2005 2006 2007 2008
Perc
enta
ge Ye
s
Non TEA TEA
Figure 14. Fear of Failure Prevents Start-Up (18-99 Age Group)
Source: GEM U.S. 2001-2008 Adult Population Survey (APS)
Why do People Start Businesses in the United States? The Nature of Start-Ups

23
0%
10%
20%
30%
40%
50%
60%
70%
80%
90%
100%
2001 2002 2003 2004 2005 2006 2007 2008
No Jobs
1-5 Jobs
6-19 Jobs
20+ Jobs
0%
10%
20%
30%
40%
50%
60%
2001 2002 2003 2004 2005 2006 2007 2008
No Jobs
1-5 Jobs
6-19 Jobs
20+ Jobs
Figure 15. Current Start-Up Jobs
Figure 16. Expected Jobs from Start-Up in Five Years
Source: GEM U.S. 2001-2008 Adult Population Survey (APS)
Source: GEM U.S. 2001-2008 Adult Population Survey (APS)
Why do People Start Businesses in the United States? The Nature of Start-Ups

24
Part 2 International Comparison: The United States and Other Countries
GEM PArtiCiPAtiNG CoUNtriES iN 2008
Forty-three countries participated in the GEM project in 2008. For more appropriate comparisons, the countries are grouped by similar stages of economic development: factor-driven countries, efficiency-driven countries and innovation-driven countries. These groupings are based on the World Economic Forum’s 2008-2009 Global Competitiveness Report (Porter and Schwab, 2008) and are as follows:
Factor-Driven Economies
Angola, Bolivia, Bosnia and Herzegovina,* Colombia,* Ecuador,* Egypt, India, Iran*
Efficiency-Driven Economies
Argentina, Brazil, Chile, Croatia,** Dominican Republic, Hungary,** Jamaica, Latvia, Macedonia, Mexico, Peru, Romania, Russia, Serbia, South Africa, Turkey, Uruguay
Innovation-Driven Economies
Belgium, Denmark, Finland, France, Germany, Greece, Iceland, Ireland, Israel, Italy, Japan, Republic of Korea, Netherlands, Norway, Slovenia, Spain, United Kingdom, United States
*Transition country: from factor-driven to efficiency-driven
**Transition country: from efficiency-driven to innovation-driven
25
0%
5%
10%
15%
20%
25%
30%
35%
Bosn
ia a
nd H
erzo
govi
na Iran
Indi
aEg
ypt
Ecua
dor
Ango
laCo
lom
bia
Boliv
iaRu
ssia
Rom
ania
Turk
eyLa
tvia
Hung
ary
Croa
tiaSe
rbia
Sout
h Af
rica
Urug
uay
Braz
ilM
exic
oCh
ileM
aced
onia
Jam
aica
Arge
ntin
aDo
min
ican
Rep
ublic
Peru
Belg
ium
Ger
man
yDe
nmar
kIta
lyN
ethe
rland
sJa
pan
Fran
ceUn
ited
King
dom
Slov
enia
Isra
elSp
ain
Finl
and
Irela
ndN
orw
ayG
reec
eRe
publ
ic o
f Kor
eaIc
elan
dUn
ited
Stat
es
Factor-Driven Economies
Efficiency-Driven Economies Innovation-Driven Economies
Perc
enta
ge o
f Ad
ult
Popu
latio
n be
twee
n 18
-64
Age
Gro
up
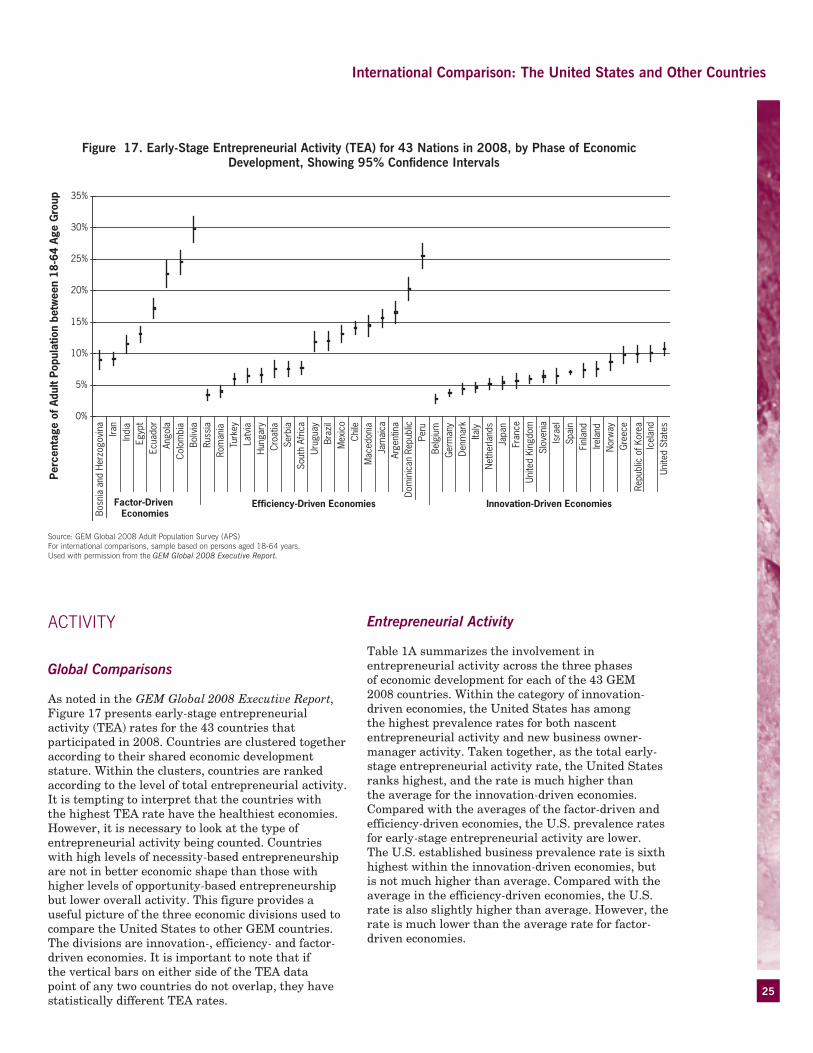
Figure 17. Early-Stage Entrepreneurial Activity (TEA) for 43 Nations in 2008, by Phase of Economic Development, Showing 95% Confidence Intervals
Source: GEM Global 2008 Adult Population Survey (APS)for international comparisons, sample based on persons aged 18-64 years.Used with permission from the GEM Global 2008 Executive Report.
ACtivity
Global Comparisons
As noted in the GEM Global 2008 Executive Report, Figure 17 presents early-stage entrepreneurial activity (TEA) rates for the 43 countries that participated in 2008. Countries are clustered together according to their shared economic development stature. Within the clusters, countries are ranked according to the level of total entrepreneurial activity. It is tempting to interpret that the countries with the highest TEA rate have the healthiest economies. However, it is necessary to look at the type of entrepreneurial activity being counted. Countries with high levels of necessity-based entrepreneurship are not in better economic shape than those with higher levels of opportunity-based entrepreneurship but lower overall activity. This figure provides a useful picture of the three economic divisions used to compare the United States to other GEM countries. The divisions are innovation-, efficiency- and factor-driven economies. It is important to note that if the vertical bars on either side of the TEA data point of any two countries do not overlap, they have statistically different TEA rates.
Entrepreneurial Activity
Table 1A summarizes the involvement in entrepreneurial activity across the three phases of economic development for each of the 43 GEM 2008 countries. Within the category of innovation-driven economies, the United States has among the highest prevalence rates for both nascent entrepreneurial activity and new business owner-manager activity. Taken together, as the total early-stage entrepreneurial activity rate, the United States ranks highest, and the rate is much higher than the average for the innovation-driven economies. Compared with the averages of the factor-driven and efficiency-driven economies, the U.S. prevalence rates for early-stage entrepreneurial activity are lower. The U.S. established business prevalence rate is sixth highest within the innovation-driven economies, but is not much higher than average. Compared with the average in the efficiency-driven economies, the U.S. rate is also slightly higher than average. However, the rate is much lower than the average rate for factor-driven economies.
International Comparison: The United States and Other Countries

26
NASCENT ENTREPRENEURIAL ACTIVITY (%)
NEW FIRM ENTREPRENEURS (%)
EARLY-STAGE ENTREPRENEURIAL ACTIVITY (%)
ESTABLISHED ENTREPRENEURS (%)
BUSINESS DISCONTINUATION RATE (%)
EARLY-STAGE OPPORTUNITY RATE (%)
EARLY-STAGE NECESSITY RATE (%)
Factor-Driven Economies
Angola 19.9 3.8 23.1 5.7 22.3 11.4 7.6
Bolivia 17.0 13.6 28.8 20.3 10.7 20.3 8.3
Bosnia and Herzegovina 5.0 2.0 7.0 7.5 4.0 3.8 3.1
Colombia 12.6 10.7 22.4 12.9 6.5 12.7 9.3
Ecuador 8.7 9.1 17.2 11.9 5.9 12.1 4.9
Egypt 7.9 5.5 13.1 8.0 6.3 10.5 2.4
India 6.1 4.3 10.1 15.8 11.9 7.1 2.2
Iran 5.4 3.1 8.5 6.2 8.6 5.4 2.6
Average 10.6 7.1 17.0 11.8 8.9 11.1 5.2
Efficiency-Driven Economies
Argentina 6.9 6.8 13.3 12.8 8.9 8.0 5.1
Brazil 3.0 9.3 12.0 14.6 3.5 8.1 4.0
Chile 7.3 5.1 12.3 6.6 5.4 8.8 3.0
Croatia 3.6 2.0 5.5 3.9 2.5 3.9 1.6
Dominican Republic 10.1 8.5 17.6 7.1 9.7 12.1 5.4
Hungary 3.9 2.8 6.6 5.4 1.1 4.4 1.9
Jamaica 7.4 5.8 12.9 14.2 7.5 6.6 6.0
Latvia 3.9 2.7 6.5 3.0 1.8 4.9 1.3
Macedonia 5.6 6.7 12.0 9.7 4.7 5.7 5.9
Mexico 8.4 3.5 11.7 4.7 13.2 9.0 1.5
Peru 19.7 6.8 25.6 8.3 10.4 17.0 8.0
Romania 1.9 1.2 3.1 1.9 1.8 1.6 1.0
Russia 1.7 2.0 3.5 1.1 1.1 2.5 0.7
Serbia 2.9 2.8 5.6 8.3 3.3 3.5 1.8
South Africa 5.2 2.0 7.1 2.6 5.2 5.6 1.4
Turkey 3.2 3.0 6.0 4.8 4.0 3.5 2.3
Uruguay 6.0 3.3 9.2 6.6 7.5 5.9 2.3
Average 6.0 4.2 10.0 6.7 5.7 6.6 3.0
Innovation-Driven Economies
Belgium 2.0 0.9 2.9 2.7 1.5 2.4 0.3
Denmark 2.3 2.2 4.4 4.4 1.9 4.1 0.3
Finland 4.1 3.3 7.4 9.1 2.0 6.1 0.9
France 2.8 1.4 4.2 2.0 2.4 3.5 0.4
Germany 2.4 1.5 3.8 4.0 1.8 2.7 1.0
Greece 5.2 4.6 9.9 12.6 2.9 6.7 3.1
Iceland 6.5 3.6 10.0 7.1 3.4 8.2 0.5
Ireland 3.3 4.3 7.6 9.0 3.6 5.7 1.4
Israel 2.8 2.5 5.1 4.3 2.7 3.6 1.1
Italy 2.0 2.7 4.6 6.5 1.8 3.6 0.7
Japan 2.1 1.5 3.5 7.8 2.5 2.6 0.8
Republic of Korea 3.6 6.5 10.0 12.9 4.7 5.8 4.1
Netherlands 1.7 2.3 4.0 5.8 1.3 3.2 0.4
Norway 3.9 3.2 6.9 7.6 3.5 5.8 0.5
Slovenia 4.1 2.4 6.4 5.6 1.3 5.6 0.8
Spain 3.3 3.9 7.0 9.1 1.3 5.6 1.0
United Kingdom 2.3 2.2 4.4 4.4 2.0 3.5 0.6
United States 4.8 4.0 8.7 7.7 4.1 7.2 1.0
Average 3.2 3.2 6.3 7.4 2.0 5.0 1.0
GEM Average 6.0 4.4 10.2 7.1 5.4 6.7 3.1
Table 1A. Prevalence Rates in Percentage of Entrepreneurial Activity and Business Owner-Managers Across GEM Countries in 2008, for the 18-99 Age Group,* by Phase of Economic Development
Source: GEM Global 2008 Adult Population Survey (APS). for international comparisons, sample based on persons aged 18-99 years.*for the age group 18-64 see table 1b in the Appendix.
International Comparison: The United States and Other Countries

27
Entrepreneurial Motivations
The opportunity-driven early-stage entrepreneurial activity rate is the highest in the United States, much higher than the average within the category. The rate is slightly higher than the average of efficiency-driven economies but lower than the average of factor-driven countries. The necessity-driven early-stage entrepreneurial activity rate in the United States is slightly higher than the average for innovation-driven economies but is lower than the averages of both efficiency-driven and factor-driven economies.
Discontinuing Business
The U.S. business discontinuation rate is second highest among innovation-driven countries and is much higher than the average, possibly indicating a propensity to terminate business experiments that are not viable. The U.S. rate, however, is much lower than the averages of both efficiency-driven and factor-driven economies.
Sector Distributions
As shown in Figures 18 and 19, the distribution by industry sector of early-stage entrepreneurial activity and established business owner-managers follows an expected pattern across the three phases of economic development. Extraction businesses (farming, forestry, fishing and mining) are expected to be more prevalent in factor-driven economies. Transforming businesses (manufacturing and construction) are expected to be more prevalent in efficiency-driven economies. Business services should be more prevalent in innovation-driven economies. Furthermore, the proportion of consumer-oriented businesses should decline for each higher phase of economic development. Countries with poorly developed transportation and commercial infrastructure tend to have higher proportions of consumer-oriented businesses. The United States has a noticeably smaller proportion of consumer-oriented businesses than the averages of each of the three phases of development for both early-stage entrepreneurial activity and established business owner-managers. In both figures, the proportion of the business services sector is much larger than the averages of the three phases of economic development.
0% 20% 40% 60% 80% 100%
Factor-Driven Economies
Efficiency-Driven Economies
Innovation-Driven Economies
United States
Extractive Transforming Business Services Consumer-Oriented
Figure 18. Sector Distribution Early-Stage Entrepreneurial Activity (18-64 Age Group)
Source: GEM Global 2008 Adult Population Survey (APS). for international comparisons, sample based on persons aged 18-64 years.
International Comparison: The United States and Other Countries

28
International Comparison: The United States and Other Countries
0% 20% 40% 60% 80% 100%
Factor-Driven Economies
Efficiency-Driven Economies
Innovation-Driven Economies
United States
Extractive Transforming Business Services Consumer-Oriented
Figure 19. Sector Distribution Established Businesses (18-64 Age Group)
Source: GEM Global 2008 Adult Population Survey (APS). for international comparisons, sample based on persons aged 18-64 years.
Age and Gender Structure
As shown in Figure 20, the shapes of the age distributions are very similar across the averages of the three economic phases of development for early-stage entrepreneurial activity, with the 25-34 range having the highest prevalence rate. The U.S. age distribution also follows a similar age pattern, but with approximately equal prevalence rates across the 35-44 range and the 25-34 range. This indicates that unlike the global averages, in the United States there is a higher rate of entrepreneurial activity in the 35-44 age group relative to the 25-34 age group.
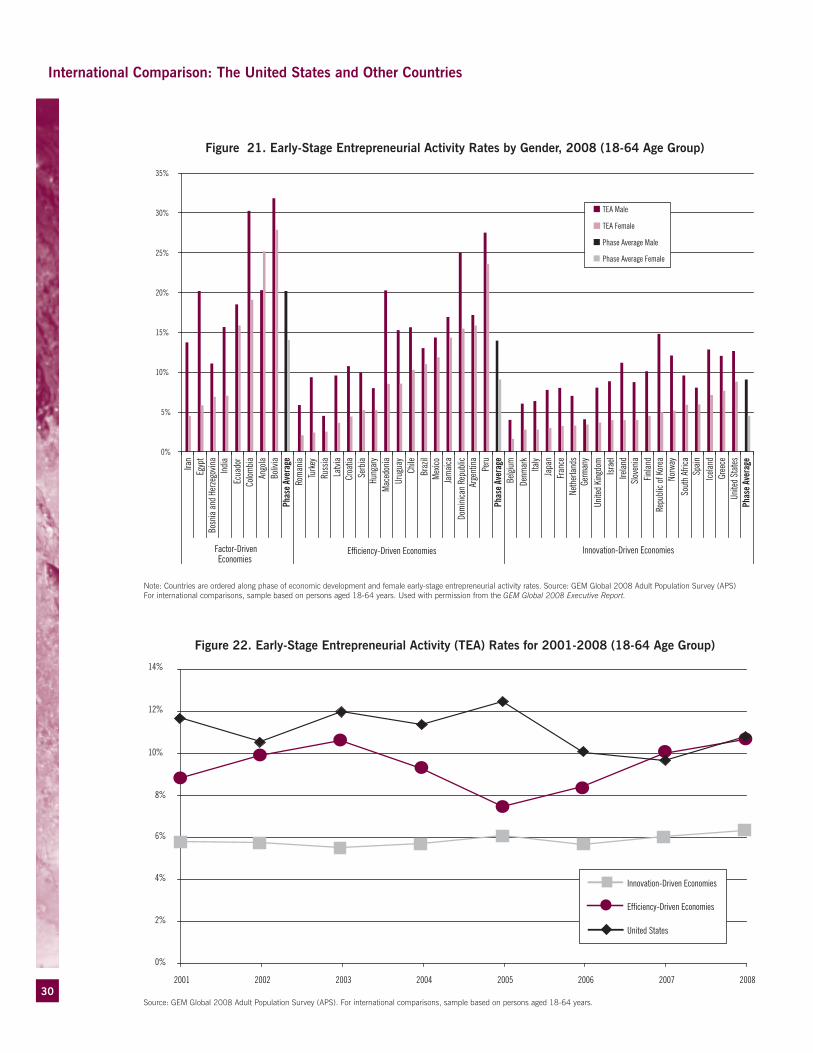
Figure 21 displays the differences in female and male participation for each country, grouped by phase of economic development with increasing female participation rate. The gap in the average ratio of male to female participation increases across the phases—with lows of 1.4 males to females in factor-driven economies and 1.5 males to females in efficiency-driven economies—to twice as many males involved in early-stage entrepreneurial activity than women in innovation-driven countries. The gap is smaller in the United States, on the other hand, with more women involved in early-stage entrepreneurial activity relative to the average rate in innovation-driven countries.

29
International Comparison: The United States and Other Countries
0%
5%
10%
15%
20%
25%
Factor-DrivenEconomies
Efficiency-DrivenEconomies
Innovation-DrivenEconomies
United States
Perc
enta
ge o
f Adu
lt Pp
opul
atio
n in
Age
Gro
up
18-24 YRS
25-34 YRS
35-44 YRS
45-54 YRS
55-64 YRS
Figure 20. Early-Stage Entrepreneurial Activity for Separate Age Groups, 2008
Source: GEM Global 2008 Adult Population Survey (APS). for international comparisons, sample based on persons aged 18-64 years.
Trend in Early-Stage Entrepreneurial Activity 2001–2008
Figure 22 is a chart of the average annual TEA rates from 2001 to 2008 for the United States and a subset of GEM efficiency-driven and innovation-driven countries. The TEA rates for innovation-driven economies have been stable at around a 6% rate since 2001. The TEA rate for efficiency-driven economies has been more volatile, but on average has been higher than the rate for innovation-driven economies. The U.S. TEA rate has been substantially higher than the average TEA rate for innovation-
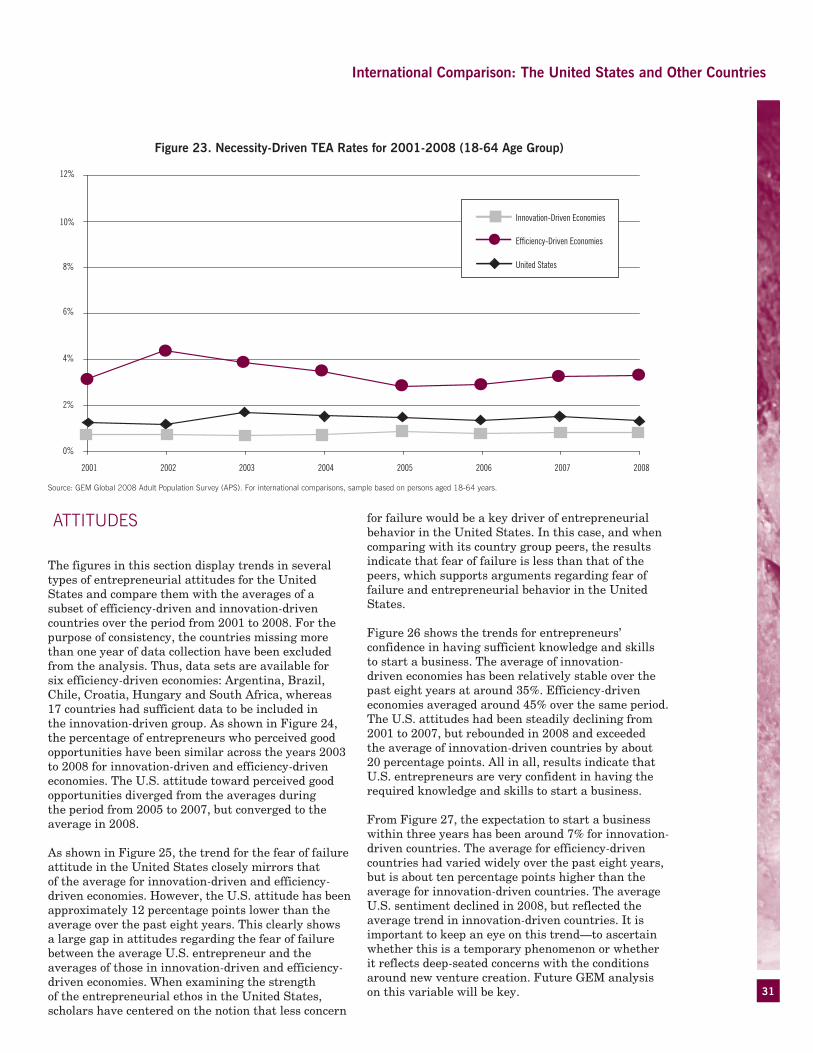
driven economies. In the past two years, the U.S. rate has fallen to a level comparable to the average TEA rate for efficiency-driven economies. Figure 23 shows the trends in necessity-driven TEA rates from 2001 to 2008 for the United States and a subset of GEM efficiency-driven and innovation-driven countries. Similarly, the average for innovation-driven economies has been stable at a rate under 1% since 2001, while the rate for the efficiency-driven countries has averaged around 3%. On the other hand, although the U.S. necessity-driven TEA rate has been stable, it is slightly higher than the average for innovation-driven economies but lower than the average for efficiency-driven economies.
30
0%
2%
4%
6%
8%
10%
12%
14%
2001 2002 2003 2004 2005 2006 2007 2008
Innovation-Driven Economies
Efficiency-Driven Economies
United States
Source: GEM Global 2008 Adult Population Survey (APS). for international comparisons, sample based on persons aged 18-64 years.
Figure 22. Early-Stage Entrepreneurial Activity (TEA) Rates for 2001-2008 (18-64 Age Group)
International Comparison: The United States and Other Countries
Note: Countries are ordered along phase of economic development and female early-stage entrepreneurial activity rates. Source: GEM Global 2008 Adult Population Survey (APS)for international comparisons, sample based on persons aged 18-64 years. Used with permission from the GEM Global 2008 Executive Report.
Figure 21. Early-Stage Entrepreneurial Activity Rates by Gender, 2008 (18-64 Age Group)
0%
5%
10%
15%
20%
25%
30%
35%
Iran
Egyp
tBo
snia
and
Herze
govin
aIn
dia
Ecua
dor
Colom
bia
An
gola
Boliv
iaPh
ase
Aver
age
Rom
ania
Turk
ey
Russ
ia
Latv
ia
Croa
tia
Serb
ia Hu
ngar
y
M
aced
onia
Urug
uay
Chile
Br
azil
Mex
ico
Jam
aica
Dom
inica
n Re
publi
c Ar
gent
ina
Peru
Phas
e Av
erag
e Be
lgium
De
nmar
k
Ita
ly
Japa
n
Fran
ce
Neth
erlan
ds
Germ
any
Unite
d Ki
ngdo
m
Isr
ael
Irelan
d
Sl
oven
ia
Fin
land
Repu
blic o
f Kor
eaNo
rway
So
uth
Afric
a
Spain
Ice
land
Gree
ce
Unite
d St
ates
Phas
e Av
erag
e
Factor-DrivenEconomies
Efficiency-Driven Economies Innovation-Driven Economies
TEA Male
TEA Female
Phase Average Male
Phase Average Female
31
0%
2%
4%
6%
8%
10%
12%
2001 2002 2003 2004 2005 2006 2007 2008
Innovation-Driven Economies
Efficiency-Driven Economies
United States
Figure 23. Necessity-Driven TEA Rates for 2001-2008 (18-64 Age Group)
International Comparison: The United States and Other Countries
Source: GEM Global 2008 Adult Population Survey (APS). for international comparisons, sample based on persons aged 18-64 years.
AttitUDES
The figures in this section display trends in several types of entrepreneurial attitudes for the United States and compare them with the averages of a subset of efficiency-driven and innovation-driven countries over the period from 2001 to 2008. For the purpose of consistency, the countries missing more than one year of data collection have been excluded from the analysis. Thus, data sets are available for six efficiency-driven economies: Argentina, Brazil, Chile, Croatia, Hungary and South Africa, whereas 17 countries had sufficient data to be included in the innovation-driven group. As shown in Figure 24, the percentage of entrepreneurs who perceived good opportunities have been similar across the years 2003 to 2008 for innovation-driven and efficiency-driven economies. The U.S. attitude toward perceived good opportunities diverged from the averages during the period from 2005 to 2007, but converged to the average in 2008.
As shown in Figure 25, the trend for the fear of failure attitude in the United States closely mirrors that of the average for innovation-driven and efficiency-driven economies. However, the U.S. attitude has been approximately 12 percentage points lower than the average over the past eight years. This clearly shows a large gap in attitudes regarding the fear of failure between the average U.S. entrepreneur and the averages of those in innovation-driven and efficiency-driven economies. When examining the strength of the entrepreneurial ethos in the United States, scholars have centered on the notion that less concern
for failure would be a key driver of entrepreneurial behavior in the United States. In this case, and when comparing with its country group peers, the results indicate that fear of failure is less than that of the peers, which supports arguments regarding fear of failure and entrepreneurial behavior in the United States.
Figure 26 shows the trends for entrepreneurs’ confidence in having sufficient knowledge and skills to start a business. The average of innovation-driven economies has been relatively stable over the past eight years at around 35%. Efficiency-driven economies averaged around 45% over the same period. The U.S. attitudes had been steadily declining from 2001 to 2007, but rebounded in 2008 and exceeded the average of innovation-driven countries by about 20 percentage points. All in all, results indicate that U.S. entrepreneurs are very confident in having the required knowledge and skills to start a business.
From Figure 27, the expectation to start a business within three years has been around 7% for innovation-driven countries. The average for efficiency-driven countries had varied widely over the past eight years, but is about ten percentage points higher than the average for innovation-driven countries. The average U.S. sentiment declined in 2008, but reflected the average trend in innovation-driven countries. It is important to keep an eye on this trend—to ascertain whether this is a temporary phenomenon or whether it reflects deep-seated concerns with the conditions around new venture creation. Future GEM analysis on this variable will be key.

32
International Comparison: The United States and Other Countries
20%
25%
30%
35%
40%
45%
2001 2002 2003 2004 2005 2006 2007 2008
Innovation-Driven Economies
Efficiency-Driven Economies
United States
Figure 24. Perceived Opportunities for Starting a Business, 2001-2008
Source: GEM Global 2008 Adult Population Survey (APS). for international comparisons, sample based on persons aged 18-64 years.
20%
25%
30%
35%
40%
2001 2002 2003 2004 2005 2006 2007 2008
Innovation-Driven Economies
Efficiency-Driven Economies
United States
Figure 25. Fear of Failure Among Those Who Perceive Good Start-Up Opportunities, 2001-2008
Source: GEM Global 2008 Adult Population Survey (APS). for international comparisons, sample based on persons aged 18-64 years.

33
International Comparison: The United States and Other Countries
Figure 26. Perceived Skills and Knowledge to Start a Business, 2001-2008
Source: GEM Global 2008 Adult Population Survey (APS). for international comparisons, sample based on persons aged 18-64 years.
Figure 27. Intentions to Start a New Business in the Next Three Years, 2002-2008
Source: GEM Global 2008 Adult Population Survey (APS). for international comparisons, sample based on persons aged 18-64 years.
30%
35%
40%
45%
50%
55%
60%
65%
2001 2002 2003 2004 2005 2006 2007 2008
Innovation-Driven Economies
Efficiency-Driven Economies
United States
0%
2%
4%
6%
8%
10%
12%
14%
16%
18%
2001 2002 2003 2004 2005 2006 2007 2008
Innovation-Driven Economies
Efficiency-Driven Economies
United States

34
ASPirAtioNS
Figure 28 shows the rate of high-growth expectation for early-stage entrepreneurship in GEM countries for which a sufficient sample size was available,
grouped by level of economic development. The United States has the fifth highest rate among innovation-driven countries and is above the average within the innovation-driven grouping. Compared with efficiency-driven and factor-driven countries, the U.S. rate is approximately equal to the averages of those groups.
Figure 28. High-Growth Expectations Early-Stage Entrepreneurial Activity by Country
Source: GEM Global 2008 Adult Population Survey (APS)for international comparisons, sample based on persons aged 18-64 years.Used with permission from GEM Global 2008 Executive Report.
0%
5%
10%
15%
20%
25%
30%
India
Colom
biaCh
ina
Aver
age
Mex
ico
Thail
and
Braz
ilPe
ruHu
ngar
y
Sout
h Afri
ca
Arge
ntin
aCr
oatia
Chile
Latv
iaTu
rkey
Aver
age
Spain
Gree
ceFr
ance
Finlan
dBe
lgium
Aust
ralia
Norw
ayNe
ther
lands
New
Zeala
ndSw
itzer
land
Japa
nIta
ly
Swed
enUn
ited
King
dom
Germ
any
Denm
ark
Irelan
dSl
oven
ia
Unite
d St
ates
Cana
da
Icelan
dSi
ngap
ore
Hong
Kon
g
Aver
age
Factor-Driven
Efficiency-Driven Innovation-Driven
Perc
enta
ge o
f Ear
ly-St
age
Entre
pren
eurs
Country Mean
Phase Average
International Comparison: The United States and Other Countries
35
WoMEN’S ENtrEPrENEUrShiP
It is widely acknowledged that women own 30% and are majority owners of 6.7 million of more than 23 million U.S. businesses (www.cfwbr.org). This impressive statistic includes businesses that were co-founded, acquired or inherited, but does not capture those recently launched. In comparison, the GEM 2008 data set captures those women led ventures in the nascent and early-stage and allows comparisons by gender.
As noted in Part 1, the rate of start-up activity in 2008 for women entrepreneurs was 7.5% compared to 9.8% for men, whereas in 2007 it was 7.3% for women and 12.0% for men. This suggests that the rate of women’s
entrepreneurship has been steady, but for men it has declined, effectively decreasing the gap between them. More than 50% of women started businesses are in consumer services versus 24% of those started by men, while men were more likely to launch ventures (46%) compared to women (26%). While the majority of all nascent ventures are no/low-technology, 10% of men compared to 2.6% of women are in the high-technology sector.
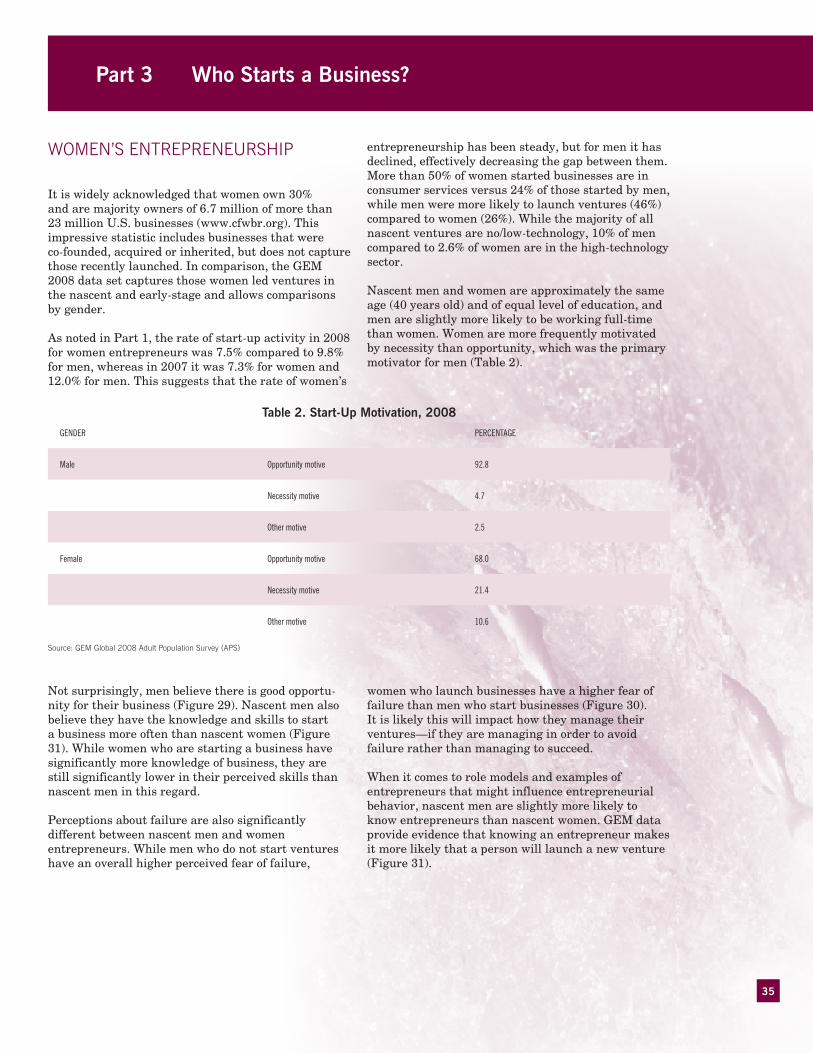
Nascent men and women are approximately the same age (40 years old) and of equal level of education, and men are slightly more likely to be working full-time than women. Women are more frequently motivated by necessity than opportunity, which was the primary motivator for men (Table 2).
Part 3 Who Starts a Business?
Table 2. Start-Up Motivation, 2008
GENDER PERCENTAGE
Male Opportunity motive 92.8
Necessity motive 4.7
Other motive 2.5
Female Opportunity motive 68.0
Necessity motive 21.4
Other motive 10.6
Source: GEM Global 2008 Adult Population Survey (APS)
Not surprisingly, men believe there is good opportu-nity for their business (Figure 29). Nascent men also believe they have the knowledge and skills to start a business more often than nascent women (Figure 31). While women who are starting a business have significantly more knowledge of business, they are still significantly lower in their perceived skills than nascent men in this regard.
Perceptions about failure are also significantly different between nascent men and women entrepreneurs. While men who do not start ventures have an overall higher perceived fear of failure,
women who launch businesses have a higher fear of failure than men who start businesses (Figure 30). It is likely this will impact how they manage their ventures—if they are managing in order to avoid failure rather than managing to succeed.
When it comes to role models and examples of entrepreneurs that might influence entrepreneurial behavior, nascent men are slightly more likely to know entrepreneurs than nascent women. GEM data provide evidence that knowing an entrepreneur makes it more likely that a person will launch a new venture (Figure 31).

36
Figure 29. Perceptions of Good Opportunities, Female vs. Male, 2008
Source: GEM U.S. 2008 Adult Population Survey (APS)
0%
10%
20%
30%
40%
50%
60%
70%
80%
90%
100%
Male Female
Fear of Failure/No Start-Up
Fear of Failure/ Yes Start-Up
Figure 30. Fear of Failure Rates, Female vs. Male, 2008
Source: GEM U.S. 2008 Adult Population Survey (APS)
0%
10%
20%
30%
40%
50%
60%
70%
80%
Male Female
Personally Knows an
Entrepreneur (No Start-Up)
Personally Knows an
Entrepreneur (Yes, Start-Up)
Who Starts a Business?

37
Who Starts a Business?
Source: GEM U.S. 2008 Adult Population Survey (APS)
0%
10%
20%
30%
40%
50%
60%
70%
80%
90%
100%
Male Female
Has Knowledge and Skill
for a Start-up (No Start-Up)
Has Knowledge and Skill
for a Start-up (Yes, Start-Up)
Figure 31. Personally Knows an Entreprenuerial Rates, Female vs. Male, 2008
The start-up circumstances for men and women vary significantly; 40% of women come from households earning less than $50,000 a year compared to 23% of men. Furthermore, 20% of nascent men come from households earning more than $150,000 a year compared to only 11% of nascent women. This is likely related to the comparatively lower plans for start-up funding, where 80% of women expect to spend less than $5,000 versus 64% of men. In considering the start-up investment, the data show that women start ventures with eight-times less funding than their male counterparts.
When it comes to expansion, slightly more nascent men expect to develop new products and services, and significantly more men are likely to apply or use new technology in their venture in the next six months.
Some of the same trends for men and women are apparent when considering newly established businesses. Men and women established owners are similar in age (50 years old), education (BA) and share similar perceptions that entrepreneurship is a good opportunity. Women are more prevalent in the consumer sector (39% to 29%), but about a third of all established women owned ventures are in business services, equivalent to the percentage of men.
A slightly higher percentage of men than women are working full-time in their businesses, and established
women entrepreneurs have a greater fear of failure and lower perception that new business success leads to higher status than do their male counterparts.
iMMiGrANt ENtrEPrENEUrShiP
The GEM 2008 APS data set serves as the basis for analysis of minority and immigrant entrepreneurs. This is in contrast to the source of data for the analysis of the minority and immigrant data used in the GEM 2006—2007 United States Executive Report.
Activity
Table 3 gives an overall picture of start-up activity rates for early-stage and established businesses as well as anticipated rates of business discontinuation by ethnic groups and immigration status. Focusing on three groups with the largest sample sizes as shown in Table 3—whites, African Americans and non-Mexican Hispanics (Hispanic/Latino)—it can be seen that 8.37% of whites are engaged in early-stage activity, 8.06% in established business activity and 3.92% anticipate discontinuing a business. This compares to a much higher level of start-up activity for African Americans (13.29%) and a much lower level of established business operation (1.81%). African Americans, perhaps because of this lower level of established business operation, also have a much

38
Who Starts a Business?
lower level of anticipated business discontinuation (1.20%) than whites. Non-Mexican Hispanic have a level of early-stage activity (8.59%) similar to that of whites, a somewhat lower level of established business operation (5.47%) and a similar level of anticipated business discontinuation (3.91%).
With some exceptions, this pattern continues when the samples are broken out by immigration status. Immigrant whites and African Americans have relatively greater levels of early-stage activity
compared to established business activity, perhaps due to their shorter time in the United States. Non-Mexican Hispanic immigrants have equal levels of early- and established- stage business activity, but the sample size is too small for this finding to be statistically significant. The larger sample of non-immigrant non-Mexican Hispanic shows levels of activity similar to the overall sample of early-stage (7.27%) and of established business activity (4.50%). Their rate of anticipated business discontinuation (4.55%) is also close to the overall rate.
ETHNICITYTOTAL EARLY-STAGE ENTREPRENEURIAL ACTIVITY
RATE OF OWNERSHIP OF ESTABLISHED BUSINESSES
RATE OF DISCONTINUING BUSINESS OPERATION
Total by Ethnicity
White/Caucasian American 8.37 8.06 3.92
Black/African American 13.29 1.81 1.20
Mexican/Mexican American 12.50 27.08 17.02
Hispanic/Latino American (Non-Mexican) 8.59 5.47 3.91
Asian/Asian American 7.94 4.76 0.00
American Indian 12.50 12.82 5.00
Other 8.72 11.05 8.14
Total United States 8.73 7.72 4.06
Total by Minorities (Excludes Other) 11.64 5.58 3.12
Total by Immigrant
White/Caucasian American 7.77 5.70 5.15
Black/African American 14.29 6.35 6.25
Mexican/Mexican American 20.00 30.00 30.00
Hispanic/Latino American (Non-Mexican) 11.76 11.76 0.00
Asian/Asian American 12.12 9.09 0.00
Other 5.13 2.56 2.56
Total Immigrants 9.43 6.74 5.12
Total by Minorities (Excludes Other) 13.71 10.48 5.65
Total by Non-Immigrant
White/Caucasian American 8.38 8.19 3.86
Black/African American 13.06 0.75 0.00
Mexican/Mexican American 10.53 26.32 15.38
Hispanic/Latino American (Non-Mexican) 7.27 4.50 4.55
Asian/Asian American 6.90 0.00 0.00
American Indian 13.51 10.81 5.41
Other 10.08 13.95 10.08
Total Non-Immigrants 8.81 7.90 4.00
Total by Minorities (Excludes Other) 11.20 4.35 2.69
Table 3. Prevalence Rates in Percentage of Entrepreneurial Activity for Immigrant and Non-Immigrant Ethnic Groups
Source: GEM U.S. 2008 Adult Population Survey (APS)

39
Who Starts a Business?
Again, focusing on the three largest sub-samples of whites, African Americans and non-Mexican Hispanics, the overall impressions are that whites have relatively equal amounts of early-stage and established business activity (approximately 8% each), while African Americans are more focused on early-stage activity—especially for the non-immigrant group—and the non-Mexican Hispanic sample falls between the two. It is interesting to see that the overall rates of activity calculated by combining the early-stage and established rates of business activity for these groups is quite similar among whites (16.43%), non-Mexican Hispanics (14.06%), and African Americans (15.10%).
Attitudes
The second component to use as a basis for analysis of entrepreneurship is attitudes. Attitudes include items such as knowing an entrepreneur personally, possessing the skills necessary to be an entrepreneur and attaching high-status to the profession of entrepreneur. The third component of entrepreneurship is aspirations, which include items such as focus on new products, orientation to foreign markets and high-growth plans, among others. Figures 32–41 give a picture of some of these aspects of entrepreneurship. Again, because of sample size limitation, the most meaningful data will come from the three largest sub-samples of whites, African Americans and non-Mexican Hispanics.
Figure 32 shows a relatively equal picture across minority groups (immigrant and non-immigrant) in regard to personally knowing an entrepreneur for non-early-stage entrepreneurs and somewhat greater exposure to entrepreneurs for early-stage African Americans and non-Mexican Hispanics than for whites.
Figure 32. Personally Knew Entrepreneur in the Past Two Years
**Chi-square or fisher Exact Statistic <.01, non early-stage versus earlystage samples are statistically significantly different at the 99% C.i.Source: GEM U.S. 2008 Adult Population Survey (APS)
0%
20%
40%
60%
80%
100%
White** African American** HispanicLatino**
Asian AmericanIndian**
Other**
Non Early-Stage
Early-Stage

40
Who Starts a Business?
Figure 33. Perceive Good Opportunities for Start-Ups in Six Months
**Chi-square or fisher Exact Statistic <.01, non early-stage versus early-stage samples are statistically significantly different at the 99% C.i.Source: GEM U.S. 2008 Adult Population Survey (APS)
0%
20%
40%
60%
80%
100%
White** African American** HispanicLatino
Asian AmericanIndian
Other**
Non Early-Stage
Early-Stage
In terms of believing in good opportunities during the next six-month period (Figure 33), there is a relatively equal perception among minority groups, although early-stage non-Mexican Hispanics are somewhat less optimistic in this sense than the other two early-stage minority groups. The three largest groups also believe they generally have the knowledge required to start a business, although early-stage African Americans and non-early-stage Hispanic samples believe this to a somewhat lesser degree than the others.
Figure 34 presents the percentage of each group who believe they have the knowledge and skills to start a business. There is relative parity between the three groups with the largest samples, although the Asian group of non-early-stage entrepreneurs feels much less prepared than the three other groups—a difference that is statistically significant.
Figure 34. Have Knowledge to Start a Business
**Chi-square or fisher Exact Statistic <.01, non early-stage versus early-stage samples are statistically significantly different at the 99% C.i.Source: GEM U.S. 2008 Adult Population Survey (APS)
0%
20%
40%
60%
80%
100%
White** African American HispanicLatino**
Asian** AmericanIndian
Other
Non Early-Stage
Early-Stage

41
Who Starts a Business?
Figure 35. Fear of Failure Prevents Start-Up Effort
**Chi-square or fisher Exact Statistic <.01, non early-stage versus early-stage samples are statistically significantly different at the 99% C.i.Source: GEM U.S. 2008 Adult Population Survey (APS)
0%
20%
40%
60%
80%
100%
White African American** HispanicLatino
Asian AmericanIndian
Other
Non Early-Stage
Early-Stage
Fear of failure–or more accurately a lack of fear of failure–is presented in Figure 35. The only statistically significant difference is evidenced among the early-stage African Americans, who report a much lower fear of failure than the others. In regard to plans for launching a start-up in the next three years, Figure 36 shows that the non-Mexican Hispanics are most ambitious, with 86.7% of the early-stage and 14.6% of the established business owners planning a start-up. African Americans have anticipated rates of start-ups of approximately 25% less than the non-Mexican Hispanics.
Figure 36 also shows that African Americans and whites are more than 25% lower in rates of anticipated start-ups than the non-Mexican Hispanics. The anticipated shut-down rate for the next year is relatively low for all the sub-samples, but almost zero for the African American sample, highest for the non-Mexican Hispanic (6.9% and 18.8% for the established and early-stage groups respectively) and somewhat toward the mean for the white group (Figure 37).
Figure 36. Expect to Launch Start-Up in Three Years
**Chi-square or fisher Exact Statistic <.01, non early-stage versus early-stage samples are statistically significantly different at the 99% C.i.Source: GEM U.S. 2008 Adult Population Survey (APS)
0%
20%
40%
60%
80%
100%
White** African American** HispanicLatino**
Asian AmericanIndian
Other**
Non Early-Stage
Early-Stage

42
Who Starts a Business?
Figure 37. Shut Down Business in the Past 12 Months
**Chi-square or fisher Exact Statistic <.01, non early-stage versus early-stage samples are statistically significantly different at the 99% C.i.Source: GEM U.S. 2008 Adult Population Survey (APS)
0%
10%
20%
30%
40%
50%
60%
70%
80%
90%
100%
White** African American Hispanic Latino
Asian American Indian
Other
Non Early-Stage
Early-Stage
Figures 38–43 present answers to the same questions for the immigrant white and minority samples and, with a few exceptions, have similar findings. The exceptions largely relate to the early-stage non-Mexican Hispanic sample, which is generally more optimistic about opportunities in the next six months and less confident that there is knowledge necessary to start a business, with a greater level of fear of failure reported. That being said, the sample size is only 17 and thus generally not statistically significant. As shown in this group of figures, some of the differences among the groups, while small in relative terms, are significant statistically, especially as they pertain to the larger sample of whites.
Aspirations
The third component of entrepreneurship used here is aspirations. Aspirations are more of a qualitative
measure and include focus on potential high-growth and new products that use new technology and target international markets. Analysis by aspirations shows a great deal of variation among the minority samples. Again focusing on one of the three largest samples, African American early-stage entrepreneurs reported that over 50% expected to have job growth greater than or equal to 10 persons and greater than or equal to 50% growth. This percentage of early-stage African American entrepreneurs reporting high job growth expectation was twice as high as the percentage of whites and that of other minority groups. This measure of aspirations may reflect the significant number of immigrant African Americans in the sample, the relatively high level of education among African American entrepreneurs and their perception that their products are new and unique.
Figure 38. Immigrants Personally Knew Entrepreneur in Past Two Years
*Chi-square or fisher Exact Statistic <.05, non-early-stage versus early-stage samples are statistically significantly different at the 95% C.i.**Chi-square or fisher Exact Statistic <.01, non-early-stage versus early-stage samples are statistically significantly different at the 99% C.i.Source: GEM U.S. 2008 Adult Population Survey (APS)
0%
20%
40%
60%
80%
100%
White** African American** Hispanic Latino*
Asian Other
Non Early-Stage
Early-Stage

43
Who Starts a Business?
Figure 39. Immigrants Perceive Good Opportunities for Start-Ups in Six Months
*Chi-square or fisher Exact Statistic <.05, non early-stage versus early-stage samples are statistically significantly different at the 95% C.i.**Chi-square or fisher Exact Statistic <.01, non early-stage versus early-stage samples are statistically significantly different at the 99% C.i.Source: GEM U.S. 2008 Adult Population Survey (APS)
0%
20%
40%
60%
80%
100%
White** African American** Hispanic Latino*
Asian Other
Non Early-Stage
Early-Stage
Figure 40. Immigrants Have Knowledge to Start a Business
*Chi-square or fisher Exact Statistic <.05, non early-stage versus early-stage samples are statistically significantly different at the 95% C.i.**Chi-square or fisher Exact Statistic <.01, non early-stage versus early-stage samples are statistically significantly different at the 99% C.i.Source: GEM U.S. 2008 Adult Population Survey (APS)
0%
20%
40%
60%
80%
100%
White** African American Hispanic Latino
Asian* Other
Non Early-Stage
Early-Stage

44
Who Starts a Business?
Figure 41. Fear of Failure Prevents Start-Up Effort by Immigrants
**Chi-square or fisher Exact Statistic <.01, non early-stage versus early-stage samples are statistically significantly different at the 99% C.i.Source: GEM U.S. 2008 Adult Population Survey (APS)
0%
20%
40%
60%
80%
100%
White* African American** Hispanic Latino
Asian Other
Non Early-Stage
Early-Stage
Figure 42. Immigrants Expect to Launch Start-Up in Three Years
*Chi-square or fisher Exact Statistic <.05, non early-stage versus early-stage samples are statistically significantly different at the 95% C.i.**Chi-square or fisher Exact Statistic <.01, non early-stage versus early-stage samples are statistically significantly different at the 99% C.i.Source: GEM U.S. 2008 Adult Population Survey (APS)
0%
20%
40%
60%
80%
100%
White** African American Hispanic Latino
Asian* Other
Non Early-Stage
Early-Stage
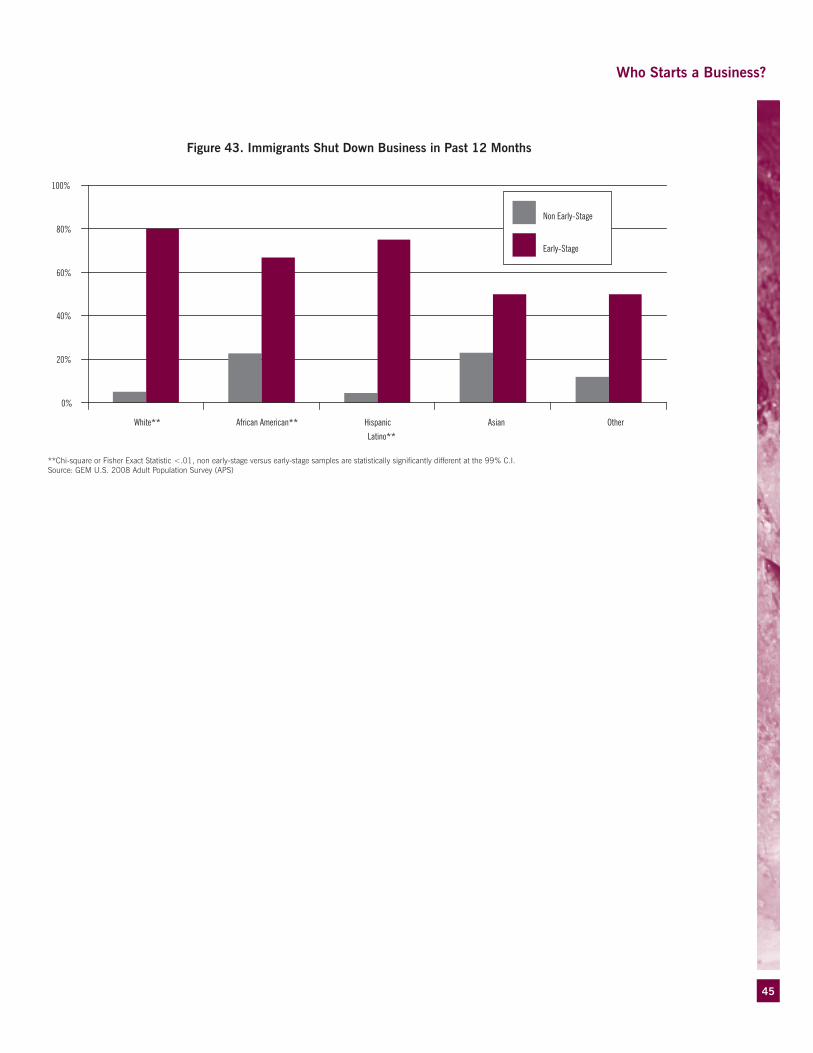
45
Who Starts a Business?
Figure 43. Immigrants Shut Down Business in Past 12 Months
**Chi-square or fisher Exact Statistic <.01, non early-stage versus early-stage samples are statistically significantly different at the 99% C.i.Source: GEM U.S. 2008 Adult Population Survey (APS)
0%
20%
40%
60%
80%
100%
White** African American** Hispanic
Latino**
Asian Other
Non Early-Stage
Early-Stage

46
Part 4 How Do People Start Businesses?
fiNANCiNG
Entrepreneurs are by far the biggest creators of jobs in the U.S. economy. When entrepreneurs start new, full-time ventures, they immediately create one job, a job for themselves. Every new venture, from mom-and-pop convenience stores to Silicon Valley superstars such as Google, starts with an “investment” from the founders themselves and/or the so-called 3Fs: Family, Friends or Foolhardy strangers. Those informal investors are vital to the start-up process; if all of them stopped providing money to start-ups, the U.S. economy would immediately feel the effect with a sudden jump in unemployment. What’s more, informal investments flow almost instantaneously into the economy when entrepreneurs spend their investments to buy goods and services for their new ventures; thereby informal investment supports many more secondary jobs (the multiplier effect).
In the GEM 2008 survey, the number of adults who reported that they had invested in someone else’s business increased, as did the amount that they invested. Slightly more than 5% of adults were informal investors, and the average amount that they invested topped $17,000 each. The total amount invested was approximately 1.4% of the GDP. When you add to that the amount the founders invested in their own ventures, the total is approximately 4.5% of the GDP. It is important to bear in mind that the GEM survey was conducted in the late spring of 2008, several months before the banking industry collapsed, stock markets crashed and investor confidence plummeted. It is likely that informal investors, especially those whose net worth fell sharply, became wary about putting money into risky entrepreneurial ventures in the fall of 2008.
The collapse of the banking industry in September–October 2008 decimated bank lending to small businesses, regardless of the credit worthiness of borrowers. Businesses that tried to borrow under the auspices of the Small Business Administration (SBA) guaranteed loan program, which partially underwrites risky small-business bank loans, were particularly hard hit. Consider what happened to SBA-guaranteed loans in Massachusetts after the collapse: Between October 1, 2008 and February 28, 2009, Bank of America, the biggest bank nationwide, made only five SBA-guaranteed loans totaling $115,000 compared with the period from October 1, 2005 to January 31, 2006 when it made 122 SBA-guaranteed loans totaling $3.1 million. Granted, Bank of America’s precipitous decline in SBA-backed lending was exceptional, but there was a sharp decline in overall SBA-backed loans in Massachusetts; for example, Citizens Bank, which was the most active SBA-backed lender between
October 1, 2008 and February 28, 2009 with 52 loans totaling $2.8 million, made 274 loans totaling $15 million between October 1, 2005 and January 31, 2006.
The precipitous decline in SBA-guaranteed lending in Massachusetts was repeated throughout the United States. SBA-guaranteed lending slowed to a trickle nationwide. Fortunately, SBA programs received a big boost in the American Recovery and Reinvestment Act of 2009 that President Obama signed into law on February 17, 2009. The Act provides for temporary reductions or elimination of fees in the popular SBA 7(a) and 504 programs. The bill instructs the SBA to give borrowers and small banks priority in receiving fee relief. The intent of this provision is to reduce the cost on the $13.5 billion in long-term bank loans that create or retain as many as 300,000 jobs. Moreover, the temporary increase in SBA guarantee levels allows the SBA, on a case-by-case basis, to temporarily raise the guarantee level up to 90 percent for 7(a) loans through the SBA express program. The U.S. Senate believes the increased guarantee will loosen lending standards among nervous bankers.
Venture capital also felt the impact of the collapse of the banking industry. The amount of venture capital investments in the fourth quarter of 2008 fell 39% compared with the same period in 2007. For the entire year, the amount invested in 2008 was 14% off the total in 2007.
The amount of first-time investment in start-up and early-stage companies was down 14% in 2008 and the number of deals fell 12%. The downturn in venture accelerated in the first quarter of 2009, when investments plummeted to a 12-year low; total investment was down 47% in dollars and 37% in number of deals compared with the previous quarter.
In the panorama of entrepreneurship, informal investment is much more important than venture capital. After all, only a few thousand companies get venture capital each year compared with several million that get informal investment. In the United States, a person has a higher chance of winning a million dollars or more in a state lottery than getting venture capital to start a new venture. In the short-term, informal investment has far more impact than venture capital on entrepreneurial activity. As we pointed out earlier, if all informal investment dried up, the effect on the economy would be immediate and disastrous. In contrast, a drop in venture capital investment has little short-term effect on the nationwide economy. But in the long-term, venture capital is vital for the financing of super-star companies with the potential to change the way in which we live, work and play.
47
How Do People Start Businesses?
The bulk of venture capital is invested in young companies with innovative products or services, which are usually, but not always, technology driven. The following section examines early-stage, innovative entrepreneurial activity in general, including technology-driven ventures. It is an approximate measure of the rate of formation of innovative companies of all sizes across all industry sectors. A few of those early-stage, innovative ventures have the potential to become candidates for venture capital investment. Financial returns are the primary motive for venture capitalists and the entrepreneurs in whom they invest. There are, however, more and more entrepreneurs with social goals as well as economic goals, and they will be reviewed in the final part of this section.
iNNovAtioN
The relationship between innovation and entrepre-neurship is well documented in the literature (Schumpeter 1936iii, Shane and Venkataraman 2000iv, Acs and Audretsch 2005v, Koellinger 2008vi). Michael and Pearce (2009)vii suggest that government support for entrepreneurship should encourage innovation as it not only raises competition, lowers prices and cre-ates jobs, but also creates wealth for individuals and nations. Given our understanding that the contribu-tion of entrepreneurs to an economy varies according to its phase of economic development and the fact that the United States is an innovation-driven economy, it is all the more imperative to know the innovative
activity of U.S. entrepreneurs. The GEM 2008 survey for the United States, for the first time, has asked some questions on innovativeness of products and services, involvement in the technology sector, use of new technology and intended expenditures on new technology. The findings follow.
Innovativeness and Customer Novelty
As the GEM Global 2008 Executive Report suggests, GEM assesses innovation in entrepreneurial businesses in two different ways. First, a product or service developed by an entrepreneur is considered to be “innovative” if the target customers find this new product or service unfamiliar or novel relative to their current experiences. Second, the innovativeness of an entrepreneurial business is measured by the degree of competitiveness faced by the business, or “whether the owner-manager perceives that many, few, or no other businesses offer similar products or servicesviii.” Figure 44 compares 2007 and 2008 data on the relative prevalence of early-stage entrepreneurs and established business owner-managers offering a product or service that is new to some or all of their customers. Figure 44 clearly shows that while both business entities offered less-novel (unfamiliar) products to customers in 2008 compared to 2007, the decline in customer novelty was steeper for established business owners (12.5% in 2007 vs. 6.3% in 2008). Such a conservative undertaking of developing less-novel products or services by U.S. entrepreneurs may reflect the worsening economic situation in 2008.

48
Figure 45. Percentage of Business Entities with New Products: Competitive Offerings
Source: GEM U.S. 2008 Adult Population Survey (APS)
0%
5%
10%
15%
20%
25%
30%
35%
40%
45%
2007 2008 2007 2008
Early-Stage Entrepreneurial Activity Established Business
Few
More
How Do People Start Businesses?
Figure 44. Percentage of Business Entities with New Products: Customer Unfamiliarity
Source: GEM U.S. 2008 Adult Population Survey (APS)
0%
5%
10%
15%
20%
25%
30%
35%
40%
2007 2008 2007 2008
Early-Stage
Entrepreneurial ActivityEstablished Business
All Customers
Some Customers

49
How Do People Start Businesses?
Innovativeness and Competitor Intensity
Both early-stage entrepreneurs and established business owner-managers continued to report that they entered into markets where they believed that few or no businesses offered similar products or services (Figure 45). The prevalence of innovative activity for both types of business entities where no other competitors offer similar products or services, however, declined in 2008 compared to 2007.
In addition to measuring the innovative entrepreneurial activity in terms of customer unfamiliarity and lack of competitive intensity, GEM also assesses the percentage of business entities reporting the requirement of latest technologies or procedures for their new products or services. Both types of business entities reported less need for latest technologies in 2008 compared to 2007. However, significantly fewer early-stage entrepreneurs indicated the need for the latest technologies or procedures (5.9% in 2008 compared to 11.7% in 2007). Given the economic outlook of 2008, it seems both early-stage entrepreneurs and established business owner-managers have cut back on developing more risky novelty products using the latest technology. It can then be surmised that both business entities reported more incremental innovations as opposed to radical new products in 2008.
Activity in Technology Sector
Given the fact that the United States has an innovation-driven economy, new technology being the main driver of innovation in most cases, it will be no surprise that business entities are active in the technology sector of the economy. However, what is especially noteworthy, despite the grim economic outlook of 2008, is that there is a significant jump in the number of early-stage entrepreneurs and established business owner-mangers reporting their involvement in the technology sector in 2008
compared to 2007. It seems U.S. entrepreneurs—though cutting back in using the latest technology in their development and manufacturing process and reportedly developing less-novel products or services— are increasingly getting involved in the high-tech sector with a hope that such an undertaking promises a better opportunity for an entrepreneurial activity. Figure 46 presents these percentages: 7.8% of early-stage entrepreneurs reported being active in the technology sector in 2008 compared to 4.6% in 2007. The corresponding numbers for established business manager-owners are 1.6% (2007) and 4.8% (2008) respectively—a 300% jump! Furthermore, though not surprisingly, more early-stage entrepreneurs reported starting as an Internet business in 2008 rather than established business owner-managers (12.3% for entrepreneurs vs. 6.4% for established businesses). Continued innovation in the Internet (e.g., Web 2.0) created new opportunities, and early-stage entrepreneurs were seizing these opportunities to start their businesses. One would hope that such increased involvement in the technology sector will lead to innovation of more high-value added products or services and enhance the competitive advantage of U.S. firms in global markets.
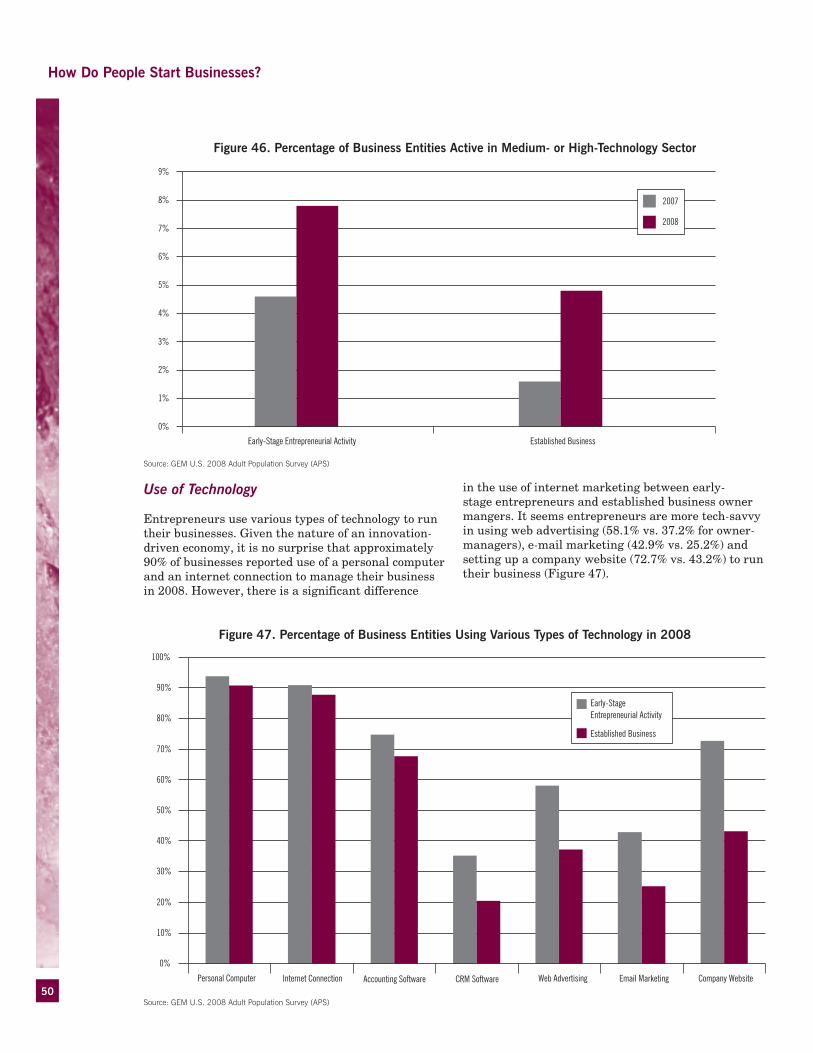
50
Figure 46. Percentage of Business Entities Active in Medium- or High-Technology Sector
Source: GEM U.S. 2008 Adult Population Survey (APS)
0%
1%
2%
3%
4%
5%
6%
7%
8%
9%
Early-Stage Entrepreneurial Activity Established Business
2007
2008
Figure 47. Percentage of Business Entities Using Various Types of Technology in 2008
Source: GEM U.S. 2008 Adult Population Survey (APS)
0%
10%
20%
30%
40%
50%
60%
70%
80%
90%
100%
Personal Computer Internet Connection Accounting Software CRM Software Web Advertising Email Marketing Company Website
Early-StageEntrepreneurial Activity
Established Business
How Do People Start Businesses?
Use of Technology
Entrepreneurs use various types of technology to run their businesses. Given the nature of an innovation-driven economy, it is no surprise that approximately 90% of businesses reported use of a personal computer and an internet connection to manage their business in 2008. However, there is a significant difference
in the use of internet marketing between early-stage entrepreneurs and established business owner mangers. It seems entrepreneurs are more tech-savvy in using web advertising (58.1% vs. 37.2% for owner-managers), e-mail marketing (42.9% vs. 25.2%) and setting up a company website (72.7% vs. 43.2%) to run their business (Figure 47).

51
How Do People Start Businesses?
Spending on Technology
It is expected that in order to develop an innovative product, a firm needs to spend money on R&D and new technology. Intention to spend on technology provides a clear indication of the innovation strategy of entrepreneurs. The GEM U.S. team sought to understand the nature of this inventive activity for the first time in 2008 by adding questions to the
APS survey conducted in the United States. While we cannot see the trend over the years, we can still observe the 2008 Adult Population Survey; while 48% of established business owner-managers indicated their intentions to spend less than $1,000 in 2008, a full two-thirds of early-stage entrepreneurs were willing to spend more than $1,000 in 2008 (Figure 48). Given the looming economic crisis in 2008, it was a very hopeful sign of early-stage entrepreneurial activity in 2008.
Source: GEM U.S. 2008 Adult Population Survey (APS)
Figure 48. Percentage of Business Entities Spending on Technology in 2008
0%
10%
20%
30%
40%
50%
60%
$0 to $1,000 $1,001-$5,000 $5,001- $10,000 $10,001-$20,000 More than $20,000
Early-Stage
Entrepreneurial Activity
Established Business
The GEM 2008 study suggests that while early-stage entrepreneurs reported being cautious in developing innovative products, a larger number of them got involved in the technology sector, started an internet business, used more tech-savvy web marketing
and were willing to spend more than $1,000 on technology in 2008. Such approaches may serve these entrepreneurs well in the looming economic crisis of 2008/09.

52
How Do People Start Businesses?
Source: GEM U.S. 2008 Adult Population Survey (APS)
Figure 49. Percentage of Entrepreneurs Self-Identifying as Social Entrepreneurs
0%
10%
20%
30%
40%
50%
60%
70%
80%
Economic Goals Social Goals Economic and Social Goals Mission-Based Non-Profit
Perc
enta
ge o
f Ent
repr
eneu
rs
2008
2007
SoCiAl ENtrEPrENEUrShiP
Social entrepreneurship is an increasingly attractive path to business start-up and growth for entrepreneurs. Its popularity cannot be underestimated, and some would argue that social entrepreneurship is a global movement. However, as the use of the term becomes more commonplace, our understanding of it tends to become more convoluted. In other words, is social entrepreneurship reserved for the non-profit world? Can a for-profit entrepreneur identify as a social entrepreneur? GEM seeks to clarify the nature of social entrepreneurship and measure the extent to which entrepreneurs are operating within the realm of social entrepreneurship. We
asked entrepreneurs to describe the goals of their businesses. As for-profit entities, were they driven by economic goals, social goals—or both? If organizations were legally organized as a non-profit, it was assumed they were driven purely by social missions.
Figure 49 compares 2007 and 2008 data. The most significant shift is in the number of entrepreneurs who have both social and economic goals as their motives. The current data indicate that 44% of entrepreneurs describe the goals of their business as both social and economic— a marked difference from 2007 data. Ventures pursuing concurrent economic and social goals more than doubled from 2007 to 2008, while the number of ventures focused solely on economic goals declined 34% from 2007 to 2008.
GEM concludes that more new and established ventures are seeing the necessity and opportunity of serving a broader social mission while also managing and growing the bottom line. It is interesting to note that the percentage of entrepreneurs who identify as operating a for-profit venture with social goals was unchanged in 2008. This perhaps indicates a misperception that if the primary business emphasis is on achieving social goals, then it must be at the cost of profit. GEM anticipates this number to grow in the future as more and more entrepreneurs adopt social missions realizing that the globe’s most pressing problems can be solved through the creation of sustainable, for-profit organizations. The fact that 44%
have a dual-focus on social and economic goals is more closely aligned with corporate social responsibility practices than pure social entrepreneurship, but the United States and its entrepreneurial climate will lead the way in showing that social goal achievement and shareholder return must be two sides of the same coin. The foundation of social entrepreneurship, unlike its first cousin corporate social responsibility, is the achievement of social goals—not a byproduct for enhancing image or public awareness.
Figure 50 indicates that women have a greater proclivity for social issues than do men. While men start and grow the majority of traditional ventures

53
How Do People Start Businesses?
with a pure economic focus, women are gaining momentum in the social realm. In 2007, only 25% of women entrepreneurs self-identified as starting or operating a venture with both social and economic goals; the percentage jumped to 53% in 2008. In 2007, 51% of females reported an emphasis on economic goals only. GEM saw little change in male social entrepreneurship from 2007 to 2008.
Though social entrepreneurship is certainly not a new phenomenon, it has recently gained mainstream
popularity as the world questions business practices and the role of business in society in times of economic crisis and global turmoil. U.S. youth appear to be at the forefront recognizing the social role business can play. Table 4 highlights that 52% of 18-24 year-old entrepreneurs are starting and operating businesses to achieve not only economic goals but also social goals. The data are beginning to show a trend for later-in-life entrepreneurs as well. The parents of the 19-24 year olds are increasingly trending toward more socially oriented entrepreneurial activity.
Source: GEM U.S. 2008 Adult Population Survey (APS)
Figure 50. Social Entrepreneurship and Gender
0%
10%
20%
30%
40%
50%
60%
Economic Goals Social Goals Economic and Social Goals Mission-Based Non-Profit
Perc
enta
ge o
f Ent
repr
eneu
rs
Male
Female
Table 4. Social Entrepreneurship by Age
18-24 YRS 25-34 YRS 35-44 YRS 45-54 YRS 55-64 YRS
Economic Goals 34.0% 64.7% 40.2% 49.1% 37.1%
Social Goals 8.0% 0% 8.3% 5.5% 8.1%
Economic and Social Goals 52% 33.8% 47.7% 40.0% 46.8%
Mission-Based Non-Profit 6.0% 1.5% 3.8% 5.5% 8.0%
Source: GEM U.S. 2008 Adult Population Survey (APS)
Social entrepreneurs impact a wide variety of sectors, but healthcare, education, urban development and the environment are the most popular sectors where social ventures are starting. The condition for opportunity identification is strong among ventures starting with
social and economic goals. Figure 51 shows that over 70% of nascent and established entrepreneurs see opportunities that have social and economic impact, surpassing those that perceive the conditions ripe for seizing opportunities for pure economic reasons.

54
How Do People Start Businesses?
Figure 51. Perception of Social Opportunities in Six Months
Source: GEM U.S. 2008 Adult Population Survey (APS)
0% 10% 20% 30% 40% 50% 60% 70% 80%
Economic Goals
Social Goals
Economic and
Social Goals
Mission-Based
Non-Profit
Percentage of Entrepreneurs
Yes
No
The impact of social entrepreneurship on economic growth and development should not be underestimated. GEM reports that ventures operating at the intersection of social and economic goals will produce more jobs over the next five years than traditional entrepreneurship. When comparing the
number of employees that owner-managers have today to what they expect to have in five years, the entrepreneurs emphasizing social and economic value are generating, on average, 42 jobs per year. Traditional entrepreneurs forecast, on average, 28 jobs per year.

55
Part 5 Public Policy in the United States
In previous GEM reports, it has been observed that public policies toward entrepreneurship in high-income countries should have as a goal maintaining competitiveness and sustaining innovation rates (GEM United States 2005 Executive Report). In addition, the availability of sufficient early-stage funding is of high importance. To begin this discussion of public policy for the United States in 2008, the tables and figures from the GEM United States 2006–2007 Executive Report were updated to include the 2008 actuals to see if any significant changes occurred in 2008 as a result of the recession that commenced in the latter part of 2007. Highlights include the following observations:
• Early-stage entrepreneurial activity increased between 2007 and 2008, but this was probably attributable to the change in GEM survey methodology, which corrected a likely bias in previous years’ prevalence rates (Figure 52A).
• In 2008, there was a dramatic decline in GEM National Experts’ assessment of the availability of sufficient funding for entrepreneurs from key funding sources in the United States (Figure 54).
• In 2008, eight industries showed declines in growth rates, with the largest percentage of losses occurring in the construction and wholesale trade industries (Table 6).
• In 2008, the gender gap between male and female prevalence rates declined (Figure 1).
• In 2008, GEM National Experts’ perceptions concerning the existence of good opportunities to create new firms both now and in the last five years declined (Figure 53).
• In 2008, a dramatic reduction in the dynamism levels in the United States was observed, continuing the trend of the previous two years, but this drop was due to a change in the survey methodology, which resulted in a significant upward adjustment to the established business rate (Table 8).
• Optimistic expected five-year job projections from start-up businesses were observed in 2008, especially for high-potential entrepreneurs (Figure 16).
Impact of Economic Declines on Economic Activity
In this last section of the report, we highlight the impact of past declines in the U.S. economy on economic activities and some GEM evidence of the impact of the last recession and current economic slowdown on entrepreneurial activity in the United States.
Last year, the decline had been attributed to the following:
• The meltdown in both the financial intermediation industry and in the capital markets, triggered principally by the implosion of the financial market for subprime loans and their derivatives
• The decline in housing markets and problems in the financial markets, which resulted in the drying up of mortgage loan facilities—even for high-credit borrowers
• The rise in prices of oil and other commodities
The Business Cycle Dating Committee of the National Bureau of Economic Research determined that a peak in economic activity occurred in the United States in December 2007. The peak marked the end of the expansion that began in November 2001 and the beginning of the recession.
A recession is a significant decline in economic activity across the economy, lasting more than a few months, normally visible in production, employment, real income and other indicators. A recession begins when an economy reaches a peak of activity and ends when the economy reaches a trough. Between trough and peak, the economy is in an expansion.
Because a recession is a broad contraction of the economy, not confined to one sector, the committee emphasizes economy-wide measures of economic activity, believing that domestic production and employment are the primary conceptual measures of economic activity3.
Table 5 shows the impact of past economic recessions on gross domestic production and employment. The table is updated from the GEM United States 2006–2007 Executive Report by including results for 2008. Table 5 shows the duration, depth and diffusion of past economic recessions and of the current recession through the end of 2008. Duration is represented by the number of months that the recession lasted; depth, by the percentage of change in Real GDP and maximum unemployment rate during the recession period; and diffusion, by the maximum percentage of industries with declining employment during the recession period. Table 5 shows that the last recession occurred from March 2001 to November 2001. Its duration was nine months; Real GDP declined by 0.1% on an annualized basis, and the maximum unemployment rate was 5.3%. Also, as much as 71% of industries in the United States experienced declining employment during that period. The current recession has surpassed the length of the last recession, and it may be the longest since the Great Depression.
3the NbEr does not define a recession in terms of two consecutive quarters of decline in real GDP. rather, a recession is a significant decline in economic activity spread across the economy, lasting more than a few months, normally visible in real GDP, real income, employment, industrial production and wholesale-retail sales. for more information, see the latest announcement from the NbEr's business Cycle Dating Committee, dated 12/01/08.

56
THE THREE Ds OF RECESSION: A BRIEF HISTORY
DURATION DEPTH DIFFUSION
MONTHS PERCENT CHANGE IN REAL GDP
UNEMPLOYMENT RATE, MAXIMUM
PERCENTAGE OF INDUSTRIES WITH DECLINING EMPLOYMENT, MAXIMUM
1998 4.2 4.5
1999 4.5 4.2 43
2000 3.7 4.0 43
3/2001-11/2001 9 -0.1a 5.3 71
2002 1.6 5.8 57
2003 2.5 6.0 57
2004 3.6 5.5 57
2005 2.9 5.1 36
2006 2.8 4.6 29
2007 2.0 4.6 57
2008 13 .04 7.2 71
THREE DEPRESSIONS
3/1920-7/1921 18 n.a. 11.9 97
8/1929-3/1933 43 -32.6 24.9 100
5/1937-6/1938 13 -18.2 20.0 97
SIX SHARP RECESSIONS
5/1923-7/1924 14 -4.1 5.5 94
11/1948-10/1949 11 -1.5 7.9 90
7/1953-5/1954 10 -3.2 6.1 87
8/1957-4/1958 8 -3.3 7.5 88
11/1973-3/1975 16 -4.9 9.0 88
7/1981-11/1982 16 -2.6 10.8 72
FIVE MILD RECESSIONS
10/1926-11/1927 13 -2.0 4.4 71
4/1960-2/1961 10 -1.2 7.1 80
12/1969-11/1970 11 -1.0 6.1 80
1/1980-7/1980 6 -2.5 7.8 63
7/1990-3/1991 8 -1.2 6.9 73
AVERAGES
1920-1938 (5) 20 -14.2 13.3 92
1948-1991 (9) 11 -2.4 7.7 80
Table 5. Recessions, Duration, Depth and Diffusion
Source (for data prior to 1998): table A-2 in G.h. Moore, business Cycles, inflation and forecasting, 2nd ed., 1983. Note that the brief and mild recession of 1945 is omitted here.Source (for data 1998-2008): U.S. bureau of labor Statistics and U.S. bureau of Economic Analysis aAnnualized number
Public Policy in the United States
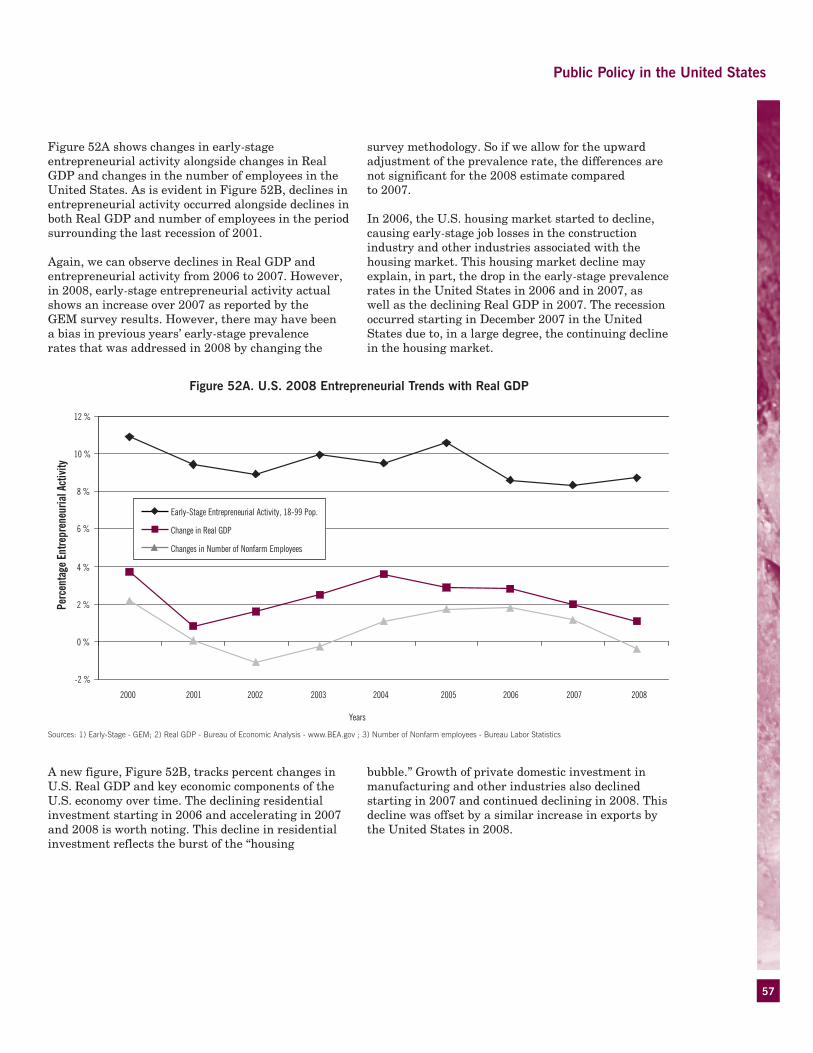
57
Public Policy in the United States
Figure 52A shows changes in early-stage entrepreneurial activity alongside changes in Real GDP and changes in the number of employees in the United States. As is evident in Figure 52B, declines in entrepreneurial activity occurred alongside declines in both Real GDP and number of employees in the period surrounding the last recession of 2001.
Again, we can observe declines in Real GDP and entrepreneurial activity from 2006 to 2007. However, in 2008, early-stage entrepreneurial activity actual shows an increase over 2007 as reported by the GEM survey results. However, there may have been a bias in previous years’ early-stage prevalence rates that was addressed in 2008 by changing the
survey methodology. So if we allow for the upward adjustment of the prevalence rate, the differences are not significant for the 2008 estimate compared to 2007.
In 2006, the U.S. housing market started to decline, causing early-stage job losses in the construction industry and other industries associated with the housing market. This housing market decline may explain, in part, the drop in the early-stage prevalence rates in the United States in 2006 and in 2007, as well as the declining Real GDP in 2007. The recession occurred starting in December 2007 in the United States due to, in a large degree, the continuing decline in the housing market.
Figure 52A. U.S. 2008 Entrepreneurial Trends with Real GDP
Sources: 1) Early-Stage - GEM; 2) real GDP - bureau of Economic Analysis - www.bEA.gov ; 3) Number of Nonfarm employees - bureau labor Statistics
Years
Perc
enta
ge E
ntre
pren
euria
l Act
ivity
2000 2001 2002 2003 2004 2005 2006 2007 2008
-2 %
0 %
2 %
4 %
6 %
8 %
10 %
12 %
Early-Stage Entrepreneurial Activity, 18-99 Pop.
Change in Real GDP
Changes in Number of Nonfarm Employees
A new figure, Figure 52B, tracks percent changes in U.S. Real GDP and key economic components of the U.S. economy over time. The declining residential investment starting in 2006 and accelerating in 2007 and 2008 is worth noting. This decline in residential investment reflects the burst of the “housing
bubble.” Growth of private domestic investment in manufacturing and other industries also declined starting in 2007 and continued declining in 2008. This decline was offset by a similar increase in exports by the United States in 2008.
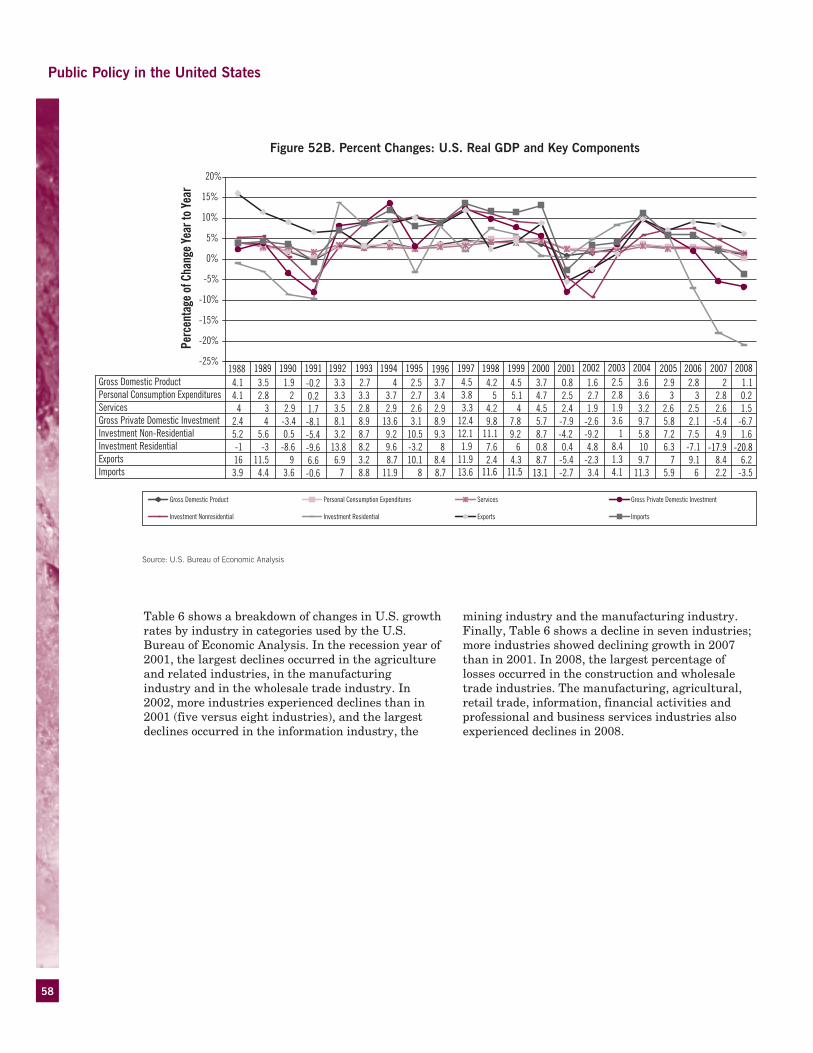
58
Public Policy in the United States
Figure 52B. Percent Changes: U.S. Real GDP and Key Components
Source: U.S. bureau of Economic Analysis
-25%
-20%
-15%
-10%
-5%
0%
5%
10%
15%
20% P
erce
ntag
e of
Cha
nge
Year
to Ye
ar
Gross Domestic Product Personal Consumption Expenditures Services Gross Private Domestic Investment
Investment Nonresidential Investment Residential Exports Imports
Gross Domestic Product 4.1 3.5 1.9 -0.2 3.3 2.7 4 2.5 3.7 4.5 4.2 4.5 3.7 0.8 1.6 2.5 3.6 2.9 2.8 2 1.1Personal Consumption Expenditures 4.1 2.8 2 0.2 3.3 3.3 3.7 2.7 3.4 3.8 5 5.1 4.7 2.5 2.7 2.8 3.6 3 3 2.8 0.2Services 4 3 2.9 1.7 3.5 2.8 2.9 2.6 2.9 3.3 4.2 4 4.5 2.4 1.9 1.9 3.2 2.6 2.5 2.6 1.5Gross Private Domestic Investment 2.4 4 -3.4 -8.1 8.1 8.9 13.6 3.1 8.9 12.4 9.8 7.8 5.7 -7.9 -2.6 3.6 9.7 5.8 2.1 -5.4 -6.7Investment Non-Residential 5.2 5.6 0.5 -5.4 3.2 8.7 9.2 10.5 9.3 12.1 9.2 8.7 -4.2 -9.2 1 5.8 7.2 7.5 4.9 1.6Investment Residential -1 -3 -8.6 -9.6 13.8 8.2 9.6 -3.2 8 1.9 7.6 6 0.8 0.4 4.8 8.4 10 6.3 -7.1Exports 16 11.5 9 6.6 6.9 3.2 8.7 10.1 8.4 11.9 2.4 4.3 8.7 -5.4 -2.3 1.3 9.7 7 9.1 8.4 6.2Imports 3.9 4.4 3.6 -0.6 7 8.8 11.9 8 8.7 13.6 -2.7 3.4 4.1 11.3 5.9 6 2.2 -3.5
1988
11.1
11.6 11.5 13.1
-17.9 -20.8
1989 1990 1991 1992 1993 1994 1995 1996 1997 1998 1999 2000 2001 2002 2003 2004 2005 2006 2007 2008
Table 6 shows a breakdown of changes in U.S. growth rates by industry in categories used by the U.S. Bureau of Economic Analysis. In the recession year of 2001, the largest declines occurred in the agriculture and related industries, in the manufacturing industry and in the wholesale trade industry. In 2002, more industries experienced declines than in 2001 (five versus eight industries), and the largest declines occurred in the information industry, the
mining industry and the manufacturing industry. Finally, Table 6 shows a decline in seven industries; more industries showed declining growth in 2007 than in 2001. In 2008, the largest percentage of losses occurred in the construction and wholesale trade industries. The manufacturing, agricultural, retail trade, information, financial activities and professional and business services industries also experienced declines in 2008.

59
Public Policy in the United States
INDUSTRY 1999 2000 2001† 2002 2003 2004 2005 2006 2007! 2008
All 1.54 2.55 0.03 -0.33 0.92 1.10 1.78 1.90 1.12 -0.47
Agriculture and Related Industries -2.87 -24.90 -6.70 0.52 -1.56 -1.89 -1.57 0.41 -5.03 3.48
Non-Agricultural Industries:
Mining Industry -7.67 -10.38 13.26 -6.69 4.58 2.67 15.77 10.10 7.13 11.28
Construction Industry 4.75 5.93 2.26 -1.71 1.57 6.21 3.98 4.93 0.91 -7.44
Manufacturing Industry -2.83 2.70 -6.16 -6.52 -1.92 -2.47 -1.40 0.76 -0.46 -2.44
Wholesale Trade Industry 1.16 3.03 -4.65 3.08 8.25 2.54 -0.46 -0.39 -4.25 -7.21
Retail Trade Industry 1.09 1.91 0.15 -0.78 3.56 0.30 3.42 -0.34 -1.17 -0.22
Transportation and Utilities Industry 2.07 2.46 -1.61 -0.23 -4.06 0.91 4.95 1.29 2.62 1.01
Information Industry 1.84 7.98 -1.33 -7.84 -0.11 -6.08 -1.76 5.03 -0.20 -2.38
Financial Activities Industry 2.34 0.70 0.75 1.28 1.91 2.27 2.35 2.81 -0.02 -2.48
Professional and Business Services 2.32 2.72 3.07 -0.38 -0.97 1.65 1.32 4.02 5.06 -0.52
Education and Health Services Industry 2.64 1.60 2.52 2.89 2.30 1.62 1.58 2.62 2.42 2.41
Leisure and Hospitality Industry 1.76 0.38 1.64 1.50 0.57 1.84 2.12 0.61 2.22 2.84
Other Services Industry 2.23 2.11 0.42 2.90 2.25 1.29 1.69 0.97 -1.64 0.47
Public Administration Industry 1.19 1.33 1.88 1.27 -1.01 1.95 2.59 -0.09 3.40 0.25
Table 6. U.S. Growth Rates by Industry
Source of the data is from the United States bureau of labor Statistics – Employment levels by industry: Sources: a) Early-Stage - GEM; 2) real GDP - bureau of Economic Analysis - www.bEA.gov; 3) #nonfarm employees - bureau labor Statistics† U.S. recession occurred from March–November 2001.! Current U.S. recession started in December 2007.
YEAR EMPLOYMENT PERCENT CHANGE ESTABLISHMENTS PERCENT CHANGE FIRMS PERCENT CHANGE EMPLOY/ESTAB
1988 87,844,303 6,016,367 4,954,645 14.6
1989 91,626,094 4.31 6,106,922 1.51 5,021,315 1.35 15.0
1990 93,469,275 2.01 6,175,559 1.12 5,073,795 1.05 15.1
1991 92,307,559 (1.24) 6,200,859 0.41 5,051,025 (0.45) 14.9
1992 92,825,797 0.56 6,319,300 1.91 5,095,356 0.88 14.7
1993 94,773,913 2.10 6,401,233 1.30 5,193,642 1.93 14.8
1994 96,721,594 2.06 6,509,065 1.68 5,276,964 1.60 14.9
1995 100,314,946 3.72 6,612,721 1.59 5,369,068 1.75 15.2
1996 102,187,297 1.87 6,738,476 1.90 5,478,047 2.03 15.2
1997 105,299,123 3.05 6,894,869 2.32 5,541,918 1.17 15.3
1998 108,117,731 2.68 6,941,822 0.68 5,579,177 0.67 15.6
1999 110,705,661 2.39 7,008,444 0.96 5,607,743 0.51 15.8
2000 114,064,976 3.03 7,070,048 0.88 5,652,544 0.80 16.1
2001 115,061,184 0.87 7,095,302 0.36 5,657,774 0.09 16.2
2002 112,400,654 (2.31) 7,200,770 1.49 5,697,759 0.71 15.6
2003 113,398,043 0.89 7,254,745 0.75 5,767,127 1.22 15.6
2004 115,074,924 1.48 7,387,724 1.83 5,885,784 2.06 15.6
2005 116,317,003 1.08 7,499,702 1.52 5,983,546 1.66 15.5
2006 119,917,165 3.10 7,601,160 1.35 6,022,127 0.01 15.8
Table 7. Change in U.S. Employment, Business Establishments and Firms*
* U.S. Census bureau – Statistics of U.S. businesses. these data were developed in cooperation with, and partially funded by, the office of Advocacy of the U.S. Small business Administration (SbA). Statistics of U.S. businesses (SUSb) is an annual series that provides national and sub national data on the distribution of economic data by size and industry. Statistics of U.S. businesses covers most of the country’s economic activity. the series excludes data on non-employer businesses, private households, railroads, agricultural production and most government entities. http://www.census.gov/csd/susb/susb_download.htm

60
Public Policy in the United States
Table 7 shows changes in U.S. employment, business establishments and firms for the last two recession periods—from July 1990 to March 1991 and from March 2001 to November 2001. There are substantial declines in growth rates of number of employees, business establishments and firms during these periods of economic slowdown. The table was updated with the most recent year available, 2006. In 2006, we see that the growth of firms was flat at 0.01, lower than in any year during the prior recession.
Figure 53 and Figure 54 graph the opinions of experts from GEM surveys on issues affecting entrepreneurial activity in the United States for the years 2006—2008. The tops of the bar graphs that start on the x-axis represent the mean responses of the experts. For 2007 and 2008 only, the length of the line extending equal distances below and above the tops of the bar graphs in both Figures 53 and 54, represent 1 standard deviation above the mean responses and 1 standard deviation below the mean responses of each bar graph. In Figure 53, there are declines, on average, in the perception of GEM national experts concerning the existence of good opportunities to create new firms
both now and in the last five years. Also, the declines occur in the year 2008 for both sets of cluster bar graphs in Figure 53.
Figure 54 shows the mean responses for GEM national experts for available funding from key funding sources for entrepreneurs in the United States. In 2007, the GEM national experts stated that it was somewhere between “Neither true nor false” and “Somewhat true” that there was sufficient funding available for entrepreneurs. However, in 2008, there was a drop to “Neither true nor false” in all mean responses of GEM national experts for available funding from key funding sources for entrepreneurs in the United States. Taking a closer look at the distribution of the responses and combining the responses over all six types of funding in Figure 54, the indications are that over 70% of the experts responded that it was “Somewhat true” or “Completely true” that sufficient funding was available for new and growing firms in 2007 compared to only about 41% in 2008. These declines in the experts’ opinions in 2008 are indicative of the impact of the recession in the United States economy that began in December 2007.
Figure 53. GEM U.S. National Expert Survey – Mean Response for New Firm Entrepreneurship Opportunity
Source: GEM United States 2008 National Expert Survey (NES)
1 = “Completely False” 2 = “Somewhat False” 3= “Neither True nor False” 4= “Somewhat True” 5 = “Completely True”
0.0
0.5
1.0
1.5
2.0
2.5
3.0
3.5
4.0
4.5
5.0
Good Opportunities to Create New Firms Now Good Opportunities to Create New Firms in Last 5 Years
2006
2007
2008

61
Public Policy in the United States
Figure 54. GEM U.S. National Expert Survey – Mean Response for Available Funding
1 = “Completely False” 2 = “Somewhat False” 3= “Neither True Nor False” 4= “Somewhat True” 5 = “Completely True”
0.0
0.5
1.0
1.5
2.0
2.5
3.0
3.5
4.0
4.5
5.0
Equity Debt Govt Subsidies Private Individuals Venture Capital IPOs
2006
2007
2008
Source: GEM United States 2008 national Expert Survey (NES)
Table 8 shows U.S. dynamism. GEM defines dynamism as the ratio of early-stage entrepreneurship to business ownership. High levels of dynamism are positively associated with high early-stage entrepreneurship prevalence rates, high venture capital investment and significantly higher levels of high-expectation entrepreneurship. As Table 8 shows,
there were substantial reductions in the dynamism levels in the United States in 2006 and 2007 compared to 2005. In 2008, there was also a dramatic drop, but this drop was due to a change in the survey methodology for the most part; we see a tremendous upside adjustment to the established business rate due to a change in the methodology in 2008.
YEAR 2001 2002 2003 2004 2005 2006 2007 2008+
U.S. Dynamism 2.03 1.85 2.21 2.08 2.66 1.85 1.80 1.30
U.S. Early-Stage Activity Rate 11.60 10.50 11.90 11.30 12.40 10.03 9.61 10.8+
U.S. Established Business Ownership Activity Rate 5.72 5.69 5.39 5.44 4.67 5.42 4.97 8.3+
+GEM Survey Methodology was changed in 2008 to correct for a possible bias. there may have been a downside bias in previous years especially involving the established business owners.
Table 8. U.S. Dynamism

62
NASCENT ENTREPRENEURIAL ACTIVITY (%)
NEW BUSINESS OWNER (%)
EARLY-STAGE ENTREPRENEURIAL ACTIVITY (%)
ESTABLISHED ENTREPRENEURS (%)
BUSINESS DISCONTINUATION RATE (%)
EARLY-STAGE OPPORTUNITY RATE (%)
EARLY-STAGE NECESSITY RATE (%)
Factor-Driven Economies
Angola 19.3 4.1 22.7 4.1 23.2 10.6 8.0
Bolivia 17.4 14.3 29.8 19.1 10.5 21.0 8.6
Bosnia and Herzegovina 6.4 2.7 9.0 8.7 5.0 5.0 3.8
Colombia 13.8 11.7 24.5 14.1 7.1 13.9 10.2
Ecuador 8.7 9.1 17.2 11.9 5.9 12.1 4.9
Egypt 7.9 5.5 13.1 8.0 6.3 10.5 2.4
India 6.9 4.9 11.5 16.5 9.5 8.0 2.5
Iran 5.9 3.4 9.2 6.8 5.2 5.9 2.9
Average 10.8 7.0 17.1 11.1 9.1 10.9 5.4
Efficiency-Driven Economies
Argentina 8.5 8.5 16.5 13.5 10.2 9.9 6.3
Brazil 2.9 9.3 12.0 14.6 3.5 8.0 4.0
Chile 8.2 5.0 13.0 6.9 6.1 9.6 3.0
Croatia 4.9 2.8 7.6 4.8 3.4 5.4 2.2
Dominican Republic 11.7 9.8 20.4 8.2 11.2 14.0 6.2
Hungary 3.8 2.8 6.6 5.3 1.1 4.4 1.9
Jamaica 9.0 7.1 15.6 9.1 8.9 8.0 7.3
Latvia 3.9 2.8 6.5 3.0 1.7 4.9 1.4
Macedonia 7.2 7.7 14.5 11.0 5.3 7.2 6.8
Mexico 9.3 4.0 13.1 4.9 13.6 10.2 1.8
Peru 19.7 6.8 25.6 8.3 10.4 17.0 8.0
Romania 2.5 1.6 4.0 2.1 2.2 2.1 1.4
Russia 1.7 2.0 3.5 1.1 1.1 2.5 0.7
Serbia 4.0 3.6 7.6 9.3 3.7 4.7 2.5
South Africa 5.7 2.1 7.8 2.3 5.8 6.1 1.6
Turkey 3.2 3.0 6.0 4.8 4.0 3.5 2.3
Uruguay 7.7 4.4 11.9 7.9 9.1 7.9 2.8
Average 6.7 4.9 11.3 6.9 6.0 7.4 3.5
Innovation-Driven Economies
Belgium 2.0 0.9 2.9 2.6 1.5 2.4 0.3
Denmark 2.3 2.3 4.4 4.4 1.9 4.1 0.3
Finland 4.1 3.3 7.3 9.2 2.1 6.1 0.9
France 3.8 1.9 5.6 2.8 2.2 4.8 0.6
Germany 2.4 1.5 3.8 4.0 1.8 2.7 1.0
Greece 5.3 4.6 9.9 12.6 3.4 6.7 3.0
Iceland 6.5 3.6 10.1 7.1 3.4 8.2 0.5
Ireland 3.3 4.3 7.6 9.0 3.6 5.7 1.4
Israel 3.5 3.1 6.4 4.5 3.1 4.5 1.4
Italy 2.0 2.7 4.6 6.5 1.8 3.6 0.7
Japan 3.2 2.3 5.4 7.9 1.0 4.0 1.2
Republic of Korea 3.5 6.5 10.0 12.8 4.7 5.8 4.0
Netherlands 2.1 3.2 5.2 7.2 1.6 4.3 0.5
Norway 5.0 4.0 8.7 7.7 3.3 7.4 0.6
Slovenia 4.1 2.4 6.4 5.6 1.3 5.6 0.8
Spain 3.3 3.9 7.0 9.1 1.3 5.6 1.0
United Kingdom 3.1 2.9 5.9 6.0 2.1 4.7 0.8
United States 5.9 5.0 10.8 8.3 4.4 8.9 1.3
Average 3.6 3.2 6.8 7.1 2.5 5.3 1.1
GEM Average 6.2 4.6 10.5 7.8 5.1 7.1 2.9
Table 1B. Prevalence Rates in Percentage of Entrepreneurial Activity and Business Owner-Managers Across GEM Countries in 2008, for the 18-64 Age Group, by Phase of Economic Development
Appendix
Source: GEM Global 2008 Adult Population Survey (APS). for international comparisons, sample based on persons aged 18-64 years

63
GEM Sponsors
GErA AND GEM
The Global Entrepreneurship Research Association (GERA) is, for formal constitutional and regulatory purposes, the umbrella organization that hosts the GEM project. GERA is an association formed of Babson College, London Business School and representatives of the Association of GEM national teams.
The GEM program is a major initiative aimed at describing and analyzing entrepreneurial processes within a wide range of countries. The program has three main objectives:
• To measure differences in the level of entrepreneurial activity between countries
• To uncover factors leading to appropriate levels of entrepreneurship
• To suggest policies that may enhance the national level of entrepreneurial activity
New developments—and all global, national and special topic reports—can be found at www.gemconsortium.org. The program is sponsored by Babson College and London Business School.
bAbSoN CollEGE
Babson College in Wellesley, Massachusetts, USA, is recognized internationally as a leader in entrepreneurial management education. Babson grants BS degrees through its innovative undergraduate program, and grants MBA and custom MS and MBA degrees through the F.W. Olin Graduate School of Business at Babson College. Babson Executive Education offers executive development programs to experienced managers worldwide. For information, visit www.babson.edu.
bArUCh CollEGE
Baruch College has a 160-year history of excellence in public higher education with an emphasis on business. A senior college in the City University of New York system, Baruch College offers undergraduate and graduate programs of study through its three schools: the Zicklin School of Business, the Weissman School of Arts and Sciences and the School of Public Affairs. Housed at the Zicklin School is the Lawrence N. Field Center for Entrepreneurship, a model of entrepreneurship education built around the collaboration of an institution of higher education, government and the private sector. For information, visit www.baruch.cuny.edu

64
For more information on the Global Entrepreneurship Monitor 2008 National Entrepreneurial Assessment for the United States of America Executive Report, contact:
Julio De CastroE-mail: [email protected]
For more information on the Global Entrepreneurship Monitor or for more copies of this report, contact:Marcia ColeTelephone: 1-781-239-5795E-mail: [email protected]
GEM Global Reports, National Team Reports, Public Data Sets (selected), events information, etc., are available on the GEM website: www.gemconsortium.org
To download copies of this report and to access select data sets, please visit the GEM website: www.gemconsortium.org.
Nations not currently represented in the GEM Consortium may express interest in joining and ask for additional information by e-mailing Executive Director, Kristie Seawright at [email protected] or Marcia Cole at [email protected].
Contacts

65
AbDUl Ali
Abdul Ali is the President’s Term Chair and an Associate Professor of Marketing at Babson College. Earlier he served as Chair of the Marketing Division for six years (2000–2006) at Babson College. His teaching and research interests include entrepreneurial marketing, new product management, marketing research methods, marketing strategy and marketing high-tech products.
i. ElAiNE AllEN
I. Elaine Allen is the Research Director of the Arthur M. Blank Center for Entrepreneurship and an Associate Professor of Statistics and Entrepreneurship at Babson College. A Fellow of the American Statistical Association, she is also a founder of StatSystems, ARIAD Pharmaceuticals and MetaWorks, Inc.
CANDiDA brUSh
Candida Brush is a Professor of Entrepreneurship and holder of the Paul T. Babson Chair in Entrepreneurship at Babson College. She is Chair of the Entrepreneurship Division and a visiting adjunct Professor to the Norwegian School of Engineering and Technology (NTNU) in Trondheim, Norway. She is a founding member of the Diana Project International, and received the 2007 FSF-NUTEK Award for outstanding contributions to Entrepreneurship Research. Her research investigates women’s growth businesses and resource acquisition strategies of in emerging ventures.
WilliAM D. byGrAvE
William D. Bygrave is professor emeritus at Babson College. In 1997, he co-founded GEM to study the entrepreneurial competitiveness of nations. He is delighted that GEM is now a thriving consortium of more than 60 nations that comprise about 95 percent of the world’s GDP and more than two-thirds of its population.
JUlio DE CAStro
Julio De Castro is Professor of Entrepreneurship and the Lewis Family Distinguished Professor at Babson College. He has served on the Board of Governors of the Academy of Management, and is President of the Iberoamerican Academy of Management. He is Associate Editor of The Journal of Small Business Management, and serves on the editorial boards of The Journal of Management Studies, Revista de Empresa, Management Research, The Journal of High Technology Management Research, Journal of World Business, and Entrepreneurship Theory and Practice. Previously, he served on the editorial board of the Academy of Management Journal.
JUliAN lANGE
Julian Lange is the Governor Craig R. Benson Professor of Entrepreneurship and Public Policy at Babson College, where he leads the public policy entrepreneurship curriculum initiative and teaches MBA, undergraduate and executive education courses. An experienced entrepreneur and adviser to private sector firms and public agencies, he served as CEO of Software Arts, creator of VisiCalc—the first electronic spreadsheet.
About the Authors

66
About the Authors
hEiDi NECK
Heidi Neck is the Jeffry A. Timmons Professor of Entrepreneurial Studies at Babson College. She is the Faculty Director of the Babson Symposium for Entrepreneurship Educators (SEE), where she passionately works to improve the pedagogy of entrepreneurship education because venture creation is the economic growth engine of society.
JoSEPh oNoChiE
Joseph Onochie is the Academic Director of the Executive MBA program and an Associate Professor of Finance at Baruch College, CUNY. He has also served as a consultant and adviser to financial services firms, investments banks and hedge funds.
ivory PhiNiSEE
Ivory Phinisee was previously a manager of International Demand Analysis & Forecasting at AT&T. Currently he is a Research Associate at the Lawrence N. Field Center for Entrepreneurship at Baruch College, CUNY.
EDWArD roGoff
Edward Rogoff is Professor of Management and Chair of the Management Department at Baruch College, CUNY. He is the author of Bankable Business Plans and The Entrepreneurial Conversation along with many articles related to entrepreneurship.
AlbErt SUhU
Albert Suhu is a graduate research assistant completing a degree in statistics at Baruch College, where he also received a Full-Time Honors MBA in Finance and Marketing.

67
Endnotes
i Reynolds, P.D., with E. Autio, J. Levie and others (1998). Babson College-London Business School Global Entrepreneurship Monitor: Data Collection-Analysis Strategies Operations Manual. London Business School: mimeo, 6.
ii Most new businesses do not survive beyond three or four years. This is the main rationale for the choice of 42 months as the cut-off period. However, the choice of 42 months also reflects operational issues. According to Reynolds et al., “The relevant interview question asked only the year when salary and wage payments were initiated and most surveys occurred in the summer months; so the alternatives for choosing a ‘new firm age’ were 1.5 years, 2.5 years, 3.5 years, etc. The shortest time frame that would provide enough cases for stable prevalence rates with a total sample of 2,000 seemed to occur at 3.5 years. Conceptually, any time period under five years seemed satisfactory so this age was considered an appropriate trade-off between conceptual and operational considerations in the early years of the project. There has been no compelling reason to adjust this criteria and a desire for a stable time series has led to its continued use. It should be considered a procedure to capture existing firms less than three or four years old.” [Reynolds, P.D., Bosma, N.S., Autio, E. et al. (2005)]
iii Schumpeter, J.A. (1936). Theory of Economic Development. Cambridge: Harvard University Press.
iv Shane, S. and S. Venkataraman, (2000). “The Promise of Entrepreneurship as a Field of Research,” Academy of Management Review, 25, 217-226.
v Acs, Zoltan J. and D.B. Audretsch (2005). “Entrepreneurship, Innovation and Technological Change,” Foundations and Trends in Entrepreneurship, 1(4), 149- 155.
vi Koellinger, Philipp (2008). “Why are Some Entrepreneurs More Innovative than Others?” Small Business Economics, 31, 21-37.
vii Michael, Steven C. and John A. Pearce, II (2009). “The Need for Innovation as a Rational for Government Involvement in Entrepreneurship,” Entrepreneurship and Regional Development, 21(3), May, 285–302.
viii Global Entrepreneurship Monitor 2008 Global Executive Report, 33.

68