what hi tells us about galaxies and...
TRANSCRIPT

UAT 16.06
1
What HI tells us about Galaxies and Cosmology
Martha Haynes UAT16 16.06.14
Leo P Coma P
2
ALFALFA: A Census of Gas-bearing Galaxies
• A galaxy is a gravitationally bound object that consists of billions (and billions) of stars, gas clouds (of varying temperature and density = interstellar medium), dust clouds (mixed with the gas), and (so it seems), 90% dark matter.
• Optical surveys, like the Sloan Digital Sky Survey, detect the stellar component of galaxies.
• ALFALFA is designed to detect the cool (not hot; not cold) atomic gas in and near galaxies.
• ALFALFA is a blind survey; we observe the whole area of sky, whether or not we think/know there is an optical galaxy there.
• ALFALFA is a spectroscopic survey; not only do we detect the HI line flux, we also measure its frequency (velocity) and the width of the HI line (a measure of rotational velocity).
UAT 16.06
3
HI : Why do we care ?
• Easy to detect, simply physics cold gas mass• Good index of SF fertility future SF• Comparative HI content => HI deficiency• Excellent tracer of host dynamics dark matter• Useful Cosmology tool HI mass function, HI
velocity width function, Tully-Fisher relation, “dark” galaxies(?)
• Interaction/tidal/merger tracer • Can be dominant baryon form in low mass galaxies
• ALFALFA: A census of HI in the local universe
The HI 21 cm line @ 1.42 GHz
UAT 16.06

Hydrogen in the Interstellar Medium
4
Full-Sky Map at 1420 MHzShows distribution of HI
• HI is the designation astronomers use for neutral hydrogen atoms in space.
• It is estimated that 4.4% of the visible matter in our galaxy is HI. => ~ 4.8 x 10⁹ M๏.
• The fraction of interstellar space filled with HI clouds is 20% to 90%.
Atomic vs molecular gas• Estimates for molecular hydrogen, H2, vary – 1.2 to 3.5 x 10⁹ M๏.• H2 tends to concentrate in a small number of giant gas clouds.• Found principally in the inner region, where most of the SF also
occurs.
• Stars form when molecular clouds collapse (usually)• The atomic gas is the “fuel reservoir”.
UAT 16.06
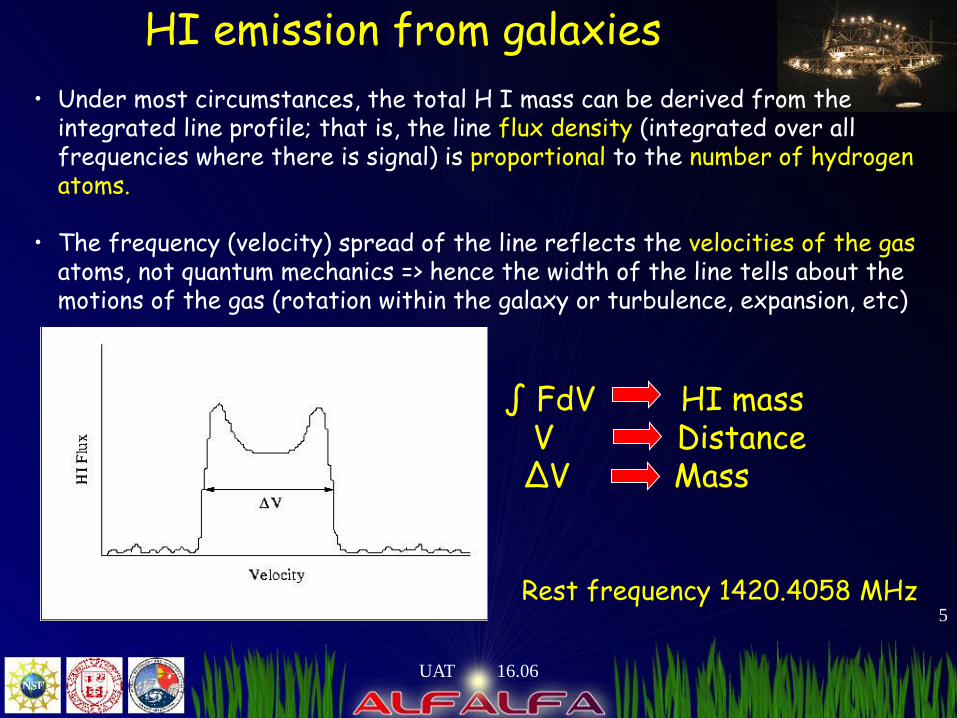
• Under most circumstances, the total H I mass can be derived from the integrated line profile; that is, the line flux density (integrated over all frequencies where there is signal) is proportional to the number of hydrogen atoms.
• The frequency (velocity) spread of the line reflects the velocities of the gas atoms, not quantum mechanics => hence the width of the line tells about the motions of the gas (rotation within the galaxy or turbulence, expansion, etc)
Rest frequency 1420.4058 MHz
∫ FdV HI massV Distance∆V Mass
HI emission from galaxies
5
UAT 16.06
6
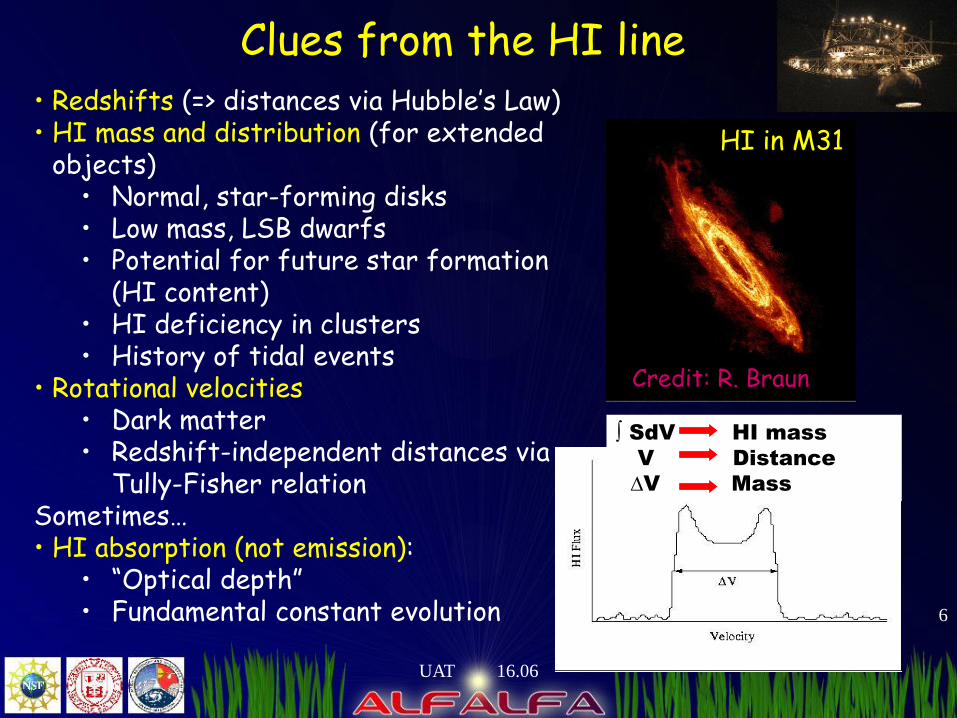
Clues from the HI line• Redshifts (=> distances via Hubble’s Law)• HI mass and distribution (for extended
objects)• Normal, star-forming disks• Low mass, LSB dwarfs• Potential for future star formation
(HI content)• HI deficiency in clusters• History of tidal events
• Rotational velocities• Dark matter• Redshift-independent distances via
Tully-Fisher relation Sometimes…• HI absorption (not emission):
• “Optical depth”• Fundamental constant evolution
HI in M31
Credit: R. Braun
∫ SdV HI mass
V Distance
∆V Mass
UAT 16.06

Hubble’s LawThe dominant motion in the Universe is the smooth expansion
known as the “Hubble flow”. Hubble’s Law: Vobs= HoD
where Ho is Hubble’s “constant” and D is distance in Mpc
Recessional velocity =
Spread in velocity for objects in a cluster due to their orbital
motion within the cluster.
Hubble’s constant X Distance
Hubble’s “constant” = 70 (?67.4?) km/s per MpcUAT 16.06
7
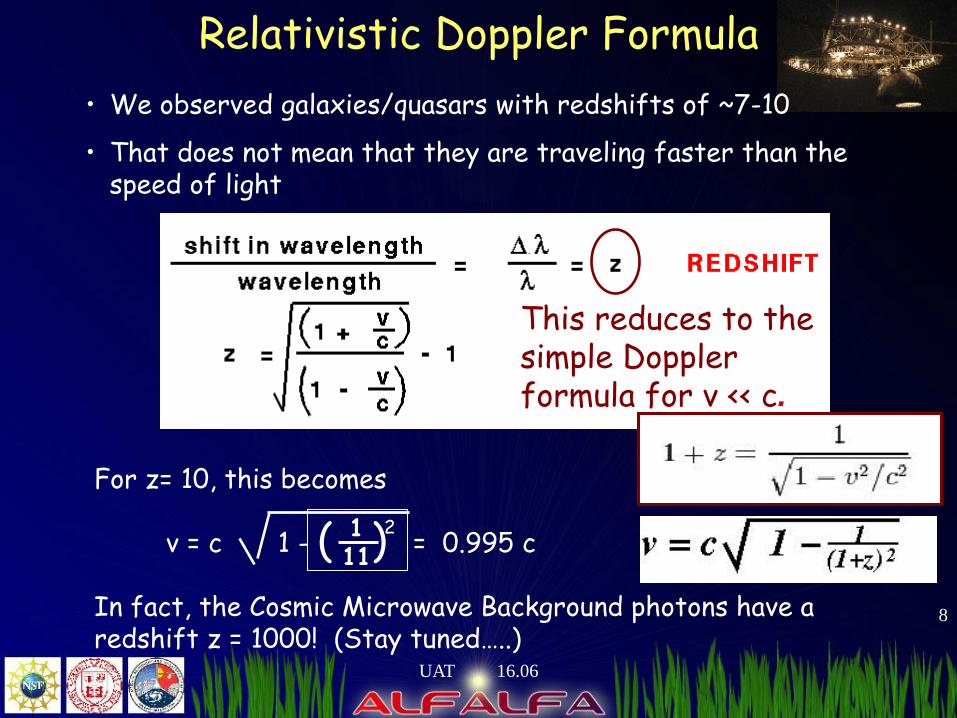
Relativistic Doppler Formula
• We observed galaxies/quasars with redshifts of ~7-10
• That does not mean that they are traveling faster than the speed of light
This reduces to the simple Doppler formula for v << c.
For z= 10, this becomes
v = c 1 - = 0.995 c
In fact, the Cosmic Microwave Background photons have a redshift z = 1000! (Stay tuned…..)
111( )2
UAT 16.06
8

9
HI 21 cm line
http://coolcosmos.ipac.caltech.edu/cosmic_classroom/multiwavelength_astronomy/multiwavelength_museum/m81.html
HI: The fuel for star formation
UAT 16.06

HI distributions
UAT 16.06
10
• HI found in the disk
• Often extends beyond the optical disk

HI in NGC 2403
UAT 16.06
11HI traces beyond the stellar disk =>dark matter halo
starlightHI distribution

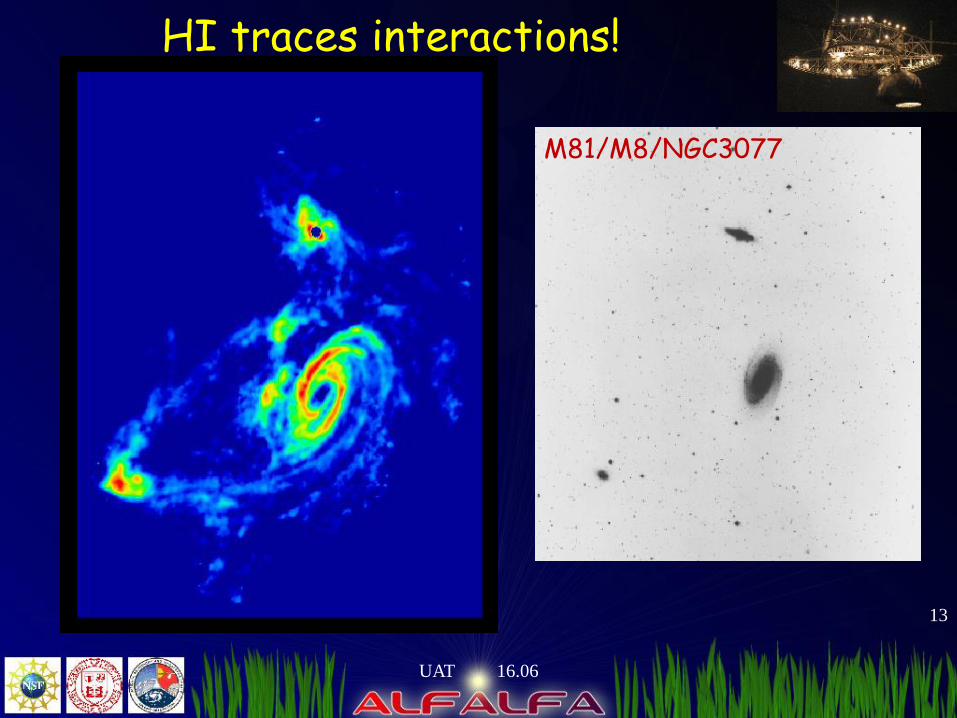
HI traces interactions!
UAT 16.06
12
Gravitational interacts perturb preferentially the outer regions of the galaxies.
HI shows both the HI distribution and the velocity field.
HI is an excellent tracer of tidal interactions.
M81/M8/NGC3077
HI traces interactions!
UAT 16.06
13
M81/M8/NGC3077

HI traces interactions!
UAT 16.06
14

HI traces interations!
UAT 16.06
15
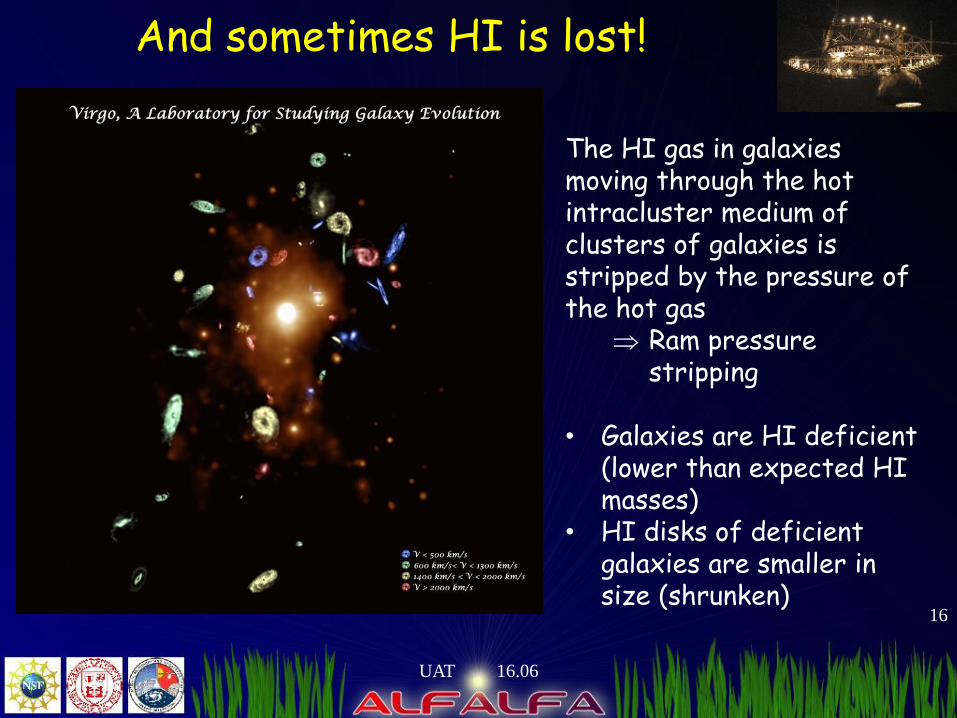
And sometimes HI is lost!
UAT 16.06
16
The HI gas in galaxies moving through the hot intracluster medium of clusters of galaxies is stripped by the pressure of the hot gas
Ram pressure stripping
• Galaxies are HI deficient (lower than expected HI masses)
• HI disks of deficient galaxies are smaller in size (shrunken)
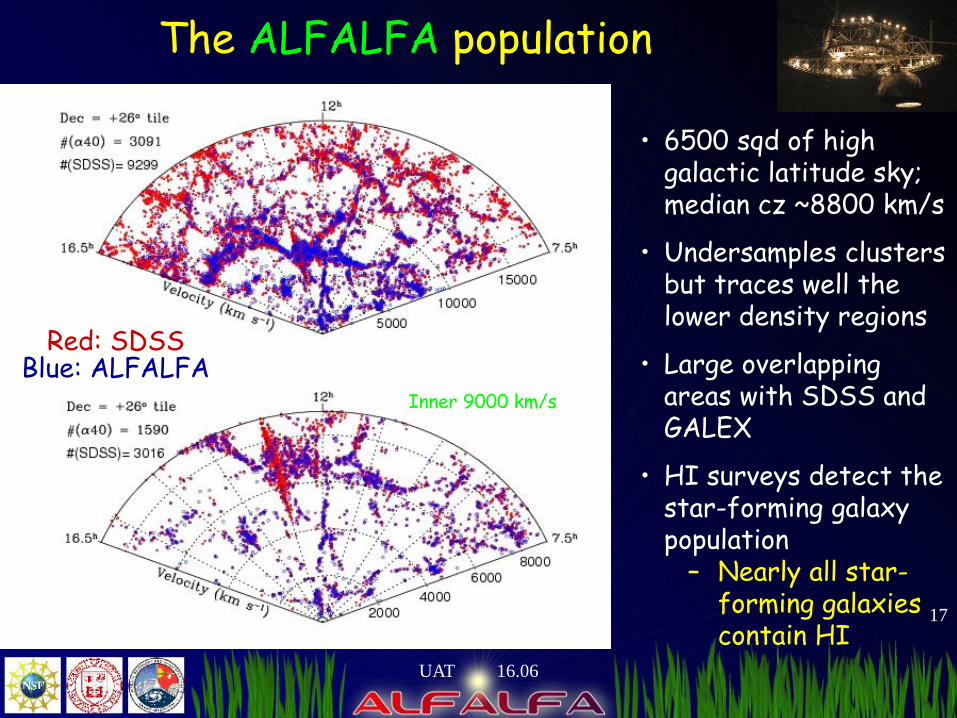
The ALFALFA population
• 6500 sqd of high galactic latitude sky; median cz ~8800 km/s
• Undersamples clusters but traces well the lower density regions
• Large overlapping areas with SDSS and GALEX
• HI surveys detect the star-forming galaxy population
– Nearly all star-forming galaxies contain HI
Red: SDSSBlue: ALFALFA
Inner 9000 km/s
UAT 16.06
17
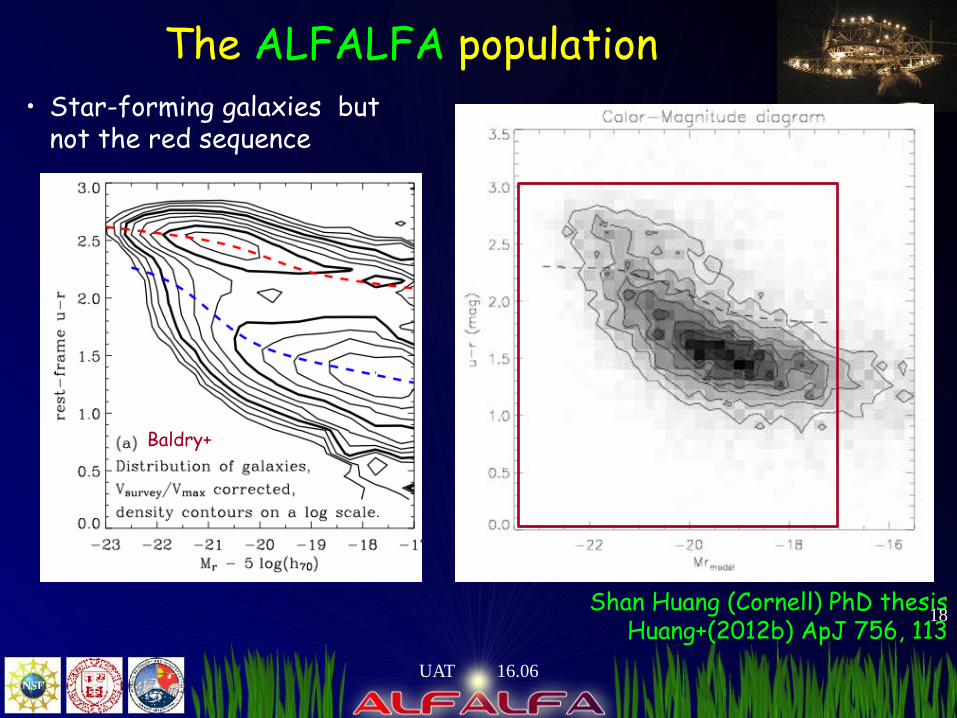
The ALFALFA population
Shan Huang (Cornell) PhD thesisHuang+(2012b) ApJ 756, 113
• Star-forming galaxies but not the red sequence
Baldry+
UAT 16.06
18

HI-stellar scaling relations
19
Virtually all SF galaxies contain HI but the red sequence galaxies contain (none).
• HI fraction falls as the stellar luminosity/mass increases
• Low luminosity SF galaxies are HI-dominated (more mass in HI than in stars)
• Increased scatter and break in slope of MHI versus Mstellar relation (and also fHI) below Mstellar ~ 10 9 M
• HI represents the fuel reservoir for future star formation.
Huang+(2012b) ApJ 756, 113
log Mstellar (M
)UAT 16.06
HI cosmology
• The HI Mass Function: # galaxies per interval of HI mass per unit volume (analogous to a luminosity function) (Martin+2010 ApJ 723, 1359)• Cosmic density of HI at redshift 0
• The HI correlation function: how do HI galaxies cluster? (Martin+ 2012 ApJ 750, 38)• HI galaxies are the least-clustered population
• The HI velocity width function gives a perspective on the dark matter halo mass function. (Papastergis+ 2011 ApJ 739, 38)• We don’t understand how gas/stars fit into halos• But gas richness is related to halo angular momentum
All of these yield insight into the distribution of dark matter halos, in this case ones which are gas-bearing, regardless of their stellar content.
UAT 16.06
20

HI-selected ALFALFA population
21Martin + (2012) Ap J 750, 38
The HI population is much less clustered on small scales, but follows the DM on large scales.
The HI population is least clustered known => environmentally-driven processes are minimized.
UAT 16.06

A link between spin and gas richness
Higher gas fraction high spin parameter
Halo spin parameter:
Shan Huang+ (2012b) ApJ 756, 113
Observationally (not so easy) λ= 21.8 Rd (kpc)
(Vrot [km/s])3/2
UAT 16.06
22

Low mass galaxies: Insights from ALFALFA
23
• At low Mstar, the baryonic gas fractionMHI / (MHI + Mstar) approaches 1.
• Many low HI mass dwarfs are LSB and patchy, so their stellar masses are uncertain.
UAT 16.06
ALFALFA: Are there “dark galaxies”?
24
• In agreement with previous results, ALFALFA finds that fewer that 2% of (clearly extragalactic; not ALFALFA UCHVCs) HI sources cannot be identified with an optical counterpart.
• The majority of objects without OC’s are found near to galaxies with similar redshifts.
Luke Leisman, PhD thesis (Cornell)Karen Lee-Waddell, PhD thesis (Queen’s)
Steven Janowiecki, Bill Janesh PhD thesis (Indiana)+ Cannon, Salzer, Rhode, Jozsa, Adams, Darling, RG, MH
Dark galaxies: The burden is always on us to prove that
(1) the signal is real and (2) there is no OC even at low surface brightness
(3) the HI is not tidal in origin(4) not an OHM at z~0.2
ALFALFA “(Almost) Dark” galaxies project
UAT 16.06

Why so much gas, so few stars?
25
HI1232+20 (a.k.a. “Coma P”)• Peak SB(g) 26.5 mag/sq”• Visible in GALEX, not SDSS• log MHI/M
= 8.83 @25 Mpc
• Mg ~ -12.7 @25 Mpc• MHI/Lg ~44 • RHI ~ 23 x 11 kpc @ 25 Mpc• Ropt ~ 7.3 x 3.7 kpc @ 25 Mpc• Hint of ordered rotation• “Almost dark”; no H
Does a different SFL hold?
Steven Janowiecki (IU)Luke Leisman (Cornell)+ Adams, Josza, Cannon, Salzer, Rhode, RG, MH
Janowiecki + 2015 ApJ 801, 96
UAT 16.06
Ask Luke!

The z~0 HI population from ALFALFA
26
• HI blind surveys do not “see”:• the “red sequence”• clusters (HI deficiency)
• HI-selected galaxies are the least clustered population (Martin+ 2012, Papastergis+2013)
• The ALFALFA population is typically bluer, of lower metallicity and lower extinction, consistent with having extended disks and lower SFEs.
• Galaxies with higher HI fraction are hosted in halos with higher spin .
• HI dominates the (visible) baryons in low mass galaxies.
• Some of the dwarfs are nearly dormant : could there be a population of low mass dwarfs with stellar/gas contents so low that we don’t see them except when they accrete a small amount of gas and form a few stars (Leo P) =>
– “Too Shy to Shine” = “Vanishing Cheshire Cat” (Salpeter & Hoffman 1995; Kormendy & Freeman 2015, astro-ph/1411.2170)
UAT 16.06