what influences consumers’ channel preferences?
TRANSCRIPT

What Influences Consumers’
Channel Preferences?
Master Thesis
Erasmus University Rotterdam
Erasmus School of Economics
Anne-LottevanAmerongen StudentNumber:482491aa
14-12-2018
MasterThesisinMarketing
SupervisedbyProf.dr.A.C.D.BasDonkers

2
Acknowledgement I would like to thank all the people who helped me during my Master Thesis process.
First of all, I would like to express my gratitude to my supervisor Prof. dr. A.C.D. Bas
Donkers. Your many good advises and patience were a great support to me during the last
six months. Thank you so much for coaching me.
I would also like to thank my housemates, friends and family for supporting me and for
making me even smile during the hard moments. It was a very enriching journey in the
world of on- and offline consumer behaviour. I am sure that the knowledge gathered during
this research will be very useful for my new endeavours in the (near) future.
3
Abstract Since the late 90’s the World Wide Web has rapidly penetrated modern society. This
includes the possibility to buy goods and services online. In a time span of two decades,
the change of consumer behaviour has let to more than 20% of all purchases in the
Netherlands are done in a web shop. Although the majority of purchases are still done in
physical stores, the trend towards buying goods online seems irreversible. Given the impact
of this trend on retailers, e-tailers and consumers, it is relevant to understand better why
consumers sometimes prefer to buy their goods online and sometimes in a physical store.
Are variables like price and convenience the main drivers, or is channel preference driven
by variables like age and need for advice?
The goal for this thesis is to research the influence of different variables on the consumers’
channel choice (online or in a physical store). Product- and consumer related variables were
tested amongst a representative Dutch based audience. The research result made clear that
variables like type of good, age and the wish for visual inspection make a significant
difference regarding the consumers’ preference for one of both channels. On the other hand,
variables like convenience, possession of a car and holding a product in hand, were not a
significant driver for either online or offline preference. Interesting outcomes that confirm,
but also challenge, current conventional thinking.
Based on the outcome of the research, it can be concluded that both channels own their
respective strength; hence both channels seem to have viability for the future. Based on
this, a recent development like the Omni channel approach, that optimally fulfils
consumer’s needs by integrating the strengths of the online and offline environment, can
be expected to become more and more successful. The outcomes of this research can be
useful for retailers and e-tailers that wish to improve their current web shop or physical
store, as well for those who are working towards a handshake between both sales channels.
Keywords: online, offline, channel, e-tailer, retailer, experience goods, search goods.

4
Table of Contents
1.Introduction............................................................................................................................................6
2.ResearchProblemandResearchObjectives..................................................................................72.1ResearchObjectives............................................................................................................................................................72.2ResearchDesign...................................................................................................................................................................7
3.Theoreticalframework........................................................................................................................9Productvariables........................................................................................................................................................................93.1TypeofGoods........................................................................................................................................................................93.2SensoryAttributes............................................................................................................................................................113.3Logistics.................................................................................................................................................................................123.3.1Deliverytime..........................................................................................................................................123.3.2Sizeandweight.....................................................................................................................................133.3.2Carpossession.......................................................................................................................................13
3.4Price........................................................................................................................................................................................143.4.1Pricedifferencebetweenchannels.................................................................................................143.4.2Possibilitytocompareprices...........................................................................................................143.4.3Pricevolatility........................................................................................................................................153.4.4Pricedifferencesbetweenmarkets................................................................................................153.4.5Theroleofincome................................................................................................................................16
3.5Needforadvice..................................................................................................................................................................173.6LeisureShopping..............................................................................................................................................................183.7ConvenienceOrientation..............................................................................................................................................193.8Age...........................................................................................................................................................................................203.9ConceptualModel.............................................................................................................................................................21
4.Methodology.........................................................................................................................................224.1DataCollection..................................................................................................................................................................224.2TheQuestionnaire............................................................................................................................................................234.3TheAnalysis........................................................................................................................................................................264.3.1Cronbach’sAlpha..................................................................................................................................26
5.Results....................................................................................................................................................285.1Descriptionofthesample.............................................................................................................................................285.2Distributionofonlineandofflineuse.....................................................................................................................285.3Descriptivestatisticsandcorrelations..................................................................................................................305.4AssumptionsofLinearMultipleRegression........................................................................................................335.5LinearMultipleRegression..........................................................................................................................................345.6OrderedLogitRegressionasaRobustnessCheck............................................................................................405.6.1TheMethodology..................................................................................................................................405.6.2TheResults.............................................................................................................................................40

5
5.7ConceptualModelOutcomes......................................................................................................................................42
6.Conclusion.............................................................................................................................................43
7.Discussion..............................................................................................................................................457.1Managerialimplication................................................................................................................................................457.2Limitations...........................................................................................................................................................................467.3Furtherresearch………………………………………………………………………………………………………………..487.3.1Multiplecountryresearch..................................................................................................................487.3.2Behaviourandmotivationalresearch...........................................................................................487.3.3Demographicsegmentation..............................................................................................................48
8.Referencestorelevantliterature....................................................................................................50
Appendixes................................................................................................................................................54I:Surveychannelpreferences............................................................................................................................................54II:DescriptiveFrequencyoutputs....................................................................................................................................59III:Distrubutionofonlineuse(histrograms)............................................................................................................60IV:Outputtestsofnormality..............................................................................................................................................62V:PartialPlots&Residualplot.........................................................................................................................................63VI:MultipleRegressionincludedIncome.....................................................................................................................68VII:RobustnesscheckOrderedLogicRegression....................................................................................................71

6
1. Introduction Historically, consumers in need of a good, visited the nearest shop in town and bought what
they needed. But over time, this consumer behaviour regarding shopping has changed.
Mobility increased due to better train connections and due to the fact that during the 60’s
and 70’s car penetration grew very fast, with now almost every household owning a car,
and some owning even two or more. Like in the Netherlands, where 8 million cars are
owned by 7.8 million households (CBS, 2018). The increase in mobility has facilitated
consumers to travel much further if a certain good at the right specification can be bought
against better terms somewhere else than in their own town or city. Since the last 20 years
consumer behaviour regarding shopping has increased even more. Since the late 90’s the
World Wide Web has rapidly penetrated modern society. As a consequence, the possibility
to buy goods and services on the web (online) became available. In a modern country like
the Netherlands this development took place in only a few years time. Consumers have
quickly adapted to the new possibilities, facilitated by entrepreneurs who have set up online
platforms (web shops) where consumers could buy their goods. Nowadays, every half year,
95% of the Dutch population buys one or more goods from a web shop. The average online
spending through web shops during the first six months of 2017 was €757 per shopper,
which is 23% of their total spending on products and services (Shopping tomorrow GFK,
2017). It is expected by GFK that the share of online spending will increase to 35% in 2022.
One of the reasons for this huge increase is that consumers see more and more advantages,
and less disadvantages, of doing their purchases online. However, looking from the other
side, it can be stated that nowadays “only” 23% of the total expenses are done through
online purchases, and 67% are still from transactions done in physical store. Overall, this
indicates that (Dutch) consumers still buy their goods mainly in a physical store, but that
the online channel is becoming increasingly important. What do consumers buy online and
what kind of goods do they buy offline? Research shows an interesting distinction between
products that are bought in either of both channels. Holiday trips are a good example of
something that is typically bought online and food products are mostly bought in the
physical store (CBS, 2017). Research that explores the reasons behind this distinction could
help to better understand and influence the behaviour of the consumer.

7
2. Research Problem and Research Objectives As mentioned, during the last couple of years, a lot of research has been done to get a better
understanding of the online consumer search- and buying decision process. However, how
consumers make the decision between online and offline, and what variables (e.g. price and
convenience) influence that decision, could be further explored. Moreover, it would help if
we better understand whether other variables (e.g. car possession) influence the relation
between the variables and the final channel choice.
The objective of this thesis is to research the influence of different variables on the channel
choice (online or in a physical store). Consequently, this research will give a clearer insight
on the reasons why consumers prefer to buy online or why they prefer to buy in physical
stores and how this decision is being influenced. Especially for traditional retailers with
shops it is important to better understand what drives consumers in this respect, because it
will allow them to respond more successfully to the “online trend”.
2.1 Research Objectives The research will focus on: “The influence of different factors on consumers’ channel
preferences when they purchase goods”
2.2 Research Design The research will be focussed to measure the role of four product variables that influence
consumers’ final decision on the purchase channel, namely:
1. Type of the good
- Experience goods
- Search goods
2. Sensory Attributes
3. Logistics
- Delivery time
- Size and weight
4. Price Sensitivity
- Price between channels
- Possibility to compare prices
- Price volatility
- Price differences between markets

8
The research will, next to product variables, also focus on four user variables that
influence consumers’ final decision on the purchase channel, namely:
5. Need for advice
6. Leisure Shopping
7. Convenience orientation
8. Age
Next to the eight variables mentioned, three moderating variables will be researched.
9. Car Possession
10. Brand trust
11. Income
All the variables will be discussed in the theoretical framework.

9
3. Theoretical framework In this chapter, literature on offline shopping and online shopping will be discussed and
research hypotheses will be developed. As mentioned in the introduction part, Internet’s
potential should not be underestimated. During previous years, the number of online
transactions increased a lot and they are still heavily growing. Many consumers and
companies have gained more trust in the Internet for completing their day-to-day businesses
and transactions. Despite of this, as we speak, offline transactions are still more numerous
than online transactions and it is not expected that off line buying will completely
disappear. What moves and triggers people to buy some type of products offline and other
type of products online? Why are online transactions growing faster for certain products
than others? What are the product- or user characteristics that make consumers decide to
buy some type of goods more online and some type of goods more offline?
Product variables
3.1 Type of Goods Nowadays, product categorization is an important part of company strategies and to decide
if a product can be sold successfully online or better in the physical store. A literature
overview (Varvara & Mityko, 2011) showed 22 different categorization models from 52
different researchers. Philip Nelson was the first to classify products, namely in experience
and search products. Later on, (Darby and Karni, 1973) expanded this concept to: Search,
experience and credence goods. Search goods are those products that consumers can
search, inspect and compare (search behaviours) prior to the purchasing (Nelson, 1970).
Consumers can easily assess the quality before they actually buy the good. An example of
a search good is a book. The material of which the cover is made of (hard or soft cover),
the price and the size can be well assessed by searching for the product online.
Nelson (1974) defined experience goods as those whose qualities cannot be easily
determined prior to a purchase. In addition, (Kline, 1998) provided two conditions defining
experience goods. Firstly, direct experience is required for more information on the
dominant product attributes. Secondly, the search for information for these dominant
attributes is more expensive and more difficult than direct product experience. Only after
trying the good, an opinion about the quality, benefits and downside of the product can be
shaped. An example of an experience good is perfume. The quality and smell can’t be
judged by just looking at the package. The price can be observed, but the odour of the
perfume can only be judged by personal experience. Lastly, credence goods are those

10
whose qualities and benefits might even not be perceived after purchasing them, so
consumers have to rely on word of mouth, recommendations or brand reputation as a sign
of quality. (Nelson, 1970). A good example of credence good is the degree of a specific
college or university. In this paper, only search and experience goods will be discussed.
Credence goods are not relevant for this thesis, because most of them cannot be bought in
a physical store.
As mentioned, Nelson’s defines experience goods as those who can only qualify after being
purchased. However, (Wright and lynch, 1995) broadened this definition by replacing
“after purchasing” by “after using”. Nowadays, a lot of retailers create the occasion to try
products first before the consumer purchases them. For example, the perfume mentioned
earlier, can be tried when a consumer visits a physical store. Or consumers even receive
free samples proactively when they visit the store. Furthermore, Chiang and Dholakia
(2003) note that such information is difficult to obtain electronically. In conclusion,
literature makes clear that experience goods often require personal inspection, because the
online search for information about the dominant attributes is really difficult. Thus, to
obtain this kind of information (about experience goods), consumers tend to visit the
physical store.
Consequently, the following hypothesis is proposed:
H1: Consumers are more likely to shop online when they buy search goods instead of
experience goods.

11
3.2 Sensory Attributes Sensory attributes can be directly determined through our senses, particularly by touch,
smell and sound. (Degeratu & Rangaswamy & Wu, 2000). The importance of sensory
attributes seems to differ over time. Fifty years ago, people used to assess almost every
product that they bought by looking into the sensory attributes. In the following decades
they trusted more on the expertise of retailers and the level of quality that well-known
brands stood for. As a consequence, it became less important for them to assess the sensory
attributes themselves. In the following decades the consumer loyalty to brands and retailers
diminished. Following (Degeratu et al. 2000) this means that the importance of assessing
sensory attributes has regained territory. Some sensory attributes, such as the feel of a
product, are difficult to assess online. The only way to determine these attributes is by
visiting a physical store. It is probably for this reason that today many offline retailers create
the possibility for consumers to assess a product by using their own senses.
Consequently, the following hypothesis is proposed:
H2: Consumers for whom assessing sensory attributes themselves is important, are less
likely to buy online.
A clear link between sensory attributes and brand authority is evident. Based on the
research done by (Dick et al. 1990), (Degeratu et al. 2000) state: “In the limit we can
conceive of situations where the brand name becomes the surrogate for all the attributes for
which information is missing or costly to obtain”. Conversely, when information about new
attributes become available, the importance of existing attributes, particularly the brand
name, is diminished. This indicates that brand trust is a moderator on the relationship
between sensory attributes and online preference.
The above is specifically relevant for the consumers’ channel choice, because in the case
of consumers shopping online, they cannot assess the sensory attributes themselves and
need to rely more on brand names.
Consequently, the following hypothesis is proposed:
H3: When consumers’ brand trust is high, they are more likely to buy online.
12
3.3 Logistics
Making a decision to buy either online or offline, is impacted by some logistic aspects.
Buying offline means that customers have to travel to a shop during opening hours, but
once they have bought the goods, they can immediately start using it. Buying online means
that they can order at any convenient moment, but the actual delivery time between order
placement and the good arriving at home, might be perceived as waste of time. On the other
hand, the trade-off between shopping time and delivery time is also impacted by the size
and weight of the good. For example, shopping at IKEA seems to be highly driven by the
need of immediate possession, but size and weight might be a barrier. Talking about
logistics solutions, Dutch e-tailer Coolblue added reverse logistics of old products to their
delivery, taking away one of the disadvantages that online shopping originally had. Below
some more details on both logistic aspects.
3.3.1 Delivery time
When a consumer buys a good in a physical store, this creates the ability to possess and use
it directly after the purchase. We call this phenomenon immediate possession. Immediate
possession refers to the instantaneous delivery of products or services. (Rohm &
Swaminathan, 2004).
Sometimes, immediate possession is very important. For example, if a consumer wants to
prepare a meal but forgot to buy an important ingredient. In this situation immediate
possession, no delivery time, is unavoidable. Delivery time is the time interval from the
moment of ordering until the moment when the product is delivered to the consumer (C.
So, Jing, Sheng, Song, 1997). Nowadays, many companies guarantee a certain delivery
time as part of their e-commerce strategy. This seems to be a good idea following
(Balasubramanian, 1998) who researched amongst direct marketers and conventional
retailers. He suggests “direct marketers can reduce consumer resistance to catalogue or
Internet purchases by reducing delivery time”. Consumers motivated by immediate
possession may prefer to shop in a physical store instead of doing an online purchase,
although shortening the delivery time of online purchases might change their offline
preferences. Consequently, the following hypothesis is proposed.
H 4: Consumers who prefer short delivery times, are less likely to shop online.

13
3.3.2 Size and weight
Even when consumers prefer immediate possession, size and weight of the good might be
a barrier for buying offline. As we all understand, the larger the good and the package
around it, the more a challenge to take the good to your home. Weight is another interesting
aspect, and also weight in relation to size. Weight on its own might be a barrier for shopping
offline. Why would a consumer carry a heavy product, if it can be delivered to his home?
Consequently, the following hypothesis is proposed:
H5: To prevent the burden of size and weight, consumers tend to buy more online.
3.3.2 Car possession
The main effect between the burden of weight and size and a preference for online shopping
might be impacted by the fact of possessing a car (moderator). A consumer who only owns
a bicycle might find the package of a PC and the accessories much too big to take home.
However, if you own a car, the size of a PC package is not a problem for taking the good
to your home. Additionally, it also makes the good available for immediate use.
Consequently, the following hypothesis is proposed:
H 6: Car possession leads to buy goods less online (and more offline).

14
3.4 Price
3.4.1 Price difference between channels
Although price is one of the product attributes, it is a different kind of attribute than for
example sensory attributes. It varies across the purchase channels whereas the sensory
attributes themselves are not different between channels (but only the way to obtain
information about it). (Degeratu, et al., 2000) state: “We consider price as a separate search
attribute because it varies across purchase occasions unlike other product-specific (non)
sensory attributes that are relatively stable across purchase occasions”. This might indicate
that price is one of the dominant drivers for people to shop either online or offline. To
further explore the impact of price on shopping behaviour, some price related elements are
discussed below.
3.4.2 Possibility to compare prices
Price is a very absolute and single-minded fact. That makes is very easy to compare. For
example, if consumers want to compare nutritional values, they have to compare at least
four data (fat, protein, sugar, carbohydrates) of a product, with the same four data of another
products. But how to obtain information about prices, is very different for both channels.
It needs quite some labour to visit various shops and much less labour to do the same
comparison between online platforms. (Bakos, 1997) states: “An important difference
between online and offline markets is that for attributes for which information can be
obtained in both media, search costs are typically lower for online than for offline”.
Following this, consumers with a high price sensitivity probably spend their time and
energy for price comparison preferably by visiting online web shops. Even more, nowadays
they are serviced by sites that have already obtained all price information needed. A good
example are sites that compare telecom- and energy prices. For example
(www.gasenlicht.com) or (www.kieskeurig.com). They also have a click-through feature
so that consumers can shop online directly from these comparing sites.
15
3.4.3 Price volatility
Consumers are aware that prices for a certain good or service may differ over time. This
means that they are aware of the fact that the moment of buying might result in a better or
worse price. Suppliers are also aware that a part of all consumers are sensitive to price
differences over time. The best example for this is the way how consumers and airlines
behave regarding pricing during a period of time. This phenomenon is well described in
various papers. For example, (D. Gillen, B Mantin, 2008) state: “While some consumers
are completely insensitive to prices, others pay more or less attention to prices, how they
compare with other similar products, and the fluctuations of these prices over time.
“Consumers may have different perceptions about prices they encounter, and these
perceptions can influence their purchasing decisions or the timing of those purchases; this
is important in industries which rely heavily on cash flow for operating capital such as
airlines”.
Above is specifically relevant in the online shopping environment. Consumers are able to
check prices every day or even every hour, and for example airlines are aware of this and
have made this an important part of their revenue management. In the offline environment,
prices are less volatile. Shops mostly charge a fixed price for a good and sometimes they
run a price promotion for a week or so. Afterwards the price returns back to the standard
price.
As price volatility seems to be higher in the online environment, consumers that are
sensitive for getting the best price deal for a specific product, are expected to shop more
online.
3.4.4 Price differences between markets
Due the limited mobility of consumers, brand owners have made use of the possibility to
create prices differences between various markets. A crate of Heineken beer sold in the
south of Belgium for a few euro’s less than in the Netherlands, will not activate consumers
to drive southwards to shop their crate for just a few euro less. The same counts for an
iPhone, that is priced fifty euro’s less in Austria than in the Netherlands. However, due to
online platforms, consumers nowadays can benefit from these price differences. Buying
your books in America, or electronics through Alibaba, is just a mouse click away. It is
clear that the benefit that consumers can obtain is only possible through the online

16
environment. This indicates that consumers who are after the best price for their newest
iPhone, will tend to purchase online. Of course, they will consider the obtained price benefit
against the longer delivery time that comes with it.
In conclusion, if consumers are high price sensitive, they tend to prefer online shopping,
but only if they have a clear benefit in mind. Consequently, the following hypothesis is
proposed:
H 7: If price sensitivity is high, consumers are more likely to buy online
3.4.5 The role of income
Obtaining the lowest price for a specific good creates an absolute discount. This discount
is possibly perceived different by people with low incomes than by people with high
incomes. (B. Dellaert and Kreg Lindberg, 2010) did some research between the relationship
of income and price sensitivity amongst tourists. They found that income and price are two
of the main drivers for price sensitivity. Furthermore, the results show that there is a
systematic effect of income (moderator) on price sensitivity. This means that people with
a high income are less price sensitive than people with a lower income.
Consequently, the result might be that people with a lower income and more price
sensitivity, are more into comparing prices to find the best price.
Therefore, income is a moderator on the main effect between price sensitivity and online
shopping. Consequently, the following hypothesis is proposed:
H 8: The main effect between price sensitivity and online shopping, is impacted by the
level of net income.

17
User variables
3.5 Need for advice Before consumers decide to place an order, they are in need for information. Nowadays
you would expect that all this information can be obtained from the internet. However, not
every single piece of information obtained from the internet points into the same direction.
This might cause consumers to become uncertain and not feeling able to make the buying
decision completely on their own. (Kollmann et al, 2012) described:
“Concerning service, offline channels feature the option of expert advice about offered
products. Undecided or uncertain customers may want to council customer service before
making a purchase decision”. The impact of desire for service is researched by Kollman et
al. They conclude:
“Our research highlights the motivational causes of competing and synergic effects in a
multichannel environment. Building on the previous discussion, our results indicate that
the desire for service, rather than risk aversion could potentially cannibalize customers
away from the online channel”.
Online shops have tried to compensate the advantages that offline shops have regarding the
need for advice by the implementation of avatars. Although this might fulfil the consumers
need, it seems not sufficient to eliminate the advantages that offline stores have. This is
described in more detail by (Holzwarth et al., 2006):
“Although research has shown that in online channels the utilization of avatars, i.e. an
animated graphic representation of a sales agent, positively impacts on consumers’ attitude
towards the product and their intention to purchase this product, the online channel still
falls behind the offline channel in terms of service possibilities”.
Research has indicated that indecisiveness and uncertainty motivate consumers to council
customer service, and that desire for advice or confirmation drives consumers to offline.
Consequently, the following hypothesis is proposed:
H9: Need for advice on a specific good or service, decreases the likelihood to buy online.

18
3.6 Leisure Shopping People may shop with different intentions, also called shopping orientations. Sometimes a
consumer has an urgent need for replacing something that is broken. Another intention is
to go out for shopping in order to have a nice day and to enjoy life. The purchase itself is
not so important, and even without an actual purchase the shopping trip might be seen as
successful. Based on these two complete different ways of shopping, a lot of research has
been examined to determine with which “thoughts” consumers are going to shop. (Babin,
Darden and Griffin, 1994) called this phenomenon: hedonic and utilitarian shopping values.
Utilitarian shopping has been descripted as energic, task-related, and rational (Batra and
Ahtola, 1991). In other words, utilitarian shopping is the way of shopping where people
want to complete a task and finish it at soon as possible. This means that this type of
shoppers do not enjoy or harbour neutral feelings towards shopping.
Hedonic shopping has been described as festive and ludic (Babin, Darden and Griffin,
1994). In fact, buying a product is rather a side issue whilst enjoying life and to celebrate
it are the real goals. Hedonic shopping is also described by them as “recreational shopping”.
Recreational shoppers are people who enjoy shopping as a leisure-time activity. In addition,
shopping orientations are described by many other researchers. Task-oriented versus
experiential-oriented (Verhoef et al., 2009), task-oriented versus recreational-oriented
(Kaltcheva and Weitz, 2006) and convenience-oriented versus economic-orientated
(Bellenger and Korgaonkar, 1980).
In fact, all these definitions describe the same distinction. The shopping orientations depend
on the process goal of the consumers. Process goals refer to the way how consumers pursue
an outcome goal. Process goals are the small steps that are taken to complete the outcome
goal, for example the purchase of a specific product. In conclusion, consumers have
different shopping orientations and these depend on their outcome goals. Some consumers
might find online shopping, while sitting on a comfortable coach, the biggest pleasure when
it comes to shopping. Nevertheless, it is assumed that due to the social aspects of offline
shopping, the majority of hedonic shoppers perceive offline shopping as a more pleasure
experience than online shopping. Consequently, the following hypothesis is proposed:
H10: The tendency to enjoy shopping (recreational shopping) has a negative effect on
online shopping.

19
3.7 Convenience Orientation Whether a purchase is done in the offline or online environment, is also driven by the need
for convenience. Convenience has many different angles. Obtaining advice can be seen as
an aspect of convenience, though it is not the most common meaning of it. For this reason,
the need for advice will be researched by its own unique hypothesis (H9). Convenience
orientation as discussed in this section will be related to the most common aspects of
convenience like time reduction, flexibility in timing, saving travel effort etc. A survey by
(Jarvenpaa & Todd, 1997) amongst two hundred twenty consumers, found that
convenience was the single most salient benefit of online shopping. As (Burke, 1998)
stated, online shopping seems to be more convenient than offline shopping because it can
be done during any hour and it can by combined by any other activity, like exercise cooking
and child-care. Additionally, online shoppers can avoid crowding parking lots or bad
weather. It also allows shoppers to access distant stores.
Many elements together seem to make online shopping more convenient. All these
elements can be structured into five types of convenience that online shoppers may
perceive: (1) reduction of time for shopping; (2) flexibility in the timing for shopping; (3)
saving the effort of visiting stores; (4) saving of aggravation, and (5) the opportunity
of buying on impulse or in response to an advertisement. (Darian, 1987).
Time reduction seems to be an important and undisputed element regarding convenience
through online shopping, and the opportunity of buying on impulse or in response to an
advertisement also seems a logic driver for online shopping.
Consequently, the following hypothesis is proposed:
H11: Consumers who are in need for more convenience are likely to buy online.

20
3.8 Age
The use of the World Wide Web is increasing fast. As mentioned in the introduction, one
of the motivations of this trend is that consumers see more and more advantages, and less
disadvantages, of doing their purchases online. Although this is the case for almost all
consumers, still some consumers change their channel preference easier than others. Does
the age of a person impact their willingness to change from being an offline buyer into
becoming a buyer in both channels? Literature about the effect of age on buying goods
from the internet addresses both the conventional wisdom (younger people are quicker to
adapt online) as well as the other side of the coin (older people have more shopping
experience, so they tend to be more confident to shop online). For example, (Trocchia and
Janda, 2000) state that - due to the fact that some older people suffer from physical
disabilities- the Internet can provide them with access to the outside world including
information searches and web shopping. A survey by (Pew Research Centre, 2017)
concludes that although older generations use the Internet less for socializing and
entertainment, they use it more as a tool for searching for information, emailing, as well as
buying products. Above is supported by (Wan et al., 2010), who state that although the
older generation might adapt new technologies less quick than younger people, they have
more shopping experience, even though most of such experiences are rooted from offline
shopping. This might give them an edge in buying certain types of products on the web.On
the other hand, (Czara et al. 2009) describe that computer skills are more easily learned by
younger individuals. They have greater experience with the internet, whilst older people
tend to perceive greater risks.And (Wan et al., 2010) describe that the older generation
probably does not shop online as much because they are less familiar with and slower to
adapt to the new environment. As they state: “Thus, the older generation shies away from
online shopping more than the younger generation”. Furthermore (Trocchia and Janda,
2000) consider that the main barriers for older consumers to shop online are lack of IT
experience, resistance to change and their insistence to try the product before purchase.
Although literature gives many reasons why the impact of age does not by definition
indicate that older people do not shop as frequent online as younger people, the current
believe is that age does have an impact on channel choice. Following that, the hypothesis
on the impact of age is:
H12: Older people tend to buy fewer goods online.
21
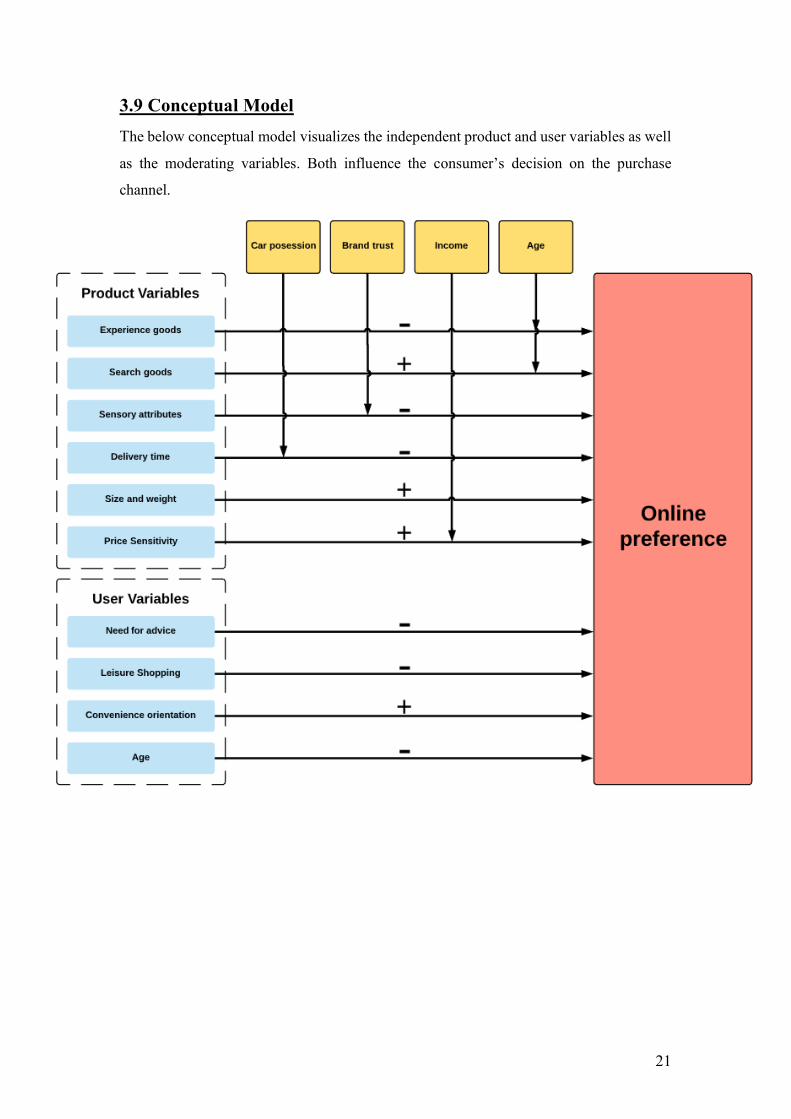
3.9 Conceptual Model The below conceptual model visualizes the independent product and user variables as well
as the moderating variables. Both influence the consumer’s decision on the purchase
channel.

22
4. Methodology The methodology section describes how the research has been designed. An explanation
about the questionnaire is included, followed by a description of the survey and an
explanation of the validation of the outcomes. The survey can be obtained in Appendix I.
4.1 Data Collection The Netherlands is part of the leading group of 28 European countries with the most
households having access to the internet. In 2017, 98 percent of the Dutch population had
internet access at their homes. The average access rate in Europe is 87 percent (CBS, 2018).
As mentioned earlier, online spending have increased a lot during the last decade, mainly
due to the fact that consumers see more advantages (and less disadvantages) of shopping
online. Although almost 80% of purchases are done in physical stores, nowadays more than
20% of purchase transactions are done in the online environment.
With this information in mind, it can be assumed that it was not imperative to select a
specific target group for the survey because almost everyone in the Netherlands is able to
make a proper trade-off between online- and offline shopping.
Quantitative research has been carried out in order to be able to answer the research
question by obtaining the right set of data required for a statistical analysis.
The questionnaire was distributed online through the website
www.erasmusuniversity.eu.qualtrics.com. Although other research platforms could have
been selected as well, the Erasmus platform provides high credibility to the audience, so it
was expected that by using this platform a higher response rate could be realized. During a
period of 7 days the survey was put online. Potential respondents were invited by email to
fill in the survey. In addition, the hyperlink (URL) was posted on a Facebook account with
more than 700 people listed as a friend. In both cases, people were gently asked to approach
the questionnaire with just one click on the URL. Furthermore, the email sent to them
included a request to forward it to friends or family. This method is called the “Snowball
sampling method”. (Goodman, 1961). It increases the chance to collect useful data in a fast
way. After completing the survey, the submitted data were stored on a server from
Qualtrics. The data was analysed by the use of SPSS.

23
105 people responded the questionnaire. Unfortunately, two questionnaires were not
completed. Because of that, these questionnaires were not continued, so 103 questionnaires
were used for the analysis phase of the research. To complete this analysis the measurement
per good was used (experience versus search) which is N = 103 x 2=206. As mentioned,
one of the answering options for income was non-disclosable. Eight people chose this
option, so the results of income were analysed with a total amount of 95 people.
4.2 The Questionnaire The questionnaire was written in English. The questionnaire consisted of 15 questions in
total. This included dichotomous questions and statements with a scale from 1 to 5. The
first part explored respondents’ behaviour and some demographic background. By using
proven measuring methods per question, the research has measured consumer attitude and
indicated behaviour with maximal reliability and validity. (J.A Kornick, S. Presser (2010).
Below an explanation per question.
Attitude towards online shopping
The first question was linked to the first hypothesis, “Consumers are more likely to shop
online when they buy search goods instead of experience goods”. With this question, it can
be analysed what kind of goods (experience or search) respondents buy frequently online.
Six goods were shown, namely three experience goods (Perfume, Mattress and wall paint)
and three search goods (Concert Ticket, Book and Phone Charger). Through a 5-point
Likert scale, respondents could indicate per good the frequency of online buying. A Likert
scale is an ordinal scale that starts with “never” and ends with “always” and assumes that
the intensity of experience is a linear continuum. This follows the assumption that the
attitudes can be measured. (Bowling, 1997).
Attitude towards inspecting a good before purchasing it
The questions “Please indicate the importance of feeling and holding the below product
before purchasing it” and the question “please indicate the importance of visual inspecting
the below product before purchasing it” were related to the second hypothesis, namely
“Consumers for whom assessing sensory attributes themselves is important, are less likely
to buy online”. The goods shown in question 1 were shown again and respondents could
indicate their opinion on a 5-point Likert scale. The first part was meant to measure the
24
importance of feeling and holding the product, the second part measured the impact of
inspecting a good visually.
Attitude towards brand trust versus online shopping
The question “To what extend do you trust brands within the below product categories” is
related to the third hypothesis “When consumers’ brand trust is high, they are more likely
to buy online”. The goods mentioned before were listed again and respondents could
indicate on a 5-point Likert scale for which type of goods brands play an important role for
them. In combination with the answers given on question 1 (respondents indicated which
products they buy online) the analysis of the answers could be carried out by running a
regression analysis.
Attitude towards logistics
The question “When you intend to buy online, does a longer than expected delivery time
changes your decision to buy online and visit a store?” is related with the hypothesis
“Consumers who prefer short delivery times, are less likely to shop online”. On a 5-point
Likert scale, respondents could indicate how often they switched channels when the
delivery time was longer than expected.
The question “How important are the below aspects (size, weight and fragility) for your
decision to buy an article online?” measures the hypothesis: “To prevent the burden of
size and weight, consumers tend to buy more online”. Respondents could indicate on a 5-
point Likert scale how important these aspects were for them.
The last question about logistics related to car possession. The question “Do you own a
car?” was a dichotomous question with the optional answers “yes” and “no. This question
is related to the hypothesis “Car possession leads to buy goods less online (and more
offline)”.

25
Attitude towards price sensitivity
The statements “I always compare prices between online stores”, “I believe that I get the
best price when I buy online”, “By tracking price changes over time, I manage to buy online
for the best price” and “By checking price differences between countries, I manage to buy
online for the best price” are related to the hypothesis “If price sensitivity is high,
consumers are more likely to buy online”. These statements were measured on a 5-point
Likert scale. Respondents could indicate how much they agreed or disagreed (with a neutral
point). In addition, the role of income could play a role through price sensitivity.
Consequently, the question “What is your income?” was created to analyse the hypothesis
“The main effect between price sensitivity and online shopping, is impacted by the level of
net income”. This question was responded on an ordinal scale that also offered the option
“non-disclosable”, as possibly some people would not want to disclose their income.
Attitude towards purchasing-advice
The statements “When I am uncertain about making the right choice, I prefer: (online
versus offline) and the statement “When I need advice of an expert before making a final
choice, I prefer (online versus offline) were related to the hypothesis “Need for advice on
a specific good or service, decreases the likelihood to buy online”. These statements were
measured dichotomously, so respondents could choose the preferred channel.
Attitude towards shopping in combination with pleasure
The statements “When I want to spend leisure time to shop, I prefer (online versus offline)
and the statement: “When I want to socialize with other people, I prefer: (online versus
offline) were related to the hypothesis “The tendency to enjoy shopping has a negative
effect on online shopping”.
These statements were measured by two options allowing respondents to choose either of
these.
Attitude towards convenience orientation
The statements “Accessibility to any online shop around the globe is a benefit over physical
shops” and “When physical stores are closed, I tend to buy the product online” were related
to the hypothesis: “Consumers who are in need for more convenience are likely to buy
online.
These statements were measured on a 5-point Likert scale, so respondents could indicate
how frequent these situations occur.
26
Questions with a demographic nature
The last part of the questionnaire consists of a set of questions with a demographic nature.
The first question was about the age of the person. This question is an open question, so
respondents could fill in their age. This question is related to the hypothesis “Older people
tend to buy fewer goods online”.
A question about education consisted of 5 answering options, comprising the most common
degrees in the Netherlands. The question about gender was dichotomous as well as the
question about car possession.
4.3 The Analysis As mentioned above, the data were analysed by the use of SPSS. First, the research sample
was viewed by descriptive analysis. Means were compared and conclusions about the
research sample could be drawn. Secondly, an analysis of the correlations and means was
done. Lastly, a multiple regression analysis was carried out. With this analysis, the
dependent variable could be predicted, based on the value of the independent or predictor
variables. (Field, 2005). Finally, an ordered logit regression was done as a robustness
check.
4.3.1 Cronbach’s Alpha
A Cronbach’s alpha method was used to test the reliability of the questions. After
completing this analysis, an alpha score was calculated. A score between 0.6 and 0.7 is
acceptable and a score above the 0.7 is good or excellent. Thus, these values confirm
the reliability of the questions. (Field, 2005).
In the questionnaire, some questions were split in a section about “search goods” and a
section about “experience goods”. For this analysis, the answers given for both kind of
goods will be considered as separate groups. The alpha score for search goods related
questions is more consistent than for the experience goods kind of questions. For search
goods, the alpha score for the question “please indicate whether you buy these products
online” is 0.701, which is excellent. For all other questions regarding search goods (visual
inspection, brand trust and sensory attributes), the alpha score is between 0.505 and 0.600,
which is acceptable. For experience goods the alpha score is less consistent.
Most of the questions have a score between 0.402 and 0.565.

27
For almost other questions (no split between search goods and experience goods), the alpha
score is acceptable at a level of 0.600. For questions using a 2-point scale (online vs. offline)
the Cronbach’s alpha score does not add any value. In conclusion, almost every question is
reliable with an alpha score around 0.600.

28
5. Results 5.1 Description of the sample In total, 105 respondents completed the survey. When missing values are taken into
account, a net sample of 103 respondents remains. Further details can be found in the
methodology section. For the analysis, respondents were included two times with respect
to both search and experience goods. This resulted in a sample size of N = 206. The
measurement unit in the correlational and regression analysis is “respondent per good”. A
deeper dive into the background characteristics of the 103 respondents, makes clear that
the sample is relatively diverse with respect to age. The average age centres around 38.4
years old (SD = 17.6). Slightly more females (56%) responded as opposed to males (44%).
More than 70% of the respondents were highly educated, holding a bachelor’s or master’s
degree. More details can be found in Appendix II.
5.2 Distribution of online and offline use In the previous paragraph the sample was characterized. Before discussing the correlations,
it is helpful to describe to what extent a respondent is likely to prefer the online channel as
opposed to offline. This is the dependent variable in the analysis, labelled as “use”. This
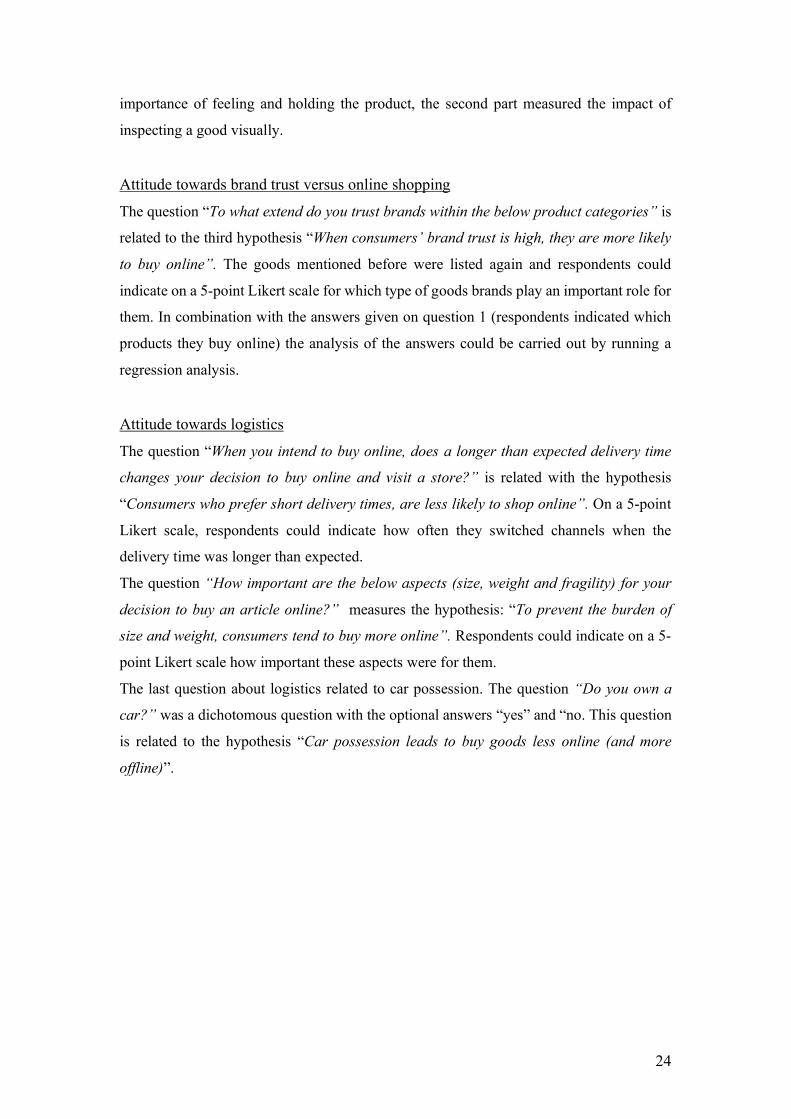
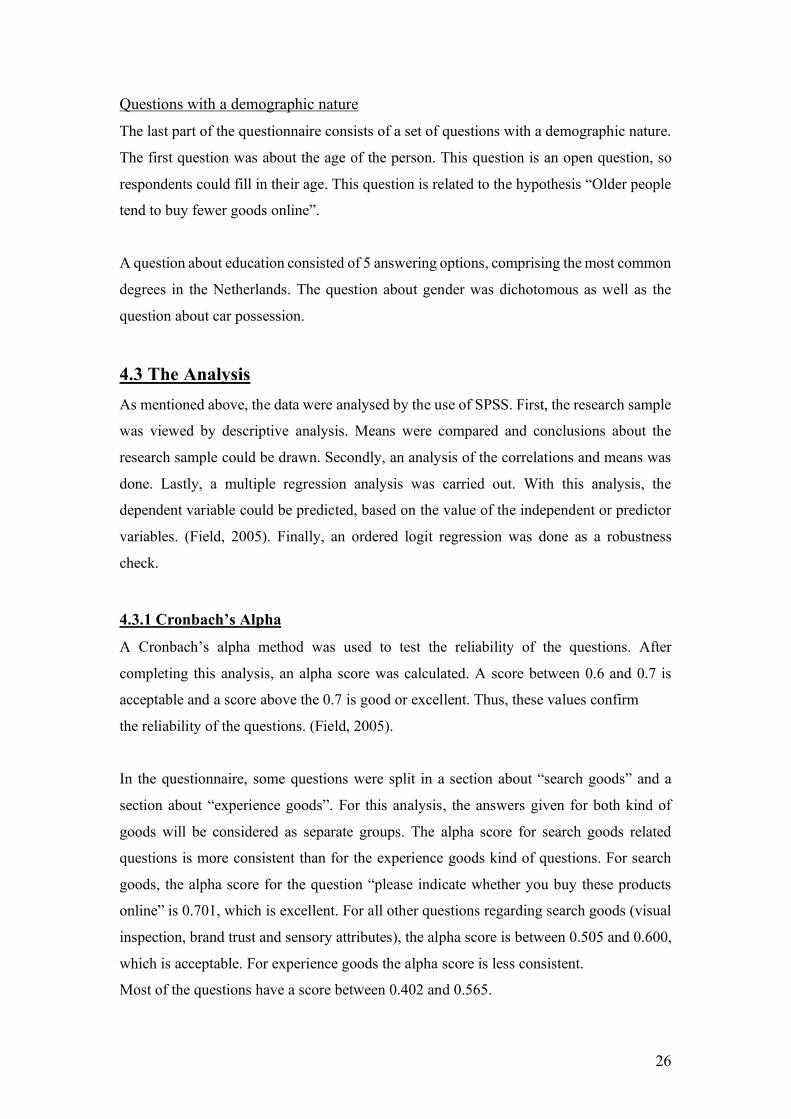
was measured on a 5-point scale. As shown in the two figures on the next page, the
distribution for search goods has more diversity than the distribution for experience goods.
For search goods, no obvious cut-off point exists to divide the variable in a dichotomous
offline/online use as opposed to a clear distinction with experience goods between
completely offline versus partly online.
29
Note: For clarity reasons, the distributions of online preference are shown above in two separate histograms, one for search goods.(N=103), and one for experience goods (N=103). In Appendix III a histogram for each individual product as well as a histogram for the combined results (N=206) can be viewed.
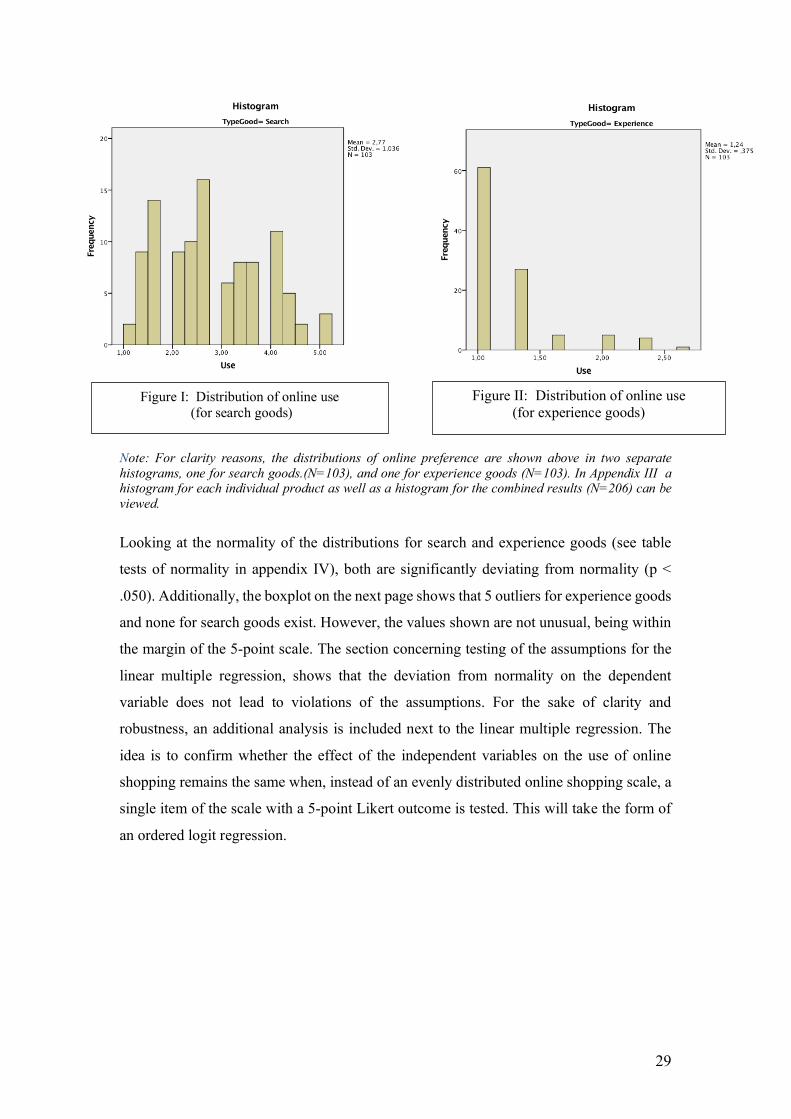
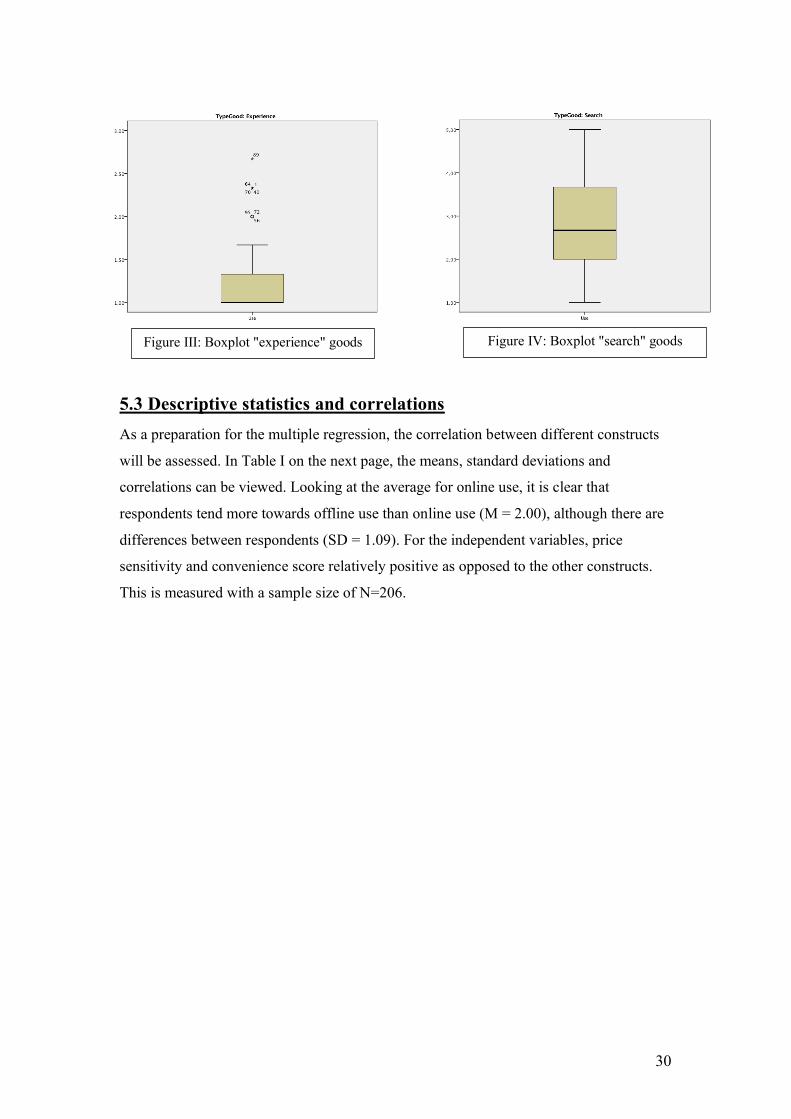
Looking at the normality of the distributions for search and experience goods (see table
tests of normality in appendix IV), both are significantly deviating from normality (p <
.050). Additionally, the boxplot on the next page shows that 5 outliers for experience goods
and none for search goods exist. However, the values shown are not unusual, being within
the margin of the 5-point scale. The section concerning testing of the assumptions for the
linear multiple regression, shows that the deviation from normality on the dependent
variable does not lead to violations of the assumptions. For the sake of clarity and
robustness, an additional analysis is included next to the linear multiple regression. The
idea is to confirm whether the effect of the independent variables on the use of online
shopping remains the same when, instead of an evenly distributed online shopping scale, a
single item of the scale with a 5-point Likert outcome is tested. This will take the form of
an ordered logit regression.
Figure I: Distribution of online use (for search goods)
Figure II: Distribution of online use (for experience goods)
30
5.3 Descriptive statistics and correlations As a preparation for the multiple regression, the correlation between different constructs
will be assessed. In Table I on the next page, the means, standard deviations and
correlations can be viewed. Looking at the average for online use, it is clear that
respondents tend more towards offline use than online use (M = 2.00), although there are
differences between respondents (SD = 1.09). For the independent variables, price
sensitivity and convenience score relatively positive as opposed to the other constructs.
This is measured with a sample size of N=206.
Figure III: Boxplot "experience" goods Figure IV: Boxplot "search" goods
31
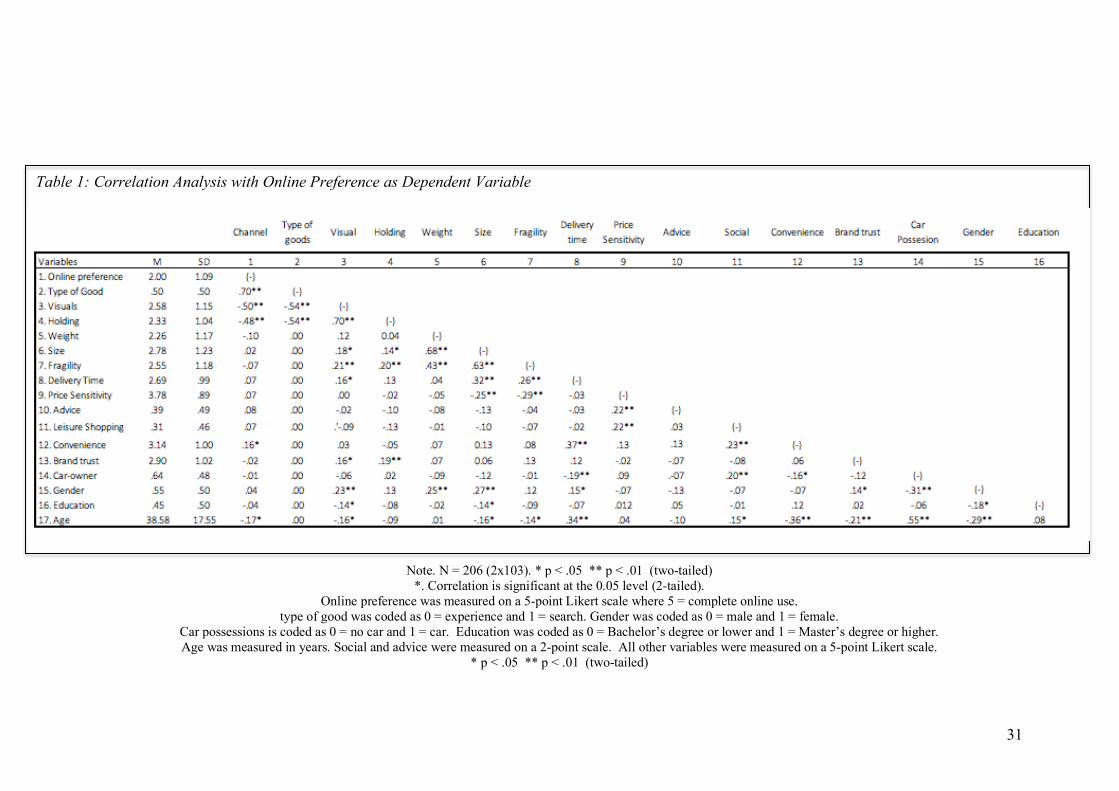
Note. N = 206 (2x10³). * p < .05 ** p < .01 (two-tailed) *. Correlation is significant at the 0.05 level (2-tailed).
Online preference was measured on a 5-point Likert scale where 5 = complete online use. type of good was coded as 0 = experience and 1 = search. Gender was coded as 0 = male and 1 = female.
Car possessions is coded as 0 = no car and 1 = car. Education was coded as 0 = Bachelor’s degree or lower and 1 = Master’s degree or higher. Age was measured in years. Social and advice were measured on a 2-point scale. All other variables were measured on a 5-point Likert scale.
* p < .05 ** p < .01 (two-tailed)
Table 1: Correlation Analysis with Online Preference as Dependent Variable

32
The most important and remarkable correlations will be explained. First of all, it is
important to look how the independent variables correlate with online use. This is the most
relevant variable because understanding the motivation for the choice of channel is the key
objective of this research. From all constructs, type of good has the strongest correlation
with online use (r = .70, p < .01). This means that search goods are bought more often
online than experience goods. Additionally, convenience (r = .16, p < .05) has a positive
correlation, which means that when a consumer is convenience oriented, more products
will be bought online than in a physical store.
Apart from these positive correlations, several negative correlations exist as well. The
constructs visual inspection (r = -.50, p < .01) and holding (r = -.48, p < .01) have a negative
correlation with online preference. This means that if a consumer wants to see and hold a
product, he or she tends to buy these products more often offline. Moreover, age has a
negative correlation with using online channel as well (r = -.17, p < .05). The older a person
is, the more often this person will tend to buy goods offline. Having now a clear image of
how the independent variables correlate with online preference, it is interesting to note that
visual inspection (r = -.54, p < .05) and holding (r = -.54, p < .05) have a negative correlation
with type of good. This shows that visual inspection and holding the product is less
important for search goods than for experience goods. When looked at the correlations
between the independent variables, there are no significant relations with a score above .70.
This indicates no multicollinearity in the linear multiple regression.
33
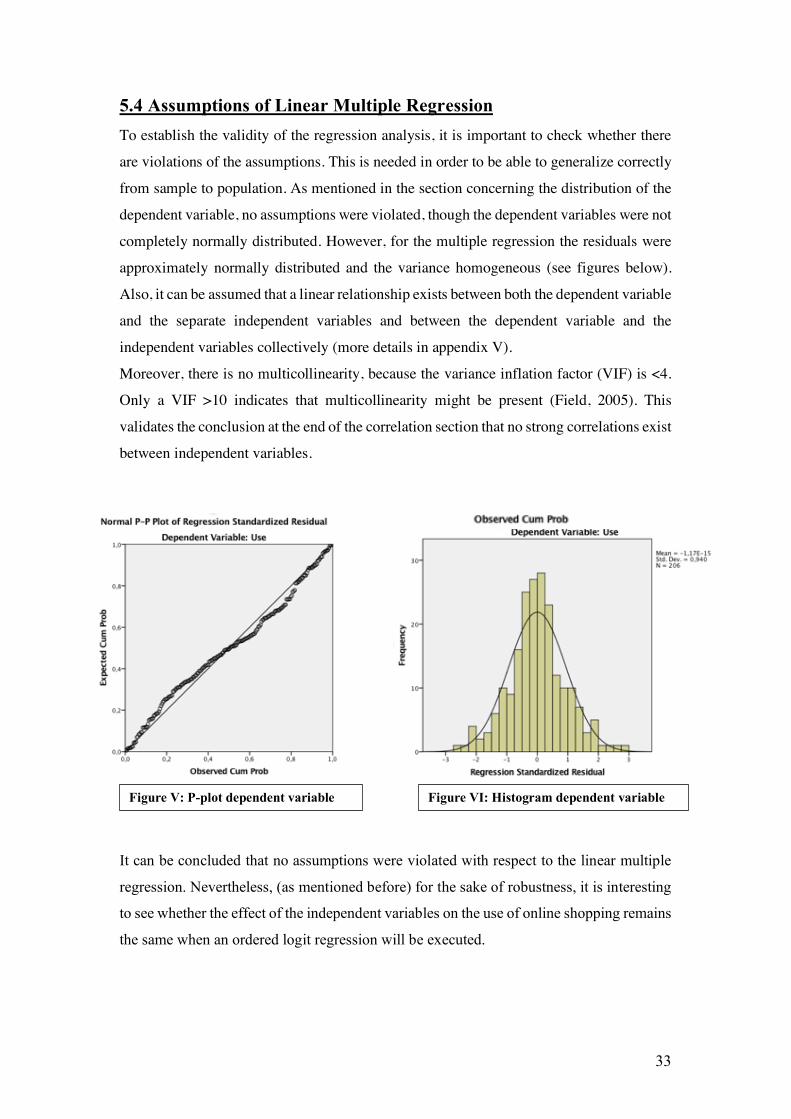
5.4 Assumptions of Linear Multiple Regression To establish the validity of the regression analysis, it is important to check whether there
are violations of the assumptions. This is needed in order to be able to generalize correctly
from sample to population. As mentioned in the section concerning the distribution of the
dependent variable, no assumptions were violated, though the dependent variables were not
completely normally distributed. However, for the multiple regression the residuals were
approximately normally distributed and the variance homogeneous (see figures below).
Also, it can be assumed that a linear relationship exists between both the dependent variable
and the separate independent variables and between the dependent variable and the
independent variables collectively (more details in appendix V).
Moreover, there is no multicollinearity, because the variance inflation factor (VIF) is <4.
Only a VIF >10 indicates that multicollinearity might be present (Field, 2005). This
validates the conclusion at the end of the correlation section that no strong correlations exist
between independent variables.
It can be concluded that no assumptions were violated with respect to the linear multiple
regression. Nevertheless, (as mentioned before) for the sake of robustness, it is interesting
to see whether the effect of the independent variables on the use of online shopping remains
the same when an ordered logit regression will be executed.
Figure V: P-plot dependent variable Figure VI: Histogram dependent variable

34
5.5 Linear Multiple Regression For the analysis, a hierarchical multiple regression was used. As control variables age and
the dummies car possession, education (1= highly educated) and gender (1= female) were
used. As moderators: trust, age, brand trust and car possession were included in the
regression. The results will be presented in accordance with the hypotheses. In table II the
results can be seen.

35
Table II. Hierarchical Regression Analysis with Online Preference as Dependent Variable n
Note. N = 206. * p < .05 ** p < .01 (two-tailed) Online use was measured on a 5-point Likert scale, on which 5 means complete online use. Type of good was coded as 0 = experience good and 1 = search good.
Gender was coded as 0 = male and 1 = female. Car possessions was coded as 0 = no car and 1 = car. Education was coded as 0 = Bachelor’s degree or lower and 1 = Master’s degree or higher. Age was measured in years. Social and advice were measured on a 2-point scale. All other variables were measured on a 5-point Likert scale.
Table II. Hierarchical Regression Analysis with Online Preference as Dependent Variable n

36
The hierarchical multiple regression consisted of three models. The first model, only
including control variables, was not significant (F = 1.92, p > .05). However, the second
model, with the direct effects included, was significant (F = 17.5, p < .01). The model fit
based on the adjusted R-square was .563, which means that 56.3% of the variation in online
preference could be explained by help of the direct effects only. The model with the
moderation was also significant (F= 13.3, p < .01) and could explain 59.0%. The individual
effects will be assessed based on the unstandardized and standardized beta coefficient in
Table II. This will be done in accordance with the hypotheses. The unstandardized
coefficient will be shown for significant effects to indicate the impact on online preference.
The standardized beta coefficient will be used to compare significant effects with each
other. The higher the absolute value of the beta coefficient, the stronger the effect (Field,
2005). Model 2 will be used to assess the direct effects without interactions. Model 3 will
only be used to evaluate moderating effects.
Below, the validation of the hypotheses will be discussed.
H1: Customers are more likely to shop online when they buy search goods instead
of experience goods.
Model 2 shows that the unstandardized beta for type of good regarding online preference
is 1.25, with a significance lower than .001 (B = 1.25, p < .001). This implies that for search
goods, respondents tend to score 1.25 points higher on online preference as opposed to
experience goods, confirmed by the highest relationship with online shopping when
controlling for all the other variables in the regression. Based on the standardized effect (β
= .572), the positive effect is stronger than the significant direct effects of age and visual.
All in all, H1 can be accepted based on this research.
H2: Consumers for whom assessing sensory attributes1 themselves is important,
are less likely to buy online.
Model 2 also makes clear that the unstandardized beta for visual is -.201 regarding online
preference with the significance of 0.003 (B =-2.01, p < .05). This implies a negative impact
of visual inspection on the attitude towards online shopping. If visual inspection is seen as
important, online shopping decreases with .0.211 point. Furthermore, visual inspection has
the second highest (after search goods) significant direct effect on online shopping (β = -
1 Consists of the aspects: visual and holding

37
.211). Another aspect of the sensory attributes is holding. The unstandardized beta for
holding is -.035 regarding online preference, which means that this variable is not
significant with a p-value of .638 (B= -.035, p > .05). All in all, H2 can be partially
accepted. While the visual aspect of the sensory attributes decreases the likelihood for
consumers to buy online, no significant difference exists for the aspect holding.
H3: When consumers’ brand trust is high, they are more likely to buy online.
Model 2 shows that the unstandardized beta for brand trust is .017 regarding online
shopping and the p-value of this variable is .738 (B= .017, p > .05). This implies that it
cannot be concluded that a significant difference exists. As a consequence, H3 will be
rejected.
H 4: Consumers who prefer short delivery times, are less likely to shop online.
In model 2, it can be seen that the unstandardized beta for delivery time is .023 regarding
online shopping and the p-value of this variable is .703 (B= .023, p > .05). This implies that
it cannot be concluded that a significant difference exists. H4 will be rejected.
H5: To prevent the burden of size and weight, consumers tend to buy more online.
Model 2 shows, regarding online, an unstandardized beta for size of .077 and the p-value
is .281 (B= .077, p > .05). This implies no significant difference. The unstandardized beta
for weight is .000 and the p-value is .998 (B= .000, p > .05). As a
Consequence, h5 will be rejected.
H 6: Car possession leads to buy goods less online (and more offline).
Model 2 shows that the unstandardized beta for car-possession is .317 regarding online
preference with the significance of .019 (B = .317, p < .05).
This implies a positive effect of owning a car on the attitude towards online shopping. If
car possession is increased by one unit, online shopping increases by .317 points on the 5-
point Likert scale. This is unexpected, because the hypothesis suggested a tendency to shop
more offline when a car is possessed. As a consequence, H6 will rejected.
H 7: If price sensitivity is high, consumers are more likely to buy online.
As model 2 shows, the unstandardized beta for price sensitivity is .032 regarding online
preference. The p-value of price sensitivity is .616 (B= .032, p > .05). This indicates no
significant effect on price sensitivity. As a consequence, H7 will rejected.

38
H 8: The main effect between price sensitivity and online shopping, is impacted by
the level of net income per month. As mentioned, income is a complex variable because eight missed values (no answer
submitted by the respondents). As a robustness check, the regression is repeated with
income included. When income is added, the total amount of respondents decreases to
N=95. As the regression shows in appendix VI, income has no significant direct effect and
the moderation income*price sensitivity is not significant either (B = -.212, p= .110). As a
result, H8 will be rejected.
H9: Need for advice on a specific good or service, decreases the likelihood to buy
online. Model 2 shows that the unstandardized beta for advice is .140 regarding online shopping.
The p-value of advice is .205. (B = .140, p > .05). This means no significant effect on
advice. As a result, H9 will be rejected.
H10: The tendency to enjoy shopping has a negative effect on online shopping. In model 2 can be observed that the unstandardized beta for leisure shopping is .073
regarding online shopping and that the p-value .539 is (B= .073, p > .05). This implies that
no significant effect exists. As a consequence, H10 will be rejected.
H11: Consumers who are in need for more convenience are likely to buy online.
In model 2 is shown that the unstandardized beta for convenience is .107 regarding online
shopping and the p-value of this variable is .091 (B= .107, p > .05). This indicates a not
significant difference. However, when a significance level of p <.10 was used, the
convenience variable was significant. To stay consistent, a p-value of .05 is used and H11
will rejected, but we can observe that this variable is close to a significant difference.
39
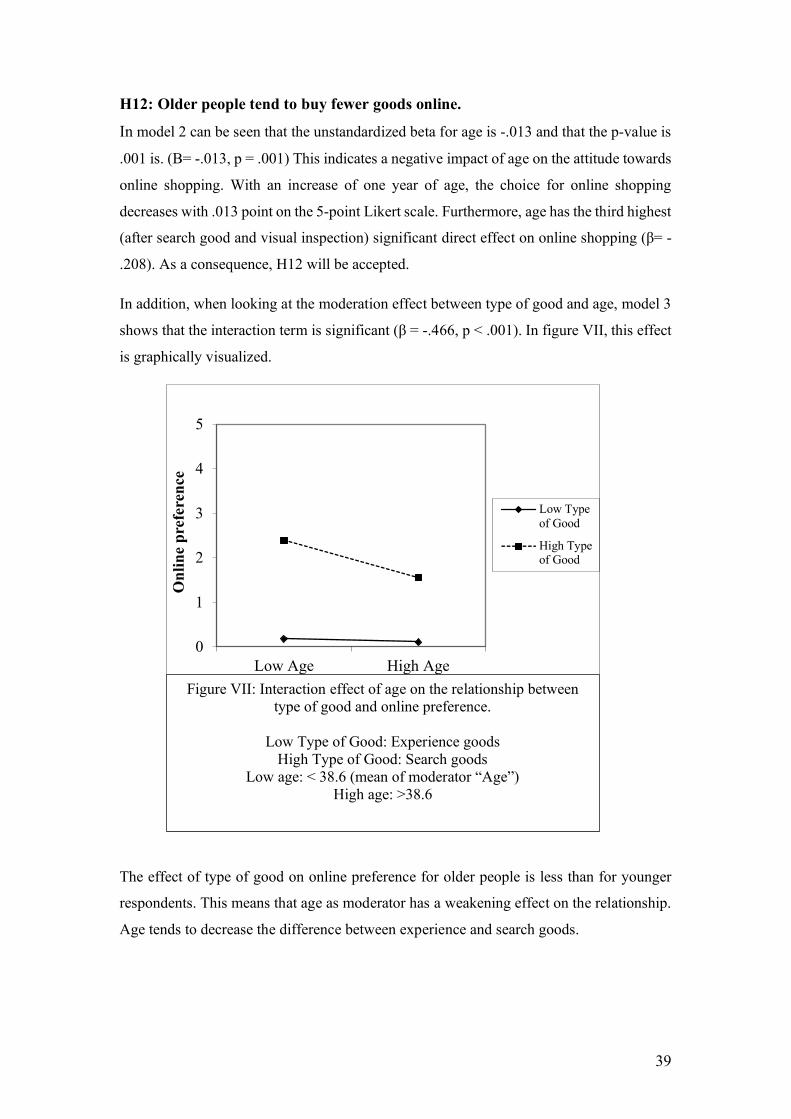
H12: Older people tend to buy fewer goods online.
In model 2 can be seen that the unstandardized beta for age is -.013 and that the p-value is
.001 is. (B= -.013, p = .001) This indicates a negative impact of age on the attitude towards
online shopping. With an increase of one year of age, the choice for online shopping
decreases with .013 point on the 5-point Likert scale. Furthermore, age has the third highest
(after search good and visual inspection) significant direct effect on online shopping (β= -
.208). As a consequence, H12 will be accepted.
In addition, when looking at the moderation effect between type of good and age, model 3
shows that the interaction term is significant (β = -.466, p < .001). In figure VII, this effect
is graphically visualized.
The effect of type of good on online preference for older people is less than for younger
respondents. This means that age as moderator has a weakening effect on the relationship.
Age tends to decrease the difference between experience and search goods.
Figure VII: Interaction effect of age on the relationship between type of good and online preference.
Low Type of Good: Experience goods
High Type of Good: Search goods Low age: < 38.6 (mean of moderator “Age”)
High age: >38.6
0
1
2
3
4
5
Low Age High Age
Onl
ine
pref
eren
ce
Low Typeof Good
High Typeof Good

40
5.6 Ordered Logit Regression as a Robustness Check As mentioned in the section regarding the assumptions of the regression, the outcomes of
the linear multiple regression will be validated by means of an ordered logit regression.
The idea is to confirm whether the effect of the independent variables on the use of online
shopping remains the same, when, instead of an evenly distributed online shopping scale,
a single item of the scale with a 5-point Likert outcome is tested. This approach is used as
a robustness check, even though the assumptions of the linear regression were not violated,
because the ratio of online and offline shopping appears to differ between the products that
were presented to the respondents.
5.6.1 The Methodology
As mentioned in the methodology, questions concerning online or offline purchasing were
related to both “search goods” and “experience goods”. In this robustness check, the
answers on the first question of the questionnaire were analysed. This question consisted
of three items regarding the online purchase of experience goods and three items on the
online purchase of search goods. While for the main analysis a scale score is calculated
using all three items that were used as a dependent variable, an ordered logit regression is
subsequently performed with the respondents’ answer to only one of these items. The item
selected for the analysis, is chosen randomly per respondent, based on the respondent
number.
Thereafter, an ordered logit regression has been performed. In this analysis, the dependent
variable varied from (1) never to (5) always. The same control and independent variables
as in the main multiple regression analysis were used in the model.
5.6.2 The Results
The model fit, based on the Nagelkerke pseudo R2 is .542. The Nagelkerke's R squared
defines the power of explanation of the model (Nagelkerke, 1991).
Furthermore, the outcomes of the ordinal logit regression mainly confirm the results that
have been found in the multiple regression. This means specifically that a significant effect
has been found for type of good, where higher levels of online shopping were reported for
search goods than for experience goods (b=-7.23, p<.001), and for age, the older a person
is, the lower the frequency of online shopping (b=-.04, p=.003).

41
Also the interaction effect of type of goods * age was confirmed, (b= .05, p= .009). The
results of the main analysis are therefore double-checked and validated. The SPSS output
of the ordered logistic regression can be consulted in appendix VII.
For visual clarity, the conceptual model (with rejected and accepted hypotheses) will be
shown on the next page.

42
5.7 Conceptual Model Outcomes

43
6. Conclusion The results from the research provide a helpful insight to understand consumers’ opinion
towards shopping offline and shopping online. The outcomes regarding the hypotheses that
were researched will now be discussed. The hypotheses that have been accepted were
related to type of goods, visual inspection and age. Also, an evident moderation effect exists
between type of good*age.
A clear different channel preference exists among the respondents when it comes to
whether a good is an experience good or a search good. In case of a search good, consumers
are more likely to buy online. Search goods are those products that consumers can search,
inspect and compare (search behaviours) prior to the purchasing (Nelson, 1970). Easier
said, search goods can relatively easy be assessed without having the good “in hand”. This
implies that consumers tend more to buy these goods online, resulting in a 1.25 higher score
on the 5-point Likert scale.
On the hypothesis related to visual inspection, the research measured a significant negative
impact of visual inspection on the willingness to buy online. The higher respondents rated
the need for visual inspection, the less preference they had for shopping online. Interesting
enough, no significance was found for the variable “holding” in relation to online shopping.
It seems that consumers experience a barrier for online shopping if they can’t visually
inspect the good and see less issues if they cannot hold the good in their hands. This implies
that not every sensory attribute has the same impact on the (non) preference for online
shopping.
The age of a person plays a significant role in the choice for a preferred channel. The older
a person, the less he or she tends to buy goods online. This counts for both type of goods.
This is different for younger people, where a clear distinction exists between the type of
goods. In addition to their overall more positive attitude towards online channel, they tend
to prefer the online channel more for search goods than for experience.
It cannot be concluded that the need for convenience drives consumers towards online
shopping. Using a p-value of <. 05, the hypothesis is rejected, although convenience has a
positive correlation with a preference to shop online.
Moreover, if a p-value of < .10 was used, a significant effect between convenience and
online preference would have been accepted.

44
A significant relation of possessing a car and preference for shopping offline does not exist.
In contrary, people owning a car effectively tend to shop more online than people without
a car. It seems that the convenience of a car doesn’t help to overcome the burden of taking
goods home instead of having them delivered. A possible explanation could be that
respondents with a car live more outside city centres and respondents without a car live
nearer to city centres and shop facilities. This could implicate that non-car owners tend to
shop easier and more offline (around the corner) than car owners, who still need to travel
if they want to buy their goods in a physical shop.
No significant effect could be assessed between weight, size, price sensitivity and a
preference for online shopping. With regards to a preference for offline shopping, no
significant effect was measured for the variables “need for advice” and “leisure shopping”.
Based on above, it could be discussed whether a research that questions people on their
buying behaviour (channel choice) allows respondents to provide answers with some
desired behaviour. This phenomenon will be further discussed below.

45
7. Discussion 7.1 Managerial implication The research has resulted in some expected and some unexpected outcomes. Both type of
outcomes give some insightful information and can be of value for e-tailers as well as
retailers. Some hypotheses were inspired by what nowadays is broadly expected as
common thinking by consumers, press and possibly as well by entrepreneurs in the
commercial world. This means that some conclusions will be seen as confirmation of what
was already known or believed, like the fact that older people tend to shop less online.
Other information might actually challenge current beliefs, like the research outcome about
the impact of owning a car on the channel choice and the outcome that need for advice does
not lead consumers to one specific channel (the physical store). Both the expected- and not
expected findings from the research might help managers to make better decisions in e-
commerce and retailing. The findings generated from the research could lead to the
following managerial implications.
Although e-commerce has made a huge step forward during the last decade, resulting in
more than 20% of goods being bought from online shops, the potential growth is still bigger
than the current share of market. Based on this research e-tailers could consider to
implement the advices given below, to accelerate their growth:
- E-commerce seems better positioned to attract younger people when it comes to search
goods. On the other hand, younger people still seem to consider offline shopping for buying
experience goods. The reasons are evident. Currently, web technology doesn’t allow
consumers a similar experience as offline. But new technologies, like virtual reality and
augmented reality, will help to close the “experience gap” between on- and offline
shopping. Two of the most important e-commerce channels online, Google and Facebook,
are already testing with new virtual experiences to minimalize the uncertainty of shoppers
when buying online. For example: Google distributing ‘Google Cardboards’ for free is
clearly a way to introduce a new experience in online shopping to the world.
- On the other hand, retailers should be aware of the fact that older people tend to prefer to
shop offline, possibly due to their lack of knowledge and flexibility to change over to online
shopping. But in the next 10-15 years, the next generation of older people will be as
comfortable as younger people to shop online. What can retailers do to optimize their

46
proposition, in order to be and stay attractive for current and future older shoppers. Should
they offer private parking facilities or an even better experience than webshops can?
Whatever retailers invent, it is clear that only standing still will not be a successful strategy
for the future.
This research showed that currently the respondents of this research are still undecided on
many aspects that define their channel choice. And maybe, the distinction between both
channels is not so completely “black and white”. In the end, the “battle” between online
and offline might not be a decisive fight. Instead of being either an online e-tailer or an
offline retailer, entrepreneurs should consider to connect their offline shops (brick-and-
mortar shops) with their online e-commerce shop. How can they create synergy between
both worlds and create an ‘omnichannel’ customer experience, independent of what type
of shop the customers visits? One great example in this light is Coolblue, a Dutch online
retailer, that started as a pure online player and is expanding the business to brick-and-
mortar shops in the big cities to give their customers a unique omnichannel customer
experience, both online and offline.
7.2 Limitations During the implementation of this research some questions came across the table that
should been given some thoughts. Could the design of the research be optimized? Were the
questions raised in a way that the given answers gave the best possible insight in the
consumers behaviour? Below some considerations regarding these topics.
The research has been exposed to respondents only living in the Netherlands. Conclusions
should be limited to the specific situation in the Netherlands, although for countries that
are more or less comparable with the Netherlands (e.g. Internet penetration, e-commerce
development), learnings from this research could be interesting.
By hindsight, instead of measuring the relation between variables and channel choice
through a question, respondents should have been exposed to more unambiguous questions.
Answers on these kind of questions might have helped to better test the hypotheses. For
example, the question on price sensitivity should have been “are you sensitive for price
differences?” In addition, the question on leisure shopping should have been formulated
as: “Is leisure shopping important to you?”

47
As mentioned, during this research respondents have been questioned about their
behaviour. Although it is expected that respondents have submitted answers that reflect
their actual behaviour, it cannot be neglected that some answers might reflect more their
desired behaviour than their actual behaviour. As (Bertrand et al, 2001) explained:
“Respondents want to avoid looking bad in front of the interviewer”. Additional they stated:
“A profound problem is that people may often be wrong about their “attitudes”. People
may not really be good at forecasting their behaviour or understanding why they did what
they did”. To neutralize the difference between what consumers say and what they actually
do, a research method that measures actual consumer behaviour would diminish this
possible bias. Below a research design will be proposed that measures real consumer
behaviour, and thus solving bias.

48
7.3 Further research 7.3.1 Multiple country research As mentioned, this research has helped to understand better how Dutch consumers decide
to buy their goods either offline or online. As raised before, to what extend do these findings
count for consumers in other countries as well? To answer this question further research in
other countries could be considered.
7.3.2 Behaviour and motivational research
Above, it was discussed whether the answers given by respondents, reflected well enough
their actual behaviour. A suggestion was made to set up a research that would track actual
behaviour instead of indicated behaviour. For example, a research that follows consumers
on their consumer journey, both online as offline. As methods to track online behaviour
already exists (e.g. Google Analytics), the main challenge is how to track consumers’
offline behaviour and to understand their motivations. A possible research set up could be
to run one-to-one depth interviews after the respondents have bought a certain good and
learn more about their motivations during the consumer journey. Did they search on the
web, and why or why not? Did they visit stores and for what reason? What was the main
reason for buying the good online or offline? Specifically, the answers on the why will give
more in-depth knowledge on what the factors are that influence the preference for a specific
channel.
7.3.3 Demographic segmentation
The outcomes from this research give an insight about the “average Dutch” consumer, with
some additional information about the impact of age, education and income on their
preferred channel choice. Additional research could dive deeper into other demographic
differences like, urbanites versus rural, household composition and
This could result in the description of some specific consumer segments like “the young
urban professional who has a strong preference for convenience shopping” or “the rural
living couple with two kids, who are very sensitive to shop for the lowest price”. Like
(Lilien & Rangaswamy, 2003) stated: “Effective segmentation is essential for marketing
success. And as (Andrews & Currim, 2003) stated: “Segments based on household
characteristics can then be examined to determine whether they differ in terms of
preferences and purchase behaviours, and if so, products and marketing efforts can be
designed and targeted to selected groups”.

49
Once, the consumer segmentation has been executed, and consumer segments are clear
both e-tailers and retailers could start to develop specific propositions (e.g. “home delivered
at your convenience time” and “take home for the lowest price)” to optimally fulfil the
needs of specific consumer segments.

50
8. References to relevant literature Alice A. Wright and John G. Lynch, Jr. (1995). Communication Effects of Advertising
Versus Direct Experience When Both and Search and Experience Attributes are
present. Journal of Consumer Research. 21 (4) 708-718.
Andrews, I. S. (2003). Recovering and profiling the true segmentation structure in
markets: an empirical investigation. International Journal of Research in
Marketing. 20 (2), 177-192.
https://www.sciencedirect.com/science/article/abs/pii/S016781160300017X
Babin J, William R. Griffin D, Griffin M. (1994). work and/or fun: Measuring Hedonic
and Utilitarian Shopping Value. Journal of Consumer Research 20 (4), 644-656.
https://www.jstor.org/stable/2489765?seq=1#page_scan_tab_contents
Bakos J.Y. (1997). Reducing buyer search costs, implications for electronic
marketplaces. Management Science. 43 (12).
https://pubsonline.informs.org/doi/10.1287/mnsc.43.12.1676
Bowling A. (1997). Research methods in Health. (4th ed.) London: Open University
Press.
Beemster R. (2017). Online consument gebruikt vaker mobiel en koopt vaker bij
buitenlandse webshops. Shopping Tomorrow, GFK. Retrieved from
https://www.adformatie.nl/commerce/online-consument-gebruikt-vaker-mobiel-en-
koopt-ook-vaker-bij
Central Bureau for statistics (2018). Nederland koploper in Europa met
internettoegang. Retrieved from https://www.cbs.nl/nl-
nl/nieuws/2018/05/nederland-koploper-in-europa-met-internettoegang.
Central Bureau for statistics (2018). Maatschappij verkeer en Vervoer. Retrieved from
https://www.cbs.nl/nl-nl/maatschappij/verkeer-en-vervoer/transport-en-
mobiliteit/infra-vervoermiddelen/vervoermiddelen/categorie-
vervoermiddelen/personenauto-s

51
Central Bureau for statistics (2017). Booschappen steeds vaker online gedaan.
Retrieved from https://www.cbs.nl/nl-nl/nieuws/2017/47/boodschappen-steeds-
vaker-online-gedaan
Chang K.P, Dholakia R.R. (2003). Factors Driving Consumer Intention to Shop Online:
An Empirical Investigation. Journal of Consumer Psychology. 13(1-2), 177-183.
https://www.sciencedirect.com/science/article/abs/pii/S1057740803701879
Czara, S.J., Hammond, K., Blascovich, J.J. and Swede, H. (2009). Age related differences
in learning to use a text-editing system. Behavior and Information Technology. 8
(4) 309-319. https://www.tandfonline.com/doi/abs/10.1080/01449298908914562
Darby M.R., Karni, E., (1973). Free competition and the optimal amount of fraud.
Journal of Law and Economics, 16 (1), 67-88.
https://www.journals.uchicago.edu/doi/10.1086/466756
Degeratu M, Rangaswamy A.& Wu J. (2000). Consumer choice behaviour in online and
traditional supermarkets: The effects of brand name, price, and other search
attributes. International Journal of Research In Marketing. 17(1), 55-78.
https://www.sciencedirect.com/science/article/abs/pii/S0167811600000057
Dellaert Benedict G.C., Lindberg K (2010). Variations in Tourist Price Sensitivity: A
Stated Preference Model to Capture the Joint Impact of Differences in Systematic
Utility and Response Consistency. Leisure Sciences. 25 (1), 81-96.
https://www.tandfonline.com/doi/abs/10.1080/01490400306557.
Field, A. (2005). Discovering statistics using SPSS. (1e ed.) London: SAGE Publications.
Gillen D, Mantin B, (2008). Price volatility in the airline markets. Transportation
Research Part E. 45 (5), 693-107. https://www-sciencedirect-
com.eur.idm.oclc.org/science/article/pii/S1366554509000490.
Girard T, Korgaonkar P, Silverblatt R.(2003). Relationship of type of product, shopping
orientations, and demographics with preference for shopping on the internet.
Journal of Business and Psychology. 18(1), 101-120.

52
https://link.springer.com/article/10.1023/A:1025087021768
Goodman, L. A. (1961). Snowball sampling. The Annals of Mathematical Statistics. 32
(1), 148-170. https://doi.org/10.1214/aoms/1177705148
https://www.jstor.org/stable/2489726?seq=1#page_scan_tab_contents.
J. Philip. Trocchia, Swinder Janda, (2000). A phenomenological investigation of Internet
usage among older individuals., Journal of Consumer Marketing.
17 (7), 605-616.
https://www.emeraldinsight.com/doi/abs/10.1108/07363760010357804.
Jon A. Krosnick, Presser S (2010). Question and Questionnaire Design. Handbook of
Survey Research. (2), 263-313.
https://web.stanford.edu/dept/communication/faculty/krosnick/docs/2009/2009_han
dbook_krosnick.pdf.
Kollmann T, Kuckertz A, Kayser I. (2012). Cannibalization or synergy? Consumers’
channel selection in online–offline multichannel systems. Journal of Retailing and
Consumers Services. 19 (2), 186-194.
https://www.sciencedirect.com/science/article/pii/S0969698911001238
Kut. C. So, Jing-Sheng Song. (1998). Price, delivery time guarantees and capacity
selection. European Journal of operational Research. 111 (6), 28-49. https://www-
sciencedirect-com.eur.idm.oclc.org/science/article/abs/pii/S0377221797003147.
Lilien, G., & Rangaswamy, A. (2003). Marketing engineering: computer-assisted
marketing analysis and planning. (3rd ed.). Upper Saddle River, New Jersey:
Prentice Hall.
Marianne Betrand & Sendhil Mullainathan. (2001). Do people mean what they say?
Implications for subjective survey data. Journal of American Economic Review. 91
(2), 67-72. https://www.psychologytoday.com/us/blog/understand-other-
people/201607/say-what-you-mean-mean-what-you-say.

53
Mitykoa D.S.V, Teiua C. (2012). “Product perception in the case of frequent online
buyers empirical evidence. Procedia Econimics And Finance 3 (22), 343-349.
https://ac.els-cdn.com
Nagelkerke N.J.D. (1991) A note on a general definition of the coefficient of
determination. Biometrika Trust. 78 (3). 691-692.
https://www.cesarzamudio.com/uploads/1/7/9/1/17916581/nagelkerke_n.j.d._1991
_-_a_note_on_a_general_definition_of_the_coefficient_of_determination.pdf.
Nelson P. (1970). “Information and consumer behaviour”. Journal of Political Economy.
78( 2), 311-329.
https://www.journals.uchicago.edu/doi/abs/10.1086/259630?journalCode=jpe
Rohm A.J & Swaminathan V. (2004).
A typology of online shoppers based on shopping
motivations. Journal of Business Research. 57 (7), 748-757.
https://www.sciencedirect.com/science/article/abs/pii/S014829630200351X
So Jiuan Tan, (1999). Stategies for reducing consumers’ risk aversion in Internet
shopping. Journal of consumer marketing. 16 (2), 163-180.
https://www.emeraldinsight.com/doi/abs/10.1108/07363769910260515
Wan Y, Nakayama M, Sutcliffe N (2010), The impact of age and shopping experiences
on the classification of search, experience, and credence goods in online shopping.
Information Systems & e-business Management. 10 (1), 135-148.
https://web.b.ebscohost.com

54
Appendixes
I: Survey channel preferences

55

56

57

58
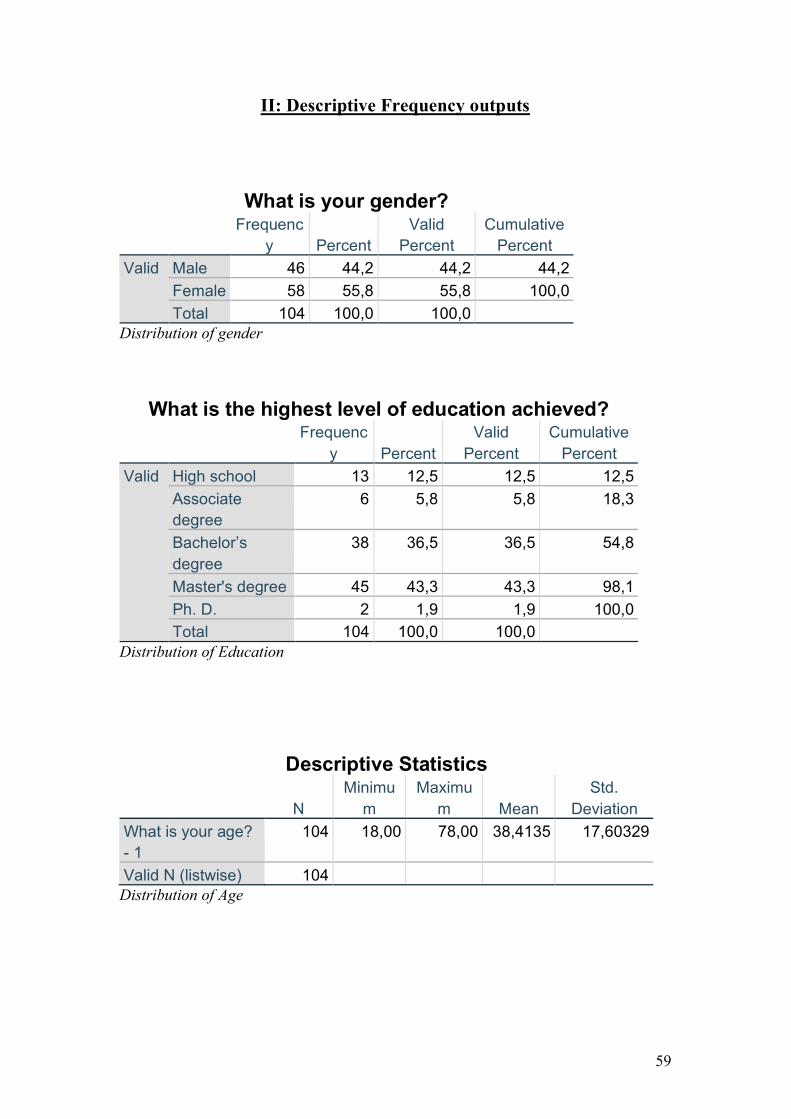
59
II: Descriptive Frequency outputs
What is your gender?
Frequenc
y Percent Valid
Percent Cumulative
Percent Valid Male 46 44,2 44,2 44,2
Female 58 55,8 55,8 100,0 Total 104 100,0 100,0
Distribution of gender
What is the highest level of education achieved?
Frequenc
y Percent Valid
Percent Cumulative
Percent Valid High school 13 12,5 12,5 12,5
Associate degree
6 5,8 5,8 18,3
Bachelor’s degree
38 36,5 36,5 54,8
Master's degree 45 43,3 43,3 98,1 Ph. D. 2 1,9 1,9 100,0 Total 104 100,0 100,0
Distribution of Education
Descriptive Statistics
N Minimu
m Maximu
m Mean Std.
Deviation What is your age? - 1
104 18,00 78,00 38,4135 17,60329
Valid N (listwise) 104 Distribution of Age
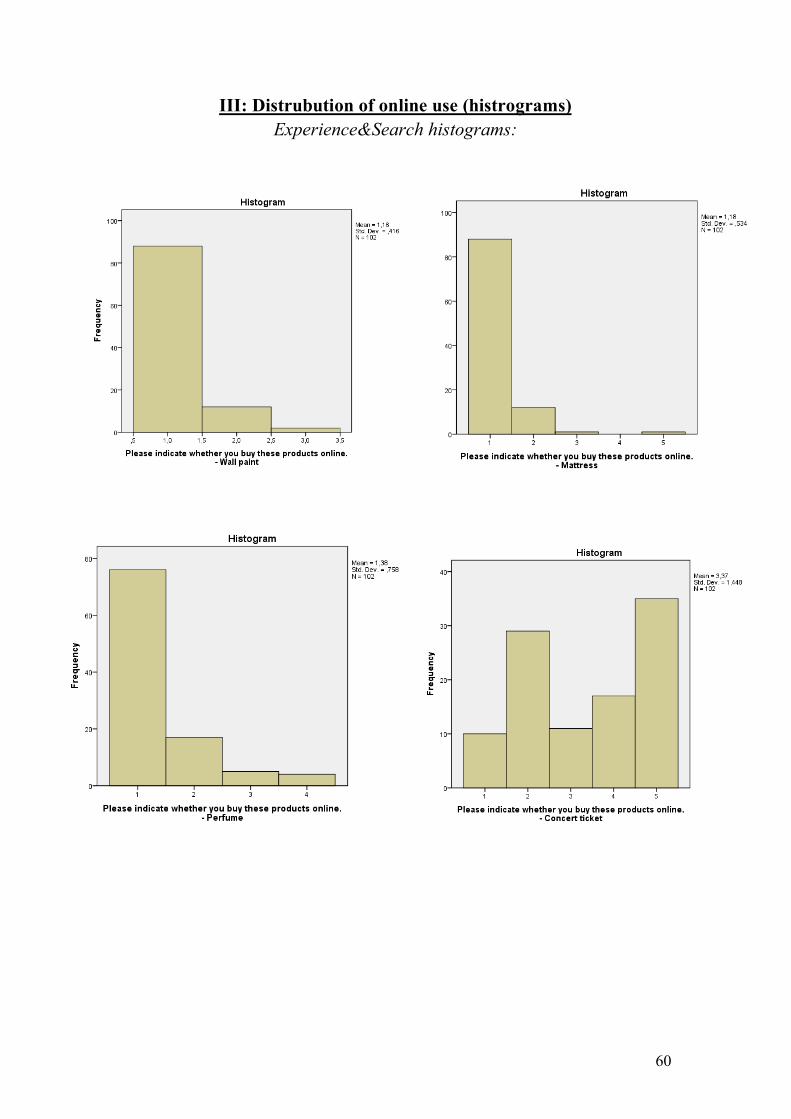
60
III: Distrubution of online use (histrograms) Experience&Search histograms:

61
Histrogram Search & Experience Combined

62
IV: Output tests of normality
Tests of Normality
TypeGood Kolmogorov-Smirnova Shapiro-Wilk
Statistic df Sig. Statistic df Sig. Experience
Use ,327 103 ,000 ,668 103 ,000
Search Use ,121 103 ,001 ,955 103 ,001 Tests of normality

63
V: Partial Plots & Residual plot

64
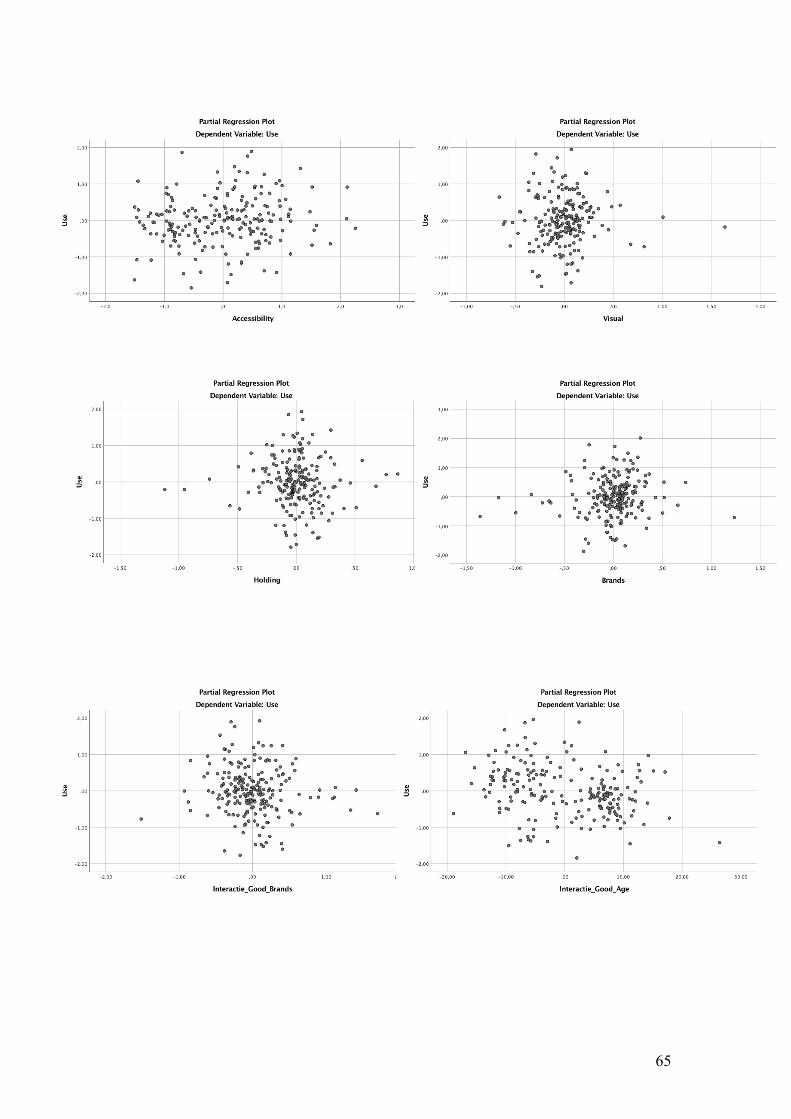
65
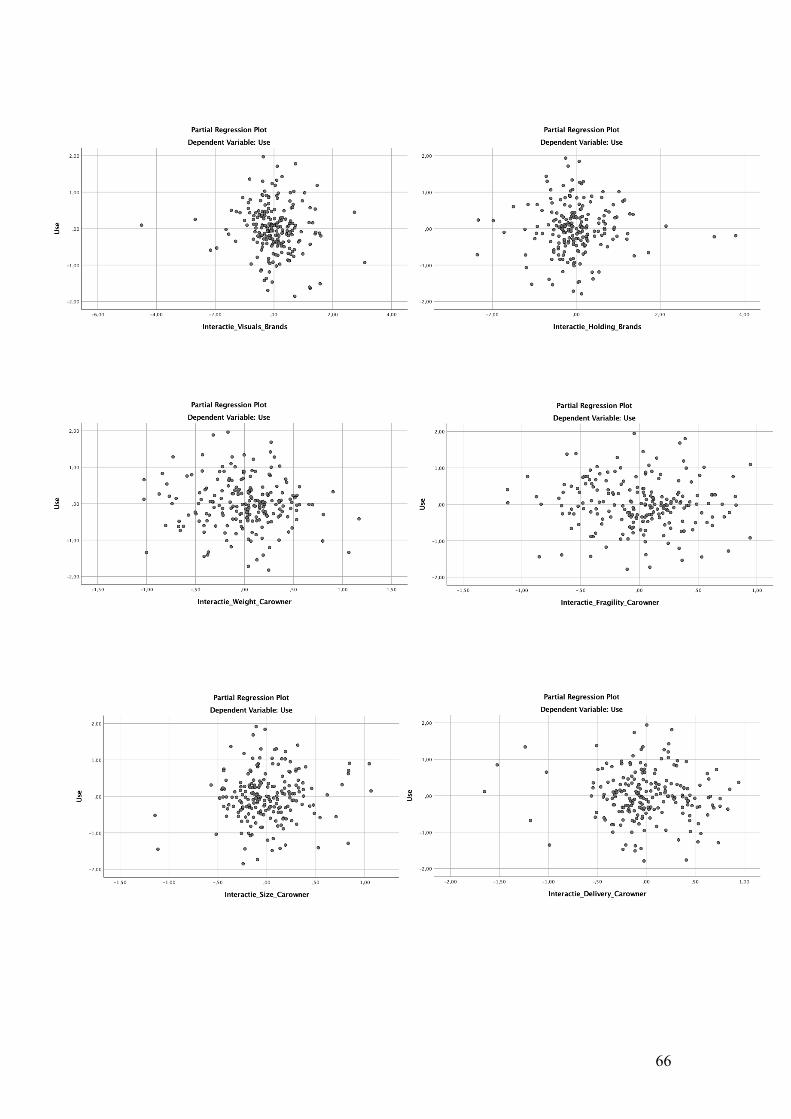
66

67

68
VI: Multiple Regression included Income
Excluded Variablesa
Model Beta In t Sig. Partial
Correlation
Collinearity Statistics
Tolerance VIF Minimum Tolerance
1 TypeofGood ,721b 14,778 ,000 ,738 1,000 1,000 ,588 OnlineSocial_Dummy ,074b ,998 ,320 ,074 ,953 1,049 ,577 OnlineAdvice_dummy ,077b 1,039 ,300 ,077 ,955 1,048 ,588 Delivery_time -,012b -,149 ,882 -,011 ,866 1,155 ,562 Object_Weight ,001b ,013 ,989 ,001 ,872 1,147 ,562 Object_Fragility -,083b -1,112 ,268 -,082 ,938 1,066 ,576 Object_Size -,014b -,184 ,854 -,014 ,855 1,170 ,566 Sensitivity ,090b 1,244 ,215 ,092 ,987 1,013 ,584 Accessibility ,122b 1,539 ,125 ,113 ,827 1,210 ,535 Visual -,590b -9,379 ,000 -,570 ,892 1,121 ,583 Holding -,537b -8,475 ,000 -,531 ,933 1,072 ,580 Brands -,061b -,817 ,415 -,060 ,948 1,055 ,588 Interactie_Good_Brands
,623b 11,057 ,000 ,633 ,985 1,015 ,588
Interactie_Good_Age ,623b 9,818 ,000 ,587 ,851 1,175 ,558
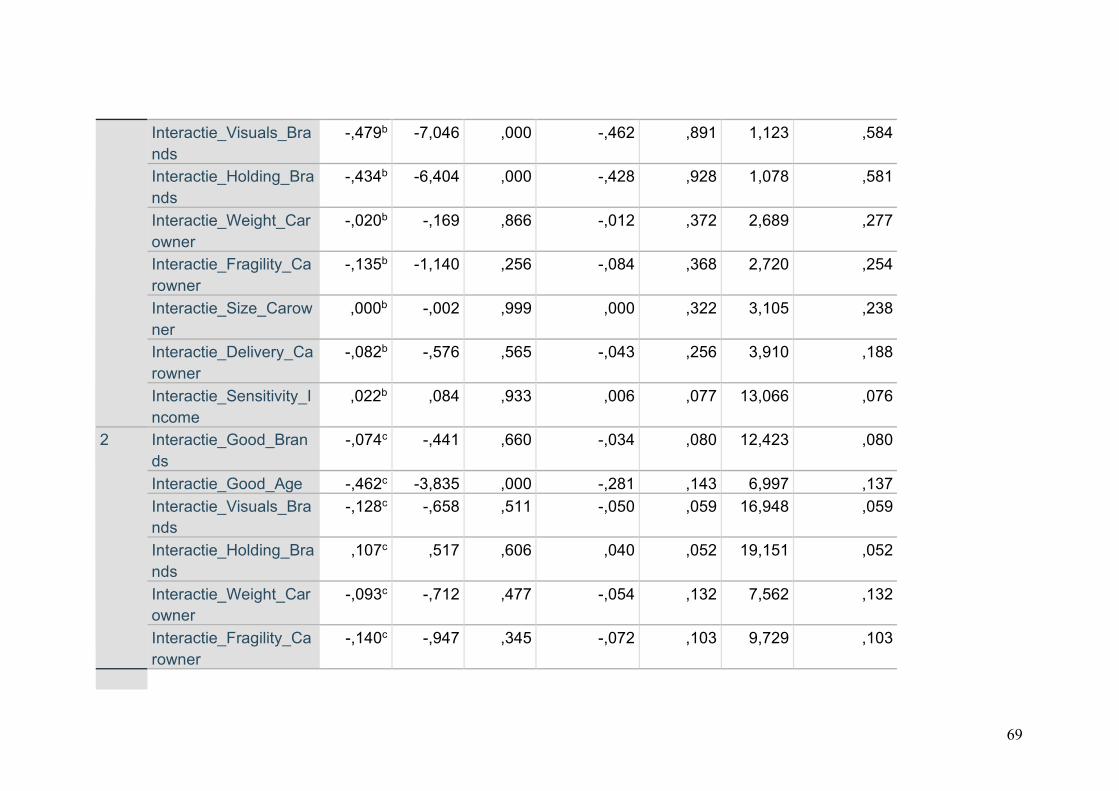
69
Interactie_Visuals_Brands
-,479b -7,046 ,000 -,462 ,891 1,123 ,584
Interactie_Holding_Brands
-,434b -6,404 ,000 -,428 ,928 1,078 ,581
Interactie_Weight_Carowner
-,020b -,169 ,866 -,012 ,372 2,689 ,277
Interactie_Fragility_Carowner
-,135b -1,140 ,256 -,084 ,368 2,720 ,254
Interactie_Size_Carowner
,000b -,002 ,999 ,000 ,322 3,105 ,238
Interactie_Delivery_Carowner
-,082b -,576 ,565 -,043 ,256 3,910 ,188
Interactie_Sensitivity_Income
,022b ,084 ,933 ,006 ,077 13,066 ,076
2 Interactie_Good_Brands
-,074c -,441 ,660 -,034 ,080 12,423 ,080
Interactie_Good_Age -,462c -3,835 ,000 -,281 ,143 6,997 ,137 Interactie_Visuals_Brands
-,128c -,658 ,511 -,050 ,059 16,948 ,059
Interactie_Holding_Brands
,107c ,517 ,606 ,040 ,052 19,151 ,052
Interactie_Weight_Carowner
-,093c -,712 ,477 -,054 ,132 7,562 ,132
Interactie_Fragility_Carowner
-,140c -,947 ,345 -,072 ,103 9,729 ,103

70
Interactie_Size_Carowner
,045c ,302 ,763 ,023 ,100 9,984 ,100
Interactie_Delivery_Carowner
-,087c -,547 ,585 -,042 ,088 11,386 ,085
Interactie_Sensitivity_Income
-,338c -1,489 ,138 -,113 ,043 23,224 ,043
a. Dependent Variable: Use b. Predictors in the Model: (Constant), Income_dummy, Education_dummy, Female_dummy, Age, Carowner_dummy c. Predictors in the Model: (Constant), Income_dummy, Education_dummy, Female_dummy, Age, Carowner_dummy, TypeofGood, Sensitivity, Brands, OnlineSocial_Dummy, OnlineAdvice_dummy, Object_Weight, Delivery_time, Accessibility, Object_Fragility, Holding, Visual, Object_Size
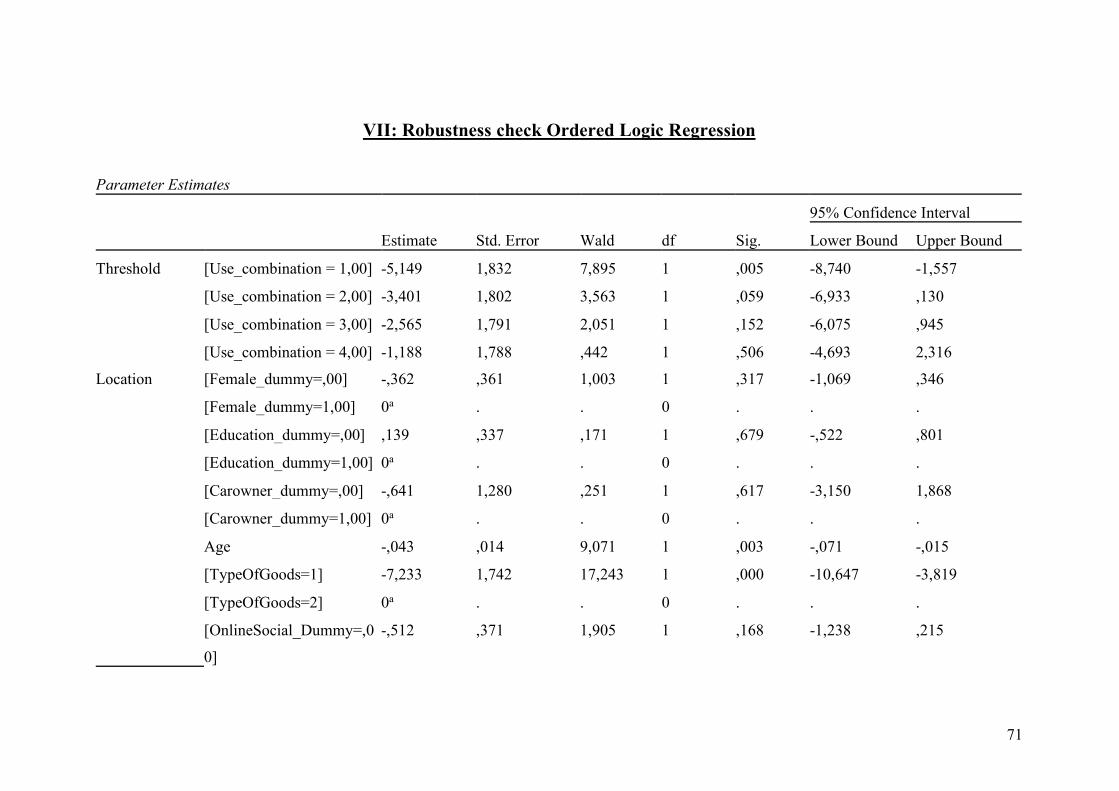
71
VII: Robustness check Ordered Logic Regression
Parameter Estimates
Estimate Std. Error Wald df Sig.
95% Confidence Interval
Lower Bound Upper Bound
Threshold [Use_combination = 1,00] -5,149 1,832 7,895 1 ,005 -8,740 -1,557
[Use_combination = 2,00] -3,401 1,802 3,563 1 ,059 -6,933 ,130
[Use_combination = 3,00] -2,565 1,791 2,051 1 ,152 -6,075 ,945
[Use_combination = 4,00] -1,188 1,788 ,442 1 ,506 -4,693 2,316
Location [Female_dummy=,00] -,362 ,361 1,003 1 ,317 -1,069 ,346
[Female_dummy=1,00] 0a . . 0 . . .
[Education_dummy=,00] ,139 ,337 ,171 1 ,679 -,522 ,801
[Education_dummy=1,00] 0a . . 0 . . .
[Carowner_dummy=,00] -,641 1,280 ,251 1 ,617 -3,150 1,868
[Carowner_dummy=1,00] 0a . . 0 . . .
Age -,043 ,014 9,071 1 ,003 -,071 -,015
[TypeOfGoods=1] -7,233 1,742 17,243 1 ,000 -10,647 -3,819
[TypeOfGoods=2] 0a . . 0 . . .
[OnlineSocial_Dummy=,0
0]
-,512 ,371 1,905 1 ,168 -1,238 ,215

72
[OnlineSocial_Dummy=1,
00]
0a . . 0 . . .
[OnlineAdvice_dummy=,0
0]
-,725 ,336 4,643 1 ,031 -1,384 -,066
[OnlineAdvice_dummy=1,
00]
0a . . 0 . . .
Delivery_time ,369 ,227 2,645 1 ,104 -,076 ,814
Object_Weight -,507 ,247 4,222 1 ,040 -,990 -,023
Object_Fragility -,173 ,190 ,824 1 ,364 -,546 ,200
Object_Size ,465 ,259 3,219 1 ,073 -,043 ,973
Sensitivity -,010 ,212 ,002 1 ,963 -,425 ,406
Accessibility ,020 ,192 ,011 1 ,916 -,355 ,396
Visual 1,137 ,598 3,618 1 ,050 -,035 2,309
Holding -1,951 ,718 7,381 1 ,007 -3,358 -,544
Brands -,094 ,352 ,071 1 ,790 -,784 ,596
[TypeOfGoods=1] *
Brands
,812 ,429 3,574 1 ,059 -,030 1,654
[TypeOfGoods=2] *
Brands
0a . . 0 . . .
[TypeOfGoods=1] * Age ,052 ,020 6,919 1 ,009 ,013 ,090

73
[TypeOfGoods=2] * Age 0a . . 0 . . .
Visual * Brands -,423 ,190 4,955 1 ,026 -,795 -,051
Holding * Brands ,499 ,215 5,394 1 ,020 ,078 ,921
[Carowner_dummy=,00] *
Object_Weight
,664 ,424 2,454 1 ,117 -,167 1,494
[Carowner_dummy=1,00]
* Object_Weight
0a . . 0 . . .
[Carowner_dummy=,00] *
Object_Size
-,774 ,441 3,074 1 ,080 -1,639 ,091
[Carowner_dummy=1,00]
* Object_Size
0a . . 0 . . .
[Carowner_dummy=,00] *
Delivery_time
,126 ,386 ,107 1 ,744 -,631 ,883
[Carowner_dummy=1,00]
* Delivery_time
0a . . 0 . . .
Link function: Logit.
a. This parameter is set to zero because it is redundant.

74