what is chp & why do we need it in michigan? jim leidel director of clean energy systems oakland...
TRANSCRIPT

What is CHP & Why do we need it in Michigan?
Jim LeidelDirector of Clean Energy SystemsOakland University
April 30, 2015

• What is CHP• the Opportunity of CHP:
(a new look at an tried and true technology)• What does CHP look like• Project feasibility basics: the spark spread• Why CHP in Michigan?• Multiple benefits to CHP• Oakland University CHP & MicroGrid• Questions ?
Outline of Discussion

Combined Heat and Power
75-85%
30-40%
80-90%
combined efficiency is dramatically increased

Benefits of CHP to the Host• Additional heating capacity
– “New” equipment replacing aging systems
• Backup electrical power• Lower carbon footprint• Diversified energy options for supply• Energy independence• Grid Reliability• Cost savings drives the whole opportunity

Benefits of CHP to the Grid
• Replace retiring base-load coal generation
• Reduce transmission losses
• Lower carbon footprint (with natural gas)
• Highest efficiency possible
• Added Reliability

40%
23%
23%
8%
3%
3%

Michigan Energy Flow Mich flag2.9 Quad year

Consumers & BP Logos
0.0006 Quad year

U.S. Electric Power Energy Flow

What does CHP look like?


Gas Turbine Generator Set
AIRINLET
FUELMANIFOLD
GENERATOR
DIGITALCONTROLPANEL
AXIALEXHAUST
TERMINALBOX
ACCESSORYREDUCTIONGEARBOX
CUSTOMERCONNECTIONBOX
VPIPG-00-012

Combined Heat and Power SystemCombustion Gas Turbine
AIR INLETFILTER
DIVERTERVALVE
GASTURBINE
GENERATOR
EXHAUSTBYPASSSILENCER
SUPPLE-MENTARYBURNER
HEATRECOVERYSTEAMGENERATOR(HRSG)
EXHAUSTSILENCER
PROCESSSTEAM
118-073

Gas Turbine Cogeneration Facility
118-035

Industrial CHP
Food ProcessingFood Processing PharmaceuticalPharmaceutical
Pulp and PaperPulp and Paper ManufacturingManufacturingVPIPG-00-015

Industrial CHP
Refinery / OilRefinery / Oil HospitalsHospitals
UniversitiesUniversities UtilitiesUtilities
VPIPG-00-016

University of Michigan45.2 MW CHP Application

Lorin Industries3.2 MW CHP Application

Eastern Michigan University3.5 MW CHP ApplicationTaurus 60


JHP Pharmaceuticals4.6 MW Gas Turbine CHP


Ferris State University1.0 MW CHP Kawasaki Turbine


Is CHP Applicable?
Spark Spread

Unit Cost of Electricity
$0.040
$0.045
$0.050
$0.055
$0.060
$0.065
$0.070
$0.075
$0.080
$0.085
$0.090
$0.095
$0.100
1998
1999
2000
2001
2002
2003
2004
2005
2006
2007
2008
2009
2010
2011
2012
2013
2014
2015
2016
Dollarsper kWhr
Monthly Electric Cost per kWhr
Linear Trend Line
FORECAST
Two YearElectric Choice Contract
Approximately 2.8% escalation / year

$-
$2.00
$4.00
$6.00
$8.00
$10.00
$12.00
$14.00
$16.00
1993
1994
1995
1996
1997
1998
1999
2000
2001
2002
2003
2004
2005
2006
2007
2008
2009
2010
2011
2012
2013
Dollars per MMBtu
Cost / MMBtu / Month
Trendline (Moving Average)
FORECAST
Unit Cost of Natural Gas

Unit Cost of Electricity
$0.000
$0.010
$0.020
$0.030
$0.040
$0.050
$0.060
$0.070
$0.080
$0.090
$0.100
$0.110
$0.12020
00
2001
2002
2003
2004
2005
2006
2007
2008
2009
2010
2011
2012
2013
Dollarsper kWhr
Monthly Electric Unit Cost
Monthly Electric Cost from Gas-Fired CHP (9,000 BTU/kWhr)
Electric Utility Unit Cost (Moving Average Trendline)
Electric Cost from CHP (Moving Averager Trendline)
actual OU electric cost
NaturalGas
Price
9,000 Heat Rate
ElectricCost to Produce

Unit Cost of Electricity
$0.000
$0.010
$0.020
$0.030
$0.040
$0.050
$0.060
$0.070
$0.080
$0.090
$0.100
$0.110
$0.120
2000
2001
2002
2003
2004
2005
2006
2007
2008
2009
2010
2011
2012
2013
Dollarsper kWhr
Monthly Electric Unit Cost
Monthly Electric Cost from Gas-Fired CHP (9,000 BTU/kWhr)
Electric Utility Unit Cost (Moving Average Trendline)
Electric Cost from CHP (Moving Averager Trendline)
Spark Spread(fuel only cost)
actual OU electric cost
NaturalGas
Price
9,000 Heat Rate
ElectricCost to Produce

Why do we need CHP?

COAL RETIREMENTS: BEGINNING OF THE END
The US coal fleet is entering an unprecedented period of retirements, as the industry faces a three-pronged assault from low gas prices, an aging fleet, and stringent environmental compliance.
• Old age: numerous units are today approaching 50+ years of operation. • Cheap gas: sub-$4/MMBtu Henry Hub gas will hit coal units twice – first, by reducing wholesale power prices; and second, by bringing combine-cycle gas turbines (CCGTs) into the base-load power mix, encroaching on sales of coal-fired electricity. • Environmental regulations: standards laid out by the US Environmental Protection Agency (EPA) will force generators to decide whether to invest in expensive environmental controls.

source: US DOE, Energy Information Administration, www.eia.gov/state
NuclearPlants

source: US DOE, Energy Information Administration, www.eia.gov/state
Hydro-electric
sites

source: US DOE, Energy Information Administration, www.eia.gov/state
Biomass: wood chip & landfill gas

source: US DOE, Energy Information Administration, www.eia.gov/state
Storage:Pumped
hydro
Note: this is storage using night time grid
power

source: US DOE, Energy Information Administration, www.eia.gov/state
Nat. GasPlants
also showing major gas pipelines

source: US DOE, Energy Information Administration, www.eia.gov/state
CoalPlants
Also showing ≥ 345 kV
transmission

Upper Peninsula Power Plant Map (all fuels)
Also showing natural gas pipelines (blue)
source: US DOE, Energy Information Administration, www.eia.gov/state

U.S. Electric Power Fuel Source Mix
natural gas
petroleumcoal
renewablesrenewables
nuclear
large hydro
source: Bloomberg New Energy Finance, “ Medium-term outlook for US power: 2015 = deepest de-carbonization ever”, 8 April 8 2015

natural gas
coal
renewablesrenewables
source: Bloomberg New Energy Finance, “ Medium-term outlook for US power: 2015 = deepest de-carbonization ever”, 8 April 8 2015
U.S. New Capacity Build & Retirements
petroleum

Regional Grid Operators (ISO’s)
Midwest is MISO &
PJM

source: Bloomberg New Energy Finance, “ Medium-term outlook for US power: 2015 = deepest de-carbonization ever”, 8 April 8 2015
U.S. Coal Plant Retirements by RegionGW
(2015) MISO + PJM = 11 GW
(2016) MISO + PJM = 8 GW

source: US DOE, EIA, Form EIA-860, “Annual Electric Generator Report” and Form EIA-860M, “Monthly Update to the Annual Electric Generator Report”.
Utility Scale Generating Units Planned to Retire from Feb 2015 to Jan 2016 (as reported to the DOE)

source: “Combined Heat & Power: Effective Energy Solutions for a Sustainable Future”, Oak Ridge National Laboratory (2008), ORNL/TM-2008/224, (US DOE, EIA, 2008 data)
CHP Share of Total National Power Generation, by Country

Source: US DOE Report, “The Market and Technical Potential for Combined Heat and Power in the Commercial / Institutional Sector”, prepared by ONSITE SYCOM Energy Corp., (Jan 2000)

source: “Combined Heat & Power: Effective Energy Solutions for a Sustainable Future”, Oak Ridge National Laboratory (2008), ORNL/TM-2008/224, (US DOE, EIA data)
CHP Share of Total Power Generation, United States

source: “Combined Heat & Power: Effective Energy Solutions for a Sustainable Future”, Oak Ridge National Laboratory, ORNL/TM-2008/224, McKinsey & Company data, (2008)

Oakland University Projects
4.6MW
400kW

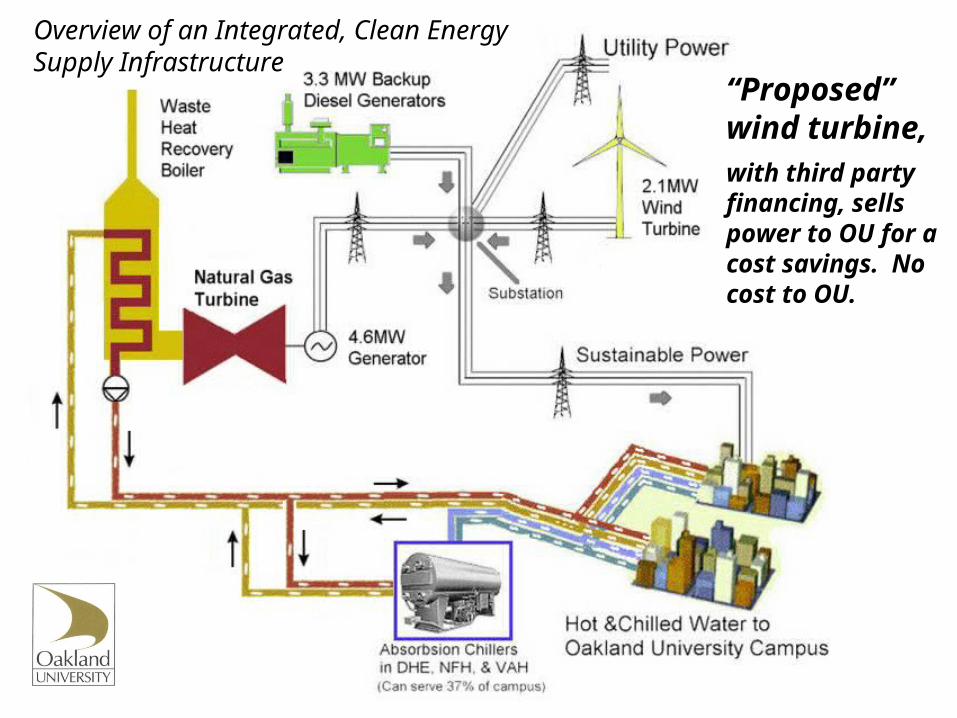
Overview of an Integrated, Clean Energy Supply Infrastructure
Existing Central Heating Plant

Overview of an Integrated, Clean Energy Supply Infrastructure
Four large absorbsion chillers make chilled water from the hot water in summer
Existing

Overview of an Integrated, Clean Energy Supply Infrastructure
Proposed new CHP unit

Overview of an Integrated, Clean Energy Supply Infrastructure
Existing electrical with new CHP

Overview of an Integrated, Clean Energy Supply Infrastructure
Existing diesel backup generators can black start the heating plant on a power failure.
Overview of an Integrated, Clean Energy Supply Infrastructure
with third party financing, sells power to OU for a cost savings. No cost to OU.
“Proposed” wind turbine,

“Proposed“ Detroit Edison owned and operated solar PV array at OU

Vision of an OU Clean EnergyMicro-GridMultiple solar PV & CHP installations are installed or funded

Vision of an OU Clean EnergyMicro-Grid
With data monitoring & academic curricula
Jim Leidel, Director of Clean Energy Systems, [email protected]

Impediments to CHP• Utility backup / stand-by charges• Time to complete utility interconnections• Emissions regulations & permitting time• Knowledge• Capital Costs / Finance• Competition (alternatives)
– Conservation– Electric choice– Relatively cheap electricity

Solutions to Help CHP
• Review and revise utility stand-by charges• Create time limits for utility study &
interconnection process• Create time limits for project permitting• Promote CHP• State-wide study of CHP opportunity• Create low interest loan fund?

Thank you
Questions?
Jim LeidelDirector of Clean Energy SystemsOakland [email protected]/CERCClean Energy Research Center & OU INC