what is hematopoiesis ? neutrophils : 24 hrs platelets : 6-7 days red cells : 120 days. constant...
TRANSCRIPT
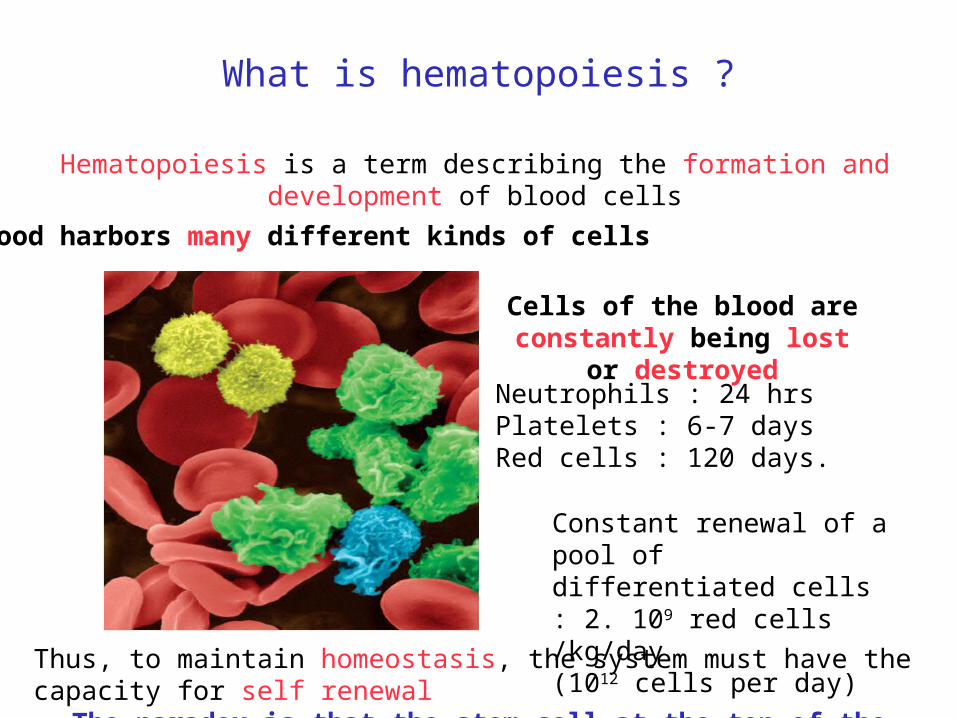
What is hematopoiesis ?
Neutrophils : 24 hrs Platelets : 6-7 days Red cells : 120 days.
Constant renewal of a pool of differentiated cells: 2. 109 red cells /kg/day(1012 cells per day)
Thus, to maintain homeostasis, the system must have the capacity for self renewalThe paradox is that the stem cell at the top of the system is quiescent
Hematopoiesis is a term describing the formation and development of blood cells
Cells of the blood are constantly being lost or destroyed
Blood harbors many different kinds of cells
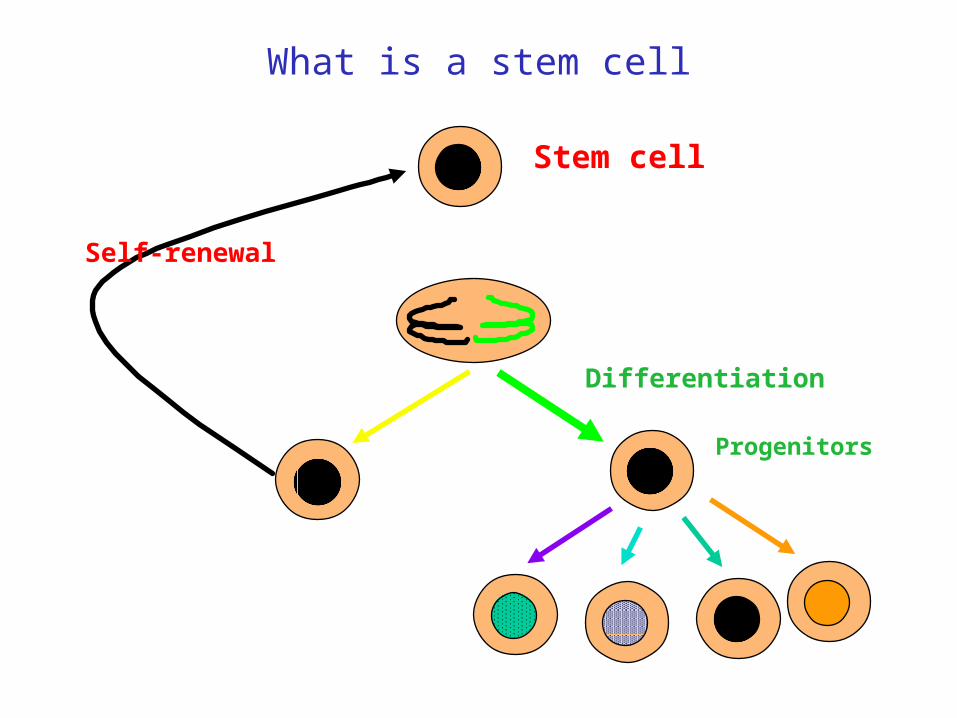
Differentiation
Stem cell
Progenitors
Self-renewal
What is a stem cell
Differentiation
Stem cell
Progenitors
Self-renewal
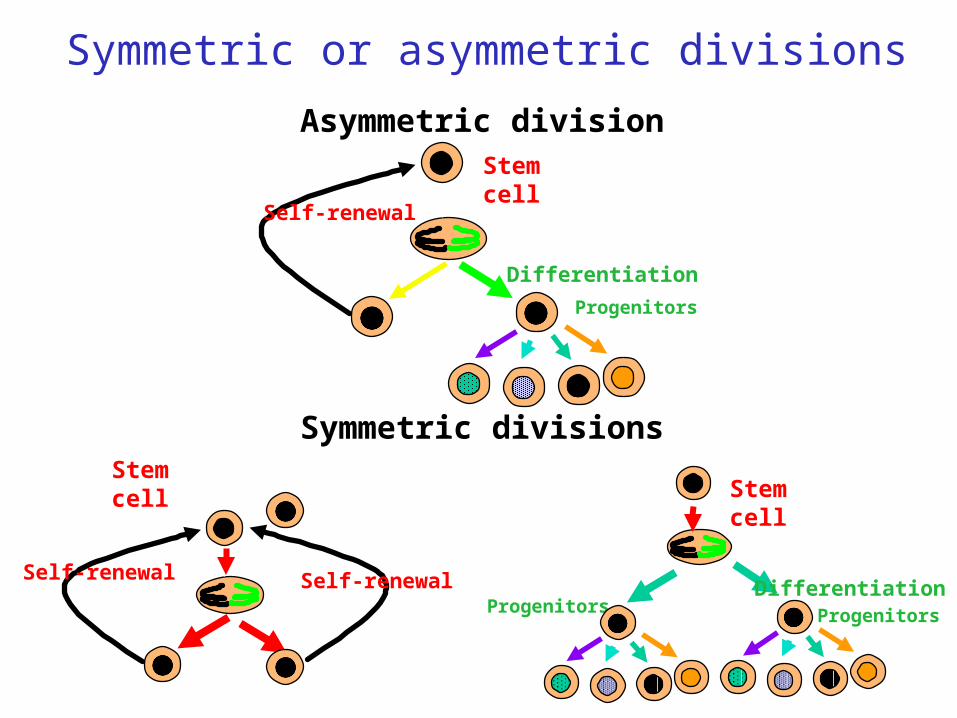
Asymmetric division
Symmetric divisions
Progenitors
Stem cell
DifferentiationProgenitors
Stem cell
Self-renewal Self-renewal
Symmetric or asymmetric divisions

Sequential events leading to mature blood cells
Hematopoietic stem cellsHematopoietic stem cells(rare and undifferentiated)
Mature cells -with specific function (i.e. O2 transport) -represent most of the cells
Many intermediate states with varying degree of
proliferation and differentiation
Hematopoietic cells can be divided into three cellular compartments
Hematopoietic progenitorsHematopoietic progenitors
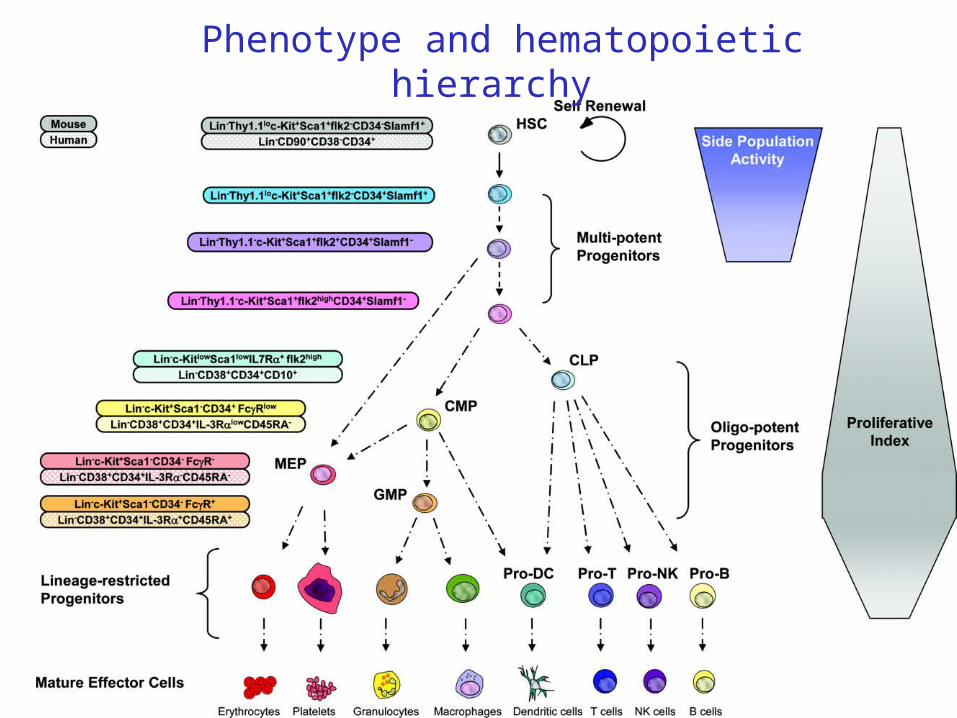
Phenotype and hematopoietic hierarchy

Hematopoietic stem cells are quiescent (non cycling)

FibroblastsFibroblasts
OsteoblastsOsteoblasts
ECMECM(OPN)(OPN)
AdipocytesAdipocytes
Vascular nicheVascular niche NormoxiaNormoxia
CytokinesCytokines(Tpo, SCF, HGF, FGF4…(Tpo, SCF, HGF, FGF4…))
ChimiokinesChimiokines(Il-8, SDF-1..)(Il-8, SDF-1..)
HypoxiaHypoxiaCaCa++++
ProteasesProteases(MMP9, CTK…)(MMP9, CTK…)
OsteoclastsOsteoclastsCSMCSM
ESCESC
HSHSCC
The bone marrow hematopoietic nichesThe bone marrow hematopoietic niches
Endosteal nicheEndosteal niche
CAR cellsCAR cells
Ang-1/Tie2Ang-1/Tie2Wnt/Wnt/ββ-caténin -caténin Jagged-1/Notch..Jagged-1/Notch..
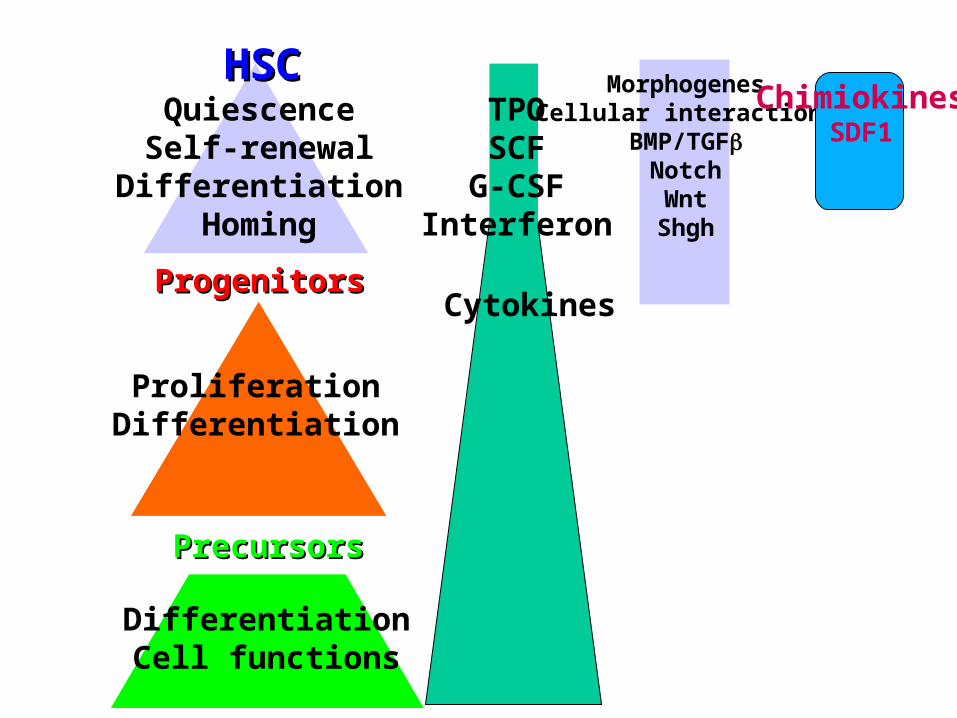
HSCHSC
ProgenitorsProgenitors
PrecursorsPrecursors
Cytokines
TPOSCF
G-CSFInterferon
MorphogenesCellular interactions
BMP/TGFNotchWntShgh
ChimiokinesSDF1
QuiescenceSelf-renewal
DifferentiationHoming
ProliferationDifferentiation
DifferentiationCell functions

HSCHSC
ProgenitorsProgenitors
PrecursorsPrecursors
QuiescenceSelf-renewal
DifferentiationHoming
ProliferationDifferentiation
DifferentiationCell functions
5x10⁵-3x10⁶ HSC
Average doubling time 45 days
15 mitosis
Asymmetric/symmetric division: 0.5-3
Extinction of stem cells(exhaustion, apoptosis)

Niche(Competition and clonal dominance)
Differentiation
Asymmetric division
Clonal dominance induced by symetrical mitosis
Symmetric division Symmetric division
Symmetric division
Symmetric division
Asymmetric division
Asymmetric division

The differentiation hierarchy of the hematopoietic system.
Haeno H et al. PNAS 2009;106:16616-16621

Cancer stem cell/leukemic stem cellTumor is arranged as a hierarchy similar to normal hematopoietic tissue
Block terminaldifferentiation Mature cells
CD34+/ CD38-
CLP CMP
HSCLeukemic stem cell Leukemogenic
events
Bulk leukaemiacells
Leukemia Hematopoietic reconstitution
QuiescenceQuiescencePhenotypePhenotypeNiche Niche dependency ?dependency ?
HSCHSC
ProgenitorsProgenitors
PrecursorsPrecursors
LSCLSC
ProgenitorsProgenitors
PrecursorsPrecursors
AML
LSCLSC
ProgenitorsProgenitors
PrecursorsPrecursors
MDS
LSCLSC
ProgenitorsProgenitors
MPD
PrecursorsPrecursors
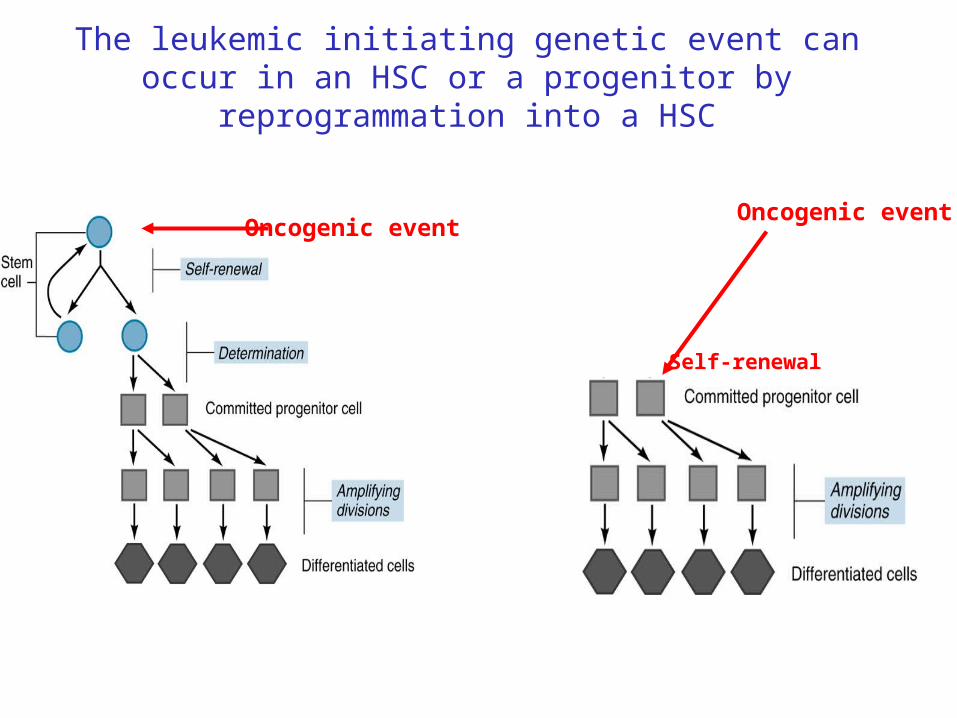
The leukemic initiating genetic event can occur in an HSC or a progenitor by reprogrammation into a HSC
Oncogenic eventOncogenic event
Self-renewal

WHO classification of MPDs
Essential Thrombocythemia
(ET)
CML Classical MPDs Rare and unclassified MPDs
Polycythemia vera (PV)
Myelofibrosis(PMF)
Bcr-abl PDGFRaFGFR1Kit

BFU-EBFU-E
CFUCFU--EE B cell B cell
PMEoPMEo PMBPMBMonoMonoPMNPMN
CFU-MKCFU-MK Pre-BPre-B Pre-TPre-T
RBCRBC
MacrophageMacrophage
PLTPLT
T cell T cell
DCDC
NK NK
CFU-GMCFU-GMCFU-EoCFU-EoCFU-basoCFU-baso
MPDs
B cell B cell PEoPEo PBPBMonoMonoPNPN
CFU-MKCFU-MK CFU-basoCFU-basoPre-BPre-B Pre-TPre-TCFU-EoCFU-EoCFU-GMCFU-GMBFU-EBFU-E
CFU-ECFU-E
RBCRBC
PRECURSORSPRECURSORS
Mature cellsMature cells
MacrophageMacrophage
PLTPLT
HSCHSC
T cell T cell
DCDC
NK NK
PROGENITORSPROGENITORS
Normal hematopoiesis
MPDs are clonal diseases involving HSC leading to increase blood cell production

BFU-EBFU-E
CFUCFU--EE B cell B cell
PMEoPMEo PMBPMBMonoMonoPMNPMN
CFU-MKCFU-MK Pre-BPre-B Pre-TPre-T
RBCRBC
MacrophageMacrophage
PLTPLT
T cell T cell
DCDC
NK NK
CFU-GMCFU-GMCFU-EoCFU-EoCFU-basoCFU-baso
B cell B cell PEoPEo PBPBMonoMonoPNPN
CFU-MKCFU-MK CFU-basoCFU-basoPre-BPre-B Pre-TPre-TCFU-EoCFU-EoCFU-GMCFU-GMBFU-EBFU-E
CFU-ECFU-E
RBCRBC
PRECURSORSPRECURSORS
Mature cellsMature cells
MacrophageMacrophage
PLTPLT
HSCHSC
T cell T cell
DCDC
NK NK
PROGENITORSPROGENITORS
Clonal dominance of the MPD clones(log-log age incidence curve)
Up to 60 years1/1x106 1x10⁻³ to 100%

Molecular events and classical MPDs
PMF
45% 25%
atypical MPDs
50%
5%MPL W515
PV
95%
JAK2 Exon 12
JAK2V617F
ET
30%65%
MPL W515
3%-5%
JAK2V617F
JAK2V617F
50%
BCS
C-termN-termJH1JH2
Kinase domainPseudokinasedomain
Cytokine receptorInteracting domain
V617F
FERM domainSH2
K539L
JAK2V617F Baxter, The Lancet 2005 James, Nature 2005Kralovics, NEJM 2005Levine, Cancer Cell 2005JAK2 exon 12Scott, NEJM 2007MPL W515Pickman, PLoS med 2006

A proposed structure of JAK2V617FLee et al. Cancer 15, 1692, 2009
A proposed structure of JAK2V617FLee et al. Cancer 15, 1692, 2009

PV2heterozygous
The mutation is homozygous in 30% of the PV patients by duplication of the mutated allele
N
A A AAN CG
A A AAC CG
A A AAA CG
PV1homozygous
FISH JAK2: the two allelesare present
This homozygosity correlates with 9pLOH (Kralovics et al 2005) and is related to a mitotic recombination
AC GCC GN
T cells
AC GCC GT
Granulocytes

A A AAN CG
A A AAA CG
Heterozygous ?Homozygous ?
Homozygous
Allele ratio from blood leukocyte DNAin PV and ET patients
ET
PV

Clonal dominance in MPD clones
BFU-EBFU-E
CFUCFU--EE B cell B cell
PMEoPMEo PMBPMBMonoMonoPMNPMN
CFU-MKCFU-MK Pre-BPre-B Pre-TPre-T
RBCRBC
MacrophageMacrophage
PLTPLT
T cell T cell
DCDC
NK NK
CFU-GMCFU-GMCFU-EoCFU-EoCFU-basoCFU-baso BFU-EBFU-E
B cell B cell
PMEoPMEo PMBPMBMonoMonoPMNPMN
CFU-MKCFU-MK Pre-BPre-B Pre-TPre-T
RBCRBC
MacrophageMacrophage
PLTPLT
T cell T cell
DCDC
NK NK
CFU-GMCFU-GMCFU-EoCFU-EoCFU-basoCFU-baso
CFUCFU--EE
ET PV

ET
PV (heterozygous profile)
PV (homozygous profile)
1.0
0.6
0.0
0.2
0.8
0.4
Siz
e of
th
e JA
K2
V61
7F c
lon
e
CD34+CD38- CD34+CD38+ Erythroblasts Granulocytes
Clonal amplification
CommitedProgenitors
(BFU-E, CFU-GM)
Precursor cellsErythroblastsGranulocytesB cells, NK
Lympho-Myeloid progenitors
CD34+/38-
Thrombocytosis Erythrocytosis Erythrocytosis
Homo.JAK2V617F
Normalmarrow
PVhomozygous
PVheterozygous
ET(heterozygous)
PMF
Fibrosis
Is JAK2 signaling sufficient to induce a clonal dominance at the level of HSC ?(Requirement for other mutations such as TET2 ? )

Chromosome 4 q24
107.33 Mb
MPD01
MPD04
MPD05
TET25' 3'
106.11 Mb 106.35 Mb
325 Kb deletion
LOH
SNP Array
MPD05
MPD02
MPD01
Copy neutralLOHCopy neutralLOH
Discovery of a cooperative genetic events
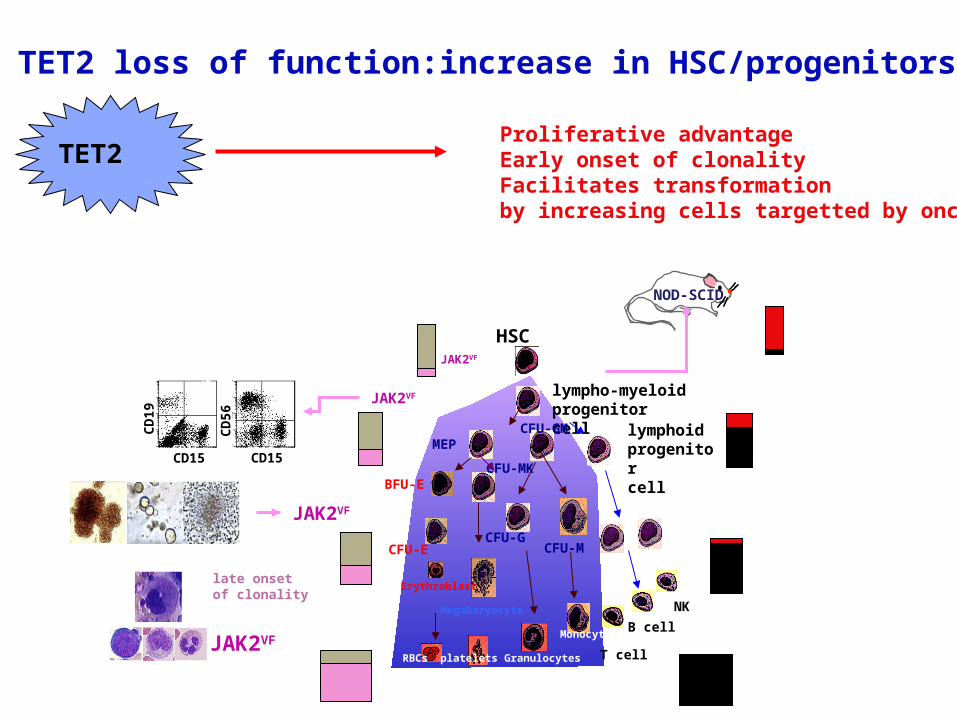
TET2 loss of function:increase in HSC/progenitors or both ?
TET2
JAK2VF
JAK2VF
JAK2VF
JAK2VF
100 101 102 103 104
CD15 FITC100 101 102 103 104
CD15 FITC
CD
19
CD
56
CD15
CD15
NOD-SCID
HSC
lympho-myeloid progenitor cell
lymphoid progenitor cell
MEP
BFU-E
CFU-E
CFU-MK
CFU-GM
CFU-MCFU-G
RBCs platelets Granulocytes T cell
B cell
NK
Erythroblast
Megakaryocyte
Monocytes
CD15 CD15
CD
19
CD
56
late onset of clonality
Proliferative advantageEarly onset of clonalityFacilitates transformation by increasing cells targetted by oncogenic hits

Modeling cancer disease A model of cancer initiation
Haeno H et al. PNAS 2009;106:16616-16621

The probability of cancer initiation along the four evolutionary trajectories
Haeno H et al. PNAS 2009;106:16616-16621

The dominant trajectory to MPN-initiating cells.
Haeno H et al. PNAS 2009;106:16616-16621

Vickers, M. A. Blood 2007;110:1675-1680
Illustrative simulations showing age-specific incidence curves predicted from single mutation conferring an "exponential phenotype
Conclusions- Minimum 18 V617F HSC to get a phenotype- Symmetrical divisions (0.2-0.4/cell/year)- Loss of HSC through differentiation (0.8-0.95 the rate of symmetrical divisions)- 60%-99% of all clones are extinguished

Murine models to model the disease(KI Mice)
E12
TTC (F617)
E13m
KI/Cre
CMVpromoter Cre
VAVpromoter Cre
SCLpromoter CreERt
embryonic / Ubiquitous
Expression
embryonic / hematopoietic
Hematopoietic / inducible(tamoxifen)
Promoter

WHO classification of MPDs
Essential Thrombocythemia
(ET)
Classical MPDs Rare and unclassified MPDs
Polycythemia vera (PV)
Myelofibrosis(PMF)
CML
PDGFRaFGFR1Kit
Modeling response to targeted therapiesThe model of CML
• CML is caused by a fusion protein BCR-ABL
• BCR-ABL can be targeted by Imatinib (a TK inhibitor)
• Clinical success but does not eradicate the disease
• Resistance to treatment can also appear

Response to therapy and modeling(Michor et al. Nature 2005)
Two curves:The first corresponds to the killing of maturing cellsThe second to the effects on more primitive cells, Progenitor or stem cell ?

Need for mathematical models to improve the treatment

Exhaustion of HSC through proliferation(the exemple of interferon)
Trump et al.

Polycythemia Vera and pegylated Interferon alpha (Kiladjian et al. Blood, 2008)
Effect on a leukemic stem cell ?

BFU-EBFU-E
CFUCFU--EE B cell B cell
PMEoPMEo PMBPMBMonoMonoPMNPMN
CFU-MKCFU-MK Pre-BPre-B Pre-TPre-T
RBCRBC
MacrophageMacrophage
PLTPLT
T cell T cell
DCDC
NK NK
CFU-GMCFU-GMCFU-EoCFU-EoCFU-basoCFU-baso
1x10⁻³ to 100%
Minimum 18 V617F HSC to get a phenotype
Drugs which would activate HSC(Interferon ?)
Drugs which would kill specifically the proliferating
mutated cells(specificic JAK2 inhibitor)
Conclusions
• Modeling of normal hematopoiesis may be a powerful tool to predict complex biologic processes that will be validated by experimental procedures
• Modeling of malignant hematopoiesis may help to understand the clonal dominance and the cooperative effects of several genetic alterations
• Modeling might be a powerful tool to prospectively in vivo monitor the response to a drug and a combination of drugs
• MPD appear to be disorders whose pathogenesis and treatment might be greatly improved by such an approach

Acknowledgments
INSERM U985
Villejuif
Olivier BernardVéronique Della Valle
Roland Berger
Ludwig Institute for Cancer Research (Brussels)
Stefan Constantinescu
INSERM U1009Villejuif
Eric Solary
François Delhommeau
Nicole Casadevall
Stéphane Giraudier
Rodolphe Besancenot
Jean-Pierre Le Couédic
Isabelle Plo
Jean Luc Villeval