what is right for the beef - american aberdeen is right for the beef . kris a. ringwall, ph. d....
TRANSCRIPT

What Is Right For The Beef
Kris A. Ringwall, Ph. D.Extension Beef Specialist
North Dakota State University
September 2, 2017
A DiscussionOn Cattle Size

Did You Know . . . ?

Calves born in 2013, 2014, 2015Data from 2016 DREC Annual Report, Senturklu S., D.G. Landblom, R.J. Maddock, T. Petry, and S.I. Paisley

How Big?How Small?
How Much Muscle?

A Story Of
Opportunity

A Story Of
Opportunity
Introduced Aberdeen influence
bulls
2003 2008 2013 2018
Collectedcalving
ease data
Compiledcarcass
datasummary
Recorded cow weight and production
Aberdeen females go
into production
Stockingrates
evaluated
Grass and cover crop study initiated
Where do you want to go?
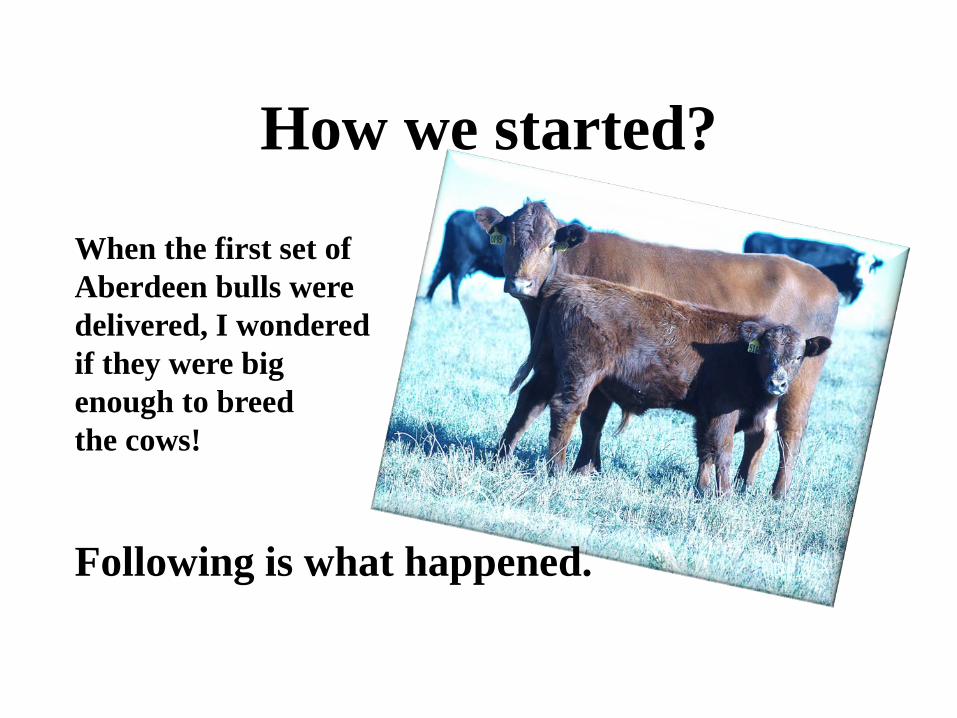
How we started?
When the first set ofAberdeen bulls weredelivered, I wonderedif they were bigenough to breedthe cows!
Following is what happened.

Calving EaseEarly Data Collection
The Dickinson Research Extension Center has been collecting data on low birthweight, Aberdeen bulls. Following is the chart
compiled from data collected at the Center. Year No BW Unassisted Assisted
2004 9 68.6 9 02005 25 64.9 24 12006 48 63.8 48 02007 44 74.7 42 2

2004 2005 2006 2007Arrival Weight 945 994 830 786Frame Score 4.4 4.7 4.8 5.2
Harvest Weight 1186 1297 1179 1309Harvest Value 1093 1223 1074 1176
(in dollars)Number of Steers 22 26 38 24
Days on Feed 85 95 110 138Average Daily Gain 2.85 2.73 3.03 3.81% Choice or Higher 77% 100% 68% 88%Percentage YG3 or
Lower 86% 76% 97% 75%
Carcass Data Summary(Compiled in 2008)
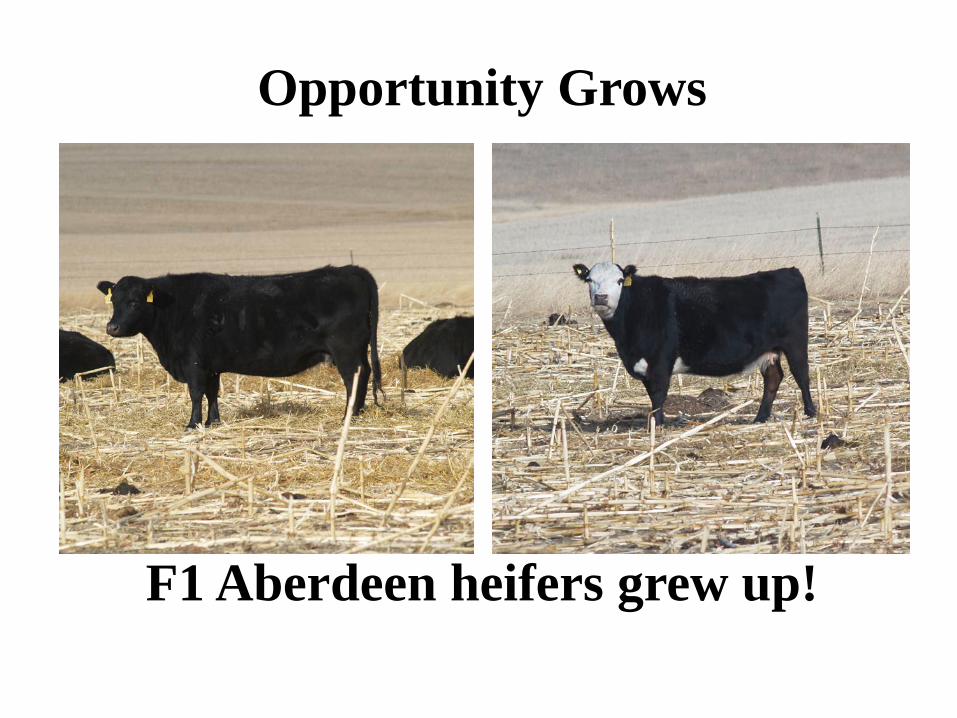
Opportunity Grows
F1 Aberdeen heifers grew up!

So,wheredo the
females fit?
Beef Cattle Systems Evaluation

Let’s continue the story . . .
Cow size and calf birth size2011 calves
Cow group No. Calving Date
Calf BW
Cow WT
Conventional cows 68 1-Apr 91 1358
Aberdeen F1 cows 53 17-Mar 68 999

0
200
400
600
800
1000
1200
1400 12871035
585 537Cows Calves Cows Calves
Range Program incorporated Aberdeen Cattle
Cow and Calf Weights
Conventional Herd Aberdeen F1 HerdData Courtesy of Llewellyn Manske, Ph. D.

7
8
9
10
11
12
1312.5
10.1
Range Program incorporated Aberdeen Cattle
Acres/Pair
Conventional Herd Aberdeen F1 HerdData Courtesy of Llewellyn Manske, Ph. D.
44%
45%
46%
47%
48%
49%
50%
51%
52%
46.2%
51.9%
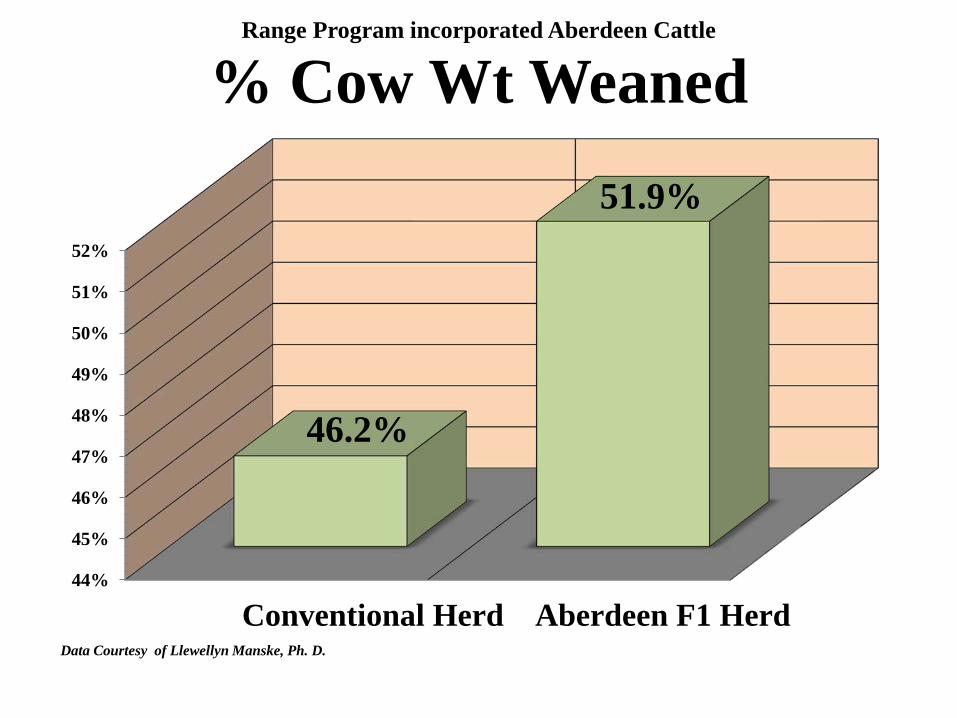
Range Program incorporated Aberdeen Cattle
% Cow Wt Weaned
Conventional Herd Aberdeen F1 HerdData Courtesy of Llewellyn Manske, Ph. D.
20
22
24
26
28
30
32
34
23.6
32.4
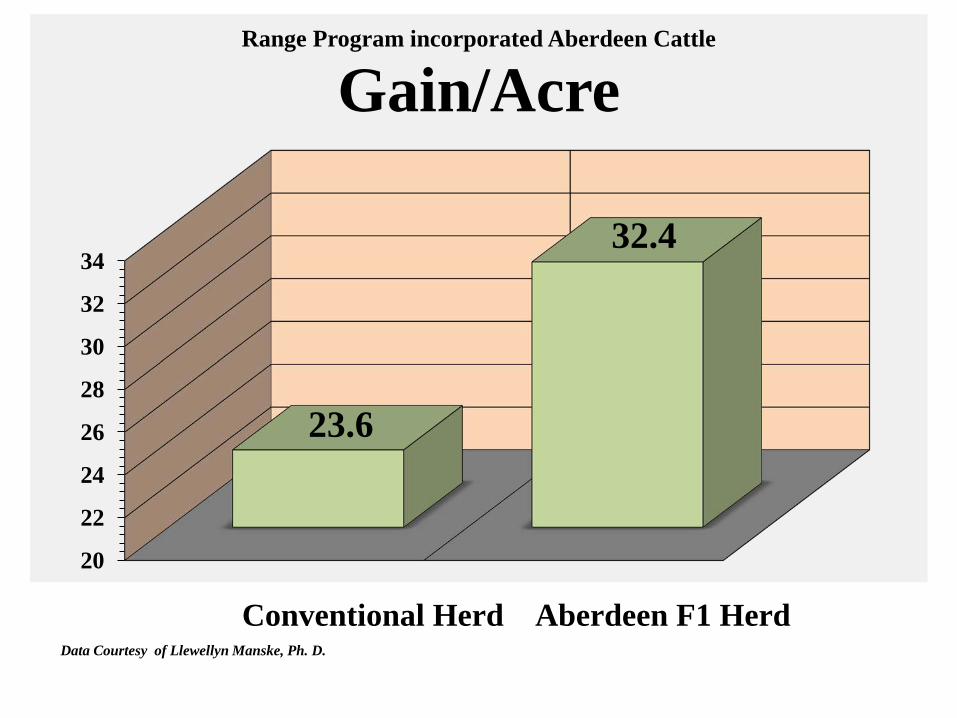
Range Program incorporated Aberdeen Cattle
Gain/Acre
Conventional Herd Aberdeen F1 HerdData Courtesy of Llewellyn Manske, Ph. D.

What did we do? – Established 2 HerdsConventional females
Aberdeen F1 females

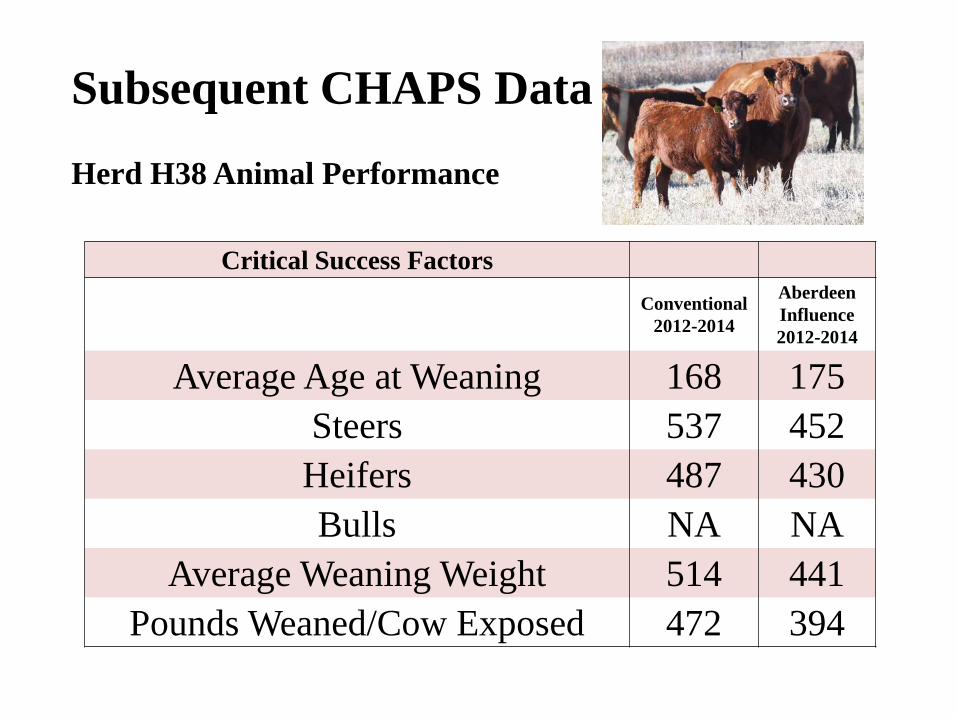
Subsequent CHAPS Data
Herd H38 Animal Performance
Critical Success FactorsConventional
2012-2014
AberdeenInfluence 2012-2014
Average Daily Gain 2.52 2.09Weight Per Day of Age 3.06 2.51
Birth Weight 89 75Adjusted 205 Day Weight 639 535
Frame Score 5.0 3.7
Critical Success FactorsConventional
2012-2014
AberdeenInfluence 2012-2014
Average Age at Weaning 168 175Steers 537 452Heifers 487 430Bulls NA NA
Average Weaning Weight 514 441Pounds Weaned/Cow Exposed 472 394
Subsequent CHAPS Data
Herd H38 Animal Performance

Critical Success FactorsConventional
2012-2014
AberdeenInfluence 2012-2014
% Pregnant 98.23 95.50% Pregnancy Loss 0.85 0.80% Cows Calving 97.38 94.7
% Calf Death Loss 3.72 6.13% Cows Weaning Calves 93.66 88.90
Subsequent CHAPS Data
Herd H38 Reproductive Performance

Critical Success FactorsConventional
2012-2014
AberdeenInfluence 2012-2014
% Cows Calving in 42 Days 95.52 96.0Cow Age 5.0 4.5
Cow Weight 1437 1094Cow Condition 5.3 5.2
Subsequent CHAPS Data
Herd H38 Reproductive Performance

At the Crossroads . .
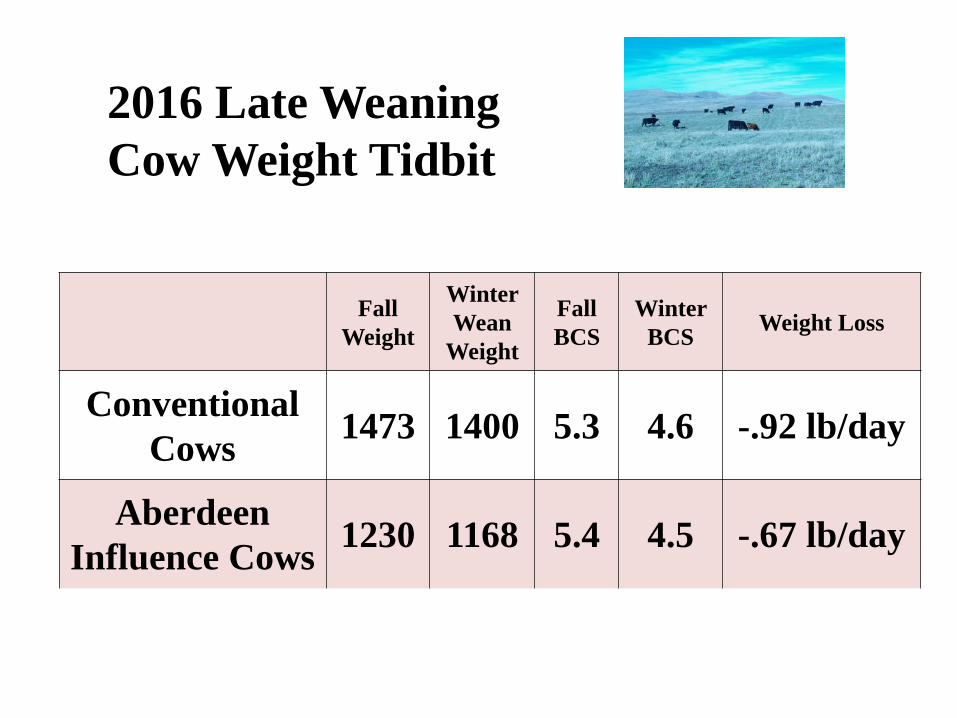
2016 Late WeaningCow Weight Tidbit
Fall Weight
Winter Wean
Weight
Fall BCS
Winter BCS Weight Loss
Conventional Cows 1473 1400 5.3 4.6 -.92 lb/day
Aberdeen Influence Cows 1230 1168 5.4 4.5 -.67 lb/day
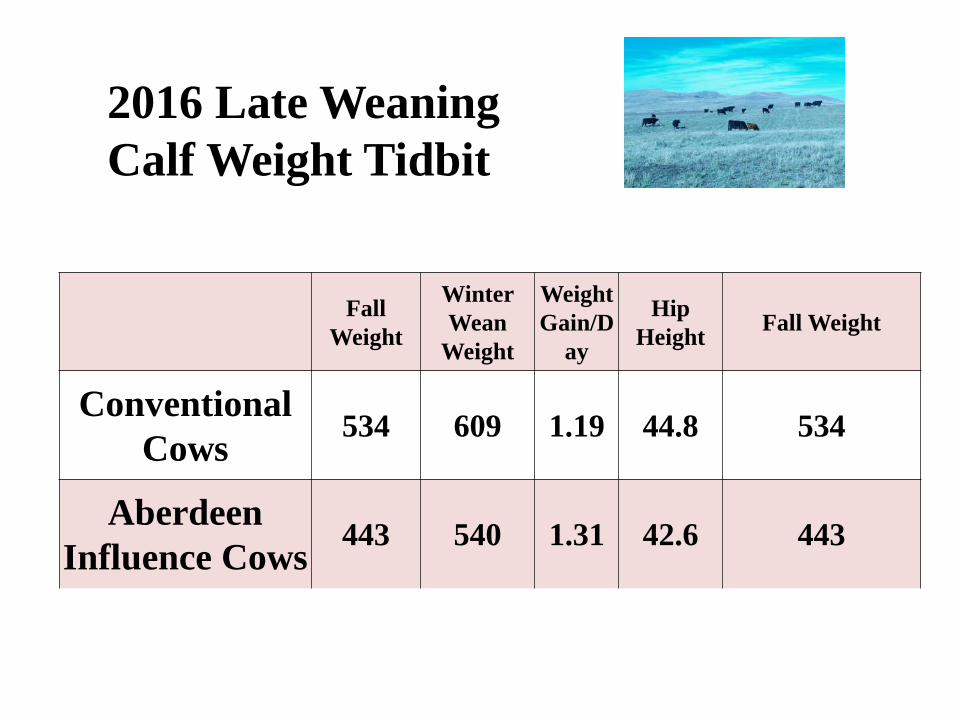
2016 Late WeaningCalf Weight Tidbit
Fall Weight
Winter Wean
Weight
Weight Gain/D
ay
Hip Height Fall Weight
Conventional Cows 534 609 1.19 44.8 534
Aberdeen Influence Cows 443 540 1.31 42.6 443
What Kind of Beef Cattle System Is This?
Beef Cattle Systems Evaluation

What Do We Know?Aberdeen Influence
• Reduce cow size• Reduce calving issues
• Produce more ribeye/cwt• Produce more gain/acre
Creates management opportunities
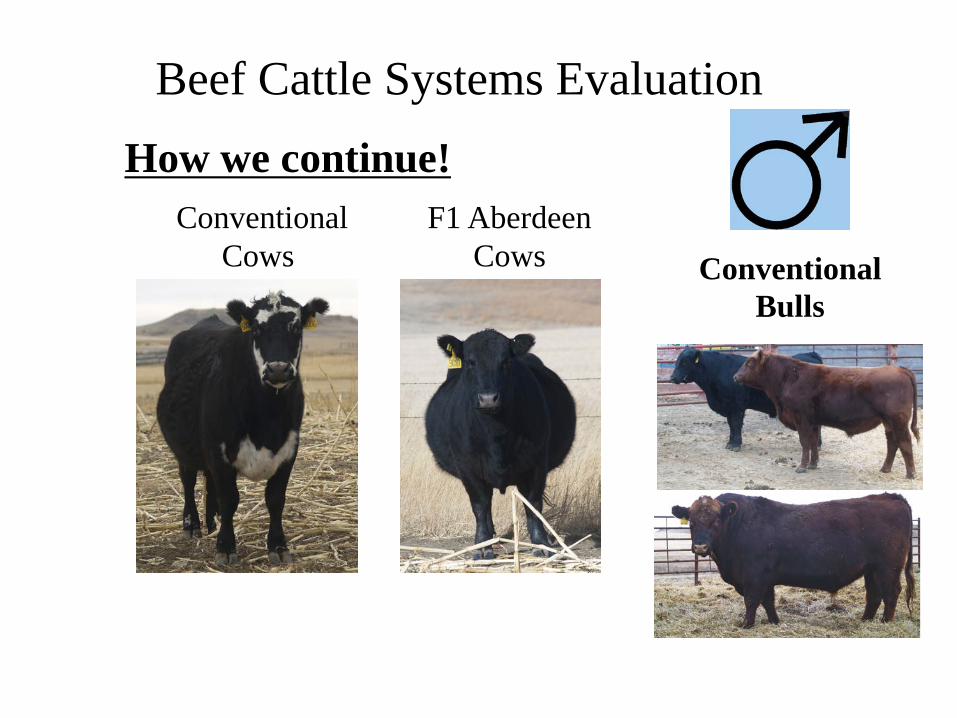
Beef Cattle Systems EvaluationHow we continue!
Conventional F1 AberdeenCows Cows Conventional
Bulls

A Discussion On Cattle Size by Kris Ringwall, Ph. D. 28
A quick note:Animal RevenueAdjusted for StockingRate at DREC
Large Frame Small Frame Influence
119 calves 143 calves$895.82 $821.81
$106,603 $117,518

What’s next?
Producers control the future of beef!

Here’s The Beef!

Beef Cattle Systems EvaluationThoughtsThere are opportunities in the beef business.
You, as the producer, set the course for the future!

Beef Cattle Systems EvaluationPonder this thought:
If we take 300 pounds off cow size, what do we get?

Beef Cattle Systems EvaluationThoughts
Biological Efficiency
Where we have beenEfficient Cattle System
Do you know your stocking rate?
Economic Efficiency

Cow Weight
Daily Feed Intake For
Cow
# Cows Run
Calves Wean
Weight
Chaps Wean %
# Calves Wean
Pounds of Calves
Weaned
1094 24 91 394 90% 82 32,3411437 33 70 472 90% 62 29,496
Difference = 2,845 poundsMore from Aberdeen Influence Cows
AUM Stocking Rate InformationAssume 100 cows and dry matter intake at 2% of Body Weight

Now You Know . . .
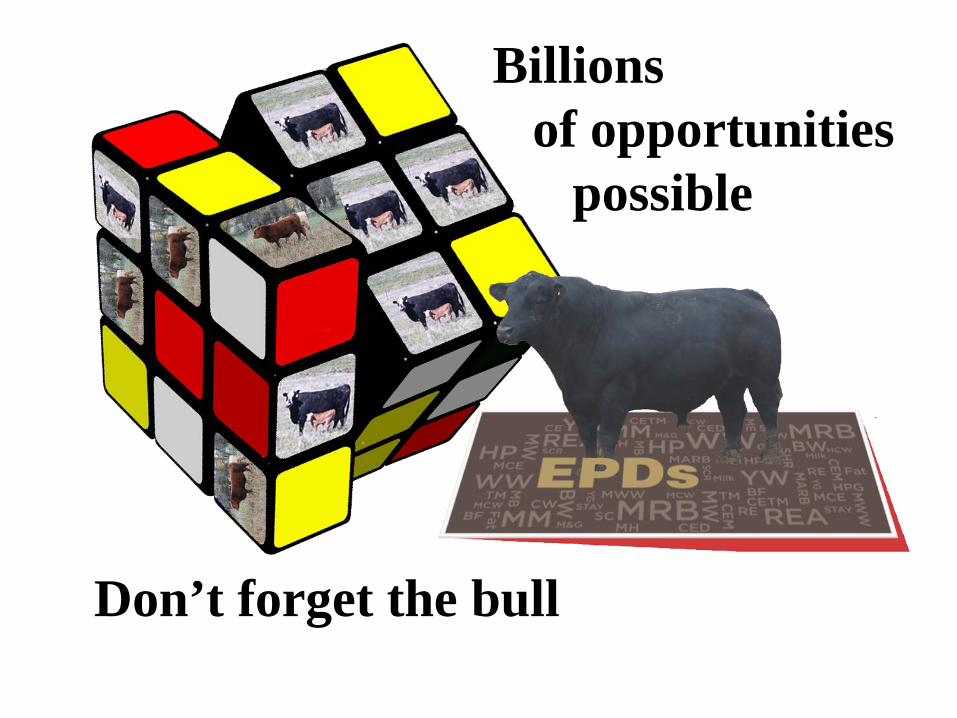
Billionsof opportunities
possible
Don’t forget the bull

Effective Use Of EPDs

Beef Cattle Systems EvaluationOther presentationsProviding Adequate Late Season Crude Protein with Pasture Grasses
Dr. Lee ManskePasture Tour: Impacts of Cow Size and Frame on Carcass Endpoints
Dr. Robert MaddockBeef Cattle Systems as influenced by frame size
Dr. Songul Senturklu and Doug LandblomHow to Select Efficient Cows
Dr. Clint Rusk, Oklahoma State UniversityHow to Find Cows that Fit Your Ranch Environment
Dr. David Lalman, Oklahoma State UniversityNutritional Effects of Frame Size on Efficiency and Longevity of Beef Cows
Dr. Kendall SwansonGenetic Effects of Frame Size on Efficiency and Longevity of Beef Cows
Dr. Lauren Hulsman Hanna

Beef Cattle Systems Evaluation
Some final thoughts
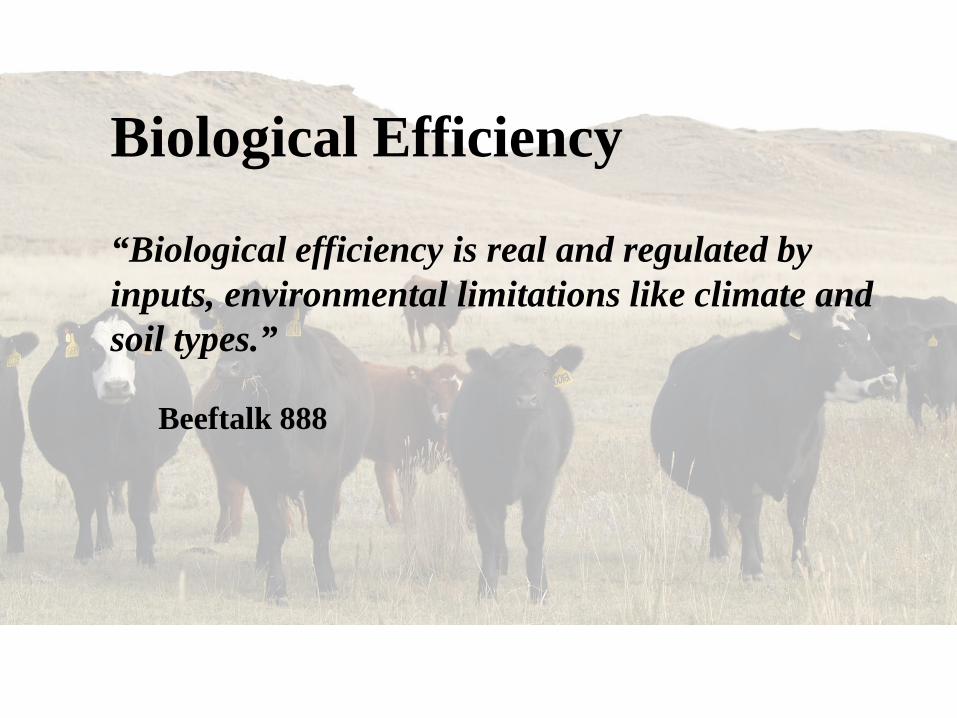
Biological Efficiency
“Biological efficiency is real and regulated by inputs, environmental limitations like climate and soil types.”
Beeftalk 888

Economic Efficiency
“Economic efficiency is imposed by humans who assign a dollar value to a biological type based on human preference and desire.”
Beeftalk 888
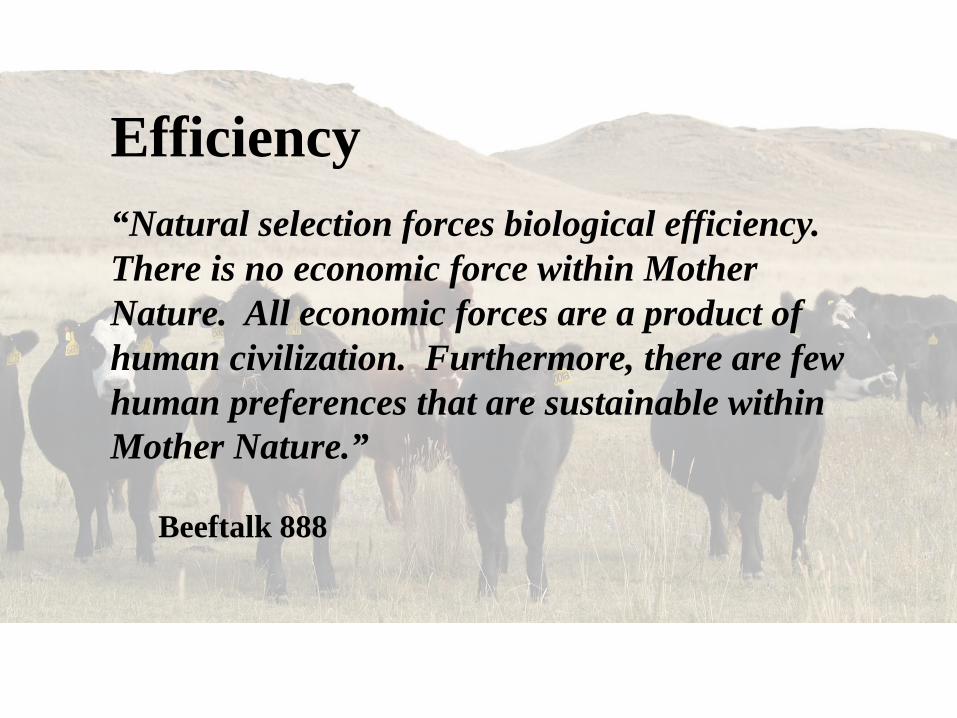
Efficiency“Natural selection forces biological efficiency. There is no economic force within Mother Nature. All economic forces are a product of human civilization. Furthermore, there are few human preferences that are sustainable within Mother Nature.”
Beeftalk 888

Cow age
AvgActual WW
Avg Cow Wt at
Weaning
% of cow weight weaned
Carcass Wt Grade YG BF REA
s6266 10 514 1139 45% 793 CH+ 2 0.4 13.4u8054 9 547 1237 44% 943 Prime 3 0.6 13.0u8082 9 551 1256 44% 1038 Ch- 2 0.4 16.1u8190 9 498 1053 47% 871 Ch- 2 0.3 14.6u8302 9 520 1162 45% 868 Ch- 3 0.4 12.1x0271 7 501 1181 42% 910 Ch 3 0.6 13.5x0298 7 520 1100 47% 921 Ch 2 0.4 15.2y1002 6 538 1070 50% 996 Ch+ 2 0.4 15.4y1019 6 471 1022 46% 899 Ch+ 3 0.6 13.2y1027 6 446 984 45% 684 Ch+ 2 0.3 13.0
Aberdeen Influence Production(Average of 8 years data)
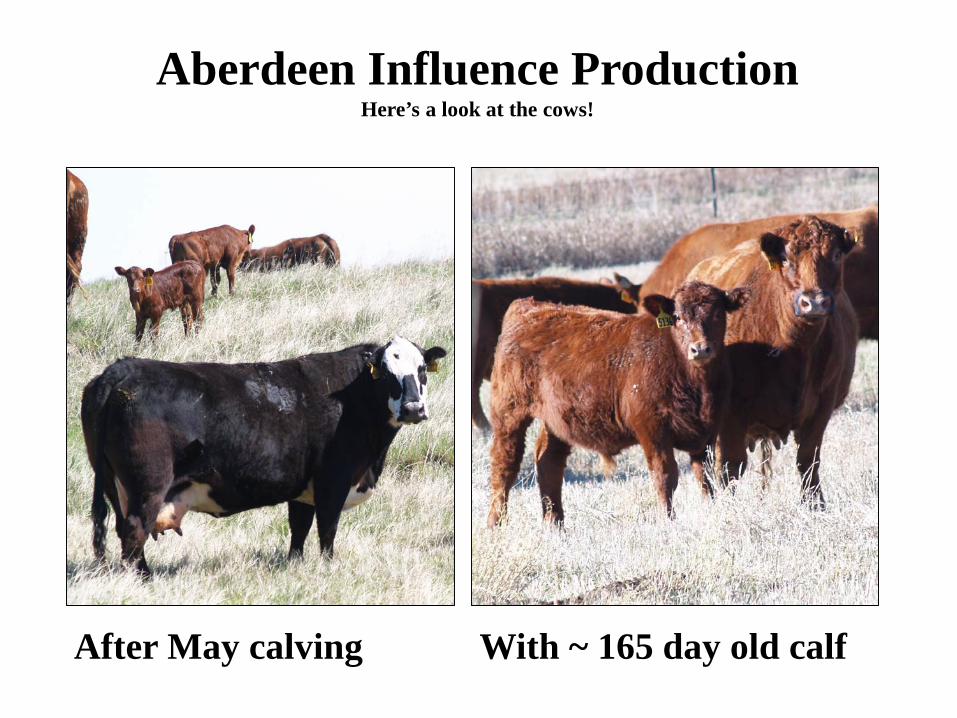
Aberdeen Influence ProductionHere’s a look at the cows!
After May calving With ~ 165 day old calf

Aberdeen Influence ProductionHere’s a look at the cows!

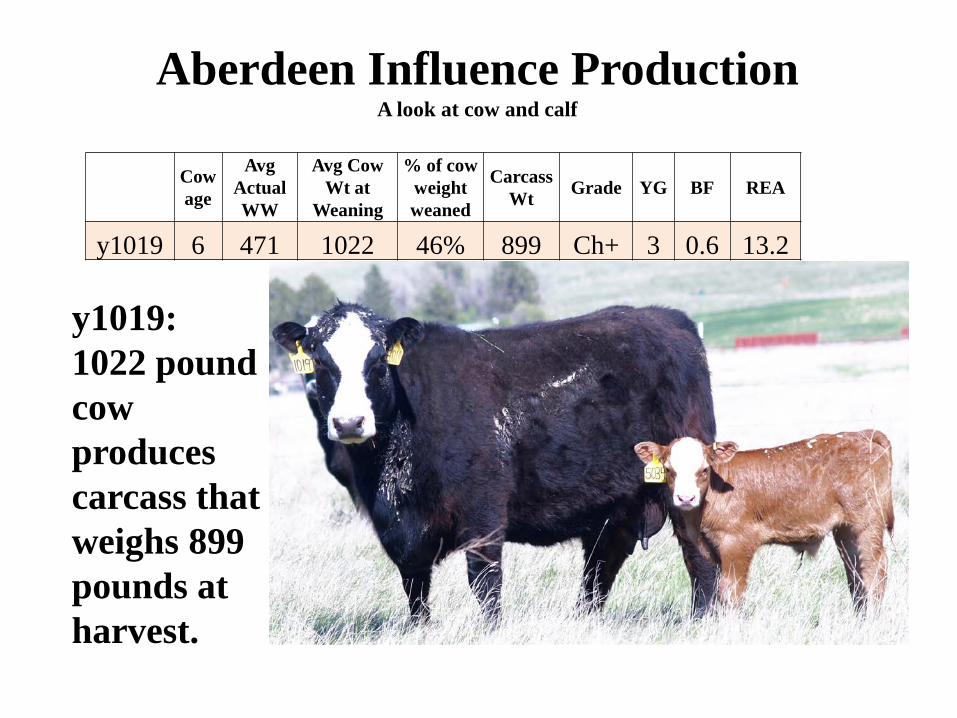
Aberdeen Influence ProductionA look at cow and calf
y1002: A cow forall theages! Look at thisproduction.
Photo taken Aug. 28, 2017
Cow age
AvgActual WW
Avg Cow Wt at
Weaning
% of cow weight weaned
Carcass Wt Grade YG BF REA
y1002 6 538 1070 50% 996 Ch+ 2 0.4 15.4

Cow age
AvgActual WW
Avg Cow Wt at
Weaning
% of cow weight weaned
Carcass Wt Grade YG BF REA
u8082 9 551 1256 44% 1038 Ch- 2 0.4 16.1
Aberdeen Influence ProductionA look at cow and calf
Here is u8082 with her May 2015 calf that produced the above shown performance and harvest values.

Aberdeen Influence ProductionA look at cow and calf
Cow u8190 with calf at about 165 days of age; note this calf’s harvest record.
Cow age
AvgActual WW
Avg Cow Wt at
Weaning
% of cow weight weaned
Carcass Wt Grade YG BF REA
u8190 9 498 1053 47% 871 Ch- 2 0.3 14.6
Cow age
AvgActual WW
Avg Cow Wt at
Weaning
% of cow weight weaned
Carcass Wt Grade YG BF REA
y1019 6 471 1022 46% 899 Ch+ 3 0.6 13.2
Aberdeen Influence ProductionA look at cow and calf
y1019:1022 pound cow produces carcass that weighs 899 pounds at harvest.

Avg Cow Wt at
Weaning
Carcass Wt
% of cow weight
harvested
s6266 1139 793 70%u8054 1237 943 76%u8082 1256 1038 83%u8190 1053 871 83%u8302 1162 868 75%x0271 1181 910 77%x0298 1100 921 84%y1002 1070 996 93%y1019 1022 899 88%y1027 984 684 70%
Aberdeen Influence Production(Average of 8 years data)
GroupAverage
Cow weight: 1120 poundsCarcass weight harvested: 891 lbs% Cow Weight harvested: 80%
A Discussion On Cattle Size by Kris Ringwall, Ph. D. 51
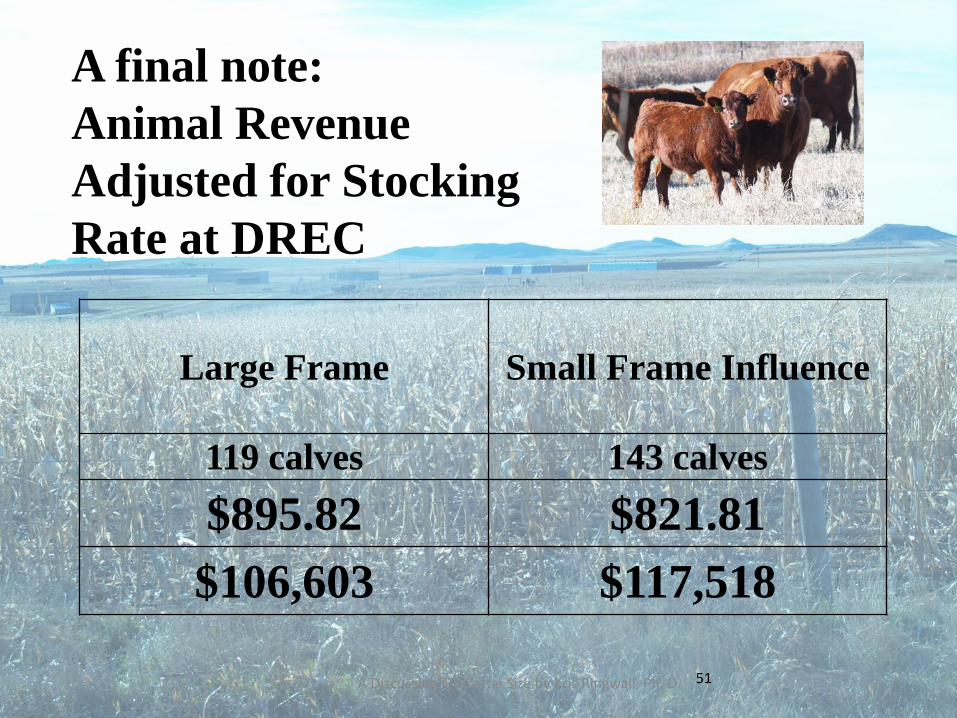
A final note:Animal RevenueAdjusted for StockingRate at DREC
Large Frame Small Frame Influence
119 calves 143 calves$895.82 $821.81
$106,603 $117,518

Aberdeen Influence Production
Y1002: What A Cow1070 pound cow
Carcass weight: 996 lbs93% of cow weight harvested
Choice, YG215.4 sq. in. REA
WOW!
Thank youfor your interest and your dedicationto growing the beef cattle industry!