what is the price elasticity of waiting time for taxis in yaoundé
TRANSCRIPT

What is the Price Elasticity of Waiting Time for Taxis in Yaoundé, Cameroon?
Patrick James Gilmartin
Economics Honors Thesis
Macalester College
Advisor: Raymond Robertson, Economics Department
Submitted on April 28, 2008
Abstract:
One tool used to allocate resources in markets is the auction. If this mechanism is applied in a situation characterized by large numbers of buyers and sellers (to avoid the possibility of single agent having the power to impact prices) then efficient allocation of resources should result, with important implications for welfare maximization. This paper looks at the essentially-deregulated taxi system in place in Yaoundé, Cameroon, which has endogenously developed around a bidding system. The "large number" criterion holds, as does that of a relatively low degree of informational asymmetry between buyer and seller, making the city an interesting case study for the effectiveness of the auction mechanism. Using original survey data collected on taxi trips, I estimate the Price Elasticity of Waiting Time in Yaoundé. These results may inform current understandings of efficient allocation structures of transportation industries and beyond.

Gilmartin 1
Table of Contents
Introduction 2
Literature Review 3
Transportation 3
Auction Theory 7
Theory 9
Analysis – Yaoundé Case Study 12
Background Information 12
Model 17
Summary Statistics 20
Results 23
Conclusions and Future Research 26
Acknowledgements 27
Sources 28
Appendix A: Map of Yaoundé 30
Appendix B: Survey Information 31
Appendix C: Regression Extras 33
Appendix C: Speed Demand 36

Gilmartin 2
Introduction
Transportation is an essential sector in the urban environment, allowing the
operation and development of the city itself. Without a means by which one may
effectively move around in urban space, the benefits of urbanism are reduced or lost. The
world today is becoming increasingly urbanized, particularly in developing countries.
The taxi system in the city of Yaoundé, Cameroon is an interesting case study of
an urban transit system due to several characteristics that distinguish it from systems
found in the United States. The intangible quality that defines the system is the premise
on which it was formed and operates: efficient use of scare resources. Cameroonians say
that they have simply applied the “African” way of doing business to the problem of
modern urban public transportation. Their solution is perhaps best described as paid,
negotiable hitch-hiking.
To ensure wider relevance of any results, I situate this study within the framework
of auctions as market organization mechanisms. I look at a taxi system (or any urban
transit, for that matter) as a means to increase productive time. Time spent standing
around and waiting is wasted time. Time wasted can be considered harmful anywhere.
This is particularly relevant in places where there is much that needs to be done. I seek to
discover how well the auction mechanism works in reducing wasted time.
I ask the question: What is the Price Elasticity of Waiting Time?
Yaoundé also works well as a case study of taxi market deregulation: benefits and
drawbacks found in Yaoundé offer ammunition to both sides of the debate over
regulation. One of the supposed benefits of a deregulated system should be increased
Gilmartin 3
control over one’s transit experience. In Yaoundé, everything is in theory negotiable: the
price, the destination, the route, the comfort, etc. The city therefore provides an
opportunity to measure the supposed benefits. The ability to increase your overall trip
speed (through a reduction in the time spent waiting) by offering more money should be
one of the major benefits of a highly deregulated system.
This paper can serve as a starting point for measuring these benefits. The Price
Elasticity of Waiting Time on the demand side is a necessary piece of information in
measuring overall gains to society. In order to discover the potential drawbacks (or gains)
stemming from regulation, we need to know what welfare gains are possible. With
information on these gains stemming from the functioning (or non-functioning) of the
taxi-ride auction we can make more informed decisions about both urban transit problems
and other situations in which market mechanisms may be changed or improved.
The section after this introduction is the literature review, followed by the theory.
Next is my analysis section, in which I unpack more fully the Yaoundé case study.
Finishing up the paper will be the conclusion.
Literature Review
Transportation Literature
Most authors take a holistic approach to measuring or grading urban
transportation systems. This is done because by its nature transportation demands a multi-
faceted approach; there is no one overriding concern. There are several concerns that are
Gilmartin 4
widely considered to be important, appearing frequently in the literature. The first is
quality service for the customers. This can be measured through waiting time, traveling
speed, cost, variety of options (choice), or accessibility to service. The second is a focus
on the producers and their livelihoods; is the job a viable form of employment? The third
is a focus on safety for everyone; driver, customer, bystander, and other drivers. Most
studies touch upon these concerns, with varying degrees of depth.
The big debate is over regulation, reflected in both academia and the public policy
sphere (Frankena and Pautler; 1984). Do regulated transit solutions or free-market
solutions provide more compelling answers to the concerns above? Most believe that the
answer lies in between the two; both extremes have their benefits and drawbacks. This
section of the literature review will cover (1) the pro-regulation side of the debate and (2)
the pro-free-market side of the debate.
Pro-Regulation in Urban Transit
The arguments for regulation consist of theoretical approaches and case studies.
Shreiber (1981) writes that in free-market situations where there are many taxis, the
increased supply should encourage operators to lower prices to attract more customers.
On the flip side, the fact that customers cannot distinguish between cheap and expensive
taxis (asymmetric information) means that there is essentially no incentive for operators
to actually lower prices. Thus only an increase in fares will increase profits for the
taximen; the incentive is to keep on raising prices. More taxis and more unprofessional
drivers will enter the market in light of these profits and traffic and pollution will result
from the increase in vehicles. The accumulating externalities will lead to a net social loss.
Gilmartin 5
The general point is that a free-market solution both leads to unsustainably high prices
and negative social externalities, all of which can only be overcome through regulation.
Chavez (1992) supports Shreiber in her analysis of the taxis in Lima, Peru. She
finds support for her hypothesis that “the free market…does not guarantee satisfactory
service and it is therefore indispensable to elaborate control measures that will provide a
minimum of security, for both the driver and the user” (247). The palancas, or pirate
taxis, are found to charge high prices (when they can), have unprofessional drivers, and
be dangerous, amongst other bad things. Schkolnik (1992) finds mixed results in Chile
with overall support for Shreiber. Liberalization policies there in the late 1970s did
increase the numbers of taxis and thus decrease the waiting time for customers. However,
the predicted rise in prices never happened and so customers benefited twice, at the cost
of the living standards of the operators. Schkolnik finds that the neither the regulated nor
the free-market approach cannot be done piecemeal; combining free-entry and exit in
Chile with mostly fixed prices had unintended negative consequences.
Pro Free-Market in Urban Transit
The same mix of theory and case-study is found in the free-market literature.
Klein, Moore, and Reja (1997) provide a critique of traditional (regulated) urban transit
with a heavy nod towards Hayek’s theory of time and place knowledge. They note that
top-down transportation planning can never, by design, achieve as high a level of this sort
of knowledge as can individual competing entrepreneurs. They imply that as the role of
regulations, government agencies and centralized planning grows within a system, the

Gilmartin 6
incentive to provide the good (safe, fast, reliable, accessible) service that customers
demand fades and is distorted.
Johnson, Reiley, and Munoz (2005) compare two co-existing, and competing, bus
systems in Santiago, Chile. The two systems differ in terms of driver compensation. One
system runs on a fixed-wage system (prevalent in the US) and the other compensates
drivers based on the number of passengers they transport (thus providing incentives to
carry as many passengers as is possible). They find that the incentive-based system
provides faster and more efficient service, but at the same time is less comfortable and
less safe.
The common quality that exists in most of these papers is their holistic and
somewhat undisciplined approach to grading regulated versus deregulated urban transit.
This paper is intended to begin a welfare oriented approach: by looking at the gains to
society one can more clearly understand the implications of different types of regulations.
I look at the gains to society in terms of time, which these papers do not do
The problem with looking at regulated systems and their particular mechanisms of
regulation (as some of these papers do) is that you cannot measure welfare losses
resulting from said regulations because you do not know what the potential welfare gains
are. Vernon Smith (1962) defined “allocative efficiency of markets as the total profit
actually earned by all the traders divided by the maximum total profit that could have
been earned by all the traders (i.e. the sum of producer and consumer surplus)” (in Gode
and Sunder; 1993). In order to achieve some reasonable level of allocative efficiency, the
Gilmartin 7
mechanism organizing a market must be well-suited for the task. I continue this literature
review with a discussion of the mechanism driving forward my case study: the auction.
Auction Theory Literature
There has been a great deal of discussion and thought in economics concerning
the mechanisms through which we ought to organize allocation of resources. Neoclassical
economics tells us that under certain assumptions the unrestrained market in a state of
perfect competition is generally the way to optimize producer and consumer surpluses
and thus optimize societal welfare.
The price mechanism comes with a question: how do we arrive at a certain price?
Much commerce today is conducted, in admittedly imperfect markets, with prices fixed
by producers. The major alternative to fixed prices is negotiable pricing. Auction theory
plays a major role in the literature concerning negotiable pricing; it covers the various
means by which price negotiations can occur and the theoretical results. The taxi market
in Yaoundé can be fitted into the wider framework of auction theory. Despite the short
time frame in which negotiations occur, an auction mechanism is essentially at work in
determining the allocation of resources.
This paper is based on the premise that the taxis in Yaoundé have organized their
business around the concept of a double auction. 1 The buyer, trying to secure an offer of
a taxi ride in the shortest amount of time possible, adjusts her bid. The seller, trying to
1 The most common perception of the auction is that buyers compete with each other and thus bid up the price. This is called a demand auction. By contrast, an auction in which producers compete with each other to offer the lowest price is called a supply (or reverse) auction. An auction in which both producers and consumers move is called a double auction.
Gilmartin 8
secure business while minimizing their opportunity costs of searching time, adjusts what
is essentially an unspoken reserve price.
There has been both theoretical and experiment-based research on double
auctions. Sutterthwaite and Williams (2002) prove that, in what they call “least favorable
trading conditions” and even with a finite number of traders, the double auction
mechanism is the least inefficient of all possible mechanisms. Jackson and Swinkels
(2005) show that as the number of traders increases (and theoretically approaches
infinity), positive-quantity trade equilibrium exists.
There are debates over the nature of the double auction. Gode and Sunder (1993)
asserted that the continuous double auction generates “efficient allocations” even if there
is no rationality on the part of traders. Gjerstad and Shachat (2007) take issue with the
budget-constraint assumption made by Gode and Sunder, claiming that in making an
impractical assumption that the “buyer’s currency never exceed her value for the
commodity”, they in effect “force rationality” onto their supposed “Zero-Intelligence”
traders.
Much of the research has been based on controlled experiments. List (2004) runs
controlled tests on naturally occurring sports card and collector pin markets. He finds that
particularly in mature double auction markets, agreed-upon contracted prices and
quantities rapidly achieve levels that would be predicted by neoclassical theory in a state
of perfect competition. Secondly, he finds that market composition impacts rent results:
the gender of the traders matters, for example. Finally, he finds that experience of the
individual trader is an important factor in determining the distribution of rents:
experienced agents earn more. In other words, one can learn to play the game.

Gilmartin 9
Shubik (2003) discusses results from classroom experiments run at Yale in which
he tested inexperienced traders (students) in a simple double auction game. He noted,
after 20 years of repeated experiments, that “it has been a source of wonder as to how this
simple mechanism forms a price that is quickly close to the theoretical competitive price”
(3). He also found that the quantity traded was often lower than theory would predict.
Theory
Building off of the theoretical results and propositions in the literature, I treat the
completely deregulated taxi market as a double auction for useful, productive time.
Buyers (customers) want to reduce their waiting time and are willing to pay more money
to do so. Sellers (taximen) want to reduce their idle time or spare capacity (which both
come with certain opportunity costs) and are willing to accept less money for their
services to do so.
The literature proposes that, even on a small scale, double auctions are the
mechanism best suited for creating markets exhibiting the characteristics of perfect
competition. Therefore I begin with a neoclassical market for useful time.
Figure 1

Gilmartin 10
With certain pieces of information, we can measure the overall gains to society in
terms of useful time that result from this double auction market structure. If we assume
demand and supply preferences (in the form of information on their elasticities) to be
relatively constant and we know information about the equilibrium point (which, as per
Jackson and Swinkels (2005), exists for double auctions), we can plot out the exact
supply and demand curves.
We will be then able to calculate the respective producer and supplier surpluses
(in the blue and yellow areas in Figure 2) and sum them to find the overall gains to
society that result from the double auction structure.
Figure 2 Figure 3
This paper begins this process by finding one of the necessary pieces of
information: the elasticity information on the demand side (highlighted in Figure 3). If
we were to know (additionally) the elasticity information for the supply side (for
example, through a controlled experiment such as those in List (2004) or Shubik (2003))
and we were to know the equilibrium point (the “useful time at stake” at any moment and
the average price) we could estimate the total gains to society.
At this point it would be possible to run simulations to find what kind of losses
would be incurred through various distortions and forms of regulation.

Gilmartin 11
Figure 4
For example, a very common form of regulation in developed country markets is
the price floor or set price (plus tip). This is often done to protect producers or to create a
“living wage.” However, in this market it results in a surplus of available useful time, as
well as deadweight loss split between the producers and consumers. Figure 4 shows the
deadweight loss (in green) resulting from such a form of regulation, as well as the
transfer of surplus from consumer to producer (in blue). It also shows the potential loses
to the producer surplus (in orange) that may result depending on the production decisions
made. We cannot, however, measure these losses in any market without knowing first the
possible total surpluses, as shown above in Figure 2.
While the theoretical approach of applying neoclassical markets and regulation
simulations in terms of useful time offers a more disciplined method of measuring
regulation and deregulation effects in terms of societal welfare, it is not perfect. Negative
externalities are not taken into account, such as pollution and smog resulting from the
vehicles, nor are the frustration and inefficiencies that traffic congestion can cause.

Gilmartin 12
Analysis – Yaoundé Case Study
Background Information
An understanding of the Yaoundé taxis must go hand in hand with an
understanding of the context in which they operate. Cameroon is a low-income country
with a human development index of 0.532 (UNDP; 2008). The GDP/capita with
Purchasing Power Parity is $2,060 US; without PPP, it hovers around $990 (World Bank;
2008). The capital city reflects well situations and trends evident in the rest of the
country. Many of Yaoundé’s characteristics must seem vaguely “African” to outsiders:
huge, sprawling, dusty, black and poor. Set in a hilly, cool region in the center of the
country, Yaoundé is a city of over one and a half million inhabitants living mostly in
slum or near-slum conditions that has been growing at a large 6.8 % each year
(Communauté Urbaine de Yaoundé; 2001). In the dry season the dust causes health
problems and in the rainy season there are frequent floods. Residents are more concerned
with problems such as this flooding than they are with public transportation. A citywide
survey in 2002 found that 17% of complaints were related to a lack of security and 11%
were related to flooding; in contrast, only 2% were directed at the “quality of public
transport” (INS; 2002). This implies that relative to other services in the city, transport
seems to work.
And transport really needs to work in Yaoundé. With an area of 252 square
kilometers (Communauté Urbaine de Yaoundé; 2001) built on hills, the city is not a
“walking city”. Thus it is appropriate that cars provides most cross-town transport; urban

Gilmartin 13
sprawl is strongly connected to the use of automobiles (Glaeser and Kahn; 2003).
Furthermore, capable drivers and private vehicles are rare: only 11.6% of households
owned vehicles and there were just over 15,000 drivers licenses granted in the year 2000
for the entire Centre Province, which Yaoundé demographically dominates (INS; 2002).
The average (and poor) resident of Yaoundé needs some means to traverse the
city. The consequences of public transport failures have been documented to a degree in
similar urban situations: a strong potential exists for a poverty trap characterized by lack
of physical and social mobility (Diaz Olvera, Plat, and Pochet; 2003). Yaoundé citizens
are relatively satisfied with their options, as noted earlier.
The average resident of the city needs to walk approximately five to eight minutes
to reach a paved road more regularly served by transit options (INS; 2002). Ngandeu
(2006) finds that 82% of residents in one borough of the city regularly make this walk,
from residence to roadside gathering point; furthermore, he finds that the state of these
paved roads are often mediocre at best, lacking government investment in upkeep. The
transit options available at the roadside vary widely. There is a new fixed-price bus
system (run by an American company) with several routes in the Central Business
District. On the city outskirts and on the bad roads, motorcycle taxis provide service
(operating using a double auction mechanism). Commuters from the suburban areas to
the Central Business District are served by Cars Périphériques, crowded minivans
running on fixed routes with fixed pricing structures (Ngandeu; 2006).
By and large, however, it is the taxis which move people around Yaoundé.2
2 I have no official statistics on this; instead I draw inferences based on a) awareness of lack of personal means of transport (as per INS statistics), b) awareness of small scale of bus and motorcycle operations and c) personal experience in the city.
Gilmartin 14
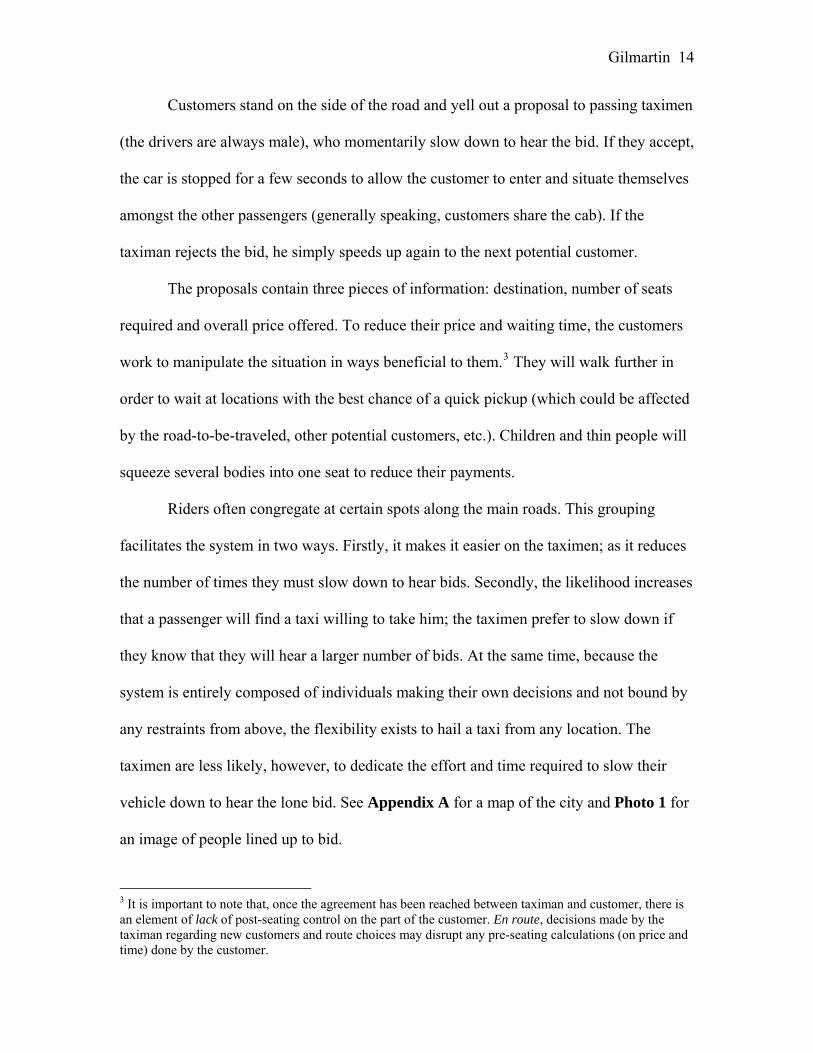
Customers stand on the side of the road and yell out a proposal to passing taximen
(the drivers are always male), who momentarily slow down to hear the bid. If they accept,
the car is stopped for a few seconds to allow the customer to enter and situate themselves
amongst the other passengers (generally speaking, customers share the cab). If the
taximan rejects the bid, he simply speeds up again to the next potential customer.
The proposals contain three pieces of information: destination, number of seats
required and overall price offered. To reduce their price and waiting time, the customers
work to manipulate the situation in ways beneficial to them.3 They will walk further in
order to wait at locations with the best chance of a quick pickup (which could be affected
by the road-to-be-traveled, other potential customers, etc.). Children and thin people will
squeeze several bodies into one seat to reduce their payments.
Riders often congregate at certain spots along the main roads. This grouping
facilitates the system in two ways. Firstly, it makes it easier on the taximen; as it reduces
the number of times they must slow down to hear bids. Secondly, the likelihood increases
that a passenger will find a taxi willing to take him; the taximen prefer to slow down if
they know that they will hear a larger number of bids. At the same time, because the
system is entirely composed of individuals making their own decisions and not bound by
any restraints from above, the flexibility exists to hail a taxi from any location. The
taximen are less likely, however, to dedicate the effort and time required to slow their
vehicle down to hear the lone bid. See Appendix A for a map of the city and Photo 1 for
an image of people lined up to bid.
3 It is important to note that, once the agreement has been reached between taximan and customer, there is an element of lack of post-seating control on the part of the customer. En route, decisions made by the taximan regarding new customers and route choices may disrupt any pre-seating calculations (on price and time) done by the customer.

Gilmartin 15
Photo 1
All taxis in the city are used, manual-transmission cars that have been painted
yellow. Toyotas from the early 1990s have the lion’s share; there are also a good number
of Starlets and Nissans from the same time period. Typically, the used cars are well-used:
200 to 600 thousand kilometers (from 120 to well over 300 thousand miles) on each is
not unusual. The condition of the cars ranges from fair to poor. See Photo 2 for an image
of a typical taxi. Dents and major cracks in the windshield are not considered major
problems. Door handles oftentimes either do not work or exist. Sometimes, full windows
are missing; when it rains, water enters the cabin rapidly. To deal with this problem,
sheets of plastic are stretched across and taped to the window, with varying degrees of
effectiveness. Neither maintenance costs nor depreciation costs are built into the business
model of most taxi operators. They are instead focused on breaking even for the day;
drivers speak of frustration stemming from their inability to operate with a longer time
horizon (Gilmartin; 2007). This situation is not unique to Yaoundé; studies of informal
taxi markets elsewhere document similar attitudes towards depreciation (Chavez; 1992).

Gilmartin 16
Photo 2
According to interviews with various taximen and taxi owners, ownership
structures vary. Most taximen operate in a simple daily-rental framework. They pay the
owner a fee, usually about 10,000 CFA francs per day, for use of the car (with an
exchange rate of 500 CFA to the dollar). They must pay this regardless of their earnings
throughout the day. On top of the fee, they must pay for their gas (estimated around
15,000 CFA per day) and any damages incurred. They ferry passengers in 12 hour shifts
under the framework described previously: any earnings above total costs is theirs to
keep, in addition to a small salary they are paid each month. Some taximen own their
vehicles or rent at a reduced rate from a relative. Others are in a buying agreement in
which they will, after a certain amount of time of renting the car from the current owner,
become the new owner (Gilmartin; 2007).
The market can be summarized as follows: there is relatively quick and free entry
and exit from the market (sometimes exhibited in the form of clandos, unofficial and
often spontaneous share taxis that are run by drivers normally outside the taxi system).
The product as discussed in the theory (useful time) is homogenous. Informational
asymmetry is low: neither drivers nor customers are well informed as to traffic conditions
Gilmartin 17
and both are usually equally informed about road conditions, particularly passengers
tracing regular routes. There are a large number of traders on both sides.
Model
As stipulated earlier, the goal for this paper is to estimate demand-side elasticity
information. This information is necessary for estimating total gains to society, which is
in turn necessary for evaluating various regulations in urban transport markets. The first
step is to develop a simple regression model. Drawing on Shaller (1999) who estimates
the fare elasticities for taxicabs in New York City, the elasticity that I aim to estimate is
similar to what is in his paper called “fare elasticity of availability” Shaller uses a log-log
model and a dependant variable measuring the “availability of cabs.”4 I look instead at
the demand side, examining the time spent waiting by the customers.
Useful time gained is a function of the waiting time experienced by the customer,
which is in turn a function of the price offered, controlling for other factors which may
influence the taximan’s decision to pick them up:
Useful Time = f (Waiting Time)
Waiting Time = f (Price, Control Variables)
These control variables can vary widely. I use three principal models, differentiated by
the number of control variables included:
Wait = f (Price per Mile, Traffic Conditions, Road Quality, Space in Car)
4 This variable is measured with the number of miles spent cruising for passengers (this implies that he is working more on the supply side, measuring the opportunity costs of drivers). Because Shaller is dealing within a regulated framework, a (presumably exogenous) fare increase increases “availability” because few customers are willing to pay the higher cost for the taxi trip.

Gilmartin 18
Wait = f (Price per Mile, Traffic Conditions, Road Quality, Space in Car, Nationality,
Day of Week)
Wait = f (Price per Mile, Traffic Conditions, Road Quality, Space in Car, Nationality,
Day of Week, Size of Group Traveling)
For specification, the primary concern is to find a presumably constant elasticity
measuring the relationship between price and wait time. Therefore a semi-log model
seems to be the most suitable specification form to use:
lnWAIT = α + β1lnPRICEMILE + β2TRAFFIC + β3ROAD + β4PPLTAKEN (1)
lnWAIT = α + β1lnPRICEMILE + β2TRAFFIC + β3ROAD + β4PPLTAKEN +
β5AMERICAN + β6OTHNONCAM + β7MON + β8TUES + β9WED+ β10THURS +
β11FRI + β12SAT (2)
lnWAIT = α + β1lnPRICEMILE + β2TRAFFIC + β3ROAD + β4PPLTAKEN +
β5AMERICAN + β6OTHNONCAM + β7MON + β8TUES + β9WED+ β10THURS +
β11FRI + β12SAT + β13GROUP (3)
The estimation of these models with OLS should yield, importantly, the price
elasticity of waiting time. Table 1 summarizes the expected signs on the coefficients on
all models. The β1 coefficient is the one which primarily interests us: theory predicts that
it be negative to show that as price offered goes up, wait time goes down. The second two
coefficients, β2 and β3, are predicted to be positive. Both are subjective “grades” given to
those exogenous conditions during the trip, on a scale from 1 to 5 (1 being the best). Thus
as their numbers go up, we would expect waiting time to go up. The coefficient on
“people taken already by taximan,” β4, ought to be positive as well. This variable offers a

Gilmartin 19
measurement of the space in the cab. The higher the number, the less space in the cab and
so the less likely the taximan is to pick up a new customer.
Models two and three are less parsimonious but may nevertheless offer insights
into our subject. β5 and β6 are intercept dummies for nationalities other than
Cameroonian. These variables are designed to capture some of the effects of operating in
familiar territory and looking like a local. Their predicted signs, particularly on β5 (the
American dummy), would be negative as, controlling for price (which we would expect
to be higher on average), such passengers might stand out more than most Cameroonians
and therefore offer a diversion (for example, a promise of an interesting conversation or
the possibility of a tip) to the taxi drivers. β7 through β12 are intercept dummies relative to
Sunday and their expected signs are unknown: one might speculate that weekdays are
busier (in terms of other traders, traffic, etc.) and thus might be associated with longer
wait times. β13 should be negative: a larger group size combined with the price offered
per mile (per person) means larger overall revenue for the driver for the service. One
would expect the drivers to seek to maximize the number of people they are carrying at
all times; taking groups of customers offers an easy way to do that.
Table 1 Expected Signs: β1 ( - ) as more money is offered, less wait time β2 ( + ) as traffic gets worse, waiting times increase: cars move slowly β3 ( + ) if the road to-be-traveled is bad, taximen will avoid it β4 ( + ) the more empty seats, the more likely cab is to pick one up β5-β6 ( - ) controlling for price, possibility of tip or conversation β7-β12 ( ? ) unknown effect, possibly negative on weekends β13 ( - ) the bigger the group traveling, the more potential one-time revenue for cab

Gilmartin 20
Summary Statistics
The data were collected through a survey distributed primarily at the University of
Yaoundé I during the week of May 8th through the 16th, 2007. George Fonkeng, a
research methods professor at the University of Yaoundé I, graciously allowed use of his
Tuesday and Wednesday morning classes. Trip information survey forms were
distributed and explanations given in French and English to about 350 students in the two
classes. These classes, combined with the Dickinson-in-Cameroon study abroad program
members, made for a data set comprising 750 trip observations from 316 participants
representing six nationalities (but overwhelmingly Cameroonian). The average age of the
respondents was 26.3 years old and the vast majority were Francophone (French being
the contact language of the city). Relevant statistics are reproduced below in Table 2,
containing number of observations, means, standard deviations and ranges.
Ideally, it would be possible to collect data on all possible factors influencing the
taximan’s decision to pick up a passenger. The taximan’s particular knowledge of the city
is one such factor. Does he even know of the proposed destination? If not, he will reject.
The weather, the quality of the taximan’s vehicle and existence of police checkpoints
along the route (with varying degrees of potential hassle) would all be relevant and useful
for the model. The popularity of the destination would be important; the taximen
certainly take into account the possibility of future customers when they make their
decisions. The data used in this paper is limited to 1) what was possible to place on the
survey and to be reasonably filled out while in a taxi and 2) the quality of the resulting
data. For example, the survey did try to capture the “popularity” effect but the results
Gilmartin 21
were unreliable (some participants used a ranking system while others guessed at a
number of potential customers).
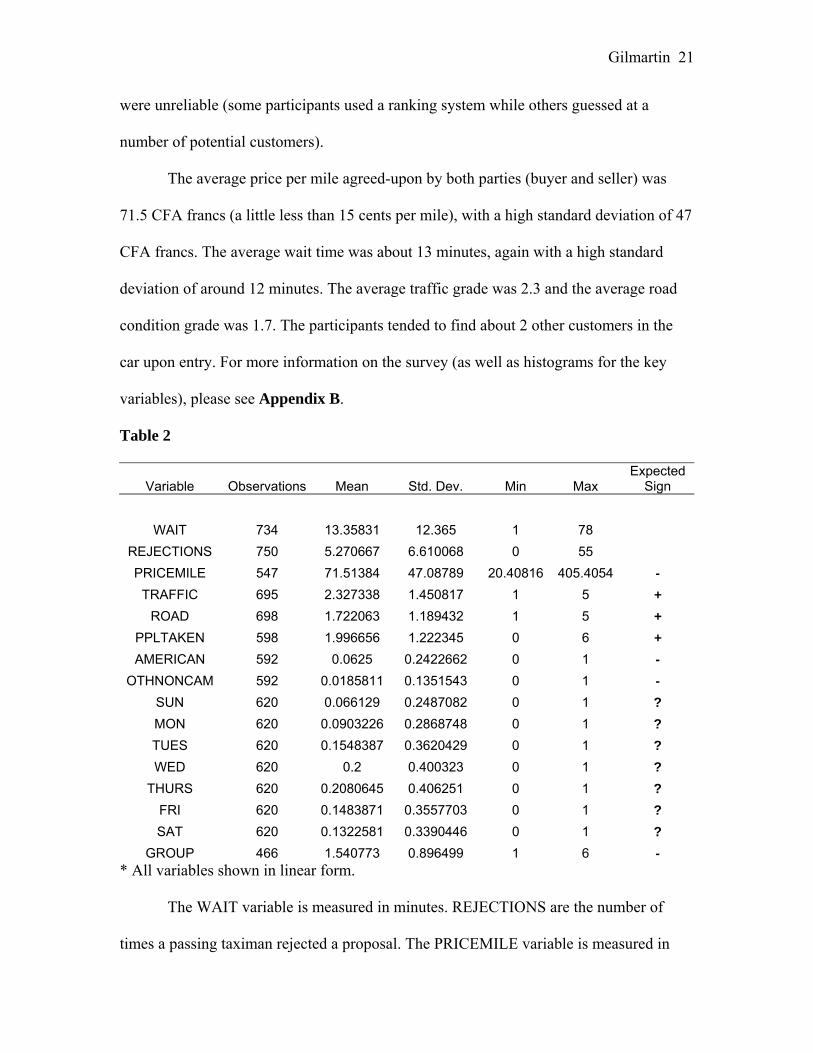
The average price per mile agreed-upon by both parties (buyer and seller) was
71.5 CFA francs (a little less than 15 cents per mile), with a high standard deviation of 47
CFA francs. The average wait time was about 13 minutes, again with a high standard
deviation of around 12 minutes. The average traffic grade was 2.3 and the average road
condition grade was 1.7. The participants tended to find about 2 other customers in the
car upon entry. For more information on the survey (as well as histograms for the key
variables), please see Appendix B.
Table 2
Variable Observations Mean Std. Dev. Min Max Expected
Sign
WAIT 734 13.35831 12.365 1 78
REJECTIONS 750 5.270667 6.610068 0 55 PRICEMILE 547 71.51384 47.08789 20.40816 405.4054 -
TRAFFIC 695 2.327338 1.450817 1 5 + ROAD 698 1.722063 1.189432 1 5 +
PPLTAKEN 598 1.996656 1.222345 0 6 + AMERICAN 592 0.0625 0.2422662 0 1 -
OTHNONCAM 592 0.0185811 0.1351543 0 1 - SUN 620 0.066129 0.2487082 0 1 ? MON 620 0.0903226 0.2868748 0 1 ? TUES 620 0.1548387 0.3620429 0 1 ? WED 620 0.2 0.400323 0 1 ?
THURS 620 0.2080645 0.406251 0 1 ? FRI 620 0.1483871 0.3557703 0 1 ? SAT 620 0.1322581 0.3390446 0 1 ?
GROUP 466 1.540773 0.896499 1 6 - * All variables shown in linear form.
The WAIT variable is measured in minutes. REJECTIONS are the number of
times a passing taximan rejected a proposal. The PRICEMILE variable is measured in

Gilmartin 22
CFA units: in May 2007, the exchange rate was about 500 CFA to 1 US dollar. TRAFFIC
and ROAD are subjective grades from 1 to 5, with a score of 1 being the best. TRAFFIC
of 5 implies terrible traffic; ROAD of 5 implies a bad road. PPLTAKEN are the number
of people that were already in the taxi car at the time the survey participant entered.
AMERICAN and OTHNONCAM are intercept dummy variables containing
information about the participant’s nationality. An OTHNONCAM value of 1 represents
a other non-Cameroonian participant (not an American). MON, TUES, etc. are intercept
dummy variables representing the day of the week on which the trip was taken. GROUP
is the size of the group traveling.
One issue in the data comes with the bidding system. A price elasticity of waiting
time is implied in the existence of the system and so the customers in Yaoundé frequently
change their bids after a number of rejections in order to increase their chances of being
picked up. Customers attempt to exploit the price elasticity of waiting time by changing
their bids; in the survey, in 27% of the recorded trips the participants increased their bid
after one or more rejection. I have recorded data on the different proposals and the
corresponding number of rejections for each. The challenge is to come up with a good
way to measure the degree to which the customer attempts to exploit the elasticity. For
the time being, this problem is circumvented by restricting the data set (with a
corresponding reduction in number of observations) to those trips in which the first and
last proposals have the same value: the customer held their ground in the bidding and
“did not budge”.
Gilmartin 23
Results
The results for estimating regression (1) provide us with the price elasticity of
waiting time. All of the signs are as theory predicts. The most important independent
variable, lnPRICEMILE, is highly statistically significant and has a coefficient value of
(-0.31), implying a 0.31% drop in minutes of waiting time for every 1% increase in the
price offered per mile. Of the control variables, TRAFFIC is significant while ROAD and
PPLTAKEN are not; all three have the predicted signs.
The results for regressions (2) and (3) are widely statistically insignificant. Only
TRAFFIC and AMERICAN are statistically significant at the 95% level. In fact, the 95%
confidence intervals for each of the coefficients on every other independent variable
include zero. A major possible reason for this lack of statistical significance is a
specification error in terms of independent variable choice. It is not clear that the specific
day of the week affects the operation of the market. It is also not clear that taximen
believe that large one-time revenue hauls are the best way to maximize their rents.
For robustness checks, I run the regression (1) in non-logged linear specification
three times. The first time, I have WAIT as the dependant variable. The second time,
REJECTIONS is the dependant variable. REJECTIONS theoretically is strongly and
positively correlated with WAIT. As rejections increase in number, so should wait time.
The third time, REJECTIONS is again the dependant variable, but TRAFFIC is taken out
to reflect the possibility that it does not theoretically cause more rejections. I also test
regressions (2) and (3) linearly using WAIT as the dependant variable. In all of these
regressions, the expected signs stay the same.
Gilmartin 24
WAIT = α + β1PRICEMILE + β2TRAFFIC + β3ROAD + β4PPLTAKEN (4)
REJECTIONS = α + β1PRICEMILE + β2TRAFFIC + β3ROAD + β4PPLTAKEN (5)
REJECTIONS = α + β1PRICEMILE + β2ROAD + β3PPLTAKEN (6)
WAIT = α + β1PRICEMILE + β2TRAFFIC + β3ROAD + β4PPLTAKEN +
β5AMERICAN + β6OTHNONCAM + β7MON + β8TUES + β9WED+ β10THURS +
β11FRI + β12SAT (7)
WAIT = α + β1PRICEMILE + β2TRAFFIC + β3ROAD + β4PPLTAKEN +
β5AMERICAN + β6OTHNONCAM + β7MON + β8TUES + β9WED+ β10THURS +
β11FRI + β12SAT + β13GROUP (8)
The three robustness checks on (1) all seem to indicate the validity of the results.
Across the board, the signs are as theory predicts (with the exception of the statistically
insignificant coefficients on ROAD in regressions (5) and (6)). PRICEMILE is always
significant, which seems to be promising support for the theory put forward. TRAFFIC is
similarly significant in all regressions, and PPLTAKEN becomes significant at a lower
level in regression (6) when TRAFFIC is removed. The F statistics in all cases provides
little reason to worry (except perhaps in the case of (6), when it was a lower 6.18). Again
across the board, VIF and correlation tests indicate little need to worry about
multicollinearity. The results of the regressions are provided in Table 3 and residual
graphs are provided in Appendix C.
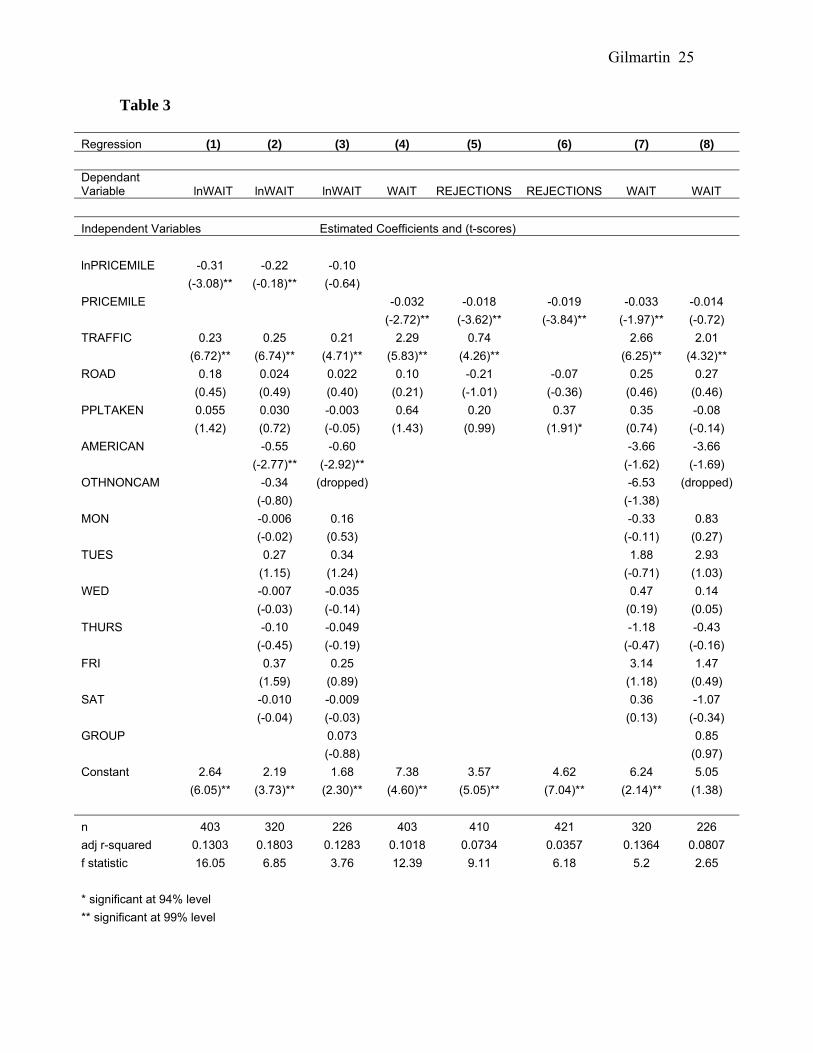
Gilmartin 25
Table 3
Regression (1) (2) (3) (4) (5) (6) (7) (8) Dependant Variable lnWAIT lnWAIT lnWAIT WAIT REJECTIONS REJECTIONS WAIT WAIT Independent Variables Estimated Coefficients and (t-scores) lnPRICEMILE -0.31 -0.22 -0.10 (-3.08)** (-0.18)** (-0.64) PRICEMILE -0.032 -0.018 -0.019 -0.033 -0.014 (-2.72)** (-3.62)** (-3.84)** (-1.97)** (-0.72) TRAFFIC 0.23 0.25 0.21 2.29 0.74 2.66 2.01 (6.72)** (6.74)** (4.71)** (5.83)** (4.26)** (6.25)** (4.32)** ROAD 0.18 0.024 0.022 0.10 -0.21 -0.07 0.25 0.27 (0.45) (0.49) (0.40) (0.21) (-1.01) (-0.36) (0.46) (0.46) PPLTAKEN 0.055 0.030 -0.003 0.64 0.20 0.37 0.35 -0.08 (1.42) (0.72) (-0.05) (1.43) (0.99) (1.91)* (0.74) (-0.14) AMERICAN -0.55 -0.60 -3.66 -3.66 (-2.77)** (-2.92)** (-1.62) (-1.69) OTHNONCAM -0.34 (dropped) -6.53 (dropped) (-0.80) (-1.38) MON -0.006 0.16 -0.33 0.83 (-0.02) (0.53) (-0.11) (0.27) TUES 0.27 0.34 1.88 2.93 (1.15) (1.24) (-0.71) (1.03) WED -0.007 -0.035 0.47 0.14 (-0.03) (-0.14) (0.19) (0.05) THURS -0.10 -0.049 -1.18 -0.43 (-0.45) (-0.19) (-0.47) (-0.16) FRI 0.37 0.25 3.14 1.47 (1.59) (0.89) (1.18) (0.49) SAT -0.010 -0.009 0.36 -1.07 (-0.04) (-0.03) (0.13) (-0.34) GROUP 0.073 0.85 (-0.88) (0.97) Constant 2.64 2.19 1.68 7.38 3.57 4.62 6.24 5.05 (6.05)** (3.73)** (2.30)** (4.60)** (5.05)** (7.04)** (2.14)** (1.38) n 403 320 226 403 410 421 320 226 adj r-squared 0.1303 0.1803 0.1283 0.1018 0.0734 0.0357 0.1364 0.0807 f statistic 16.05 6.85 3.76 12.39 9.11 6.18 5.2 2.65 * significant at 94% level ** significant at 99% level

Gilmartin 26
Conclusions and Future Research
The results of my regression analysis thus far provide support for the existence of
a statistically significant price elasticity of waiting time. Focusing on the results of
regression (1), I estimate the elasticity of waiting time to be -0.31, implying that waiting
time decreases by 31% when the price proposed is doubled. This is the first step in
estimating the overall gains to society stemming from Yaoundé’s adaptation of a double
auction pricing mechanism. It also seems to be quite low and potentially has strong
implications for the policy debate outlined in this paper.
On one hand, this elasticity of -0.31 would lend support to proponents of free-
market systems: it provides a specific numerical estimate of the ability of customers to
personally curtail the transportation service they desire. On the other hand, it is a strong
indication of the poverty of the society; it implies that the demand curve flattens out
quickly, which in turn implies a lack of flexibility on the demand side (most likely, not by
choice). This elasticity also fills a gap in the literature mentioned by Frankena and Pautler
(1984) when they lament the lack of waiting time elasticity estimates.
The most immediate and pressing direction for future research is in simulations.
As outlined in my theory section, with information (derived from experiments/surveys or
hypothetical figures) on the supply-side elasticities and on the equilibrium point, one
could estimate the gains to society in terms of time resulting from Yaoundé’s double
auction market structure. The next step would be to run simulations on various forms of
regulations in order to more accurately estimate and understand the changes and losses to
welfare resulting from these deviations from the neoclassical model.

Gilmartin 27
As mentioned earlier, a variable indicative of the extent to which a customer tries
to exploit the assumed price elasticity of waiting time would be helpful and allow
analysis of the full dataset available. Other aspects of the data set might also be added to
the model and tested, such as time information. Perhaps there is some sort of “rush hour
effect.” It might also be interesting to expand the theoretical model and test the
assumption that traveling time is out of ones control. To test the other side of the induced
time split, traveling time (for which data exists) could be used as a dependent variable (as
opposed to waiting time.) Of course, the resulting model and specification would have to
be altered to reflect this change in focus.
Acknowledgements I would like to thank the following people and groups for their help with this project: Raymond Robertson, the Honors Seminar (particularly Katherine Ollenburger, Kira Vanderwert and Jenny Bendewald), David Chioni Moore, Gary Krueger, Sarah West, George Fonkeng, Teddy Ako, Teku T. Teku, the Tassemo family, the Dickinson-in-Cameroon program (particularly Blair Kauffmann and Lauren Morse), Laney Barhaugh, Emily Gadek, the survey participants, and my taxi drivers (Edwin, Moise and Jean).

Gilmartin 28
Sources Chavez, Eliana. “Consequences of the Legal and Regulatory Framework in Peru’s Taxi
Market.”. In Beyond Regulation: The Informal Economy in Latin America. Edited by Tokman, V. Lynne. Rienner Publishers. Boulder, CO. 1992. pp. 247-275.
Communauté Urbaine de Yaoundé. Plan Guide de Yaoundé. 2001.
Diaz Olvera, L.D., Plat, D. and Pochet, P. “Transportation Conditions and Access to Services in a Context of Urban Sprawl and Deregulation: The Case of Dar Es Salaam” Laboratoire d’Economie des Transports. 2003.
Frankena, Mark and Pautler, Paul. “An Economic Analysis of Taxicab Regulation.”
Bureau of Economics Staff Report. Federal Trade Commission. May 1984.
Gilmartin, Patrick with Blair Kauffmann. Interviews with three taximan and a former owner (Edwin, Moise, Jean and Ako). April 2007.
Gjerstad, Steven and Shachat, Jason. “Individual Rationality and Market Efficiency” Institute for Research in the Behavioral, Economic, and Management Sciences. Paper No. 1204. Purdue University, Indiana. August 2007.
Glaeser, E.L. and Kahn, M.E. “Sprawl and Urban Growth” NBER Working Paper No. 9733. 2003.
Gode, Dhanajay K. and Sham Sunder. “Allocative Efficiency of Markets with Zero- Intelligence Traders: Market as a Partial Substitute for Individual Rationality,” Journal of Political Economy. 1993. 101, pp. 119 – 137.
INS (Institute National de la Statistique). Enquête sur le cadre de vie des populations de Yaoundé et de Douala en 2002 (CAVIE). Volume 2 A: Résultats pour la ville de Yaoundé. Juillet (July) 2003.
Jackson, Matthew and Swinkels, Jeroen. “Existence of Equilibrium in Single and Double Private Value Auctions” Econometrica. Vol. 73, No. 1. Jan. 2005. pp. 93-139.

Gilmartin 29
Johnson, R., Reiley, D.H. and Munoz, J.C. “The War for the Fare: How driver compensation affects bus system performance.” NBER Working Paper No. 11744. 2005.
Klein, DB, Moore, A and Reja, B. Curb Rights: a foundation for free enterprise in urban transit. The Brookings Institution. Washington, D.C. 1997.
List, John. “Testing Neoclassical Competitive Theory in Multilateral Decentralized Markets.” Journal of Political Economy. The University of Chicago. Vol. 112, no. 5. 2004.
Ngandeu, Joseph. La réalité actuelle des transports entre la commune d’arrondissement
de Yaoundé VI et le centre-ville. Mémoire de Maitrise de Géographie at the University of Yaoundé I. Under direction of Fodrouop, Kengne. May 2006.
Satterthwaite, Mark and Williams, Steven. “The Optimality of a Simple Market
Mechanism.” Econometrica, Vol. 70, No. 5. Sep. 2002. pp. 1841-1863.
Schkolnik, Mariana. “The Taxi Market in Chile: Regulation and Liberalization Policies, 1978-1987.. Beyond Regulation: The Informal Economy in Latin America. Edited by Tokman, V. Lynne. Rienner Publishers. Boulder, CO. 1992. pp.207-245.
Shaller, Bruce. “Elasticities for taxicab fares and service availability.” Transportation. The Netherlands. November 1998.
Shreiber, C. “The economic reasons for price and entry regulation of taxicabs: A
rejoinder.” Journal of Transports Economics and Policy. School of Economics and Political Science. London. January 1981.
Shubik, Martin. “A Double Auction Market: Teaching, Experiment and Theory.” Cowles Foundation for Research in Economics. Yale University, October 2003.
UNDP “Cameroon – The Human Development Index.” United Nations Development
Programme. 2005. World Bank. “World Indicators – Cameroon Data Profile” The World Bank Group. 2006.

Gilmartin 30
Appendix A
Map of Yaoundé
Gilmartin 31
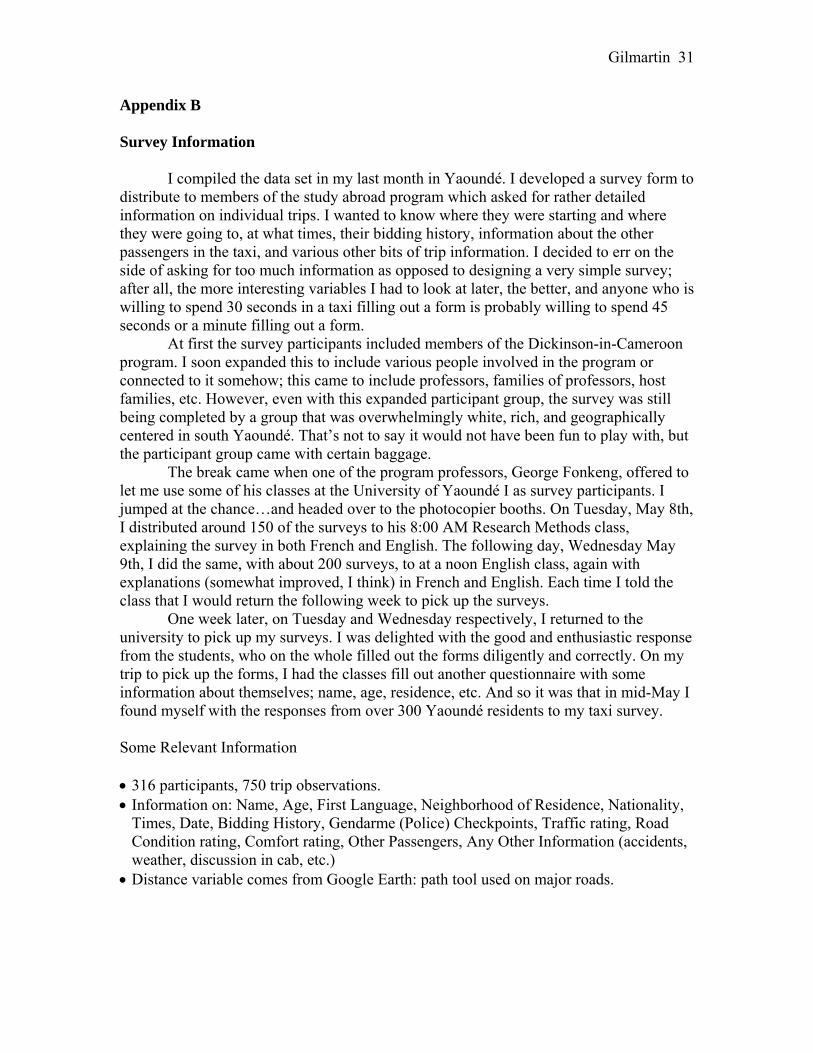
Appendix B
Survey Information
I compiled the data set in my last month in Yaoundé. I developed a survey form to distribute to members of the study abroad program which asked for rather detailed information on individual trips. I wanted to know where they were starting and where they were going to, at what times, their bidding history, information about the other passengers in the taxi, and various other bits of trip information. I decided to err on the side of asking for too much information as opposed to designing a very simple survey; after all, the more interesting variables I had to look at later, the better, and anyone who is willing to spend 30 seconds in a taxi filling out a form is probably willing to spend 45 seconds or a minute filling out a form. At first the survey participants included members of the Dickinson-in-Cameroon program. I soon expanded this to include various people involved in the program or connected to it somehow; this came to include professors, families of professors, host families, etc. However, even with this expanded participant group, the survey was still being completed by a group that was overwhelmingly white, rich, and geographically centered in south Yaoundé. That’s not to say it would not have been fun to play with, but the participant group came with certain baggage. The break came when one of the program professors, George Fonkeng, offered to let me use some of his classes at the University of Yaoundé I as survey participants. I jumped at the chance…and headed over to the photocopier booths. On Tuesday, May 8th, I distributed around 150 of the surveys to his 8:00 AM Research Methods class, explaining the survey in both French and English. The following day, Wednesday May 9th, I did the same, with about 200 surveys, to at a noon English class, again with explanations (somewhat improved, I think) in French and English. Each time I told the class that I would return the following week to pick up the surveys. One week later, on Tuesday and Wednesday respectively, I returned to the university to pick up my surveys. I was delighted with the good and enthusiastic response from the students, who on the whole filled out the forms diligently and correctly. On my trip to pick up the forms, I had the classes fill out another questionnaire with some information about themselves; name, age, residence, etc. And so it was that in mid-May I found myself with the responses from over 300 Yaoundé residents to my taxi survey. Some Relevant Information • 316 participants, 750 trip observations. • Information on: Name, Age, First Language, Neighborhood of Residence, Nationality,
Times, Date, Bidding History, Gendarme (Police) Checkpoints, Traffic rating, Road Condition rating, Comfort rating, Other Passengers, Any Other Information (accidents, weather, discussion in cab, etc.)
• Distance variable comes from Google Earth: path tool used on major roads.

Gilmartin 32
Histograms of Key Variables

Gilmartin 33
Appendix C
Regression Extras
rvfplot – residuals from regression (1)
rvfplot – residuals from regression (2)

Gilmartin 34
rvfplot – residuals from regression (3)
regression fitted plot – lnPRICEMILE and lnWAIT

Gilmartin 35
regression fitted plot – PRICEMILE and WAIT
regression fitted plot – REJECTIONS and WAIT

Gilmartin 36
Appendix D
Theory from the demand side
We begin with a utility function that stipulates that overall utility is derived from a
function of speed in transportation and all other goods.
U = f (Speed, Everything Else)
Then we move on to a budget constraint describing the allocation of available resources
between speed and everything else. The possible distribution amongst the goods is
visually represented by a budget constraint expressed as:
I = PsS + PeE
where I is income, S and E are “speed” and “everything else” respectively, and Ps and Pe
are their respective prices. The income constraint can be rearranged to show the quantity
of speed chosen at differing levels of income, everything else, and respective prices:
S = [I – PeE] / Ps
The consumer spends all income on the two goods because doing so is necessary to
maximize his utility. If the price of speed (Ps) falls, the slope of the budget constraint
falls, representing the increased purchasing power. From the changes in S resulting from
the changes in Ps, we can derive the demand curve for S, the demand for speed:
Ps1
Ps0
S0
S1
Ps
S
Ds
E
S Ps0 Ps1
So S1
U0
U1
To find the utility-maximizing conditions subject to the constraints at hand, we use the
method of Lagrangian multipliers. The Lagrangian model takes into account our utility
function as well as constraints:
L = U(S,E) - λ (PsS + PeE - I)
dL/dS = MUs (S,E) - λPs = 0

Gilmartin 37
dL/dE = MUe (S,E) - λPe = 0
dL/dλ = PsS + PeE – I = 0
Thus we find several conditions that must hold at a utility maximizing state:
MUs = λ Ps
MUe = λ Pe
PsS + PeE = I
We find through the equal margin principle:
MUs/Ps = MUe/Pe
MUsPe/MUe = Ps
Substituting back into the budget constraint, we find the choice of speed based on
everything else when utility is being maximized:
S = (I – PeE) / (MUsPe/MUe)