what makes us happy? - home - drodro.deakin.edu.au/eserv/du:30018722/cummins-survey18-2-2008.pdf ·...
TRANSCRIPT

This is the published version: Cummins,RobertA.andMead,Rohan2008,Whatmakesushappy?,AustralianUnity:DeakinUniversity,Melbourne,Vic.
Available from Deakin Research Online: http://hdl.handle.net/10536/DRO/DU:30018722Reproducedwiththekindpermissionofthecopyrightowner.Copyright:2008,DeakinUniversity&AustralianUnity

Australia’s fi rst and foremost guide to wellbeing
TheAustralian
UnityWellbeing
Index
happy?what makes us

Welcome to the inaugural edition of What makes us happy? This report shares with you the key fi ndings from
seven years of research into the lives and happiness of the Australian population.
A partnership between Australian Unity and Deakin University has created the Australian Unity Wellbeing Index.
This is the nation’s most regular and comprehensive measure on how every-day Australians are feeling about
themselves and their lives.
Through regular surveys and special reports, the Wellbeing Index provides insight into what’s making us happy…
or not so happy. It quantifi es the impact that social issues, such as increasing personal debt, are having on our
quality of life.
It’s designed to increase understanding and create awareness of such issues. It can be used to inform decisions
from policy making through to business operations.
We hope that you fi nd this information both interesting and valuable.
Rohan Mead Bob Cummins
Group Managing Director Professor of PsychologyAustralian Unity Deakin University
Greetings to all those interested in Wellbeing
With all the acid, static and negative news dominating the fi rst decade of the twenty-fi rst century, it is most
necessary to strive for balance in life. Equally, it is most necessary for Governments to be aware of the broader
dimensions of the wellbeing of the population and for this to be considered a vital dimension in reviewing
economic activity and output in a modern country such as Australia.
To this end, I commend the importance of the Wellbeing Index and the further research work being
carried out on the simple question ‘What makes us happy?’
Believe it or not, in all of this Australia is playing ‘second fi ddle’ to a tiny Himalayan country known as
The Kingdom of Bhutan. There the Fourth King and now the Fifth King for years have been committed
to developing the concept of Gross National Happiness as part of offi cial policy settings and arising from
deep-seated research as to what really counts and what really works in ensuring wellbeing in Bhutan.
Australia must continue to expand its interface with the whole concept of wellbeing and happiness, it should
adopt Gross National Happiness in a modifi ed form to take account of the complexities of this OECD country.
In all of this, I say Australian Unity and Deakin University have helped point the way and I commend their work.
As a post-script, I hasten to add Gross National Happiness is not all about resting on couches and carpets, dressed
in saff ron robes with incense aroma wafting around the pillars that support the high ceiling, and so forth. Gross
National Happiness is actually a very serious concept that stacks-up and plays a very useful role in the balanced
progress of The Kingdom of Bhutan.
The Hon. Tim Fischer, A.C.
foreword
welcome
2 Australian Unity Wellbeing Report

What makes us happy? 3

06 become a wellbeing
06 - Things you can do to look after your wellbeing
07 - Who is the happiest?
08 introduction08 - What can we learn from
studying happiness?
09 - Wellbeing – what is it?
09 - What’s your Personal Wellbeing Index?
10 wellbeing of Aussies
10 - Is Australia really laughing?
10 - Key changes in wellbeing
11 - Measures of how we’re doing as a nation
12 life in Australia12 - Satisfaction with the
environment
12 - Satisfaction with Government
13 - Satisfaction withsocial conditions
14 - Satisfaction with business
15 - Satisfaction withthe economy
15 - Satisfaction withnational Security
16 money16 - Does money make us happy?
16 - Love vs money
17 - How much money do we need to be happy?
18 - Income security
19 - Personal debt
20 - Money & connection to the community
20 - Consumer Price Index& happiness
21 love and relationships
21 - Getting to the heart of the matter – marriage & happiness
22 - Widows
22 - Singletons
22 - Better to be alone than in a stale marriage
23 - Middle aged people without partners
24 gender24 - Males or females –
who is happier?
24 - Work is key for theAussie male
25 - Diff erences throughthe ages
25 - How safe we feel
25 - Living alone
26 age26 - Happiness can take
time – age & wellbeing
26 - Importance of connectingto others
27 who welive with
27 - Home alone
27 - Full house
27 - Single parents
28 employment28 - Paid work
29 - Job Seekers
29 - Unemployment
30 - Job security – losing a job
31 - Are work & lifereally in balance?
31 - Age & work
31 - Nine to fi ve
31 - I don’t like Mondays
32 - Volunteering – does doing good make you feel good?
33 what makes us feel at home
33 - Does sport still unitethe nation?
34 health34 - If we’re healthy are
we happy?
34 - Major medical conditions
34 - Pain
35 - How body weight tipsthe scales
35 - Marriage & body weight
36 city vs country36 - Rural and regional towns
36 - Which capital cityis happiest?
37 federal electoral divisions
37 - The happiness tally throughout Australia
37 - Lowest scoring electorates
38 caring38 - The low wellbeing
of carers
40 - Depression & stress
40 - Financial security
40 - Health
40 - The caring role
41 home ownership
41 - Dream or nightmare?
42 - Financial strain
42 - Single parents & renting
43 - Where our home is – commuting times
44 pet ownership44 - Pets, security & stress
44 - Pets and human relationships
45 terrorist activity45 - How actively does the
threat of terrorism aff ectour daily lives?
45 - Likelihood of an attackin Australia
45 - The eff ect on happiness
46 - The extra sensitivity of older Australians
46 - Spirituality and religion
47 life events47 - How we respond to happy
and sad events
47 - Age
47 - Income infl uences how we experience life
47 - Gender diff erence
48 happiest and saddest in Australia
48 - Those doing well and those doing it tough
48 - Who has the highest wellbeing?
49 - Who has the lowest wellbeing?
50 theory50 - The theory – homeostasis
50 - The analyses
50 - Presentation and typeof analyses
50 - Research method
50 - Academic rigour
50 - Report organisation
51 - List of previous reports
contents
4 Australian Unity Wellbeing Report

What makes us happy? 5

Our wellbeing is protected by a shield of resources
MAJOR EXTERNAL PROTECTIVE RESOURCES, eg money, relationships
INTERNAL RESOURCES, eg finding meaning for the bad event
Wellbeing
Become a ‘well being’
Every person has a genetic template, which makes us the way we are. This includes determining how intrinsically happy (or grumpy!) we may be.
And while we have this base level of happiness that we’re born with, things in our lives can cause it to fl uctuate – but generally only a little. Similar to how we hold body temperature steady, we also hold our wellbeing relatively steady.
We do this by drawing on a combination of external and internal resources to help us cope when things go wrong. External resources in terms of relationships and money – someone to talk to, or money to pay for the knee operation we need. And internal resources – in terms of personal resilience and fi nding meaning for a bad event. That is, losing a job can be a stressful experience, but if we fi nd meaning in it – “it wasn’t right for me anyway, and the next job will be better”– we manage to cope with the tough situation much better.
It’s only when the challenges in life get too much for our defences that our system for protecting wellbeing fails and our happiness suffers. If this decrease in wellbeing is prolonged and fails to recover – it can result in depression.
So next time something goes wrong, fi nd meaning in it, and call on those close to you to help you through it. This is the best way of looking after your wellbeing. In addition, if you’re able to engineer your circumstances to include the following, you’ll be providing yourself with the best possible defence for strong wellbeing and happiness.
Things you can do to look after your
wellbeing
Connect with family and friends. Spending time with your loved ones will make you happier, healthier and more productive. They’re your best source of support when you need it – so communicate effectively with them. If you have a partner, it’s especially important to invest quality time with them, as they have the strongest infl uence on your happiness.
Watch your spending and save for the proverbial rainy day. Rainy days are when money really counts. It can help you to stay happy when things go wrong, by enabling you to buy assistance to cope with whatever has happened. Happiness through buying new ‘things’ is fl eeting however. Consider seeking fi nancial advice to ensure you have a fi nancially secure future.
Engage in activities that give you a sense of achievement. Feeling that you have achieved something useful or good provides a sense of contentment and drive. If you are not getting this from your job or family, consider becoming a volunteer or taking up a hobby that challenges your mind or body.
Review your home and personal security. Only simple actions are required, such as checking your smoke alarm battery, installing a sensor or upgrading your locks. Also avoid situations that make you feel unsafe, such as walking alone at night.
Find a balance between work and leisure that is right for you. This balance is different for each person – there is no simple formula. And remember it’s ok to feel stressed at times, but if your current balance is putting you into distress, it is time to re-evaluate the balance of activities that make up your life.
Look after your health. Staying healthy is all about balance. Make sure you eat reasonably well, including at least two serves of fruit and fi ve serves of vegetables each day. Be active – even vigorous housework counts. Have regular doctor checks, but if something seems wrong at any time with your health, seek medical advice immediately.
Get involved in your community. Getting to know your neighbours, volunteering, and being involved in local activities are great ways to feel connected. Feeling part of your community enhances your sense of belonging and security.
Keep some of your life simple. Take some time out of your day for personal time. Try concentrating on your breathing for two minutes. It can still your thoughts, bringing a sense of calm and wellbeing.
become a ‘well being’
6 Australian Unity Wellbeing Report

Who is the happiest?
• People tend to get happier as they get older
• Women on the whole, are more satisfi ed with their lives than men
• People who live with their partner are happier, especially married people
• People who volunteer generally report higher levels of happiness
• Happiness generally increases proportionatelywith income, but only up to a household income of around $100,000 where it begins to plateau.
What makes us happy? 7
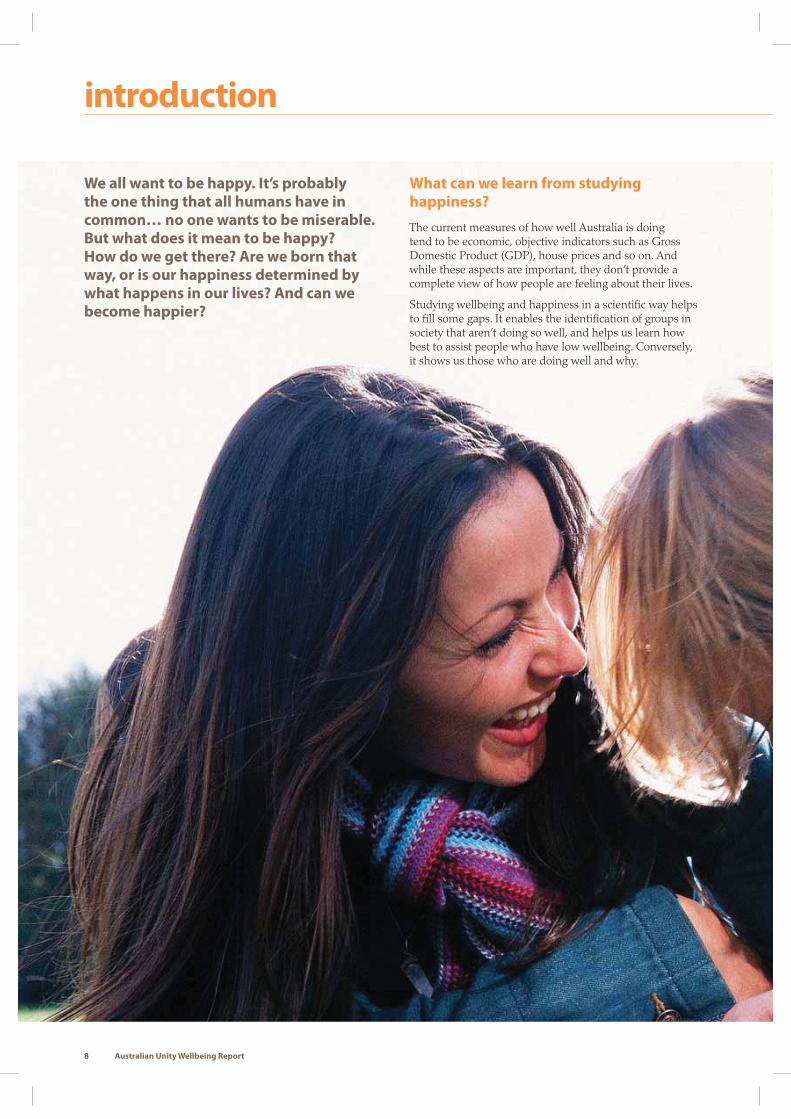
introduction
We all want to be happy. It’s probably
the one thing that all humans have in
common… no one wants to be miserable.
But what does it mean to be happy?
How do we get there? Are we born that
way, or is our happiness determined by
what happens in our lives? And can we
become happier?
What can we learn from studying
happiness?
The current measures of how well Australia is doing tend to be economic, objective indicators such as Gross Domestic Product (GDP), house prices and so on. And while these aspects are important, they don’t provide a complete view of how people are feeling about their lives.
Studying wellbeing and happiness in a scientifi c way helps to fi ll some gaps. It enables the identifi cation of groups in society that aren’t doing so well, and helps us learn how best to assist people who have low wellbeing. Conversely, it shows us those who are doing well and why.
8 Australian Unity Wellbeing Report

Wellbeing – what is it?
The Australian Unity Wellbeing Index measures the ‘subjective wellbeing’ of the Australian population. Subjective wellbeing is a normally positive state of mind. It is a longer-lasting, deeper sense of contentment, as opposed to the momentary joy we experience when laughing at a joke.
This Wellbeing Index is based on the psychological theory of homeostasis – that wellbeing is maintained by an internal system that enables people to keep feeling positive, even when things go wrong.
This self-regulation works automatically in a similar way to body temperature. In-built mechanisms allow our feelings of wellbeing to fl uctuate a little, but it holds relatively steady over time. Failure of this system results in wellbeing falling, and this is what we know as depression. And while happiness and wellbeing have their own unique defi nitions, for the purposes of this report, the term ‘wellbeing’ has been used interchangeably with ‘happiness’, as happiness is term that people can relate to and conceptualise easily.
What’s your Personal Wellbeing Index?
On a scale of 0 to 10, with 0 being very dissatisfi ed and 10 being very satisfi ed, rate how satisfi ed you are with:
� Your health
� Your personal relationships
� Your safety
� Your standard of living
� What you’re currently achieving in life
� Your community connection
� Your future security
� Your spirituality/religion
Add your responses together & divide by the number of questions answered (eight).
Multiply this number by 10 to get your Personal Wellbeing Index (PWI). This is your wellbeing score out of 100. See how you compare to the national average, which hovers around the 75 mark.
To take an online version of the Personal Wellbeing Index, go to: www.australianunity.com.au/wellbeingindex. Tips are also provided at the end of the online questionnaire as to what you should do if you have a low wellbeing score.
What makes us happy? 9

Sept 11Terrorist attacks
(Sep 01)
Pre-Iraq war(Mar 03)
Athens Olympics(Aug 04)
1st Balibombing
(Dec 02)
2nd Bali bombing(Oct 05)
72
73
74
75
76
77
73.2
74.4
75.3
74.4
74.6
75.3
75.9
75.4
75.3
75.6
74.8
76.3
74.6
75.2
74.1
74.5
75.6
75.8
Apr
01
Sep
01
Mar
02
Aug
02
Nov
02
Mar
03
Jun
03
Aug
03
Nov
03
Feb
04
May
04
Aug
04
May
05
Oct
05
May
06
Oct
06
Apr
07
Oct
07
PE
RS
ON
AL
WE
LL
BE
ING
IN
DE
X
SURVEY DATE
Personal Wellbeing Index– Happiness of the Australian population over the years.
Wellbeing Over the Years– The normal range for Wellbeing of the nation.
73.4 points
76.4 points
0
10
30
20
40
50
60
70
80
90
100
wellbeing of Aussies
Is Australia really laughing?
The wellbeing of Australians varies very little over time. However, it is very important to monitor the average level of wellbeing, as this has allowed the development of a ‘normal range‘. This allows the identifi cation of groups who may be more vulnerable to developing depression, with an average wellbeing score that sits below the normal range. Tracking wellbeing at a population level also provides some excellent insights into the impact of major events, such as terrorist attacks on our wellbeing.
Key changes in wellbeing
Both positive and negative events have triggered changes in the wellbeing of the nation.
In terms of negative events, the most obvious trend is the relatively sustained rise in wellbeing following the September 11 terrorist attacks. Peaks also followed the two Bali Bombings and around the time of the Iraq war. While at fi rst this may seem odd, it supports the well-documented phenomenon that people bond with others around them in times of threat.
In terms of positive events, the Athens Olympics took social satisfaction to a record high. This rise however, was short-lived. Survey recordings in the week immediately following the Olympics showed a rapid fall in wellbeing.
The Athens Olympicstook social satisfaction
to a record high.
10 Australian Unity Wellbeing Report

9000
10000
11000
12000
13000
Sep 06Mar 06Sep 05Mar 05Sep 04Mar 04Sep 03Mar 03Sep 02Mar 02Sep 01
55
60
65
70
75
80
85
90
95
100
We
llb
ein
g (
0-1
00
)
GD
P p
er
cap
ita
($
)
GDP per capita vs Personal and National Wellbeing in Australia, 2001-2006
DATE
National Wellbeing IndexPersonal Wellbeing IndexGDP per capita
Measures of how we’re doing as a nation
The traditional view that national wealth is the best way to measure the ‘progress’ and success of a nation is not necessarily the case. Take Gross Domestic Product (GDP) for example.
GDP measures the total value of the goods and services produced within a nation. It is used to measure the progress of a nation and its economy, and therefore often the success of the Government.
But as can be seen, increasing national wealth does not mean increasing national happiness. Australians satisfaction with their lives and life in Australia has remained steady over the past few years despite the increasing national wealth.
Increasing wealth would most likely increase happiness in developing countries, but it does not apply in Australia. It is the distribution of wealth that makes a difference to our quality of life, not the quantity of national wealth. It is through policies that address issues associated with low wellbeing that happiness of the Australian population would increase.
* Graph reproduced with acknowledgement and thanks to the Australian Conservation Foundation.
What makes us happy? 11
55
56
57
58
59
60
61
62
63
57.9
59.9
60.9
59.1
57.9
59.9
59.6
60.4
60.9
59.6
59.8
59.6
59.4
60.8
58.9
58.455
.8
56.0
Apr
01
Sep
01
Mar
02
Aug
02
Nov
02
Mar
03
Jun
03
Aug
03
Nov
03
Feb
04
May
04
Aug
04
May
05
Oct
05
May
06
Oct
06
Oct
07
Apr
07
ST
RE
NG
TH
OF
SA
TIS
FA
CT
ION
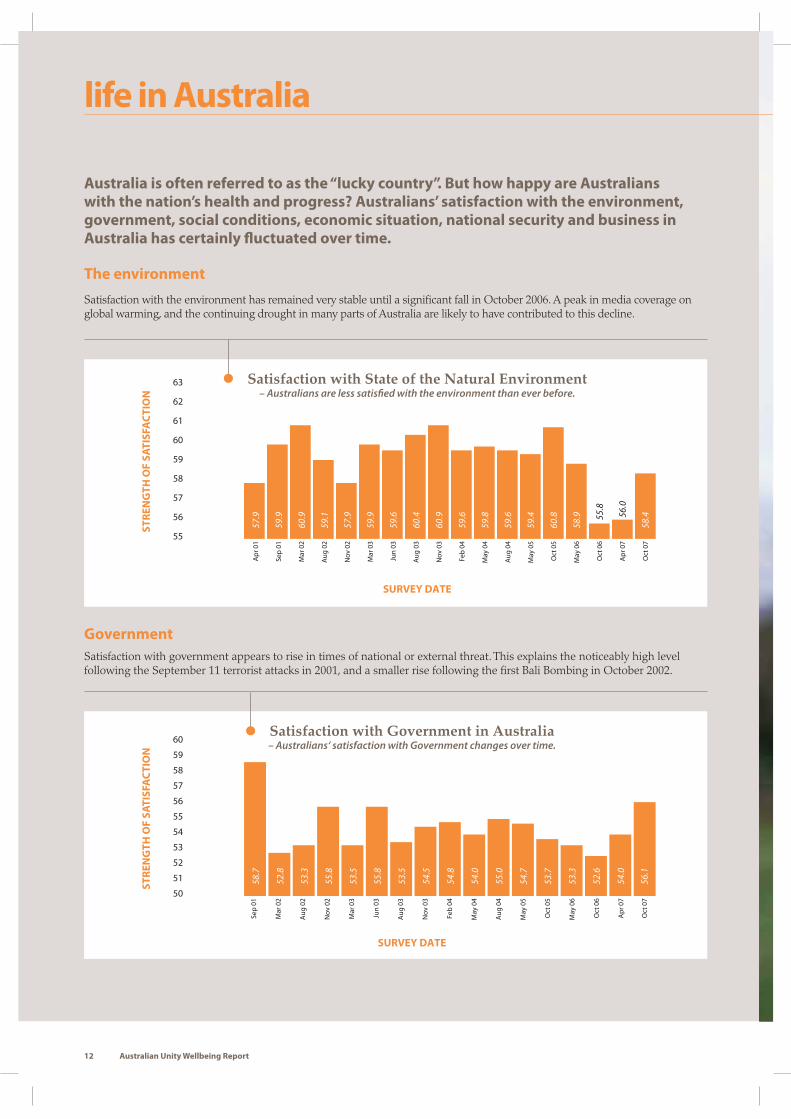
Satisfaction with State of the Natural Environment– Australians are less satisfied with the environment than ever before.
SURVEY DATE
50
51
52
53
54
55
56
57
58
59
60
58.7
52.8
53.3
55.8
53.5
55.8
53.5
54.5
54.8
54.0
55.0
54.7
53.7
53.3
52.6
54.0
Sep
01
Mar
02
Aug
02
Nov
02
Mar
03
Jun
03
Aug
03
Nov
03
Feb
04
May
04
Aug
04
May
05
Oct
05
May
06
Oct
06
Apr
07
56.1
Oct
07
ST
RE
NG
TH
OF
SA
TIS
FA
CT
ION
Satisfaction with Government in Australia– Australians‘ satisfaction with Government changes over time.
SURVEY DATE
life in Australia
Australia is often referred to as the “lucky country”. But how happy are Australians
with the nation’s health and progress? Australians’ satisfaction with the environment,
government, social conditions, economic situation, national security and business in
Australia has certainly fl uctuated over time.
The environment
Satisfaction with the environment has remained very stable until a signifi cant fall in October 2006. A peak in media coverage on global warming, and the continuing drought in many parts of Australia are likely to have contributed to this decline.
Government
Satisfaction with government appears to rise in times of national or external threat. This explains the noticeably high level following the September 11 terrorist attacks in 2001, and a smaller rise following the fi rst Bali Bombing in October 2002.
12 Australian Unity Wellbeing Report

58
59
60
61
62
63
64
59.3
62.5
62.8
62.0
62.6
63.0
62.6
61.9
62.1
61.0
61.3
63.1
61.2
63.1
60.5
60.0
62.0
Apr
01
Sep
01
Mar
02
Aug
02
Nov
02
Mar
03
Jun
03
Aug
03
Nov
03
Feb
04
May
04
Aug
04
May
05
Oct
05
May
06
Oct
06
Apr
07
62.3
5O
ct 0
7
ST
RE
NG
TH
OF
SA
TIS
FA
CT
ION
Satisfaction with Social Conditions– Fluctuations over time.
SURVEY DATE
Social conditions
It’s diffi cult to interpret changes in satisfaction with ‘social conditions’ as people’s interpretation of what this entails could vary considerably. Satisfaction clearly rose following September 11, and again at the time of the Athens Olympics in August 2004. If the fall at Survey 15 in May 2006 refl ected the introduction of the new industrial relations laws that came into effect shortly before the survey, this effect has since dissipated.
What makes us happy? 13
54
55
56
57
58
59
60
61
62
63
64
55.4
59.9
59.3
61.1
58.9
60.9
61.0
61.7
62.0
62.0
63.4
60.5
63.4
62.4
61.3
62.7
Sep
01
Mar
02
Aug
02
Nov
02
Mar
03
Jun
03
Aug
03
Nov
03
Feb
04
May
04
Aug
04
May
05
Oct
05
May
06
Oct
06
Apr
07
64.7
Oct
07
ST
RE
NG
TH
OF
SA
TIS
FA
CT
ION
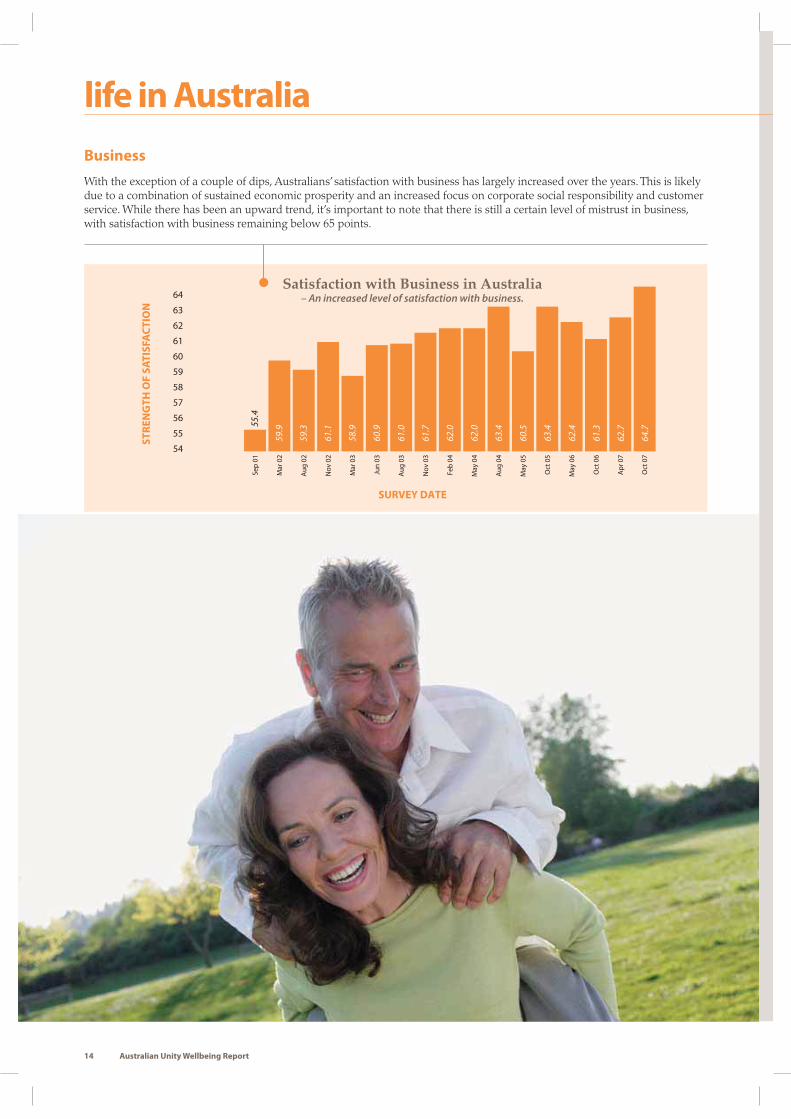
Satisfaction with Business in Australia– An increased level of satisfaction with business.
SURVEY DATE
life in Australia
Business
With the exception of a couple of dips, Australians’ satisfaction with business has largely increased over the years. This is likely due to a combination of sustained economic prosperity and an increased focus on corporate social responsibility and customer service. While there has been an upward trend, it’s important to note that there is still a certain level of mistrust in business, with satisfaction with business remaining below 65 points.
14 Australian Unity Wellbeing Report

Economic Situation in Australia– Strong times keep us happy with the economy.
SURVEY DATE
50
52
54
56
58
60
62
64
66
68
7053
.6
57.8
64 63.9
65 65.4
66.1
65.4
66.6
66.5
66.9
68.5
66.3
66.8
66.1
66.7
68.2
Apr
01
Sep
01
Mar
02
Aug
02
Nov
02
Mar
03
Jun
03
Aug
03
Nov
03
Feb
04
May
04
Aug
04
May
05
Oct
05
May
06
Oct
06
Apr
07
70.9
Oct
07
ST
RE
NG
TH
OF
SA
TIS
FA
CT
ION
55565758596061626364656667686970
57.3
63.3
62.9
61 60.5
65.2
63.6
64.5
64.6
64 66.3
65.1
65.2
65.2
64.5
67.7
Sep
01
Mar
02
Aug
02
Nov
02
Mar
03
Jun
03
Aug
03
Nov
03
Feb
04
May
04
Aug
04
May
05
Oct
05
May
06
Oct
06
Apr
07
69.6
Oct
07
ST
RE
NG
TH
OF
SA
TIS
FA
CT
ION
Satisfaction with National Security– Increased satisfaction with national security.
SURVEY DATE
The economy
Satisfaction with the Australian economy has remained signifi cantly high since March 2002. This refl ects the strong economic times during the period.
National security
Australians are feeling particularly satisfi ed with national security. The dramatic rise of 4.7 percent between March and June in 2003 most likely refl ects the strengthened American alliance due to the Iraq War, and a lack of terrorist activity in Australia.
Australians’ satisfaction with business has largely increased over the years.
What makes us happy? 15

0$15,000 – $30,000 $121,000+$91,000 – $120,000$61,000 – $90,000
HOUSEHOLD INCOME ($’000)
Love vs Money– The power of relationships.
$31,000 – $60,000
10
20
30
40
PE
RS
ON
AL
WE
LL
BE
ING
IN
DE
X
50
60
70
80
75.6 68.5 70.6 76.8 70.6 70.9 76.6 72.2 73.2 78.4 74.5 76.7 78.5 76.469.4
Live Alone With Partner Never Married
71
73
75
77
79
81
71.3
Normal Range
73.4 74.7 76.2 77.7 79.1 79.5 81.1
$500+$251-500$151-250$101-150$61-100$31-60$15-30<$15
ST
RE
NG
TH
OF
SA
TIS
FA
CT
ION
(PW
I)
HOUSEHOLD INCOME ($’000)
Income and Happiness– A clear link between wellbeing and income.
money
81
Income and Happin– A clear link between wellbeing a
Does money make us happy?
Not many questions are debated as much as this one. And unfortunately, the answer isn’t straightforward.
Although happiness increases with income, happiness pretty much hits a ceiling when total household income reaches $101,000-$150,000. While some slight increase takes place with higher incomes, it takes a very large increase to achieve a small gain in happiness. At low incomes, on the other hand, small increases in income produce a noticeable increase in happiness for most people.
Despite wellbeing increasing with income, it is important to note that these are just average results, and that many people manage to maintain normal wellbeing in diffi cult fi nancial circumstances.
For example, couples with a total household income of $15,000-$30,000 have higher wellbeing than someone who lives alone with the same household income. So despite the fact the couple are sharing the same amount of money that the single person has to themself, having a partner has a more powerful infl uence on happiness than the diffi culties of low income.
16 Australian Unity Wellbeing Report

The Cost of Purchasing a Percentage Point of Wellbeing– Money reaches a point of diminishing returns.
CURRENT HOUSEHOLD INCOME
<$15,000
$7,143
$15,000-$30,000
$23,077
$31,000-$60,000
$26,333
$61,000-$100,000
$33,333
$101,000-$150,000
$71,429
$151,000-$250,000
$625,000
The power of money
“ Buying ‘things’ makes us feel good for a moment while they are still new – but we adjust to possessions – and the good feeling disappears very quickly.
The real power of money in our happiness is in its ability to help us pursue core things we need in our lives, such as education. It’s about having enough to cope with things that come up in life, such as illness or a period of unemployment, and this reality reinforces the need to watch our spending and debt levels.
” – Professor Bob Cummins,Author of the Australian Unity Wellbeing Index
How much money do we need to be happy?
Money loses its ability to reliably raise wellbeing beyond a household income of $100,000-$150,000. Beyond this level, wellbeing does not increase in line with increasing income.
However, supposing that it was actually possible to do so, the amount that would be required to ‘purchase’ just one additional point of wellbeing has been calculated.
An additional $7,143 is enough, on average, to raise the happiness of people on a household income of less than $15,000. However, someone with a household income of $151,000-$250,000 would require an additional $625,000 to purchase just one additional point of happiness. Money therefore, reaches a point of diminishing returns or, in economic terms, diminished marginal utility.
money
Money loses it’s ability to reliably raise wellbeing beyond a household
income of $100,000 - $150,000.
What makes us happy? 17

NormalRange
76.4
73.4
64
66
68
70
72
74
76
78
80 Physical painPetrol price distressIncome certainty (reverse scored)
109876542-30-1
78.4
75.8
73.7
74.4
73.9
69.9
67.8
66.364.6
75.974.4
77.176.1
74.475.3 74.7
73.6
72.7
76.4
75.575.2
73.171.9
72.9
70.769.4
68.4
PE
RS
ON
AL
WE
LL
BE
ING
IN
DE
X
Income Uncertainty vs. Petrol Price Distress & Physical Pain– The extent to which income uncertainty takes its toll.
LEVEL OF INCOME UNCERTAINTY (0 is high) AND DISTRESS (10 is high)
60
62
64
66
68
70
72
74
76
78
80
78.4 75.8 73.7 74.4 73.9 69.9 67.7 66.3 64.6
76.4
73.4
10 9 8 7 6 5 4 2-3 0-1
PE
RS
ON
AL
WE
LL
BE
ING
IN
DE
X
The Impact of Income Uncertainty on Wellbeing
DEGREE OF CERTAINTY
NormalRange
money
The Impact of Income Uncertainty on Wellbeing
Income security
When asked to rate how secure they felt their income was on a scale of 0-10, almost 20 percent of Australians rated their income security as fi ve or less out of ten. This level of uncertainty was enough to put the average wellbeing of these Australians below the normal level.
Income Uncertainty vs. Petrol Price Distress & Physical Pain
The survey also revealed that income uncertainty has a more drastic infl uence on wellbeing than distress at rising petrol prices and in some cases, even physical pain. It indicates how close to the fi nancial edge many Australians are living,when insecurity around income has such a profound impact on our wellbeing.
Income uncertainty also has a bigger impact on people with a household income of less than $30,000. Any interruption to their income source could have larger consequences.
18 Australian Unity Wellbeing Report
NormalRange
66
68
70
72
74
76
78
80
74.0
69.7
73.9
68.2
75.0
72.6
76.8
74.3
76.9
74.7
77.5
72.7
77.2
74.1
76.4
73.4
<$15 $15-30 $31-60 $61-90 $91-120 $121-150 >$150
PE
RS
ON
AL
WE
LL
BE
ING
IN
DE
X
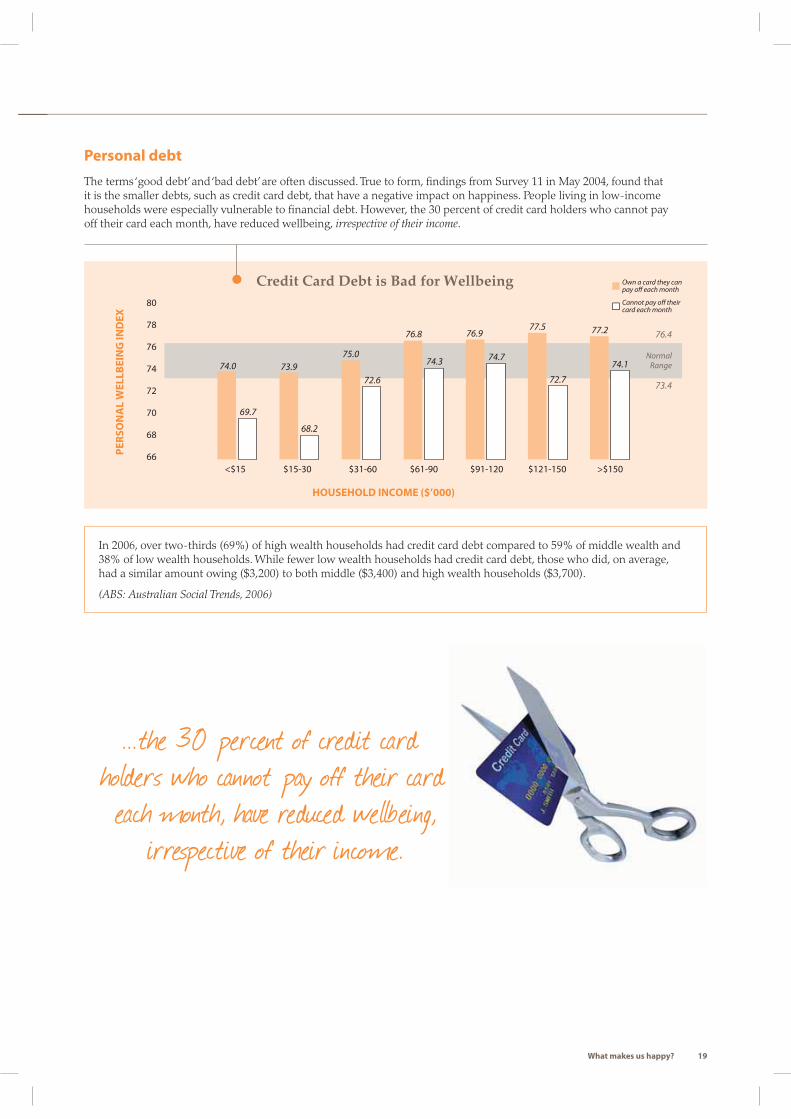
Credit Card Debt is Bad for Wellbeing
HOUSEHOLD INCOME ($’000)
Own a card they can pay off each month
Cannot pay off their card each month
Personal debt
The terms ‘good debt’ and ‘bad debt’ are often discussed. True to form, fi ndings from Survey 11 in May 2004, found that it is the smaller debts, such as credit card debt, that have a negative impact on happiness. People living in low-income households were especially vulnerable to fi nancial debt. However, the 30 percent of credit card holders who cannot pay off their card each month, have reduced wellbeing, irrespective of their income.
In 2006, over two-thirds (69%) of high wealth households had credit card debt compared to 59% of middle wealth and 38% of low wealth households. While fewer low wealth households had credit card debt, those who did, on average, had a similar amount owing ($3,200) to both middle ($3,400) and high wealth households ($3,700).
(ABS: Australian Social Trends, 2006)
...the 30 percent of credit card holders who cannot pay off their card each month, have reduced wellbeing,
irrespective of their income.
What makes us happy? 19
72
73
74
75
76
77 Pesonal Wellbeing Index
-1
0
1
2
3
4
5
6
7
8CPI/Month x 10
73.2
74.4
75.3
74.4 74.6 75.3
75.9
75.4 75.3
75.6
74.8
76.3
74.675.3
74.174.5
75.6
Apr
il 01
Sept
01
Mar
ch 0
2
Aug
02
Nov
02
Mar
ch 0
3
June
03
Aug
03
Nov
03
Feb
04
May
04
Aug
o4
May
05
Oct
05
May
06
Apr
07
Oct
06
4.7
2.5
4.03.2 3.3
6.0
0.0
2.7
2.3
4.3
2.3 2.0
3.32.3
7.5
2.3
-0.2
PE
RS
ON
AL
WE
LL
BE
ING
IN
DE
XC
PI/M
ON
TH
X 1
0
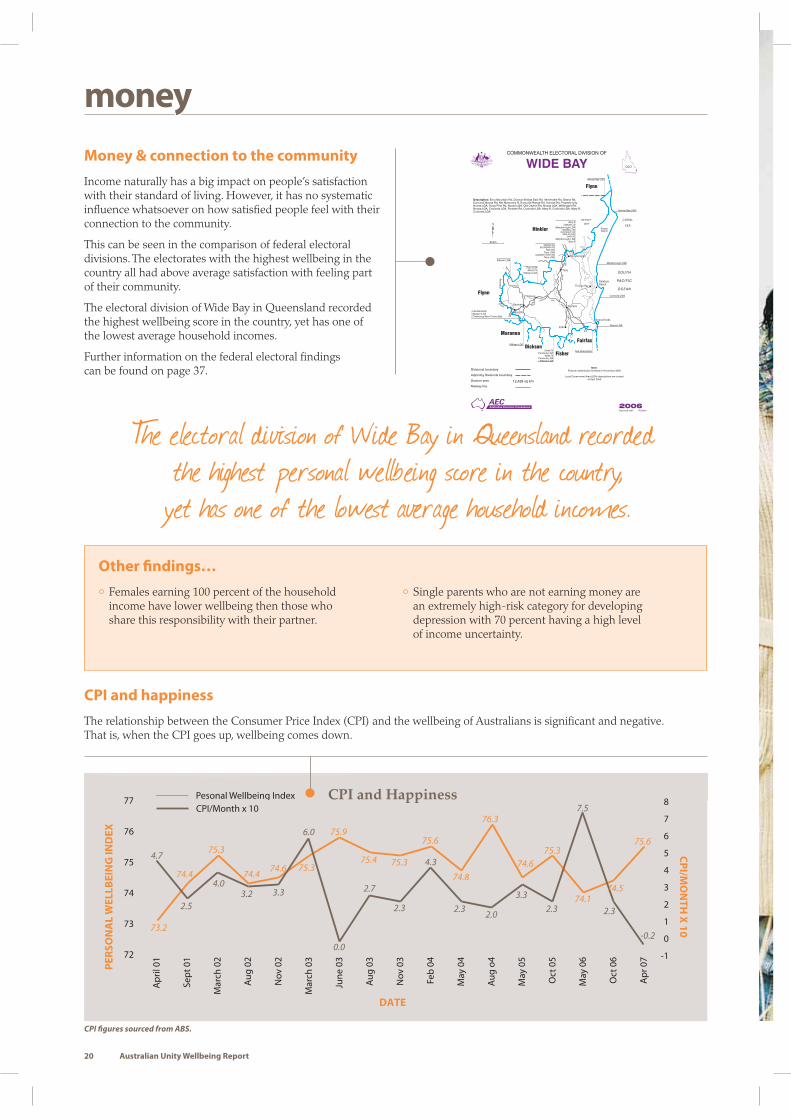
CPI and Happiness
DATE
Money & connection to the community
Income naturally has a big impact on people’s satisfaction with their standard of living. However, it has no systematic infl uence whatsoever on how satisfi ed people feel with their connection to the community.
This can be seen in the comparison of federal electoral divisions. The electorates with the highest wellbeing in the country all had above average satisfaction with feeling part of their community.
The electoral division of Wide Bay in Queensland recorded the highest wellbeing score in the country, yet has one of the lowest average household incomes.
Further information on the federal electoral fi ndings can be found on page 37.
77 Pesonal Wellbeing Index8CPI and Happiness
CPI and happiness
The relationship between the Consumer Price Index (CPI) and the wellbeing of Australians is signifi cant and negative. That is, when the CPI goes up, wellbeing comes down.
CPI fi gures sourced from ABS.
Tin Can BayTin Can Bay
Imbil
GympieGympie
Noosa Heads
KilkivanKilkivan
Goomeri
Tiaro
MaryboroughMaryborough
FraserIsland
CORAL
SOUTH
PACIFIC
OCEAN
SEA
Maranoa
Flynn
Flynn
Hinkler
DicksonFairfax
Fisher
MurgonMurgon
WIDE
BAY HWY
HW
Y
BURNETTBURNETT
HERVEY
BAY
Mary
Barambah
CreekCreek
R
Kilkivan LGA
See Description
Cooloola LGA
Noosa LGA
Sandy Ck
Yabba CkCooloola LGA
Cooloola LGAKilkivan LGA
Hervey Bay LGA
Hervey Bay LGA
Maryborough LGA
RainbowBeach
BRUCE
BRUCE
BR
UC
E
HW
YH
WY
HW
Y
Maryborough LGA
Maryborough LGA
Mary RSaltwater Ck
Mary R
MAXWELL RDBOUNDARY RD
SIMS RD NTHSIMS RD
MEDEW RDBOUNDARY RD
GLENBAR TIARO RD
Rail lineTiaro LGA
Tiaro LGA
Tiaro LGA
Kilkivan LGAMunna Ck
Lake BarambahMurgon LGACherbourg Abor Comm Bdy
Kilkivan LGA
Description: Emu Mountain Rd, Doonan Bridge East Rd, Verrierdale Rd, Deans Rd,Eumundi Noosa Rd, Nth Maroochy R, Eumundi Range Rd, Sunrise Rd, Property bdy,Noosa LGA, Hoop Pine Rd, Noosa LGA, Old Ceylon Rd, Noosa LGA, Wellington Rd,Noosa LGA, Cooloola LGA, Cooloola LGA, Mary R, Cooloola LGA, Mary R,Cooloola LGA
Poulsen Rd,
30 km
Railway line
Divisional boundary
Adjoining Divisional boundary
Division area 12,428 sq km
COMMONWEALTH ELECTORAL DIVISION OF
WIDE BAY
Note:Federal redistribution finalised in November 2006
Local Government Area (LGA) descriptions are currentat April 2006
N
QLD
Reprinted 2007 VC00001
2006
moneymoney
Other fi ndings…
• Females earning 100 percent of the household income have lower wellbeing then those who share this responsibility with their partner.
• Single parents who are not earning money are an extremely high-risk category for developing depression with 70 percent having a high level of income uncertainty.
The electoral division of Wide Bay in Queensland recorded the highest personal wellbeing score in the country, yet has one of the lowest average household incomes.
20 Australian Unity Wellbeing Report
66
68
70
72
74
76
78
80
NormalRange
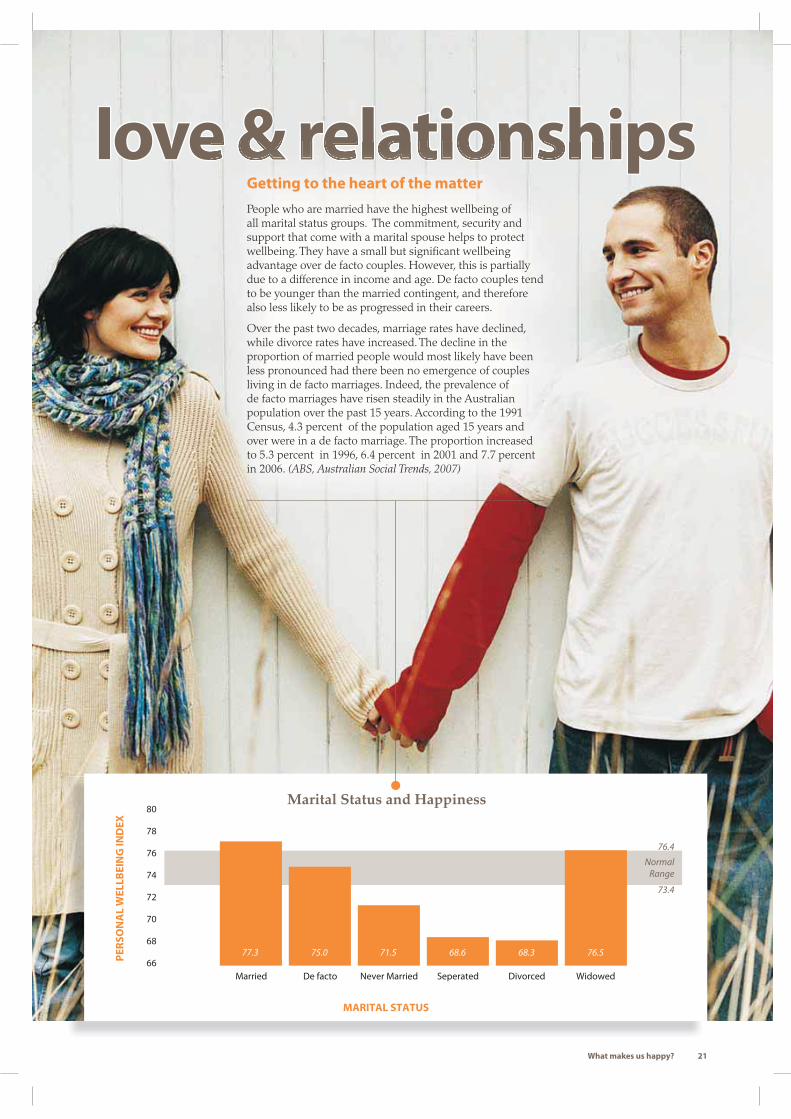
77.3 75.0 71.5 68.6 68.3 76.5
WidowedDivorcedSeperatedNever MarriedDe factoMarried
PE
RS
ON
AL
WE
LL
BE
ING
IN
DE
X
76.4
73.4
Marital Status and Happiness
MARITAL STATUS
love & relationshipsGetting to the heart of the matter
People who are married have the highest wellbeing of all marital status groups. The commitment, security and support that come with a marital spouse helps to protect wellbeing. They have a small but signifi cant wellbeing advantage over de facto couples. However, this is partially due to a difference in income and age. De facto couples tend to be younger than the married contingent, and therefore also less likely to be as progressed in their careers.
Over the past two decades, marriage rates have declined, while divorce rates have increased. The decline in the proportion of married people would most likely have been less pronounced had there been no emergence of couples living in de facto marriages. Indeed, the prevalence of de facto marriages have risen steadily in the Australian population over the past 15 years. According to the 1991 Census, 4.3 percent of the population aged 15 years and over were in a de facto marriage. The proportion increased to 5.3 percent in 1996, 6.4 percent in 2001 and 7.7 percent in 2006. (ABS, Australian Social Trends, 2007)
What makes us happy? 21

62
64
66
68
70
72
74
76
78
80
77.0 74.7 70.976.6 77.5 67.6
WidowDe factoMarriedWidowDe facto
NON HOME OWNERHOME OWNER
Married
PE
RS
ON
AL
WE
LL
BE
ING
IN
DE
X
Equal Happiness for Married and De facto Couples Who Own Their Own Home
love & relationships
While married people generally report higher levels of happiness than de facto couples, this is not the case if the de facto couple owns a home together. When a de facto couple purchases a home together, their wellbeing is then no different from that of a married couple. The symbolism and security of this commitment appears important to the relationship and happiness of the couple.
Widows
While few widows are wealthy, they still have high wellbeing. While this may at fi rst seem odd, it refl ects the average age and fi nancial security of this cohort.
Singletons
People who have never married are a diffi cult group to analyse. They tend to be younger and therefore their age and lower income can play a part in their relative low wellbeing score. This fi nding does not indicate that people need a partner to be happy. It does refl ect, however, the advantage of having a partner in the happiness stakes.
Around one in eight Australians who lived in a private dwelling lived alone (12 percent or 1.8 million people), according to the 2006 Census results. The increasing trend of people living alone has a number of implications for the wellbeing of Australians.
It’s better to be alone than in a stale marriage
While people with a partner have higher wellbeing on average, this is really only the case if it’s a happy relationship. A partner who provides insuffi cient support is worse for people than not having a partner at all. When asked about the level of support people receive from their partner on a scale of 0-10, it revealed people not receiving enough support from their partner had lower wellbeing than people living on their own.
The 2006 Relationships Indicators survey asked what Australians thought were the main reasons for people marrying these days. The most popular answers were to signify a life long commitment (68%), to make a public commitment to each other (63%) and security for children (62%). When asked what were the main reasons for people not to get married nowadays, the top three responses were bad previous experience (72%), avoidance of commitment (67%) and strong commitment does not need marriage (63%).
Source: Relationships Indicators Survey 2006, Relationships Australia.
...middle-aged people who do not have a partner are vulnerable to low wellbeing.
22 Australian Unity Wellbeing Report

64
66
68
70
72
74
76
78
80
82
84Widowed
Age-specific N
ormal Range
DivorcedSeparatedNever marriedDe factoMarried
76+66-7556-6546-5536-4526-3518-25
PE
RS
ON
AL
WE
LL
BE
ING
IN
DE
X
AGE
Middle Aged People Without a Partner are a High-risk Group for Low Wellbeing
66.5
68.1
73.9
76.679.2
68.8
67.566.5
69.1 70.3
73.1
66.2
67.969.1
68.0
73.9
70.367.6
66.5
69.5
75.4 75.674.2
76.1
74.5 74.4 74.9
76.577.1 77.676.8 76.7
77.578.3
79.6
MiMiddddlle A Agedd PPeoplle W Witithoho tut a Partner are a High-risk Group for Low Wellbeing
Middle-aged people without partners are a high-risk group
It is commonly reported that wellbeing decreases in middle-age. The term ‘mid-life crisis’ is used quite fl ippantly, and in actual fact, something does seem to happen at this stage of life. The Wellbeing Index shows middle-aged people who do not have a partner are vulnerable to low wellbeing.
Other key fi ndings:
• People who have never married have fewer sources of relationship support, and receive less support from each source, including their family.
• As people age, they become more reliant on professional counsellors and partners for support.
• While males and females in a relationship receive equivalent support from their partner, females receive greater additional support from outside the relationship.
What makes us happy? 23

70
71
72
73
74
75
76
77
78
PE
RS
ON
AL
WE
LL
BE
ING
IN
DE
X
Apr01
Sep01
Mar02
Aug02
Nov02
Mar03
Jun03
Aug03
Nov03
Feb04
May04
Aug04
May05
Oct05
May06
Oct06
Oct07
Apr07
74.1
71.9
75.0
73.3
76.1
73.6
75.2
73.6
75.0
74.1
75.7
74.7
76.5
75.2
76.4
74.5
75.9
74.7
76.6
74.5
75.074.6
77.3
75.3 75.3
74.0
75.7
74.8
74.373.9
74.674.4
75.5 75.676
75.7
Gender and Wellbeing– Males have recently closed the happiness ‘gap’. MALEFEMALE
DATE
55
60
65
70
75
80
75.3
75.8
75.9
77.3
76.7
75.9
75.7
74.8
73.2
74.9
74.5
73.3
64.3
69.0
76.4
73.4
PE
RS
ON
AL
WE
LL
BE
ING
IN
DE
X
NormalRange
MALE
FEMALE
UnemployedFull-timestudent
Full-timehome
Full-timevolunteer
Semi-retiredFull-timeretired
Full-timepaid
Work Status x Gender– Unemployment is devastating to wellbeing of males.
WORK STATUS
gender
78
X
GGeGeGe dndnderer a andnd Wellbeing– Males have recently closed the happines
Males or females, who is happier?
Males and females are different. The processes of socialisation combines with genetics to make each gender not only physically different but also to experience life differently. But is one gender happier than the other?
The answer is yes. However, intriguingly, it has not remained the same over the years. Something has changed…
As an average across all surveys, women rate themselves as being happier than males. Over the most recent fi ve surveys however, this difference has all but disappeared. The cause of this change in gender differences cannot be determined from the data. It is, however, potentially linked to the low unemployment levels in Australia, as the wellbeing of males is more dependent on having a job, whereas the wellbeing of females is not as dependent on being in paid work.
01 01 02 02 02 03 03 03 03 04 04 04 05 05 06 06 0707
DATE
80
X
WWoWoW krkrk SS Sttatattutuuss s xx x GGeGeGe dndndndererer– Unemployment is devastating to wellbeing of males.
Work is key for the Aussie male
The traditional stereotype of being the ‘bread winner’ is still alive and well for Australian males. While unemployment has a negative effect on the happiness levels of both sexes, it takes a far more devastating toll on males.
24 Australian Unity Wellbeing Report

Women generally cope with tough situations or isolation better than men.
76.0
72.6
MALE Normal Range
77.3
73.6
FEMALE Normal Range
6566676869707172737475767778
69.9 73.6
FM
PE
RS
ON
AL
WE
LL
BE
ING
IN
DE
X
The Wellbeing of Males and Females Living AloneMALE
FEMALE
GENDER
Diff erences through the ages
Interestingly, there is no difference in happiness between males and females aged 18-25 years. Once people hit 26-35, the difference emerges dramatically with females typically recording higher wellbeing than males. From 36 years of age onwards, the differences between the genders begins to dissipate.
How safe we feel
On average, females rate higher satisfaction with each area of their lives than males – except for safety. There is a question here as to whether life in Australia really is less safe for women, or is it just a perception? Interestingly, females reported lower satisfaction with safety following September 11, but for males it remained constant.
Living alone
Women generally cope with tough situations and isolation better than men. An example can be seen in the wellbeing of males and females who live alone. While the wellbeing of females remains in the normal range, males who live alone have a much lower wellbeing score and are at a higher risk of developing depression. Further information on people living alone can be found on page 27.
What makes us happy? 25

70
72
74
76
78
80
76.4 76.2 74.4 74.5 75.8 77.4 77.8
18-25 26-35 36-45 46-55 56-65 66-75 75+
PE
RS
ON
AL
WE
LL
BE
ING
IN
DE
X
Age and Wellbeing– Happiness over the age groups.
AGE
Happiness can take time…
The older we get, the happier we tend to become. Although satisfaction with health declines as age-related ailments set in, people tend to be more satisfi ed with the other areas of their lives and wellbeing goes up accordingly.
When identifying segments of the population with the highest and lowest wellbeing in Australia, the demographic profi le of the happiest people in Australia was people aged 76+ with a household income of $61,000-$90,000. Further information on this report can be found on page 48.on this repop rt can be found on ppagge 48.
Importance of connecting to others
The wellbeing of older Australians is highly infl uenced by their relationships and interactions with others. This group has increased satisfaction with their relationships and community when there is a perceived threat such as terrorist activity. This is a well-document phenomenon, that people tend to feel closer and more appreciative of the people around them in diffi cult or threatening times. More information on this can be found on page 46.
Happiinneessss ccaan take time…
TTTThThThheeee e oolo der wewewewewe gg g gggetetetetett, , thtthththeeee hhhahahah ppppppieiieier rr wewewewewwe tt t tenenenenendddddd d dd totooot b bbbbbbbbbb bbeceeeeececccccccccccceccccececececcccecccceccomomoommmomomomommomoomomomomoo eee.e.ee..e. AAlAlAllAAlAlAA thtthhtt ough satisfaction with health h declineses a aaas s ssss agagagagge-ee-e-e rerrreeererer llalllllalalalallalllllalalalll tetetetetetetettetetetetetedddddddddddddddddd dddddddddddd
age
• People who do not live with a partner in middle age are at risk of low wellbeing.
• Unemployment has a devastating effect on personal wellbeing beyond 25 years of age.
• A recent fall in satisfaction with the environment was largely reported by people aged 36-65.
26 Australian Unity Wellbeing Report

Home alone
The increasing trend of single-person households in Australia has a number of implications. People who live alone tend to be less satisfi ed with their relationships and their health than people who live with their partner. The high proportion of people who are divorced or separated in this group partially explains the relationship element, but the reason for low satisfaction with their health is less clear. For people living alone, wellbeing only enters the normal range at a household income of $101,000-$150,000.
Full house
In terms of household composition, people living with a combination of their partner, children and other adults, achieve the highest level of wellbeing. It is likely that this provides an additional resource to assist with child care in many of these living arrangements.
Single parents
Single parents have the lowest wellbeing of all household groups. And while this doesn’t mean that single parents can’t be happy, it does mean the challenging nature of the role can be too much for some, and places many people in this situation at a higher risk of developing depression.
who we live withwho we live with
• In 2006, around one in eight Australians lived alone (12 percent or 1.8 million people). This is up from 1.4 million in 1996.
• One-person households represented about 23 percent of all households in Australia in 2006 (up from 22 percent in 1996).
• The median age of people living alone is 56, compared to the median age of 43 for other household types.
Source: ABS 2006 Census (Media Release: One in eight Australians lives alone)
People who live with their partner and children report exceptional satisfaction with their health. This doesn’t necessarily mean their health is materially better than those without children.The reason may be that parents focus on the health of their children rather than their own. Parents do however, rate lower satisfaction with their relationships and standard of living.
Single parents have the lowest level of wellbeing of all household groups.
What makes us happy? 27

66
68
70
72
74
76
78
80
82
75.5 76.6 76.4 75.1 74.7 74.0 66.5
76.4
73.4
UnemployedFull-timestudent
Full-timehome
Full-timevolunteer
Semi-retiredFull-timeretired
Full-timepaid
PE
RS
ON
AL
WE
LL
BE
ING
IN
DE
X
Work Status and Wellbeing
NormalRange
WORK STATUS
Unemployment – the Impact on Males and Females
WORK STATUS
55
60
65
70
75
80
76.4
73.4
PE
RS
ON
AL
WE
LL
BE
ING
IN
DE
X
NormalRange
MALE
FEMALE
64.3 69.0
Unemployed Males Unemployed Females
Paid work
Work is a signifi cant component of many people’s lives. For some, having a job simply provides the income needed to survive. For others it can give a sense of purpose and forms part of our personal identity. And when we’re not working but would like to be, it can be seriously detrimental to our fi nancial situation, self-esteem and happiness.
The average wellbeing of all employment groups falls within the normal range, with the exception of two. Those who are fulltime retired have very high wellbeing, while at the other end of the spectrum people who are unemployed have extremely low wellbeing.
employmentemployment
28 Australian Unity Wellbeing Report

62
64
66
68
70
72
74
76
78
71.2 75.9 66.1 67.0
76.4
73.4
Not LookingFulltime Employed
Looking Not LookingUnemployed
Looking
PE
RS
ON
AL
WE
LL
BE
ING
IN
DE
X
The Wellbeing of Job Seekers
NormalRange
EMPLOYMENT STATUS
Fulltime Employed
Unemployed
Unemployment
It’s no surprise that unemployment has a negative impact on wellbeing, as it reduces fi nancial security, creates uncertainty and impacts on people’s lives as a whole.
While both males and females who are unemployed have very low wellbeing, this is especially true for males. This is because the wellbeing of males is highly dependent on their work status. (More information on the gender difference can be found on page 24)
Unemployed males are therefore a high-risk group for depression. According to Beyondblue, from 1998 to 2002, the suicide rate in Australia was four times higher in men than women.
The effects of unemployment are also not as severe for people who are married.
The truly devastating impact of unemployment is seen when it’s combined with another factor, such as separation or divorce. The compound effect is shattering and leaves these people at a higher risk of developing depression.
Job Seekers
People who are working full time, yet looking for a job, have a wellbeing score that sits below the normal range and is signifi cantly lower than other full-time workers. It is clear that dissatisfaction in their current role and sense of insecurity around their near term future takes its toll on happiness. Whether an unemployed person is looking for work or not, makes little difference to their wellbeing.
• The proportion of employed men aged 15-64 years working part-time in Australia was 15 percent in 2005. This is double the rate of men in the USA (7 percent).
• Australia has a higher rate of part-time employment of women aged 15-64 years, of 41 percent , more than double the rate of women in the USA (17 percent ).
(ABS, Labour Force Australia October 2007)
Whether an unemployed person is looking for work or not makes little difference to their wellbeing.
What makes us happy? 29
66
68
70
72
74
76
78
80
82
NormalRange
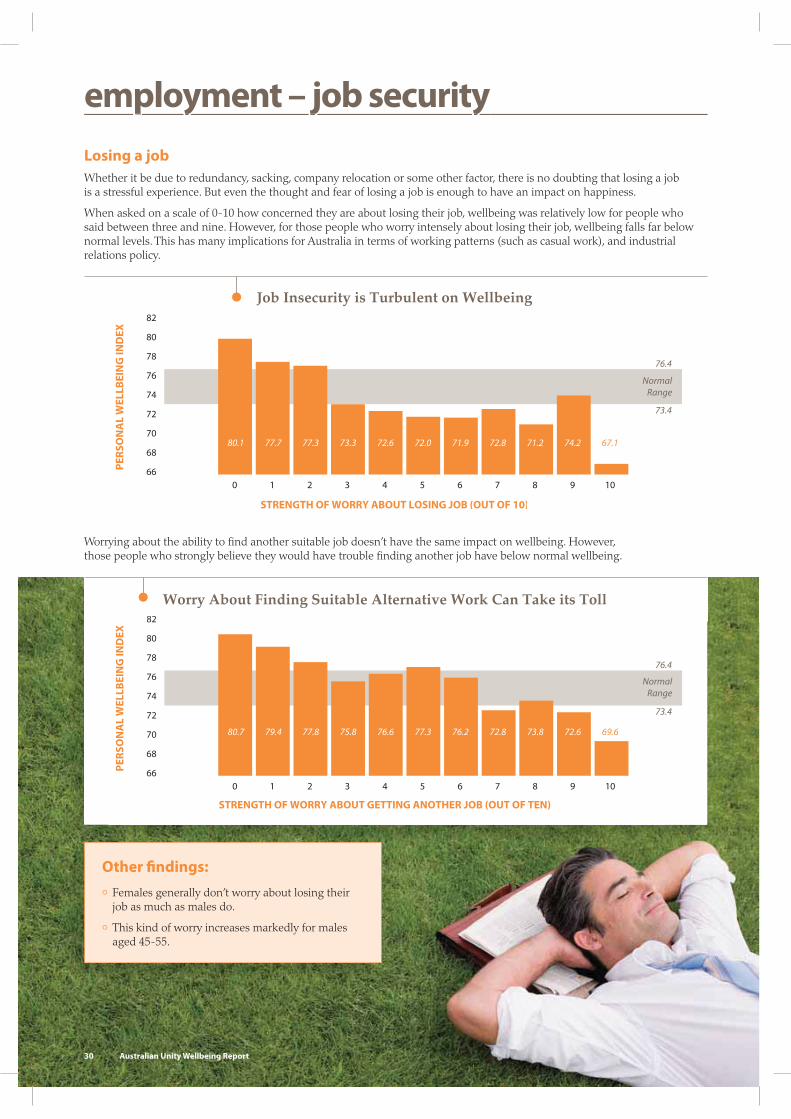
80.1 77.7 77.3 73.3 72.6 72.0 71.9 72.8 71.2 74.2 67.1
76.4
73.4
10 2 3 4 5 6 7 8 9 10
PE
RS
ON
AL
WE
LL
BE
ING
IN
DE
X
STRENGTH OF WORRY ABOUT LOSING JOB (OUT OF 10)
Job Insecurity is Turbulent on Wellbeing
66
68
70
72
74
76
78
80
82
NormalRange
80.7 79.4 77.8 75.8 76.6 77.3 76.2 72.8 73.8 72.6 69.6
76.4
73.4
10 2 3 4 5 6 7 8 9 10
PE
RS
ON
AL
WE
LL
BE
ING
IN
DE
X
STRENGTH OF WORRY ABOUT GETTING ANOTHER JOB (OUT OF TEN)
Worry About Finding Suitable Alternative Work Can Take its Toll
Other fi ndings:
• Females generally don’t worry about losing their job as much as males do.
• This kind of worry increases markedly for males aged 45-55.
employment – job security
82
Job Insecurity is Turbulent on Wellbeing
Losing a job
Whether it be due to redundancy, sacking, company relocation or some other factor, there is no doubting that losing a job is a stressful experience. But even the thought and fear of losing a job is enough to have an impact on happiness.
When asked on a scale of 0-10 how concerned they are about losing their job, wellbeing was relatively low for people who said between three and nine. However, for those people who worry intensely about losing their job, wellbeing falls far below normal levels. This has many implications for Australia in terms of working patterns (such as casual work), and industrial relations policy.
STSTRERENGNGTHTH O OFF WOWORRRRYY ABABOUOUTT LOLOSISINGNG J JOBOB ( (OUOUTT OFOF 1 10)0)
82
WWoWoWorrrrrryy y AbAbAbAbouououttt FiFiFiFi dndndndiinininggg SSuSuSuiititit babababllelele AAA Altltltltererernananatitititiveveve WWW Worororkkkk CCaCaCannn TTaTaTakkekeke iii itststs TTT T lolololllll
Worrying about the ability to fi nd another suitable job doesn’t have the same impact on wellbeing. However, those people who strongly believe they would have trouble fi nding another job have below normal wellbeing.
30 Australian Unity Wellbeing Report
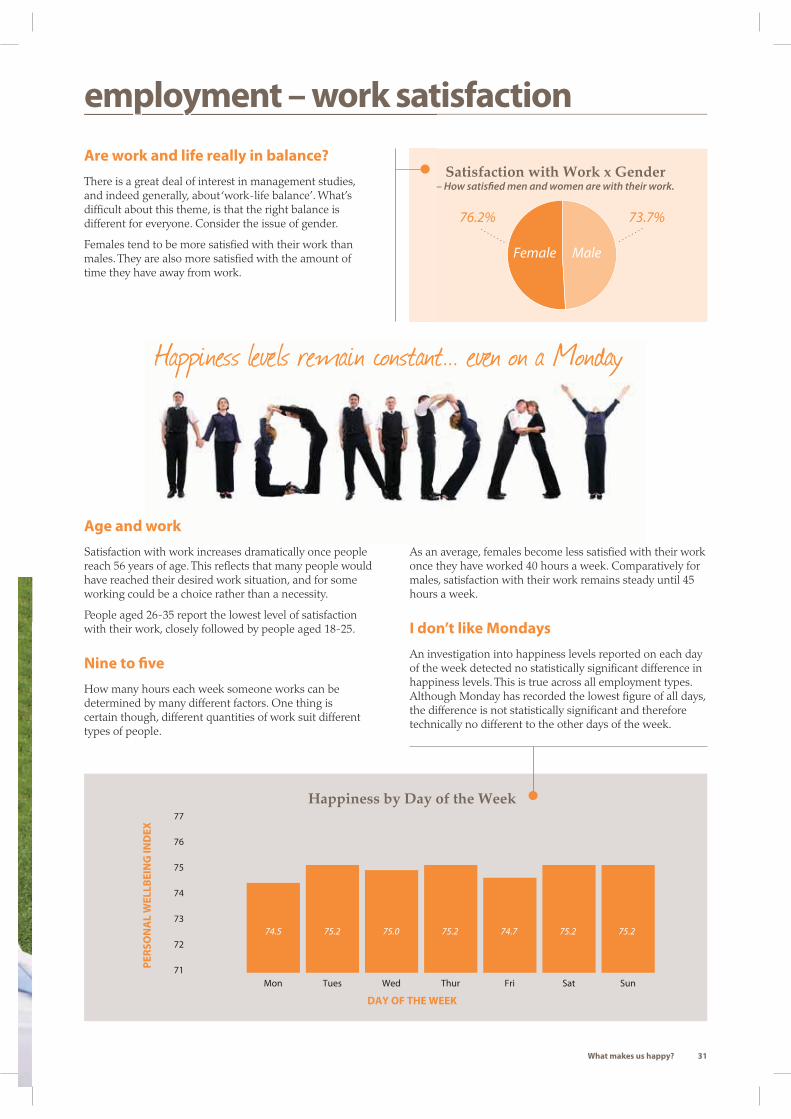
Happiness levels remain constant... even on a Monday
Satisfaction with Work x Gender– How satisfied men and women are with their work.
76.2% 73.7%
Female Male
71
72
73
74
75
76
77
74.5 75.2 75.0 75.2 74.7 75.2 75.2
Sat SunFriThurWedTuesMon
PE
RS
ON
AL
WE
LL
BE
ING
IN
DE
X
DAY OF THE WEEK
Happiness by Day of the Week
employment – work satisfaction
–
Are work and life really in balance?
There is a great deal of interest in management studies, and indeed generally, about ‘work-life balance’. What’s diffi cult about this theme, is that the right balance is different for everyone. Consider the issue of gender.
Females tend to be more satisfi ed with their work than males. They are also more satisfi ed with the amount of time they have away from work.
Age and work
Satisfaction with work increases dramatically once people reach 56 years of age. This refl ects that many people would have reached their desired work situation, and for some working could be a choice rather than a necessity.
People aged 26-35 report the lowest level of satisfaction with their work, closely followed by people aged 18-25.
Nine to fi ve
How many hours each week someone works can be determined by many different factors. One thing is certain though, different quantities of work suit different types of people.
As an average, females become less satisfi ed with their work once they have worked 40 hours a week. Comparatively for males, satisfaction with their work remains steady until 45 hours a week.
I don’t like Mondays
An investigation into happiness levels reported on each day of the week detected no statistically signifi cant difference in happiness levels. This is true across all employment types. Although Monday has recorded the lowest fi gure of all days, the difference is not statistically signifi cant and therefore technically no different to the other days of the week.
What makes us happy? 31

65
70
75
80
NormalRange
77.675.4 76.6 76.478.5 76.2 74.7 75.8 74.0 72.9 66.5 68.5
76.4
73.4
TotalFull-time employed
Full-time retired
Semi-retired Full-timehome
Full-time student
UnemployedVol Total Vol Total Vol Total Vol Total Vol Total Vol
PE
RS
ON
AL
WE
LL
BE
ING
IN
DE
X
The Wellbeing of Part-time Volunteers
WORK STATUS
All in employment group
Part-time volunteers
Does doing good always make you
feel good?
The happiest employment group of all are those who are either semi or fully retired. Full-time volunteers however, come in close behind them. There is also a marked increase in wellbeing in people who are fulltime employed, full-time retired and unemployed when they engage in part-time volunteer work.
As can be seen, volunteers tend to have higher levels of wellbeing. Or is it that people with higher wellbeing tend to volunteer? It’s not an easy one to conclude, but it is most likely a combination of both.
When we are feeling good, we are more likely to do some good and contribute to society positively. But in reverse, community connection and engagement is important to our sense of wellbeing. A combination of the interaction provided by volunteering and the personal satisfaction achieved is likely to have a positive impact on our happiness.
volunteering
32 Australian Unity Wellbeing Report
68
70
72
74
76
78
80
82
84
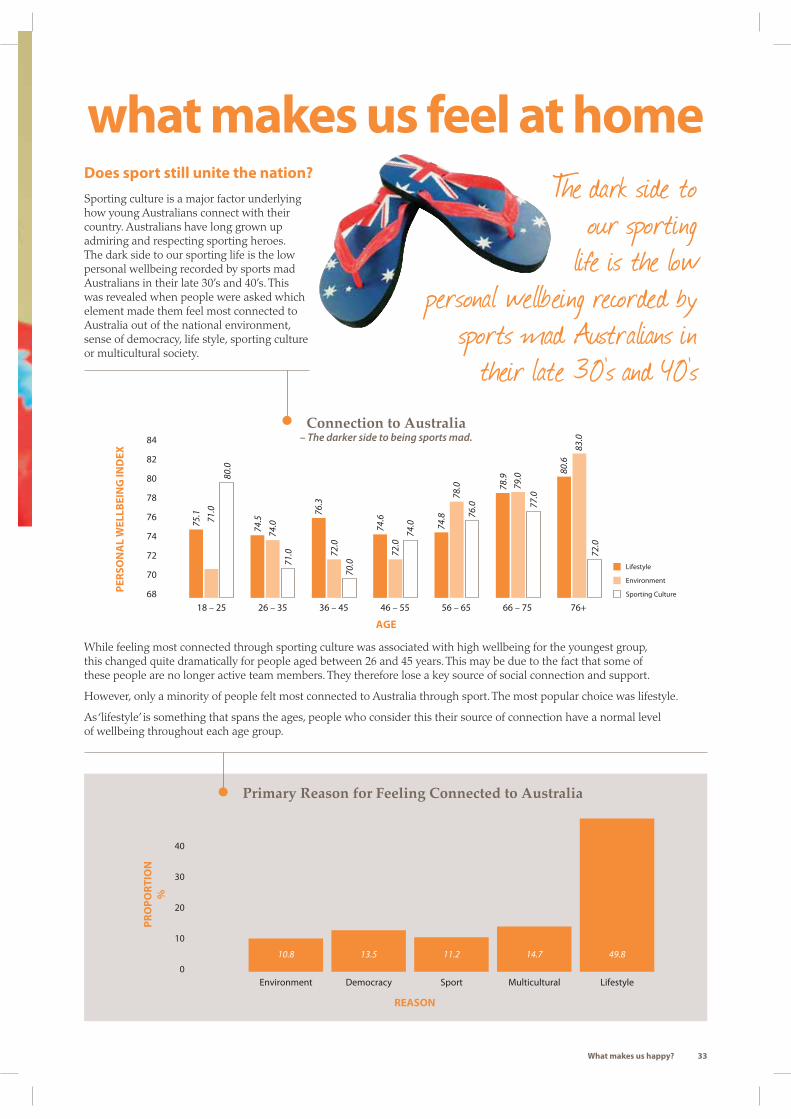
75.1 71
.0
80.0
74.5
76.3
72.0
70.0
74.6
74.8
78.9
80.6
72.0
83.0
79.0
77.078
.0
76.0
72.0
74.0
74.0
71.0
18 – 25 26 – 35 36 – 45 46 – 55 56 – 65 66 – 75 76+
PE
RS
ON
AL
WE
LL
BE
ING
IN
DE
X
Lifestyle
Environment
Sporting Culture
Connection to Australia– The darker side to being sports mad.
AGE
0
10
20
30
40
10.8
LifestyleMulticulturalSportDemocracyEnvironment
PR
OP
OR
TIO
N
%
49.814.711.213.5
Primary Reason for Feeling Connected to Australia
REASON
Does sport still unite the nation?
Sporting culture is a major factor underlying how young Australians connect with their country. Australians have long grown up admiring and respecting sporting heroes. The dark side to our sporting life is the low personal wellbeing recorded by sports mad Australians in their late 30’s and 40’s. This was revealed when people were asked which element made them feel most connected to Australia out of the national environment, sense of democracy, life style, sporting culture or multicultural society.
While feeling most connected through sporting culture was associated with high wellbeing for the youngest group, this changed quite dramatically for people aged between 26 and 45 years. This may be due to the fact that some of these people are no longer active team members. They therefore lose a key source of social connection and support.
However, only a minority of people felt most connected to Australia through sport. The most popular choice was lifestyle.
As ‘lifestyle’ is something that spans the ages, people who consider this their source of connection have a normal level of wellbeing throughout each age group.
what makes us feel at home
The dark side to our sporting
life is the low personal wellbeing recorded by
sports mad Australians in their late 30’s and 40’s
What makes us happy? 33

Major medical conditionsdo not necessarily cause do not necessarily cause
wellbeing to fall.wellbeing to fall.
58
60
62
64
66
68
70
72
74
76
78
NormalRange
76.6 72.8 73.0 72.6 69.670.6 63.165.0
76.4
73.4
HeartProblems
Cancer Arthritis Diabetes Depression AnxietyAsthmaBloodPressure
PE
RS
ON
AL
WE
LL
BE
ING
IN
DE
X
MAJOR MEDICAL CONDITIONS
The Impact of Major Medical Conditions on Wellbeing
NormalRange
62
64
66
68
70
72
74
76
78
80
82
76.5
80.1
74.7
78.2
72.2
79.3
70.1
75
67.6
73.6
66.1
79.5
67.7
75.8
68.2
77.9
76.5
76.4
73.4
0 2 3 41 5 6 7 8 9 10
PE
RS
ON
AL
WE
LL
BE
ING
IN
DE
X
Nev
er M
arrie
d
Older People Adapt to Pain Better Than Younger People
PAIN STRENGTH (ON A 0-10 SCALE)
18-25 years
76+ years
76
78
DE
X
ThThThThTheee IImImImpapapap tctctct oo offfff MMMaMaMajojojoj rr r MMedical Condit
If we’re healthy are we happy?
It is often assumed that if we’re healthy, we’re happy. And conversely that poor health must mean we’re unhappy. But this is not necessarily the case. Provided that people have enough emotional support and fi nancial resources to pay for treatment and medical expenses – people with poor health can be happy and experience high life quality.
Major medical conditions
Major medical conditions do not necessarily cause wellbeing to fall. In fact medical conditions such as blood pressure have little impact on wellbeing. However, conditions that involve stress or pain (cancer, arthritis, diabetes) reduce wellbeing below the normal range. As expected, illnesses such as anxiety or depression take wellbeing to very low levels (with low wellbeing being an indicator of depression).
MAJOR MEDICAL CONDITIONS
80
82
80.1
2 79.3
79.5
9EX
OlOlOldedederrr PePePeopopopplllelele AAAA Adddadada tptptpt ttt tooo PPaPaPaiiininin BBBB Betetetteteterrr ThhThThananan YY Youououngngnggererer PP Peoeoeo llplplplp eee 18 218-255 years
76+ years
Pain
Younger people don’t cope as well with pain as older people do. It appears people adapt to chronic pain and that many manage to retain high wellbeing even when experiencing strong pain. While the relationship between pain and wellbeing is much the same for males and females in the younger age groups, once people reach 66 years of age, females report more pain than males.
healthhealth
34 Australian Unity Wellbeing Report

NormalRange
65
67
69
71
73
75
77
79
71.5
75.875.1
76.374.8
76
74.2 74.4
69.3
70.8
72.9
70.871.4
69.5
76.4
73.4
15-19Underweight
25-29Overweight
20-24Normal
30-34Mild Obesity
35-39Moderate
Obesity
45-49Very Severe
Obesity
40-45SevereObesity
PE
RS
ON
AL
WE
LL
BE
ING
IN
DE
X Body Weight and Happiness
BODY MASS INDEX
MALE
FEMALE
NormalRange
60
64
68
72
76
8077.3
72.3
78.2
72.5
77.3
70.9
76.6
68.3
72.9
65.6
75.6
66.2
76.4
73.4
PE
RS
ON
AL
WE
LL
BE
ING
IN
DE
X Married
Never Married
15-19Underweight
25-29Overweight
20-24Normal
30-34Mild Obesity
35-39Moderate
Obesity
40-45Severe Obesity
Relationship Status, Body Weight and Happiness
BODY MASS INDEX
How body weight tips the scales
Obesity is bad for you, in almost every imaginable way. Apart from the increased health risks, people who are obese are subjected to a certain level of discrimination for their condition. And, indeed, happiness also suffers once people reach a moderate or severe level of obesity.
Most people however, whose weight falls within the mild obesity range, manage to maintain normal levels of wellbeing.
Males who are underweight report a lower level of wellbeing, whereas underweight females remain in the upper section of the normal range. The social pressure on females to be thin, means that is more acceptablefor females to be underweight.
8077 3 78.2 77 3IN
DE
XE
Married
Never MarriedRReReRellalalatititiononshshshipipip SS Sttatattutuss, BB B dododyy WWeWeiigighththt a andnd Happiness
Marriage and body weight
Married people who are obese have lower wellbeing than married people in the healthy weight range. Yet obesity does not seem to impact married people as drastically as those who aren’t married.
What makes us happy? 35

Perth’s relative low wellbeing score may be due to it being the most isolated capital city in the world.
Rural and regional towns
An analysis of wellbeing between the areas where we live, revealed the happiest people in Australia tend to reside in rural and regional towns.
People in rural and regional communities are more dependent on each other and therefore become a more socially cohesive group. This has a positive impact on their wellbeing. Moreover, the further towns are away from capital cities, the higher their sense of belonging, safety and security becomes.
However, people who live in remote to highly remote areas of Australia lose their ‘rural advantage’ and have a level of wellbeing no different from their city cousins.
This special analysis was completed using the Accessibility Remote Index of Australia (ARIA) classifi cations. The ARIA measures accessibility and remoteness according to access along road networks to specifi ed ‘service centres’. This distance is then translated to a score that determines how accessible/remote the location is.
Which capital city is the happiest?
People living in Melbourne and Brisbane have the highest wellbeing of Australia’s capital cities, with Perth and Sydney lagging well behind.
Melburnians and Brisbanites scored highly across a number of wellbeing indicators, with the highest levels of personal wellbeing and community connection of all the cities.
Although lower than Melbourne and Brisbane, Adelaide, Hobart, Canberra and Darwin also rated their satisfaction with life highly.
Sydney and Perth had lower personal wellbeing and also rated signifi cantly lower than the other capitals in terms of community connection and safety. High population density and the cost of living in Sydney is a signifi cant factor in their lower wellbeing score.
Although Perth has similar demographics to Brisbane, their relative low wellbeing score may be due to it being the most isolated capital in the world. The resources boom also means there is an infl ux of ‘outsiders’, which can be disruptive to cohesive communities.
city city vs vs countrycountry
36 Australian Unity Wellbeing Report

The happiness tally throughout Australia
A greater sense of safety and connection to their community typifi es Australia’s federal electorates with the highest wellbeing. Top-scoring electorates are generally characterised by low population density, with eight of the nine top divisions located outside of inner-metropolitan areas. Electorates with the highest level of wellbeing also include more females, more people aged over 55, greater income equality and more married people.
The happiest electorates in Australia
Division Standard of living Health Achieve in life Personal
relationshipsHow safe you feel
Community connection
Future security
Personal Wellbeing
IndexEden-Monaro � � � � � 77.71
Richmond � � � � 77.72
Riverina � � � � 77.31
Higgins � � � � � 77.50
Murray � � � � � 77.47
Bendigo � � � � 77.49
Wide Bay � � � � � � 78.55
Ryan � � � � 77.65
Mayo � � � � � 77.22
��= above average satisfaction
Lowest scoring electorates
Australian’s federal electorates with the lowest wellbeing are typifi ed by a lack of community connection, a below normal sense of safety and are generally from metropolitan areas with high population density. The electorates with the lowest wellbeing in Australia are Grayndler, Parramatta, Reid, Sydney, Werriwa, Rankin, Hasluck, Perth and Gorton. These electorates display lower survey completion rates and voting rates.
The lowest scoring electorates in Australia
Division Standard of living Health Achieve in life Personal
relationshipsHow safe you feel
Community connection
Future security
Personal Wellbeing
IndexGrayndler � � � � � � � 69.43
Parramatta � � � � � 71.89
Reid � � � � � � � 70.82
Sydney � � � � 72.15
Werriwa � � � � � � 70.92
Rankin � � � � � � � 70.79
Hasluck � � � � 71.70
Perth � � � � 71.74
Gorton � � � � 71.74
��= below average satisfaction
Income not important for cohesive communitiesThe electoral division of Wide Bay in Queensland has the highest wellbeing score in the country, yet one of the lowest average household incomes. In fact, people living in the poorer electoral divisions tend to be more satisfi ed with their relationships and community connection than those electorates with higher household incomes. This may be due to a combination of lower housing costs and greater social capital. Despite the signifi cant differences in wellbeing between electorates, Australia is clearly a largely homogenous nation. A comparison between the nine highest and nine lowest scoring electoral divisions also show no signifi cant differences in income, education or employment.
federal electoral divisions
Top-scoring electorates are generally characterised by low population density, with eight of the nine top divisions
located outside of inner-metropolitan areas.
What makes us happy? 37

NormalRange
76.4
73.4
55
60
65
70
75
66.6 71.4 71.9 70.5 61.3 60.0 58.5
Live Alone andUnemployed
CarersIncome <$15k and
Unemployed
Income <$15k and Alone
Live Alone
Income <$15k
Unemployed
PE
RS
ON
AL
WE
LL
BE
ING
IN
DE
X
The Average Wellbeing of Carers is the Lowest of Any Large Group on Record
SEGMENTS OF POPULATION
According the ABS, there are 2.6 million
Australians who provide unpaid care and
support to a family member or friend
with a disability, mental illness, chronic
condition or who are frail.
The identifi cation of carers within a survey sample revealed carers had a lower level of wellbeing than the norm. Not only did this apply to the primary carer (the person providing most of the care), but also to any other adults living in the household.
This signifi cant fi nding prompted the need for further research into the area.
Partnering with Carers Australia, a special survey investigated the health and wellbeing of carers in more depth.
A total of 10,939 questionnaires were distributed to carers nationally using the carer association state and territory databases. The survey investigated their personal wellbeing, physical health, fi nancial and work situations and details of their caring role. It also identifi ed the prevalence of stress and depression among carers, by incorporating sub-scales taken from the well regarded Depression, Anxiety and Stress Scale (Lovibond and Lovibond, 1995).
Low wellbeing
Carers have the lowest wellbeing of any group yet discovered through the surveys. When compared to other previously identifi ed segments of the population with low wellbeing, carers still have the lowest on record.
caringcaring
38 Australian Unity Wellbeing Report

Carers have the lowest wellbeing of any group yet discovered through the surveys.
caring
The impact of caring on individuals, family units and relationships is nothing short of phenomenal. It affects so many individuals and families.
Most Australians will know someone who is a carer or who needs care because of disability, mental illness, chronic condition or frailty. Caring affects people in many signifi cant ways – fi nancially, socially, emotionally and in regard to important life choices like work, career decisions, whether to have another child and relocating to another city or town.
For most people caring is part of being in a relationship or part of belonging to a family. These relationships and families need to be valued, supported and nurtured.
” – Joan Hughes, CEO Carers Australia
What makes us happy? 39

The Prevalence of Depression in Australian Carers
DEPRESSION LEVEL
Normal (0-21)
No. of Carers – 1277
35%
Mild (22-31)
No. of Carers – 321
Moderate (32-48)
No. of Carers – 677
Severe (49-64)
No. of Carers – 670
Extremely Severe (65+)
No. of Carers – 700
19% 18% 19%9%
Health: key fi ndings
• Carers are almost twice as likely to experience chronic pain.
• Some carers do not receive treatment for their own conditions. The major reasons for this is that they have no time or cannot afford the treatment
• 20 percent of carers are more likely than not, carrying an injury caused by their caring role.
• A lower proportion of carers are classifi ed as normal weight, and a higher proportion of carers are obese.
Health: key fi ndin
Financial security: key fi ndings
• Carers are almost twice as likely to worry that
their income will not be suffi cient to meet their
expenses.
• More than half of the respondents had a
household income of less than $30,000.
• Even carers in full-time employment have a $7,200
defi cit in household income compared with the
national population of employed people.
• For those carers who are employed, over one third
have a degree of worry about losing their job that
is suffi cient to further reduce their wellbeing.
ngsn
The caring role: key fi ndings• Caring does not get easier with time.• The wellbeing of carers seems to stabilise after two years in a caring role.• Wellbeing decreases as the number of hours spent caring increases.
• Female carers have lower wellbeing than male carers.
• The wellbeing gap between the general population and carers narrows with age but their level of wellbeing still remains low.
caring
The Prevalence of Depression in Australian Carers
Depression & stress
As a parallel and extremely worrying fi nding, more than one third of carers surveyed were suffering from severe or extremely severe depression. If this result is refl ective of the entire population of carers across Australia, it is likely that carers account for a substantial proportion of depressed people in Australia. The results for stress mirror that of depression. More than one third of carers were found to be experiencing severe or extreme stress.
40 Australian Unity Wellbeing Report
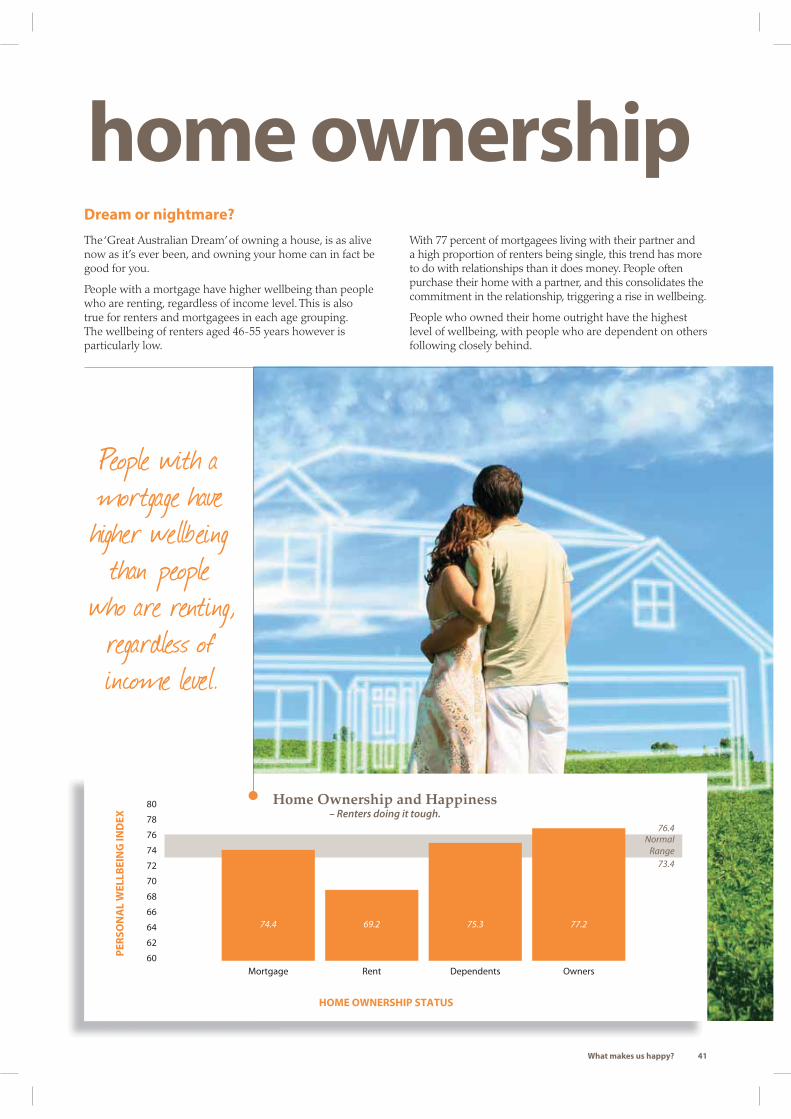
People with a mortgage have higher wellbeing
than people who are renting,
regardless of income level.
60
62
64
66
68
70
72
74
76
78
80
NormalRange
74.4 69.2 75.3
OwnersDependentsRentMortgage
PE
RS
ON
AL
WE
LL
BE
ING
IN
DE
X
76.4
73.4
Home Ownership and Happiness– Renters doing it tough.
HOME OWNERSHIP STATUS
77.2
Dream or nightmare?
The ‘Great Australian Dream’ of owning a house, is as alive now as it’s ever been, and owning your home can in fact be good for you.
People with a mortgage have higher wellbeing than people who are renting, regardless of income level. This is also true for renters and mortgagees in each age grouping. The wellbeing of renters aged 46-55 years however is particularly low.
With 77 percent of mortgagees living with their partner and a high proportion of renters being single, this trend has more to do with relationships than it does money. People often purchase their home with a partner, and this consolidates the commitment in the relationship, triggering a rise in wellbeing.
People who owned their home outright have the highest level of wellbeing, with people who are dependent on others following closely behind.
home ownership
What makes us happy? 41
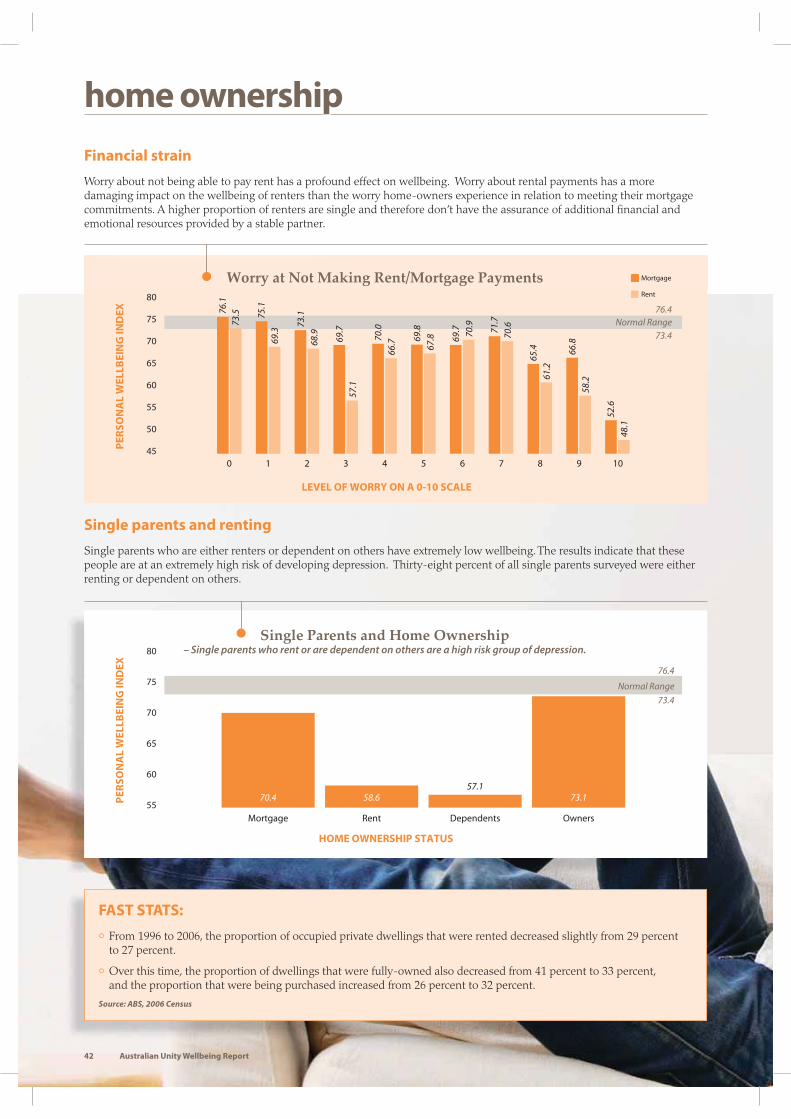
45
50
55
60
65
70
75
80
Normal Range76.4
73.4
0 2 3 4 5 6 7 8 9 101
PE
RS
ON
AL
WE
LL
BE
ING
IN
DE
X
Worry at Not Making Rent/Mortgage Payments
LEVEL OF WORRY ON A 0-10 SCALE
76.1
73.5 75
.169
.3
73.1
68.9 70
.066
.7 69.8
67.8 69
.7 70.9 71
.770
.6
65.4
61.2
52.6
48.1
66.8
58.2
69.7
57.1
Mortgage
Rent
55
60
65
70
75
80
Normal Range
70.4 58.657.1
OwnersDependentsRentMortgage
PE
RS
ON
AL
WE
LL
BE
ING
IN
DE
X
76.4
73.4
Single Parents and Home Ownership– Single parents who rent or are dependent on others are a high risk group of depression.
HOME OWNERSHIP STATUS
73.1
Worry at Not Making Rent/Mortgage Payments Mortgage
Financial strain
Worry about not being able to pay rent has a profound effect on wellbeing. Worry about rental payments has a more damaging impact on the wellbeing of renters than the worry home-owners experience in relation to meeting their mortgage commitments. A higher proportion of renters are single and therefore don’t have the assurance of additional fi nancial and emotional resources provided by a stable partner.
home ownershiphome ownership
Single parents and renting
Single parents who are either renters or dependent on others have extremely low wellbeing. The results indicate that these people are at an extremely high risk of developing depression. Thirty-eight percent of all single parents surveyed were either renting or dependent on others.
FAST STATS:
• From 1996 to 2006, the proportion of occupied private dwellings that were rented decreased slightly from 29 percent to 27 percent.
• Over this time, the proportion of dwellings that were fully-owned also decreased from 41 percent to 33 percent, and the proportion that were being purchased increased from 26 percent to 32 percent.
Source: ABS, 2006 Census
42 Australian Unity Wellbeing Report

70
71
72
73
74
75
76
77
78
79
80
181-360121-18091-12061-9045-6031-4521-3011-201-100
NormalRange
71.8 76.7 75.1 74.2 75.6 75.2 74.2 73.3 73.4 74.3
76.4
73.4
PE
RS
ON
AL
WE
LL
BE
ING
IN
DE
X
TRAVEL TIME (Minutes)
Travel time and Happiness– Those who travel between 1-10 minutes per day have higher than normal wellbeing.
Where our home is – commuting times
People who commute between one to ten minutes each day have higher than normal wellbeing. However, those people that travel for more than an hour each day have a level of wellbeing that only just remains within the normal range. This means that while commuting times do not have a drastic effect on wellbeing, it can make people vulnerable to other stressful factors in their lives.
People who don’t travel have the lowest wellbeing of all. These people are possibly housebound due to disability, lack of opportunity or being unemployed.
What makes us happy? 43

40
50
60
70
80
90
100
$120+$90-120$60-90$30-60$15-30<$15
49.1
92.1
56.5
89.0
63.1
87.4
68.0
85.7
70.7
84.6
64.4
83.1
PE
RC
EN
TA
GE
OF
OW
NE
RS
HIP
AN
D S
TR
EN
GT
H O
F C
AR
ING
FO
R P
ET
Pets: What percentage of people own them, and how much they care for them
HOUSEHOLD INCOME ($'000)
Owning a Pet
Strength of Caring for Pet
Pets, security and stress
Despite much publicity to the contrary, two consecutive surveys involving 4,000 people revealed that owning a pet does not increase happiness. In fact, not only is the wellbeing of pet owners no different to non-owners, but pet owners tend to be less confi dent and less certain about their security.
Overall, pet owners recorded lower satisfaction with their own future security, as well as national security. They even consider a terrorist attack more likely than non-owners.
Pets and human relationships
Of course, people generally get pleasure from their pet with an affection for them. But our wellbeing is infl uenced by much more powerful factors such as personality, wealth, and human relationships.
The surveys showed that while pet owners had high levels of attachment to their pet, this was felt most strongly by people who live alone and least strongly by people living with their partner and children. This seems to suggest that, in situations where people are intimately connected to either another adult or a child, the strength of caring is directed to them rather than strongly to the pet.
Fewer people from low-income households own a pet, but those that do care more for their pet than people who come from high income households.
pet ownership
Owning a pet does not Owning a pet does not increase happinessincrease happiness
44 Australian Unity Wellbeing Report

A Majority of Australians Believe that a Terrorist Attack is Likely to Occur in Australia
DATE
40
50
60
70
80
August 2ndBali Bombing
64.1 54.9 70.1 59.7 48.3 73.4 59.9 61.9 56.5 49.4
Nov 03 Feb 04 May 04 Aug 04 May 05 Oct 05 May 06 Oct 06 Oct 07Apr 07
% O
F P
EO
PL
E W
HO
TH
INK
A
TE
RR
OR
IST
AT
TA
CK
IS
LIK
EL
Y
68
70
72
74
76
78
80
NormalRange
77.3 76.1 74.3 74 75.8 74.5 74.6 74.3 72.4 71.8
76.4
73.4
10 2 3 4 5 6 7 8 9 10
PE
RS
ON
AL
WE
LL
BE
ING
IN
DE
X
Likelihood of Terrorist Attack and Effect on Happiness
LIKELIHOOD OF A TERRORIST ATTACK
A Majority of Australian80
Y
How actively does the threat
of terrorism aff ect our daily lives?
The changes in Australians’ wellbeing can be somewhat linked to external events such as war and terrorist activity (see page 10). But how much do people really think that a terrorist attack will happen on Australian soil?
Likelihood of an attack in Australia
While responses vary from survey to survey, the majority of Australians continue to believe that a terrorist attack is likely to occur in Australia. This feeling was most pronounced in October 2005 following the 2nd Bali bombing, where at which time 73 percent of Australians believed terrorist activity at home was likely to happen ‘in the near future’.
The eff ect on happiness
For those who agree that a terrorist attack is likely, they are then asked how strongly they hold this belief. The wellbeing of people who believe a terrorist attack to be almost certain (nine or ten out of ten), falls below the normal range. This raises the question about the relative benefi ts and disadvantages of issuing national terror alerts.
terrorist activity
What makes us happy? 45

73
74
75
76
77
78
79
80
81
79.1
79.0 79
.5 80.4
78.7
81.4
77.0
79.7
78.1
78.0
76.8
74.1
79.279
.7
78.2
77.1
79.3
80.4
79.6
79.6 80
.4
S9Nov 2003
S10Feb 2004
S11May 2004
S12Aug 2004
S13May 2005
S14Oct 2005
S15May 2006
PE
RS
ON
AL
WE
LL
BE
ING
IN
DE
X
A Big Fall in Wellbeing of Older Australians Living Alone
SURVEY DATE
Total age cohort 76+yLive with partnerLive alone
NormalRange
76.4
73.4
606264666870727476788082
75.0 66.8 68.7 66.0 66.6 68.3 72.8 72.4 74.1 76.0 77.9 80.8
0 1 2 3 4
STRENGTH OF SPIRITUAL/RELIGIOUS EXPERIENCE
5 6 7 8 9 10No spiritual/religious
PE
RS
ON
AL
WE
LL
BE
ING
IN
DE
X
Strength of Spiritual/Religious Experience and Wellbeing
A Big Fall in Wellbeing of Older Australians Living Alone
The extra sensitivity of older Australians
The nation’s wellbeing fell to the lowest level it had been in fi ve years in May 2006. This was linked to a fall in how Australians, particularly older Australians, were feeling about their relationships and connection to the community.
People aged over 75 have heightened sensitivity to national threats, possibly stemming from their experience of the Second World War as adolescents or young adults.
Evidently, the threat that had arisen through incidents such as the Bali bombings and September 11 terrorist attacks had dissipated. There was less reason for people to reach out to others.
Further analyses revealed that it was people aged over 75 and living alone that had been affected the most.
Wellbeing is sensitive to such events because the threats make us feel united and connected to each other.
terrorist activityterrorist activity
Spirituality and religion
A recent addition to the surveys has been to ask how people feel about their spiritual fulfi lment or religion. The 12 percent of Australians who said they do not have this in their lives record normal levels of wellbeing. It is the ‘believers’ who seem to be at risk. They need a strength of satisfaction with their spirituality/religion of at least 7/10 for their wellbeing to sit in the normal range. An important question when trying to interpret these results is whether more vulnerable people are more likely to seek a spiritual/religious experience.
46 Australian Unity Wellbeing Report

People on low incomes are more likely to report the experience of a sad than a happy event in their lives.
20
22
24
26
28
PR
OP
OR
TIO
N R
EP
OR
TIN
G
A L
IFE
EV
EN
T (
%)
Happy Sad Happy Sad
Proportion of PeopleRecalling Happy or Sad Events
22.6 24.3 23.2 29.7
HAPPY/SAD EVENT
MalesFemales
10
15
20
25
30
17.6 32.5 21.3 29.9 23.5 28.0 25.5 25.9 26.5 24.1% R
EP
OR
TIN
G A
N E
VE
NT
<$15 $15-30 $31-60 $61-100 $101+
People on Low Incomes are More Likely to Recall a Sad Event
HOUSEHOLD INCOME ($’000)
Happy eventsSad events
life events
TIN
G
)
Proportion of PeopleRecalling Happy or Sad Events
How we respond to happy and sad events
To measure the direction of people’s attention to the positive or negative side of their life, the question is asked: “Has anything happened to you recently causing you to feel happier or sadder than normal?” If ‘Yes’, they are then asked whether this was a happy or a sad event, and to rate its infl uence on a zero to ten scale, from very weak to very strong.
Gender diff erence
Females are more likely to recall a sad event in their lives. Females also experience the intensity of both happy and sad events more strongly than males.
Age
Young adults are more likely to report a happy event rather than a sad event. This changes at 36-45 years. At this age and older, people are more likely to report the occurrence of a sad event.
Income infl uences how we experience life
People on low incomes are more likely to recall the experience of a sad than a happy event in their lives. This refl ects how money acts as a protection against negative things in our lives.
What makes us happy? 47

happiest & saddest Those doing well and those doing it tough
No matter what demographic profi le someone fi ts, their wellbeing can sit anywhere on the spectrum. This will refl ect a combination of their genetics and environmental factors in their lives. At a group average level however, there are segments of the population who, as a whole, are clearly doing very well or doing it tough.
One report identifi ed segments of the population with the highest and lowest wellbeing in Australia. This report combined the data from the fi rst 16 surveys, providing a sample of approximately 30,000 people.
Who has the highest wellbeing?
The following six groups have the highest wellbeing:
Demographics
Average
wellbeing
score
People over 76 years with a household income $61,000-$90,000
83.79
People who are 150cm-159cm tall with a household income over $150,000
83.09
Females living with a partner & children with a household income over $150,000
81.72
Females who are married with a household income over $150,000
81.00
Females in full time paid employment with household incomes over $150,000
79.68
People aged 66-75 with a household income $61,000-$90,000
79.55
People within these groups tend to be in a relationship and live in a relatively wealthy household.
• Four out of the six highest groups have household incomes of more than $150,000.
• 85.4 percent of the combined sample are living with their partner.
NB: The other characteristics of these groups, such as age and height, are trivial additions that just happen to defi ne the specifi c groups that have been identifi ed.
The happiest people of all:People aged 76+ with a household
income $61,000-$90,000
48 Australian Unity Wellbeing Report

Who has the lowest wellbeing?
The following fi ve groups have the lowest wellbeing:
Demographics
Average
wellbeing
score
Males who are unemployed with a household income under $15,000
58.14
People who live alone and are unemployed with a household income under $15,000
59.09
People who are divorced and stay at home full-time with a household income under $15,000
59.37
People who are divorced and unemployed
59.68
Divorced single-parents with a household income under $15,000
59.85
People in these groups tend to have very low incomes, live alone or as single parents, and are commonly unemployed.
• The majority have a household income of less than $15,000.
• Only 17.8 percent of the combined sample live with their partner.
• They are often divorced or separated.
happiest & saddest in Australia in Australia
What makes us happy? 49

The theory – homeostasis
The theoretical framework for the interpretation of data is the theory of “Subjective Wellbeing Homeostasis”. This proposes that everyone has a genetically determined ‘set-point’ for wellbeing that is internally maintained and defended, similarly to how body temperature is managed.
Both internal and external resources are used to maintain wellbeing. Internally, we all have different levels of resilience and strength. Externally, relationships and money are key factors that help defend us against things in life that threaten our wellbeing.
Conversely, low income or absence of a partner weakens homeostasis. In these circumstances, challenges and hardship such as stress or pain can easily get too much for the person to handle. With such a lack of support, homeostasis is readily defeated, and subjective wellbeing is prone to decrease below its normal range. If wellbeing fails to recover, the person is highly likely to become depressed.
The analyses
The Personal Wellbeing Index (PWI) is used to calculate an individual’s wellbeing. People are asked to rate their satisfaction with eight life areas on a scale of 0-10. The scores from all eight items are combined and converted to a 0-100 point range. This is the Personal Wellbeing Index.
All data have been standardized to a 0-100 range. The magnitude of differences in wellbeing is therefore referred to in percentage points.
Reference is also made to a ‘normal range’. The normal range has been calculated for the Personal Wellbeing Index from the entire data set of all previous surveys. All of the reported trends are statistically signifi cant unless stated otherwise.
Presentation and type of analyses
In the presentation of results, the trends that are described in the text are statistically signifi cant at p<.05. All satisfaction values are expressed as the strength of satisfaction on a scale that ranges from 0 to 100 points.
In situations where homogeneity of variance assumptions has been violated, Dunnetts T3 Post-Hoc Test has been used. In the case of t-tests we have used the SPSS option for signifi cance when equality of variance cannot be assumed.
The raw data for each report is available from Deakin University’s Australian Centre on Quality of Life website:http://acqol.deakin.edu.au/index.htm
Research method
The Australian Unity Wellbeing Index is based on a quantitative methodology. National phone surveys of a random, geographically representative sample of 2,000 Australians, are conducted at least twice per year.
Surveyors ask to speak to the person in the household with the most recent birthday who is aged over 18. An even gender split is sought in each geographic region to refl ect the national population.
Unlike gender, the age composition of the sample is not actively managed but yields a break-down similar to that of the national population as determined by the Australian Bureau of Statistics in October 2001.
The surveys do include anyone aged under 18 years, non-English speaking persons, and it does not seek to specifi cally identify indigenous Australian respondents.
Academic rigour
The Australian Unity Wellbeing Index is an academic study that adheres to rigorous implementation and statistical standards. It is one of the world’s leading measures of subjective wellbeing conducted at a national level. A team of academics within the Department of Psychology at Deakin University is responsible for data analysis. All fi ndings presented in the reports, including this one, are statistically signifi cant – unless otherwise stipulated.
Report organisation
All information presented in this report is sourced from the Australian Unity Wellbeing Index reports, generated from national surveys conducted since April 2001, unless indicated otherwise.
Naturally, however, we can’t fi t everything from our reports in this one. A list of previous reports can be found on page 51. Complete reports, data fi les and further information on the Australian Unity Wellbeing Index are available at:
Australian Unity: www.australianunity.com.au/wellbeingindex
Deakin University’s Australian Centre on Quality of Life:http://acqol.deakin.edu.au/index.htm
theory
50 Australian Unity Wellbeing Report

List of reports
Australian Unity Wellbeing Index: Survey 17.1.
Special Report: The Wellbeing of Australians – Carer Health and Wellbeing.
Cummins, Hughes, Tomyn, Gibson, Woerner, Lai. October 2007.
Australian Unity Wellbeing Index: Survey 17.
The Wellbeing of Australians – Work, Wealth and Happiness.
Cummins, Woerner, Tomyn, Gibson & Knapp. July 2007.
Australian Unity Wellbeing Index: Report 16.1.
Special Report: The Wellbeing of Australians –
Groups with the Highest and Lowest Wellbeing in Australia.
Cummins, Walter & Woerner. March 2007.
Australian Unity Wellbeing Index: Survey 16.
The Wellbeing of Australians – Mortgage Payments and Home Ownership.
Cummins, Woerner, Tomyn, Gibson & Knapp. October 2006.
Australian Unity Wellbeing Index: Survey 15.
The Wellbeing of Australians – Income security.
Cummins, Woerner, Tomyn, Gibson & Knapp. May 2006.
Australian Unity Wellbeing Index: Report 14.1.
Fifth Anniversary Special Report – Summarising the Major Findings.
Cummins. March 2006.
Australian Unity Wellbeing Index: Survey 14.
The Wellbeing of Australians – Personal Relationships.
Cummins, Woerner, Tomyn, Gibson & Knapp. October 2005.
Australian Unity Wellbeing Index: Report 13.1.
Special Report: The Personal Wellbeing of Australians Living
within Federal Electoral Divisions.
Cummins, Knapp, Woerner, Walter & Page. October 2005.
Australian Unity Wellbeing Index: Survey 13.
The Wellbeing of Australians – Caregiving at Home.
Cummins, Okerstrom, Woerner & Tomyn. July 2005.
Australian Unity Wellbeing Index: Report 12.1.
Special Report on City and Country Living.
Cummins, Davern, Okerstrom, Kai Lo & Eckersley. January 2005.
Australian Unity Wellbeing Index: Survey 12.
The Wellbeing of Australians – Job Security.
Cummins, Eckersley, Kai Lo, Okerstorm, Hunter & Woerner.
October 2004.
Australian Unity Wellbeing Index: Survey 11.
The Wellbeing of Australians – Personal Financial Debt.
Cummins, Eckersley, Kai Lo, Okerstorm, Davern & Woerner.
August 2004.
Australian Unity Wellbeing Index: Survey 10.
The Wellbeing of Australians – Health & Body Weight.
Cummins, Eckersley, Kai Lo, Okerstorm, Woerner & Davern.
April 2004.
Australian Unity Wellbeing Index: Survey 9.
The Wellbeing of Australians – Owning a Pet.
Cummins, Eckersley, Kai Lo, Okerstorm, Hunter & Davern.
February 2004.
Australian Unity Wellbeing Index: Survey 8.
The Wellbeing of Australians – Feeling Connected to Australia.
Cummins, Eckersley, Kai Lo, Okerstorm, Davern & Hunter.
November 2003.
Australian Unity Wellbeing Index: Survey 7.
The Wellbeing of Australians – The Effects of Work.
Cummins, Eckersley, Kai Lo, Okerstorm, Hunter & Davern.
August 2003.
Australian Unity Wellbeing Index: Survey 6.
The Wellbeing of Australians – Impact of the Impending Iraq War.
Cummins, Eckersley, Kai Lo, Okerstorm, Davern & Hunter.
April 2003.
Australian Unity Wellbeing Index: Survey 5.
The Wellbeing of Australians – 1. Personal Finances.
2. The Impact of the Bali Bombing.
Cummins, Eckersley, Kai Lo, Okerstorm, Hunter & Davern.
February 2003.
Australian Unity Wellbeing Index: Survey 4.
The Wellbeing of Australians – 1. Work & Leisure.
2. The Impact of September 11 One Year Later.
Cummins, Eckersley, Kai Lo, Okerstorm & Davern.
September 2002.
Australian Unity Wellbeing Index: Survey 3, Report 3.2.
The Impact of Personal Relationships and Household Structure
on the Wellbeing of Australians.
Cummins, Eckersley, Pallant, Okerstorm & Davern.
April 2002.
Australian Unity Wellbeing Index: Survey 3, Report 3.1.
Wellbeing in Australia in the aftermath of September 11.
Cummins, Eckersley, Pallant & Davern. May 2002.
Australian Unity Wellbeing Index: Survey 2, Report 2.
Special Report on Income and Geographic Location.
Cummins, Eckersley, Pallant, Davern & Misajon.
December 2001.
Australian Unity Wellbeing Index: Survey 2, Report 1.
Cummins, Eckersley, Pallant, Misajon & Davern. December 2001.
Australian Unity Wellbeing Index: Survey 1, Report 1. Cummins,
Eckersley, Pallant, Van Vugt, Shelley, Pusey & Misajon. June 2001.
For further information or general enquiries on the Australian Unity Wellbeing Index, please email: [email protected]
full reports
What makes us happy? 51