what pension crisis? · •pay for retirement benefits as workers earn them (“normal cost”)....
TRANSCRIPT
What Pension Crisis?Bob Costrell and Josh McGee
University of Arkansas, Department of Education ReformPresented at Departmental Seminar, Sept. 19, 2019
Posted November 8, 2019
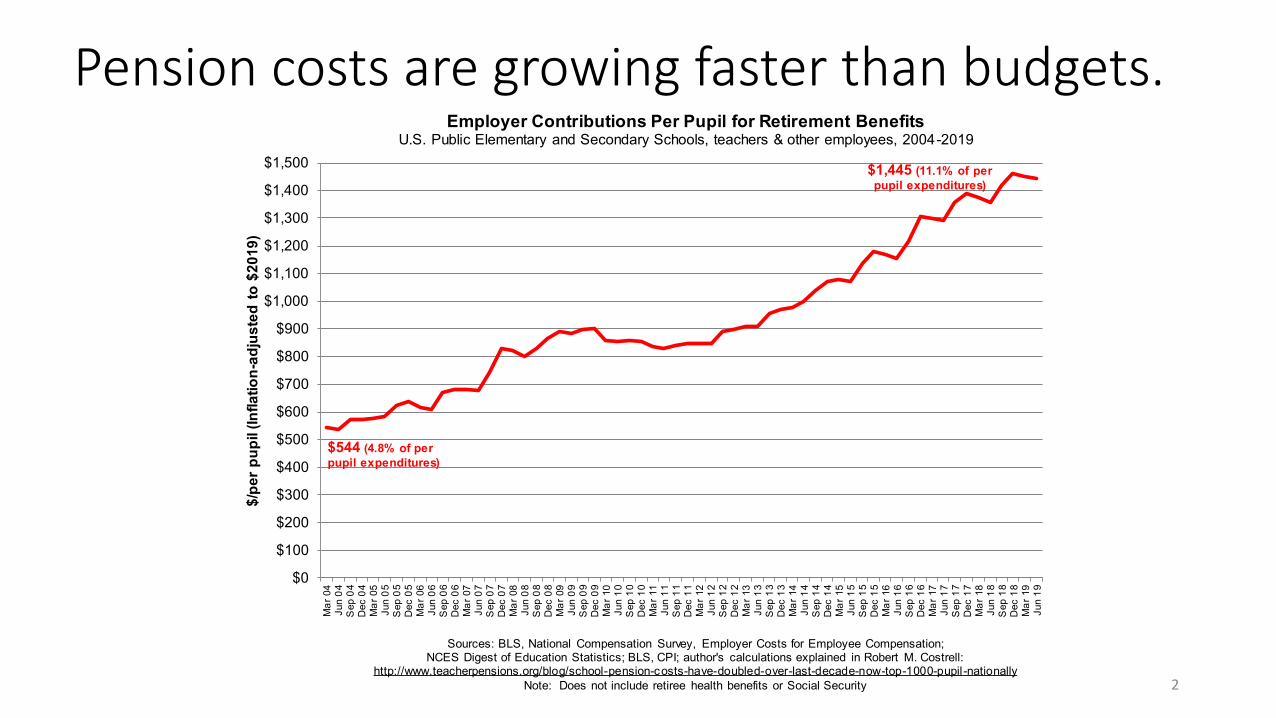
Pension costs are growing faster than budgets.
$0
$100
$200
$300
$400
$500
$600
$700
$800
$900
$1,000
$1,100
$1,200
$1,300
$1,400
$1,500
Mar
04
Jun
04S
ep 0
4D
ec 0
4M
ar 0
5Ju
n 05
Sep
05
Dec
05
Mar
06
Jun
06S
ep 0
6D
ec 0
6M
ar 0
7Ju
n 07
Sep
07
Dec
07
Mar
08
Jun
08S
ep 0
8D
ec 0
8M
ar 0
9Ju
n 09
Sep
09
Dec
09
Mar
10
Jun
10S
ep 1
0D
ec 1
0M
ar 1
1Ju
n 11
Sep
11
Dec
11
Mar
12
Jun
12S
ep 1
2D
ec 1
2M
ar 1
3Ju
n 13
Sep
13
Dec
13
Mar
14
Jun
14S
ep 1
4D
ec 1
4M
ar 1
5Ju
n 15
Sep
15
Dec
15
Mar
16
Jun
16S
ep 1
6D
ec 1
6M
ar 1
7Ju
n 17
Sep
17
Dec
17
Mar
18
Jun
18S
ep 1
8D
ec 1
8M
ar 1
9Ju
n 19
$/pe
r pup
il (In
flatio
n-ad
just
ed to
$20
19)
Sources: BLS, National Compensation Survey, Employer Costs for Employee Compensation; NCES Digest of Education Statistics; BLS, CPI; author's calculations explained in Robert M. Costrell:
http://www.teacherpensions.org/blog/school-pension-costs-have-dou
Employer Contributions Per Pupil for Retirement BenefitsU.S. Public Elementary and Secondary Schools, teachers & other employees, 2004-2019
$544 (4.8% of per pupil expenditures)
$1,445 (11.1% of per pupil expenditures)
Sources: BLS, National Compensation Survey, Employer Costs for Employee Compensation; NCES Digest of Education Statistics; BLS, CPI; author's calculations explained in Robert M. Costrell:
http://www.teacherpensions.org/blog/school-pension-costs-have-doubled-over-last-decade-now-top-1000-pupil-nationallyNote: Does not include retiree health benefits or Social Security 2

Costs are rising because of increasing debt.
3

Do governments really need to pay down debt?• Recent papers argue that governments don’t need to be so aggressive
in paying down pension debt.• UC Berkley Haas Institute – Funding Public Pensions• NCPERS - The Case for New Pension Accounting Standards• Brookings Institution - The Sustainability of State and Local Government
Pensions: A Public Finance Approach• July Version• November Version (cited below)
• The Brookings paper provides the most rigorous modeling, and so we will focus on it.
• We will investigate the implications of following Brookings suggested funding approach and apply those insights to the broader pension funding debate.
4

How does pension funding work?• Pension funding comes from two sources:
1. investment income and 2. contributions.
• Investment income is inherently uncertain and very volatile for public pension plans’ current investment approach.
• Future taxpayer contributions are the ultimate backstop to ensure benefits are paid.
• Reducing contributions increases the risk of reaching pay-go.• Pay-go would result in a big contribution jump.
• Current taxpayer contributions to public pensions are ~18% of payroll while the pay-go rate is ~38% of payroll.
• Pay-go is risky because:• of growth rate risk (i.e., slower economic growth could lead to skyrocketing
relative cost) and • policymakers could make generous benefit promises they don’t have to pay for.
5

Pension Funding NotationL = liabilities, the present value of future benefits earned to date
A = assets on hand to fund the liabilities
UAL = unfunded (accrued) liability = L – A, “pension debt”
f = funded ratio, A/L (full funding goal is f = 100%)
W = payroll
c = contributions as % of payroll
cp = benefit payments as % of payroll (“pay-go rate”)
cn = new liabilities as % of payroll (“normal cost rate”)
r = rate of return on assets
d = discount rate used to calculate liabilities
g = growth rate of payroll and the economy
6

Pension Funding Dynamics• At the end of period t:
At+1 = At(1+r) + ctWt − cptWt
Assets grow by investment earnings + contributions − benefit payments
Lt+1 = Lt(1+d) + cntWt − cp
tWtLiabilities grow by interest on prior liabilities + new liabilities − benefit payments
• The funding policy determines the:• trajectory of contributions, ct and• growth of assets.
• Policymaker must choose between a variety of approaches for setting contributions, weighing budgetary cost, risk, generational equity, etc.
• What approach should they choose - traditional pre-funding, Brookings debt stabilization, or something else??
7

Traditional Pre-funding Approach• Pay for retirement benefits as workers earn them (“normal cost”).
• Analogous to paying salary contemporaneously.• Accumulate assets now to pay benefits when they come due.
• If investment returns < assumed, unfunded liabilities result (“pension debt”).
• To restore full-funding, pay off pension debt with amortization payments.• So, contribution rate = normal cost + amortization.• Governments often choose amortization payments that are a fixed % of
payroll and that result in full-funding by a specified date.• Thus, the contribution rate (as % of payroll) is:
• ct = cnt + amortization rate.
• Once full-funding is reached (assets = liabilities), contributions revert to the normal cost rate.
8

Brookings Paper• Paper argues that:
• paying down the pension debt is not necessary, and in fact, doing so is unfair to the current generation of taxpayers;
• stabilizing the debt’s growth relative to the tax base (or payroll) is a better/fairer goal; and
• stabilizing the debt/GDP ratio (or debt/payroll) is possible under reasonable assumptions and will only require slightly higher contributions than today.
• Brookings proposed funding approach is to:• reduce the discount rate to the risk-free rate (i.e., d = 1.5% real, 3.9%
nominal), as finance economics has long recommended and• set the contribution rate (c) such that pension debt grows at the same rate as
the economy or payroll (g).
9

Brookings Paper’s Results• They calculate steady state values for contributions (c*) under multiple deterministic
investment return (r) scenarios. • Their preferred is r = 3.5% real, 5.9% nominal which yields an increase in contributions of 4.28
percentage points to stabilize pension debt.• They conclude that:
• contributions would only need to increase modestly to stabilize the pension debt, and • it doesn’t really matter if governments acted today or waited a decade or two.
• Implications of Brookings’ funding approach:• governments perpetually roll over current pension debt,• c*<< full-funding contribution,• c* < cn < cp due to r > d > g, and• c* does not rise with reduction in d, despite rise in cn.
• Under the proposed funding approach, it’s unclear how governments should deal with future cost uncertainty.
• Plans are never really in steady state, but instead must constantly adjust based on realized experience.
• Investment returns are highly volatile making it difficult to stabilize debt without big swings in contribution rates.
10

Illustration of Different Funding Policies• We use CalSTRS projected cashflows from the plan’s most recent
actuarial valuation report.• We begin with CalSTRS current payment schedule to reach full
funding.• Then we use CalSTRS data to show what Brookings approach would
look like for a real-world plan.• We take a step-by-step approach that considers the following in turn:
• lower assumed return,• eliminate full-funding goal, and• decouple discount rate from assumed return.
• We then consider the Brookings approach under stochastic returns
11

CalSTRS’ Goal: Assets = Liabilities (100% Funded)
0%
10%
20%
30%
40%
50%
60%
70%
80%
90%
100%
Asse
ts a
s %
of L
iabi
litie
s
CalSTRS Funded Ratio, Under Full-Funding PolicyPay off Unfunded Liability by FY46; discount rate = assumed return = 7.00%
To raise funded ratio, set Contributions =
Normal Cost + Amortization
Once fully funded, Contributions = Normal Cost only
12

CalSTRS Seeks to Eliminate Pension Debt by 2046
0
1
2
3
4
5
6
7
8
UAL
as M
ultip
le o
f Pay
roll
CalSTRS Pension Debt, Under Full-Funding PolicyPay off Unfunded Liability by FY46; discount rate = expected return = 7.00%
To pay down pension debt, set Contributions =
Normal Cost + Amortization
Once pension debt paid off, Contributions = Normal Cost only
13

CalSTRS Scheduled Contribution Rate
0%
10%
20%
30%
40%
50%
60%
Perc
ent o
f Pay
roll
CalSTRS Contribution and Benefit Rates Under Full-Funding PolicyPay off Unfunded Liability by FY46; discount rate = assumed return = 7.00%
Benefits ("Pay-go Rate")
Normal Cost Rate("Pre-Fund Rate")
Contribution Rate = Normal Cost Rate + Amortization
14

Critiques of Traditional Full-Funding Method (1)• There is a temptation to set the expected return high to keep current
contributions low, which increases the risk of accruing new pension debt and higher future contributions.
• Lowering d = r raises normal cost rate.• Lowering d = r raises pension debt, so raises amortization cost, too.• So governments tend to keep d = r as high as possible.
• How much do contributions rise under the traditional full-funding method when we lower d = r from 7.00% to 6.00%?
• 6.00% is essentially Brookings’ assumption for the expected return.• We show the full-funding contribution rate would rise by roughly 10
percentage points.
15

CalSTRS Pension Debt at r = d = 6% vs. 7%
0
1
2
3
4
5
6
7
8
UAL
as M
ultip
le o
f Pay
roll
CalSTRS Pension Debt, Under Full-Funding PolicyPay off Unfunded Liability by FY46; discount rate = expected return = 6.00% vs. 7.00%
r = d = 7.00%
r = d = 6.00%
16

CalSTRS Contribution Rate at r = d = 6% vs. 7%
0%
10%
20%
30%
40%
50%
60%
Perc
ent o
f Pay
roll
CalSTRS Contribution and Benefit Rates Under Full-Funding PolicyPay off Unfunded Liability by FY46; discount rate = assumed return = 6.00% vs. 7.00%
Benefits ("Pay-go Rate")
Normal Cost Rate @ d = 6.00%
Contribution Rate @ d = r = 6.00%
Normal Cost Rate @ d = 7.00%
Contribution Rate @ d = r = 7.00%
17

Critiques of Traditional Full-Funding Method (2)• Pursuing full funding by a specific date creates a contribution cliff.
• Brookings raises a valid question – is it generationally equitable to load all past sins on the current generation of taxpayers?
• The politics of government budgeting will never actually let the contribution cliff happen.
• Brookings approach: • do not pay off the debt, but instead• just hold it constant (i.e., perpetually roll over the current pension debt).
• There is more to their approach, but we consider this first, compared with full-funding.
• We show that this approach eliminates the contribution cliff but leaves a large debt overhang (i.e., low assets relative to liabilities).
18

Maintain Pension Debt/Payroll Ratio at r = d = 6%
0
1
2
3
4
5
6
7
8
UAL
as M
ultip
le o
f Pay
roll
CalSTRS Pension Debt, Under Brookings-Type PolicyMaintain rediscounted debt ratio. discount rate = expected return = 6.00%
Brookings-Type Policy (funded ratio < 60%)
Full-Funding Policy
19
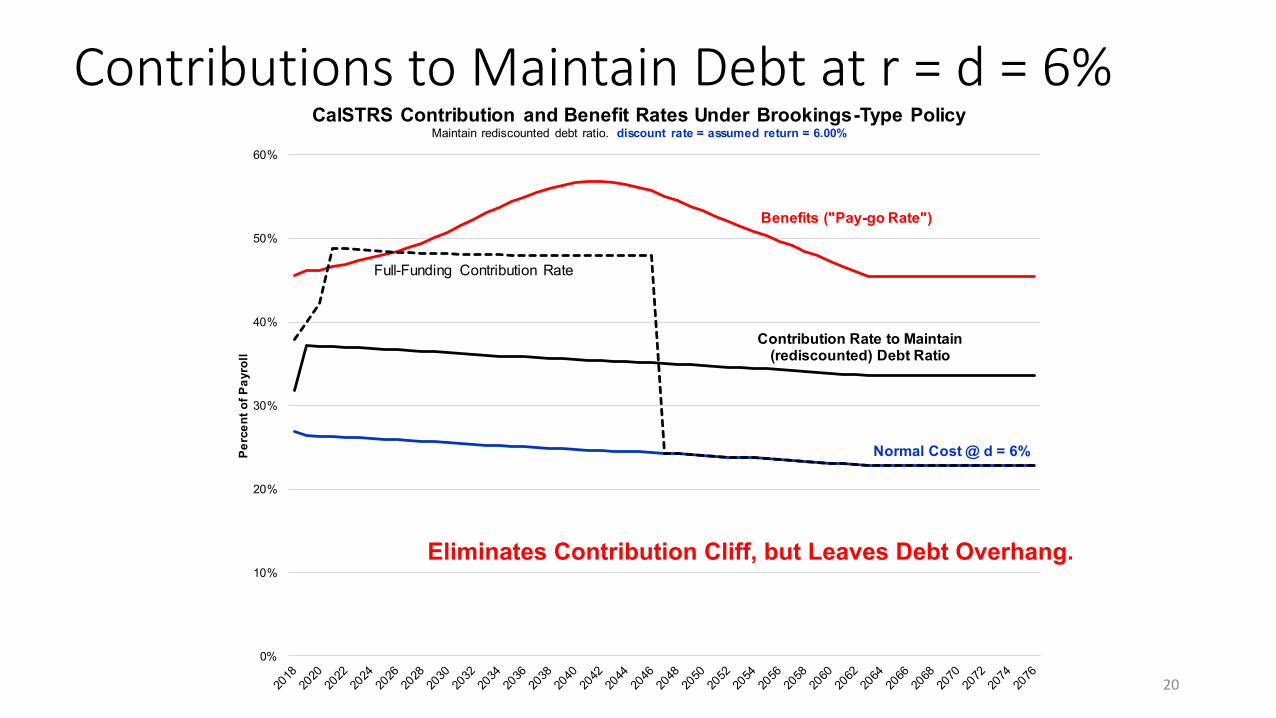
Contributions to Maintain Debt at r = d = 6%
0%
10%
20%
30%
40%
50%
60%
Perc
ent o
f Pay
roll
CalSTRS Contribution and Benefit Rates Under Brookings-Type PolicyMaintain rediscounted debt ratio. discount rate = assumed return = 6.00%
Benefits ("Pay-go Rate")
Normal Cost @ d = 6%
Contribution Rate to Maintain (rediscounted) Debt Ratio
Full-Funding Contribution Rate
Eliminates Contribution Cliff, but Leaves Debt Overhang.
20

Critique of Traditional Full-Funding Method (3)• Liabilities should be discounted at risk-free rate because pensions are
guaranteed.• d should be the risk-free interest rate < r.
• Governments may, however, still invest in risky assets.• Brookings Approach:
• set d = risk-free rate < r = expected return on risky assets; and• after rediscounting, set contributions to hold expected debt ratio constant.
• We show that Brookings proposed approach:• leaves a massive debt overhang;• the contribution rate does not increase as d decreases;• the contribution rate is less than the normal cost rate; and • arbitrage profits, resulting from d < r, are used to reduce the contribution rate below
the normal cost rate.
21

Maintain Pension Debt Ratio at r = 6%, d = 4%
0
1
2
3
4
5
6
7
8
UAL
as M
ultip
le o
f Pay
roll
CalSTRS Pension Debt, Under Brookings Policydiscount rate = 4.00%, expected return = 6.00%
Brookings Policy (funded ratio drops to 40 - 45%)
Leaves Huge Debt Overhang
22
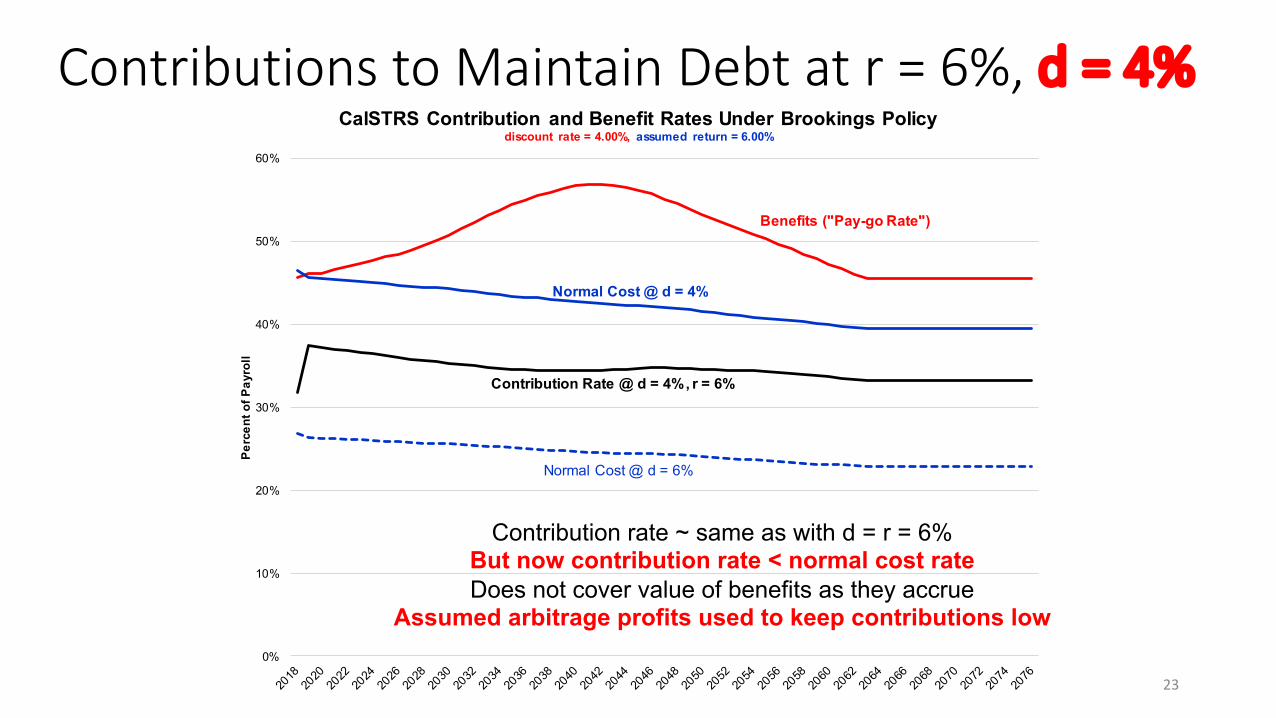
Contributions to Maintain Debt at r = 6%, d = 4%
0%
10%
20%
30%
40%
50%
60%
Perc
ent o
f Pay
roll
CalSTRS Contribution and Benefit Rates Under Brookings Policydiscount rate = 4.00%, assumed return = 6.00%
Benefits ("Pay-go Rate")
Normal Cost @ d = 4%
Contribution Rate @ d = 4%, r = 6%
Normal Cost @ d = 6%
Contribution rate ~ same as with d = r = 6%But now contribution rate < normal cost rateDoes not cover value of benefits as they accrue
Assumed arbitrage profits used to keep contributions low
23

The Math of Brookings Contribution Policy(1) Lt+1 = Lt(1+d) + cn
tWt − cptWt (Brookings equation (7))
(2) At+1 = At(1+r) + ctWt − cptWt (Brookings equation (8))
(3) UALt+1 = Lt+1 − At+1 = Lt(1+d) − At(1+r) + cntWt − ctWt , using (1)-(2)
Brookings’ policy is to maintain constant (UAL/W), so UAL grows at rate g. Choose ct such that:
(4) UALt+1 = (1+g)UALt = Lt(1+d) − At(1+r) + cntWt − ctWt (from (3))
Rearranging, and simplifying, this implies:
(5) ctWt = cntWt + UALt(d-g) − At(r-d)
Contributions cover: normal cost + interest (net of growth) on UAL – arbitrage profitsSteady state contribution rate 33.2% = 39.5% + 3.8% - 10.1%
Note: The Brookings paper’s description (p. 21) of the debt-stabilizing contribution rate incorrectly omits the 3rd term in equation (5) above (i.e., the arbitrage profits). Without the arbitrage profits, the contribution rate would equal or exceed the normal cost rate, but Brookings’ assumed arbitrage profits drives the debt-stabilizing contribution well below normal cost.
24
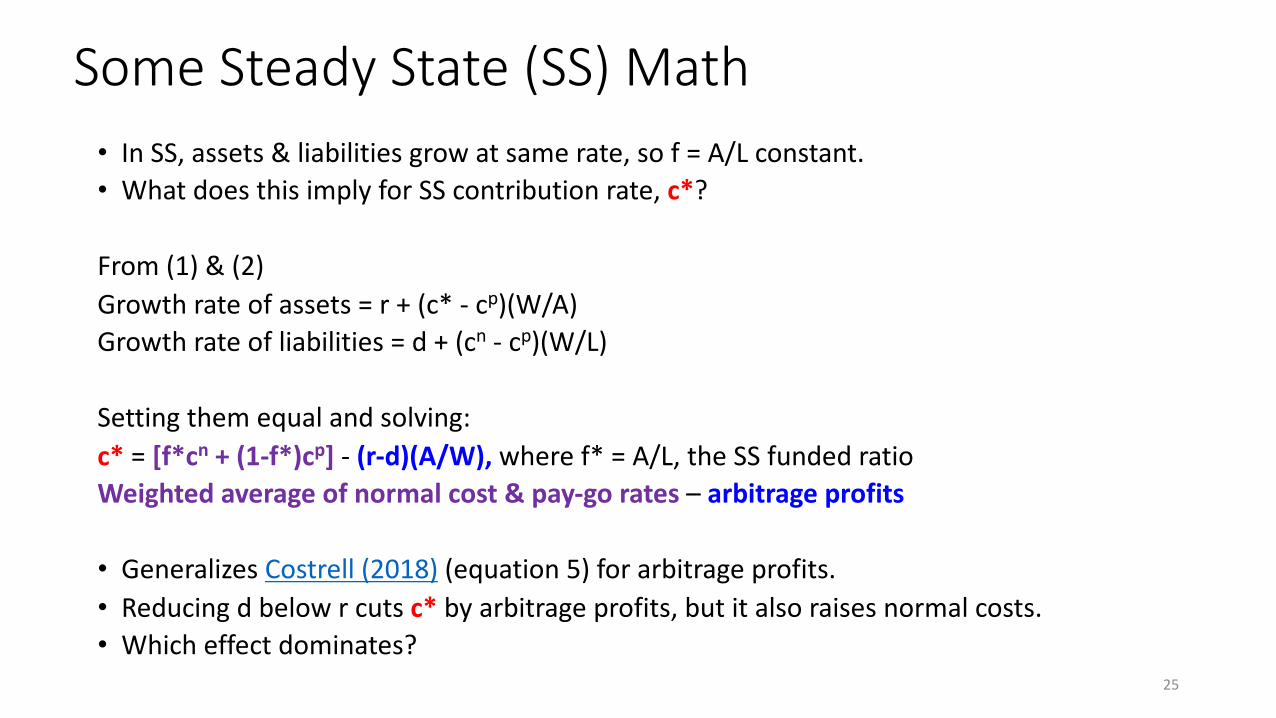
Some Steady State (SS) Math• In SS, assets & liabilities grow at same rate, so f = A/L constant. • What does this imply for SS contribution rate, c*?
From (1) & (2)Growth rate of assets = r + (c* - cp)(W/A)Growth rate of liabilities = d + (cn - cp)(W/L)
Setting them equal and solving:c* = [f*cn + (1-f*)cp] - (r-d)(A/W), where f* = A/L, the SS funded ratioWeighted average of normal cost & pay-go rates – arbitrage profits
• Generalizes Costrell (2018) (equation 5) for arbitrage profits.• Reducing d below r cuts c* by arbitrage profits, but it also raises normal costs. • Which effect dominates?
25

More Steady State Math• In SS, assets grow at g, same rate as payroll, so A/W constant. • What does this imply for SS contribution rate, c*?
Growth rate of assets = r + (c* − cp)(W/A) = gSolving, c* = cp − (r – g)(A/W)
Benefits must be paid (cp) either out of contributions (c*)or out of investment income net of growth (r – g)(A/W).
• Policies that contribute more now grow more assets to reduce c* later. • SS tradeoff between relying on investment income & contributions.• For any given SS value of (A/W), c* is independent of d.
• Cutting d raises assumed arbitrage profits but this is offset by rise in cn.• Compare slides 20 & 23: c* is approximately unchanged for d = 4% vs. 6%, with r held at 6%.
26

What does this all mean?• Pension funding comes from either contributions or investment income, and the
question is how to balance these funding sources and manage risk.• Pension funding policy must consider current budgetary cost, risk, and
generational equity.• Problems can arise when policymakers do not have to fully pay for their promises.• There is no right answer as to how to balance these tradeoffs.• Pension funding debates often devolve into arguments around specific
assumptions, but what really matters is the level of contributions and implications for these tradeoffs.
• There are many ways to arrive at same result. • In fact, Brookings’ proposed approach is like the traditional full-funding method
using long-period, open amortization.• Same risky bet on investment returns to keep current contributions low.• Same perpetual rollover of pension debt.
27

What if returns are stochastic?• So far, we have modeled a well-behaved, deterministic world.• But if plans invest in risky assets, then pension financing is uncertain.• There are three approaches to this uncertainty:
1. Responsive Funding - adjust the contribution rate each year based on some target (e.g., Brookings constant pension debt ratio);
2. Fixed Rate Funding - set a fixed contribution rate (e.g., Arkansas and Texas) at a level that has a high likelihood of keeping the plan solvent; and
3. Something in between where contributions only partially respond to some target (e.g., traditional full-funding approach)
• We model approaches 1 & 2 using Brookings proposed debt stabilization goal.
28

Responsive funding to keep debt constant would result in large contribution swings.
29

Fixed rate funding would result in a high probability of reaching pay-go.
30

Our Takeaways from Modeling Brookings Funding Approach
• Brookings’ approach would: • More accurately measure pension debt, but perpetually roll it over;• Set contributions well below properly measured normal cost and count on
investment income to cover the difference; and• Dramatically increase the probability of insolvency & pay-go.
• Pay-go is risky because it would:• Result in big jump in contributions.
• Contribution rate is risky by virtue of risk in growth of payroll.• Make retirees’ payments dependent on current-year budget. • Result in less accountability for policymakers paying for their promises.
• Brookings paper is silent about how to handle future cost uncertainty.
31

Big Questions• What should the funding goals be when setting contributions?
• What does generational equity mean given current underfunded state?• What are the tradeoffs between pay-go vs full funding vs something in-
between?
• What is the appropriate level of investment risk?• How should contributions adjust based on plan experience?
• E.g., investment returns, mortality, etc.
32