what students of class viii know and can...
TRANSCRIPT

Supported by SSA – TECHNICAL COOPERATION FUND
WHAT STUDENTS OF CLASS VIII KNOW AND CAN DO
A summary of India’s National Achievement Survey, Class VIII, 2012

2
Contents
Introduction 3Why we assess 4 The history of NAS 4 Measuring progress in education 4Turning test results into trends – methodology 5 Developing Class V tests 5 Selecting samples and participants 6 Analysing the results 6Snapshot of a nation – the results 7 National trends 7 Achievement by subject 8 Background factors – survey results 16 Home factors 16 School factors 16 School leadership and governance 17 The pupils’ perspective 17 Teaching and learning approaches 17Data is just the start – what next? 18 Making the most of the results 18 Ongoing improvements 18
Examinations
An examination is a formal test of an individual student’s knowledge or proficiency in a subject on the curriculum. The results of examinations apply to individual students, enabling them to progress through school or apply for further education or employment. Taken together, examination results provide an overall snapshot of students’ performance at the end of a school year or course of learning. Examination results do not indicate the reasons behind high or low achievement of students.
Assessment Surveys
Assessment Surveys provide a measure of learning across a representative sample of students. They allow classification of students at a specific grade level by their ability (what students know and can do) in different subjects on the curriculum. National Assessment Surveys provide a “Health Check” to the education system by analysing achievement based on a range of background factors (school, home, teachers). They potentially enable policy makers and practitioners to address the challenges to enhance student learning.

3
Introduction
The 2012 National Achievement Survey (NAS) of Class VIII students has been significantly updated in line with international best practice in student assessment. Conducted by the National Council of Educational Research and Training (NCERT), this marks the most comprehensive educational assessment survey in India to date.
The survey tested over one hundred thousand students in language, mathematics, science and social science, between March - May, 2012 for summer closing schools and November - December, 2012 for winter closing schools. In addition, questionnaires were used to collect information on schools, teachers, and pupils’ school experiences and home backgrounds.
This booklet summarises the NAS methodology and findings in order to:
• explainimprovementsmadeinassessmenttechniques• provideasnapshotofachievementlevelsinClassVIII• provideinformationonbackgroundfactorsassociatedwithachievement• highlightareasforfurtherinvestigation
Sarva Shiksha Abhiyan – towards universal elementary education
The 86th amendment to the Constitution of India made free and compulsory education for children aged 6-14 a fundamental right. The government’s SSA programme is providing support to achieve this goal.
Spanning the whole country the programme addresses the needs of nearly 200 million children. In areas with no or inadequate schooling facilities, SSA is building new schools or improving existing infrastructure. Teaching capacity is being improved through recruitment and extensive teacher training and many other inputs.
See website for more details: www.ssa.nic.in
3
Nearly 98% of the students who took part in the Class VIII survey reported that they like being in school

4
India has made a significant investment in its education. The government’s flagship programme Sarva Shiksha Abhiyan (SSA) has been successful in ensuring greater access, equity and quality in elementary education. The nation now needs reliable information about students’ achievement in order to judge the quality of education provided.
The history of NASCarried out as part of SSA, the NAS aims to collect reliable information about the achievement levels of students in government and government-aided elementary schools.
In 2000, NCERT’s NAS programme was incorporated into the SSA programme. The initial plan was to carry out three NAS cycles, each cycle covering three key grades:
• Class III,• Class V, • Class VII/VIII.
All three Classes are tested in mathematics and language. In Class V, students are also tested in environmental studies (EVS), while Class VII/VIII completes tests in science and social science.
The Baseline Achievement Survey (BAS) was carried out in 2001-2004, followed by the Mid-term Achievement Survey (MAS) in 2005-2008. The experience gained through these initial two cycles made the value of the NAS clear, and the surveys were made an ongoing feature of the national education system. To mark this shift from stand-alone surveys to continuous assessment, the Terminal Achievement Survey (TAS) has been renamed ‘Cycle 3’.
Measuring progress in educationThe NAS is an education health check that helps to establish the spread of what students know and can do at specific stages of education cycle. This helps teachers and policymakers to identify any areas of concern and address them. By repeating the NAS at regular intervals, the data can be used to measure trends in education achievement levels and measure progress made in the education system aided by reforms such as SSA and others.
It is also important to note that while the report is of performance of elementary grades its findings are particularly pertinent to secondary education, as they define the level of achievement of students entering the first grade of secondary and provide a measure of their preparedness for this transition to the secondary stage.
What are scale scores?
Scaled scores are scores that have been mathematically transformed from one set of numbers (i.e., the raw score) to another set of numbers in order to make them comparable in some way.
Test scores in the report are presented on a scale from 0 to 500. The national average was set to 250 and the standard deviation was set to 50. This means about 70% of students could potentially have a score between 200 and 300, and 95% of students could have a score between 150 and 350.
NAS is not a test for each individual student or school. NAS results are based on a carefully selected sample of students, further weighted by population to be generalised to the individual state. The ‘Standard Error’ is an estimate of the likely variation that may occur. For example if the average language score for students in a State was 247 with an estimated standard error of about 2.1 scale points, then the ‘true’ value of the State’s average language score lies in the range of 244.9 to 249.1.
Why we assess
4

5
For the first time in India, the Class VIII NAS has established robust baselines for achievement in reading comprehension, mathmetics, science and social science. The introduction of sophisticated, internationally-recognised assessment methods means that future trends in educational standards can be judged with confidence against these new baselines.
Developing instruments is a crucial activity in any survey. In preparation for NAS Class VIII, NCERT developed test booklets in language, maths, science and social science. In addition, questionnaires were designed for students, teachers and schools to capture information on school employment, teacher qualifications and status, and student background.
Developing Class VIII testsThe Class VIII NAS differs from previous cycles of the survey as it uses Item Response Theory (IRT) to place results on meaningful scales, which are independent of the particular tests used. This method is in line with international best practice.
Previous Class VIII survey results were reported
as the percentage of correct answers. This meant that results were specific to that year’s test and could not be compared to results from other tests or survey cycles. The scales created using IRT, however, permit future comparison in each subject.
For each of the four subjects, the Class VIII syllabus and textbooks from across the country were used to develop assessment frameworks, which described the knowledge and skills to be tested in the tests.
Once developed, the test booklets were translated into 12 regional languages.
This round of the Class VIII survey used two test booklets per subject with a sufficient number of items. This allowed assessment of subject knowledge and skills in greater depth. To enable comparison across both tests, a block of common questions or ‘anchor items’ was used in both booklets.
For each subject the NAS presents ‘item maps’ which arrange items according to their level of difficulty. The scale score of an item on the map indicates the ability level of students who, on average, are likely to answer it correctly.
What is IRT?
• IRTmeasuresthetrueabilityofstudents regardless of different levels of difficulty of tests by calculating the probability of a student to respond to an item correctly
• IRTmakesitpossibletocomparescores from tests used in different NAS cycles – which may help in monitoring progress in the system over time
Turning test results into trends – methodology
6
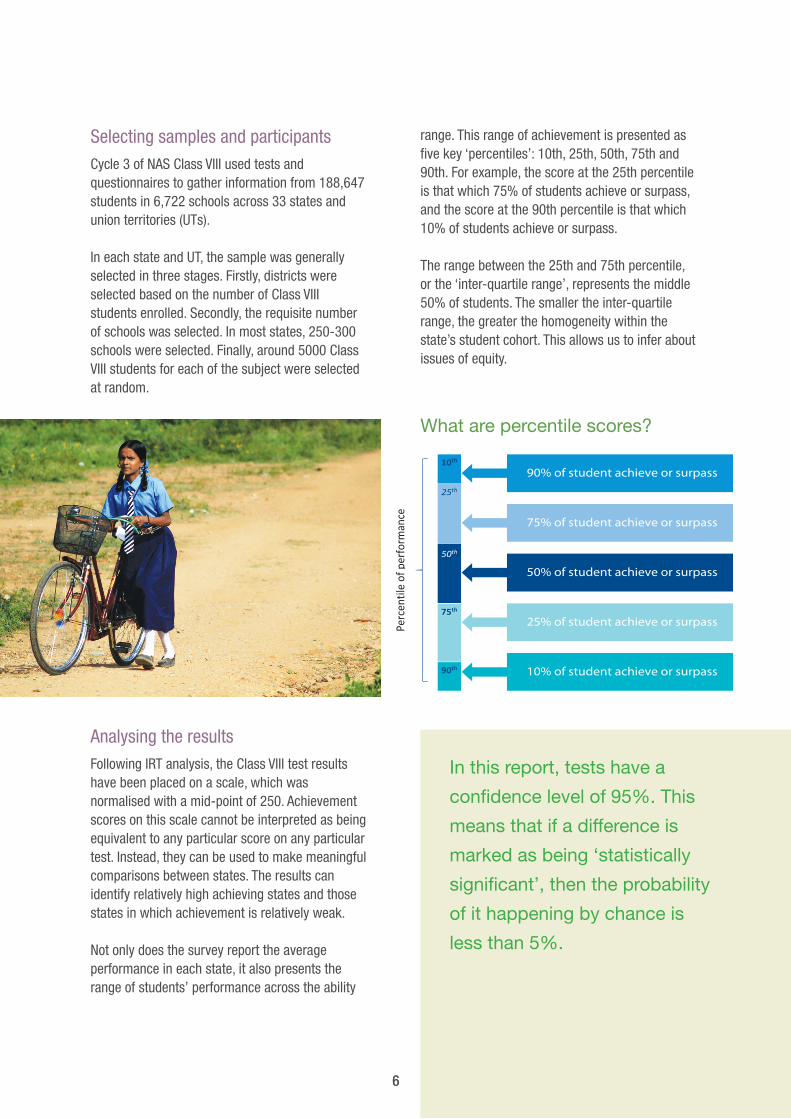
Selecting samples and participantsCycle 3 of NAS Class VIII used tests and questionnaires to gather information from 188,647 students in 6,722 schools across 33 states and union territories (UTs).
In each state and UT, the sample was generally selected in three stages. Firstly, districts were selected based on the number of Class VIII students enrolled. Secondly, the requisite number of schools was selected. In most states, 250-300 schools were selected. Finally, around 5000 Class VIII students for each of the subject were selected at random.
Analysing the resultsFollowing IRT analysis, the Class VIII test results have been placed on a scale, which was normalised with a mid-point of 250. Achievement scores on this scale cannot be interpreted as being equivalent to any particular score on any particular test. Instead, they can be used to make meaningful comparisons between states. The results can identify relatively high achieving states and those states in which achievement is relatively weak.
Not only does the survey report the average performance in each state, it also presents the range of students’ performance across the ability
range. This range of achievement is presented as five key ‘percentiles’: 10th, 25th, 50th, 75th and 90th. For example, the score at the 25th percentile is that which 75% of students achieve or surpass, and the score at the 90th percentile is that which 10% of students achieve or surpass.
The range between the 25th and 75th percentile, or the ‘inter-quartile range’, represents the middle 50% of students. The smaller the inter-quartile range, the greater the homogeneity within the state’s student cohort. This allows us to infer about issues of equity.
What are percentile scores?
6
90% of student achieve or surpass
75% of student achieve or surpass
50% of student achieve or surpass
25% of student achieve or surpass
10% of student achieve or surpass
In this report, tests have a
confidence level of 95%. This
means that if a difference is
marked as being ‘statistically
significant’, then the probability
of it happening by chance is
less than 5%.

7
National trends
The NAS found the following national trends in Class VIII students:
Snapshot of a nation – the results
Overall the NAS reveals significant differences in the average achievement levels of students between states. Some difference may be accounted for by contextual factors, but on balance the results suggest that the quality of educational outcomes is far from equal across the country. While the methodologies are different, NAS confirms the findings from a number of other studies such as ASER, Educational Initiatives etc. and identifies learning as the big challenge facing Indian education.
In number of States NAS results show great diversity in achievement between the highest and lowest performing students within the states. Inequity of outcomes suggests that, in some states, higher achieving students are receiving support while their less achieving peers may not be receiving adequate levels of support and opportunities to reach more acceptable levels of learning.
Nationally, there was no significant difference between boys and girls achievement levels in maths, science and social science. This was also true for most states although in Kerala, girls outperformed boys in all three subjects and in West Bengal girls performed less well than boys in science.
In reading comprehension, girls outperformed boys. This was also true in several states but in most states girls and boys performed equally well. Only Bihar was an exception where girls performed less well than boys.
In science and mathematics, rural students out performed urban students, in social science they performed the same but in reading comprehension rural students performed less well than urban students.
But … some equity issues need to be studied further as students from some groups, comprising Scheduled Castes, Scheduled Tribes and Other Backward Categories, scored significantly lower than students in the General category. Similarly students who reported being physically challenged scored lower than those who did not.
Language
Gender
Urban-Rural
Social Groups
Science and Mathematics
All School Subjects

8
Students were good at identifying the more obvious information*
There was a great variation in students’ ability in reading comprehension.
The advertisement is about the importance of
1. nutritious food.2. peas and dal.3. reasonably priced food.4. yellow peas dal.
*example of test item from the surveyed set of items 46%
Achievement by subject: Reading Comprehention

9
Reading Comprehension
Students struggled to identify more complicated information*
The study about yellow peas dal was conducted by
1. Kendriya Bhandar.2. Ministry of Consumer Affairs, Food and Public Distribution.3. Central Food Technology Research Institute.4. Mother Dairy.
only 36% being able to identify who the study had been conducted by.
*example of test item from the surveyed set of items
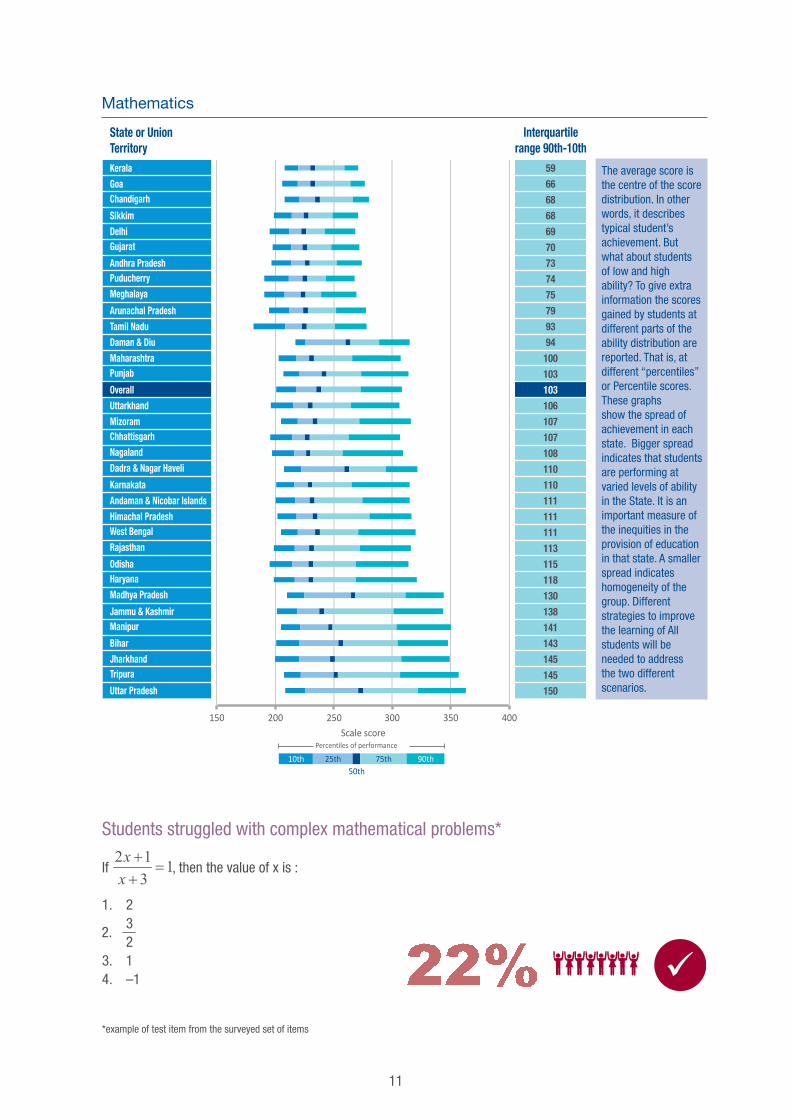
The average score is the centre of the score distribution. In other words, it describes typical student’s achievement. But what about students of low and high ability? To give extra information the scores gained by students at different parts of the ability distribution are reported. That is, at different “percentiles” or Percentile scores.These graphs show the spread of achievement in each state. Bigger spread indicates that students are performing at varied levels of ability in the State. It is an important measure of the inequities in the provision of education in that state. A smaller spread indicates homogeneity of the group. Different strategies to improve the learning of All students will be needed to address the two different scenarios.

10
Achievement by subject: Mathematics
Where the task was clearly set out and uncomplicated students tended to do well*
Three exterior angles of a quadrilateral are 70o, 80o and 100o. Thefourth exterior angle is :
1. 70o
2. 80o
3. 100o
4. 110o
*example of test item from the surveyed set of items
53%
11
Mathematics
Students struggled with complex mathematical problems*
If , then the value of x is :
1. 2 3 23. 14. –1
*example of test item from the surveyed set of items
2.
The average score is the centre of the score distribution. In other words, it describes typical student’s achievement. But what about students of low and high ability? To give extra information the scores gained by students at different parts of the ability distribution are reported. That is, at different “percentiles” or Percentile scores.These graphs show the spread of achievement in each state. Bigger spread indicates that students are performing at varied levels of ability in the State. It is an important measure of the inequities in the provision of education in that state. A smaller spread indicates homogeneity of the group. Different strategies to improve the learning of All students will be needed to address the two different scenarios.

12
Achievement by subject: Science
Students were good at simple recall questions*
Chlorination is the process to purify water. It is done to
1. remove harmful gases.
2. separate suspended impurities.
3. kill harmful germs.
4. change the colour of water.
*example of test item from the surveyed set of items
44%

13
Students struggled in questions that required reasoning*
Given below is a list of doctor’s advice to a person.– Get your blood glucose checked regularly– Control your diet– Exercise regularly– Take your medicines without fail
The person to whom this advice is given is likely to be a1. growing child having respiratory problem.2. person suffering from diabetes.3. pregnant woman of 35 years age.4. hockey player injured in a match.
*example of test item from the surveyed set of items
29%
Science
The average score is the centre of the score distribution. In other words, it describes typical student’s achievement. But what about students of low and high ability? To give extra information the scores gained by students at different parts of the ability distribution are reported. That is, at different “percentiles” or Percentile scores.These graphs show the spread of achievement in each state. Bigger spread indicates that students are performing at varied levels of ability in the State. It is an important measure of the inequities in the provision of education in that state. A smaller spread indicates homogeneity of the group. Different strategies to improve the learning of All students will be needed to address the two different scenarios.
14
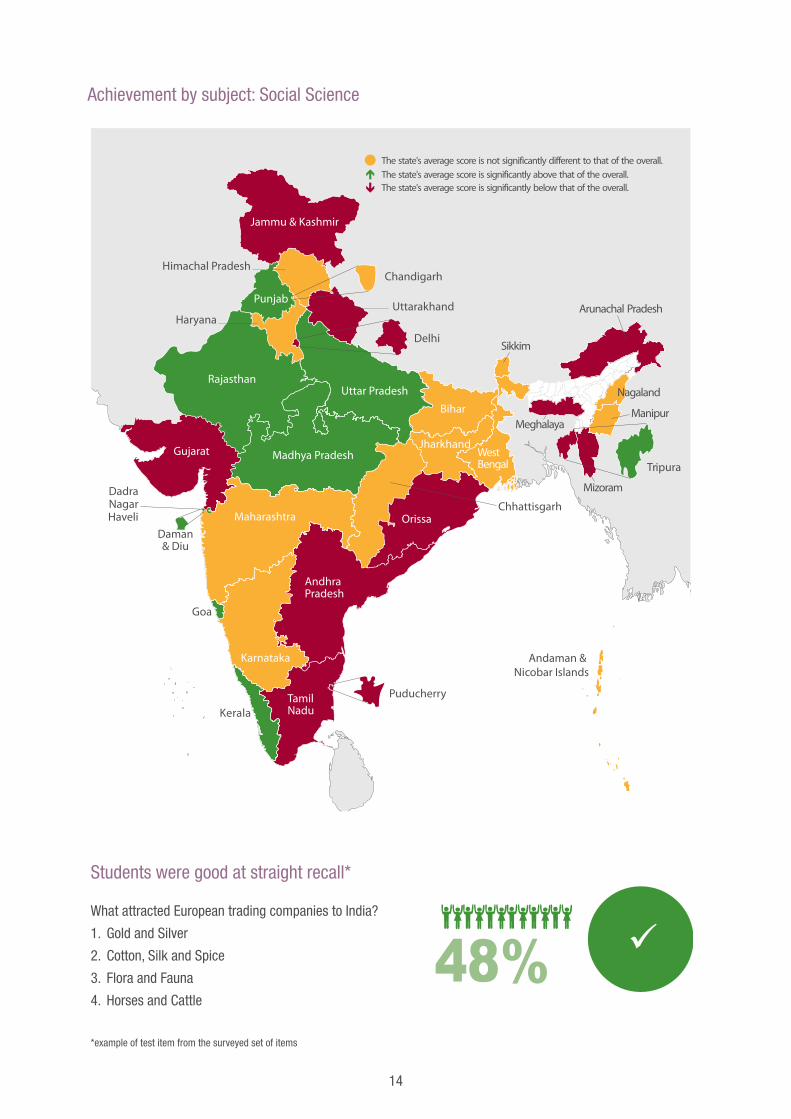
Achievement by subject: Social Science
Students were good at straight recall*
What attracted European trading companies to India?
1. Gold and Silver
2. Cotton, Silk and Spice
3. Flora and Fauna
4. Horses and Cattle
*example of test item from the surveyed set of items

15
Students struggled with questions that required application and reasoning*
A powerful caste decided to teach Rathnam a lesson. They set his hut on fire. He escaped and filed a case in a local police station. Which of the following acts rescues him?
1. Sedition Act 1870
2. Civil Rights Act 1964
3. Prevention of Atrocities Act 1989
4. Minimum Wages Act 1948
*example of test item from the surveyed set of items
33%
Social Science
The average score is the centre of the score distribution. In other words, it describes typical student’s achievement. But what about students of low and high ability? To give extra information the scores gained by students at different parts of the ability distribution are reported. That is, at different “percentiles” or Percentile scores.These graphs show the spread of achievement in each state. Bigger spread indicates that students are performing at varied levels of ability in the State. It is an important measure of the inequities in the provision of education in that state. A smaller spread indicates homogeneity of the group. Different strategies to improve the learning of All students will be needed to address the two different scenarios.

16
The NAS survey used three questionnaires designed for schools, teachers and pupils, to collect information on background factors that could potentially influence learning outcomes.
The results from these findings*, however, do need to be treated with caution and should only be used to indicate where more research and study can be usefully done to help guide educational improvement. They also show only where a certain factor is associated with improved achievement and not that it necessarily causes it. For example behaviour problems such as absenteeism are associated with lower achievement but there might be other factors which contibute to lower achievement. Some factors lie outside the school and educational system, for example parent’s education and the number of siblings both are associated with achievement. But some background factors are under the control of the educations system and by looking at how these impact upon achievement we can identify areas where policy makers and academicians can research further to determine what the problems are, what seems to work and how they can best improve performance.
The more significant of these factors are taken into account when determining if other factors have an impact and are called the ‘key variables’. Socio-economic status, language spoken at home and location (urban/rural) of the school are treated as ‘key variables’ because of their importance to educational success.
Home factors The results suggest that coming from a larger family is associated with lower than average performance. Students with only one sibling outperform by a small, but statistically significant amount, those who have two or more brothers and sisters. Similarly the results suggest that the higher the parents education the more likely a student is to do well. Similarly if the language spoken at home is the same as the language of instruction or whether the school is in an urban or rural environment can be associated with the achievement.
School factors There are several school factors associated with achievement. Government aided schools have lower performance, even when the key factors such as socio-economic status of parents, location etc. are taken into account. Similarly schools with pucca buildings tend to do better. Co-ed schools do better than single sex schools. Students who go to schools which have a 6 day week do better than those which have a 5 day week. Similarly students at schools which have more than 180 working days a year tend
to achieve better than those with fewer working days per year than this. Greater time on task by the student has a positive influence on the student performance.
*The associations are based on analysis of Mathematics results
Background factors – survey results

17
School leadership and governance School leadership and governance seems to have a key role in achievement. Students at schools where the head teachers also teach classes tend to do better.Students at schools which have been inspected tend to do better. Students at schools who reported behaviour problems, such as late arrivals, absenteeism, skipping classes or violations of school rules, tend to do worse. Having VEC/AEC/SMC committees is associated with better performance.
The pupils’ perspectiveThe pupils perspective is very important and anythingthat affects a students’ ability or desire to attendschool regularly and pay more attention in variouscurricular activities could be associated with achievement. To help encourage students to attend and stay in school more regularly, schools are offering various incentives. Incentive schemes such as offering
a midday meal, free uniforms and scholarships appearto be associated with higher achievement. Of theseincentives, scholarships seemed to have the highestimpact.
Teaching and learning approaches
The teacher has a key role in mediating learning and the study looked at various factors around the teacher and their teaching practices. Students who had their homework checked by their teacher every day tend to do better. What the teacher asks students to do in class also is associated with student achievement levels. Students who reported that they work with other students in small groups in solving mathematical problems tended to perform significantly better in mathematics than those who did not.

18
The Class VIII NAS is important in its own right, but it cannot answer every question on the quality of India’s elementary education.
National Achievement Surveys provide reliable information about levels of educational outcome and also give quantitative data about the relationships between background variables and outcomes. This objective information is an important starting point for identifying challenges within teaching and learning and deciding on the best way to improve educational processes. For example, NASresults can identify the questions thatstudents at different levels of ability findmost difficult. It is then for curriculum expertsand teachers to decide how such difficultiescan be resolved by, for example, changingteaching practice and improving textbooksand other materials.
Making the most of the resultsEach NAS cycle should be followed by further analysis and action by national and state level decision makers. For example, state educational authorities should review findings within their local context and against local priorities. It is recommended that state-specific reports and corresponding action plans are produced.
Ongoing improvementsThe Class VIII Cycle 3 NAS was more sophisticated than earlier surveys, however conducting large-scale assessments in India remains technically challenging.
Three lessons learnt during this latest survey offer the potential to improve future NAS cycles:
• Future rounds of NAS should focus on better defining what students can and cannot do to help develop levels of performance that can easily be understood. Resulting in development of a robust assessment framework.
• Development of future survey tests should be based on wider debate on which curriculum domains should be given priority –should surveys focus on subject curricula or on identified learning outcomes.
• To maximise the value of National Achievement Surveys the findings and implications need to be communicated to a wider audiences and follow up actions on policy and practices taken.
Data is just the start – what next?
Find out more:
The full NAS Class VIII report will be availableonline from March 2014. To read this andother NAS reports please visit the websites:
www.ncert.nic.inwww.ssatcfund.orgwww.rmsatca.org


Supported by
RMSA – TEChNICAl COOpERATION AgENCy
NCERT•NewDelhi110016
E: [email protected], [email protected]
W: www.ncert.nic.in, www.rmsatca.org