what works - interactive brokers€¦ · what works in technical analysis adam grimes waverly...
TRANSCRIPT

What Works in Technical Analysis
Adam Grimes Waverly Advisors, CIO

© 2016 by Waverly Advisors, LLC. All rights reserved. No part of this publication may be reproduced, distributed, or transmitted in any form or by any means except in the case of brief quotations embodied in critical reviews and certain other noncommercial uses permitted by
copyright law. For other permission requests, contact the author.
Outline: – What does it mean to have an edge in the market?
– A look at some tools from traditional technical analysis.
– A valid framework for market analysis
– Basic price tendencies
– What does it take to trade successfully?

© 2016 by Waverly Advisors, LLC. All rights reserved. No part of this publication may be reproduced, distributed, or transmitted in any form or by any means except in the case of brief quotations embodied in critical reviews and certain other noncommercial uses permitted by
copyright law. For other permission requests, contact the author.
Key Assumptions: – Markets are very close to efficient.
– New information is quickly and properly assimilated into prices.
– Financial markets are extremely competitive with many smart, well-capitalized players.
– It is extremely difficult to make money in the market.
– It is absolutely essential to have an edge in the market to make money.

© 2016 by Waverly Advisors, LLC. All rights reserved. No part of this publication may be reproduced, distributed, or transmitted in any form or by any means except in the case of brief quotations embodied in critical reviews and certain other noncommercial uses permitted by
copyright law. For other permission requests, contact the author.
What Does It Mean to Have an Edge? – Several possible definitions: Relative returns
– Superior risk-adjusted profits – Implies a benchmark
Absolute returns
– Over a large set of trades, a trader working with an edge will (possibly) realize a return greater than the baseline return of the market or markets he is trading.
© 2016 by Waverly Advisors, LLC. All rights reserved. No part of this publication may be reproduced, distributed, or transmitted in any form or by any means except in the case of brief quotations embodied in critical reviews and certain other noncommercial uses permitted by
copyright law. For other permission requests, contact the author.
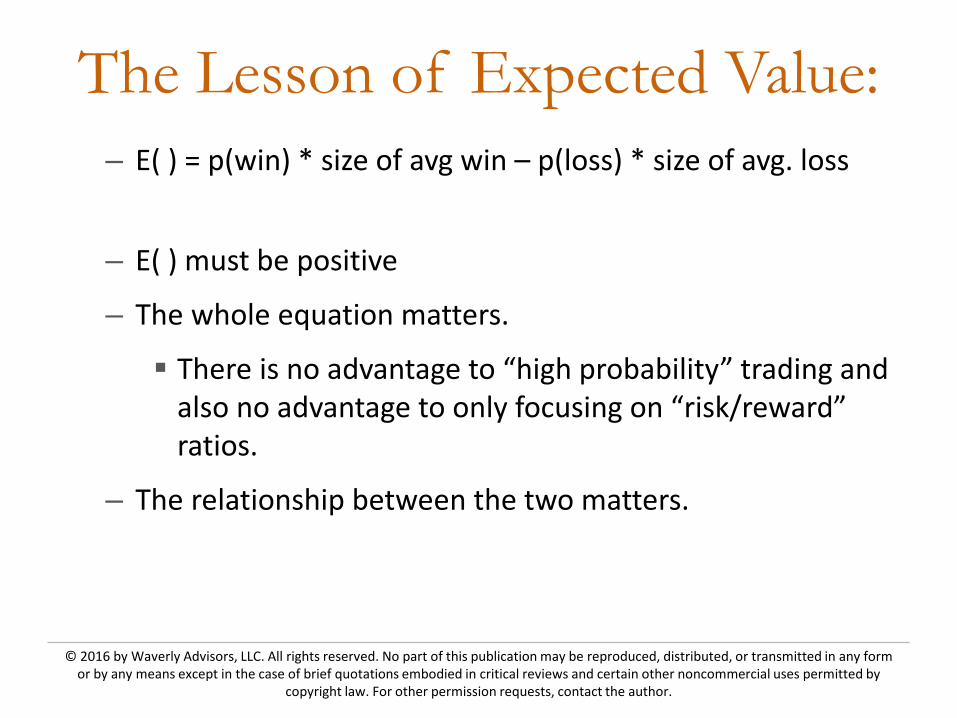
The Lesson of Expected Value: – E( ) = p(win) * size of avg win – p(loss) * size of avg. loss
– E( ) must be positive
– The whole equation matters.
There is no advantage to “high probability” trading and also no advantage to only focusing on “risk/reward” ratios.
– The relationship between the two matters.

© 2016 by Waverly Advisors, LLC. All rights reserved. No part of this publication may be reproduced, distributed, or transmitted in any form or by any means except in the case of brief quotations embodied in critical reviews and certain other noncommercial uses permitted by
copyright law. For other permission requests, contact the author.
Where Do People Look for an Edge? – Fundamental Analysis
– Macro
– Arbitrage
– Trading Volatility
– Traditional Technical Analysis
– Relative Value (Spread trading)

© 2016 by Waverly Advisors, LLC. All rights reserved. No part of this publication may be reproduced, distributed, or transmitted in any form or by any means except in the case of brief quotations embodied in critical reviews and certain other noncommercial uses permitted by
copyright law. For other permission requests, contact the author.
A Pattern Analysis Methodology: – Define test universe Asset classes Market environments Consider correlation
– Define pattern to be tested Must be testable Simple is better
– Find all occurrences of the pattern and record subsequent returns
– Compare qualified returns with baseline returns

© 2016 by Waverly Advisors, LLC. All rights reserved. No part of this publication may be reproduced, distributed, or transmitted in any form or by any means except in the case of brief quotations embodied in critical reviews and certain other noncommercial uses permitted by
copyright law. For other permission requests, contact the author.
Traditional Technical Analysis: – Technical Analysis is largely market lore and superstition.
– Mostly untested and much of it is untestable
– Concepts are often poorly defined and subjective.
– Traders often do not understand the reasons for their own success, so transmission of valid trading methods has been problematic.
© 2016 by Waverly Advisors, LLC. All rights reserved. No part of this publication may be reproduced, distributed, or transmitted in any form or by any means except in the case of brief quotations embodied in critical reviews and certain other noncommercial uses permitted by
copyright law. For other permission requests, contact the author.
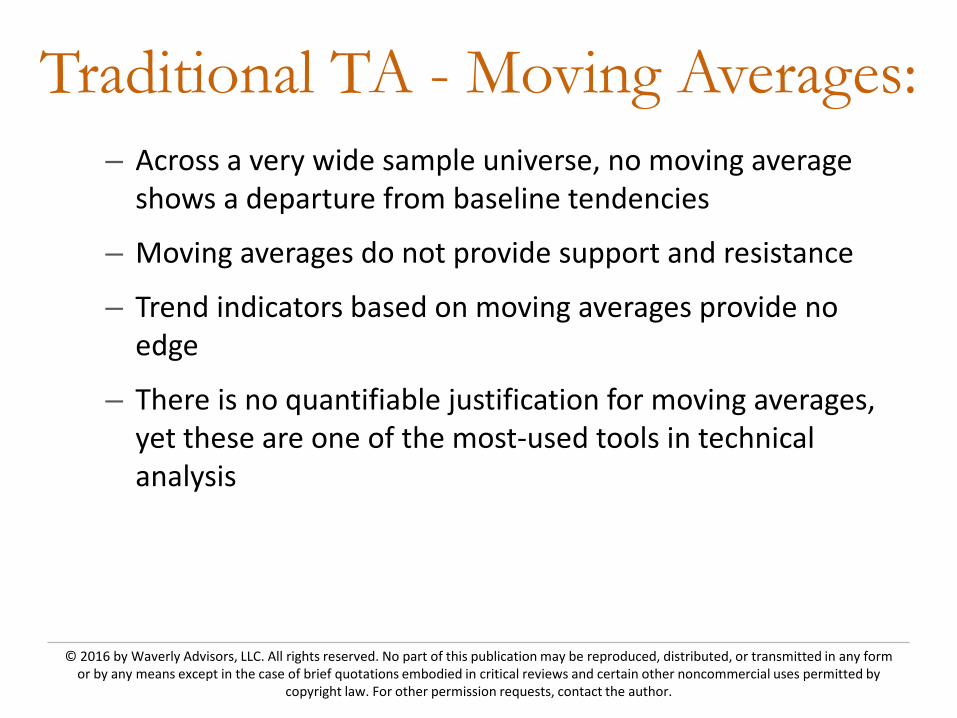
Traditional TA - Moving Averages: – Across a very wide sample universe, no moving average
shows a departure from baseline tendencies
– Moving averages do not provide support and resistance
– Trend indicators based on moving averages provide no edge
– There is no quantifiable justification for moving averages, yet these are one of the most-used tools in technical analysis

© 2016 by Waverly Advisors, LLC. All rights reserved. No part of this publication may be reproduced, distributed, or transmitted in any form or by any means except in the case of brief quotations embodied in critical reviews and certain other noncommercial uses permitted by
copyright law. For other permission requests, contact the author.
Testing Moving Averages: – Are there any distinguishable differences between price
movement after price engages a moving average?
– Are there special moving averages? (50 day, 200 day, etc?) If so, they should be different from non-special averages.
– Test many different periods of MAs
– Consider both ‘touch and hold’ and ‘penetration’ scenarios.

© 2016 by Waverly Advisors, LLC. All rights reserved. No part of this publication may be reproduced, distributed, or transmitted in any form or by any means except in the case of brief quotations embodied in critical reviews and certain other noncommercial uses permitted by
copyright law. For other permission requests, contact the author.
Testing Moving Averages:

© 2016 by Waverly Advisors, LLC. All rights reserved. No part of this publication may be reproduced, distributed, or transmitted in any form or by any means except in the case of brief quotations embodied in critical reviews and certain other noncommercial uses permitted by
copyright law. For other permission requests, contact the author.
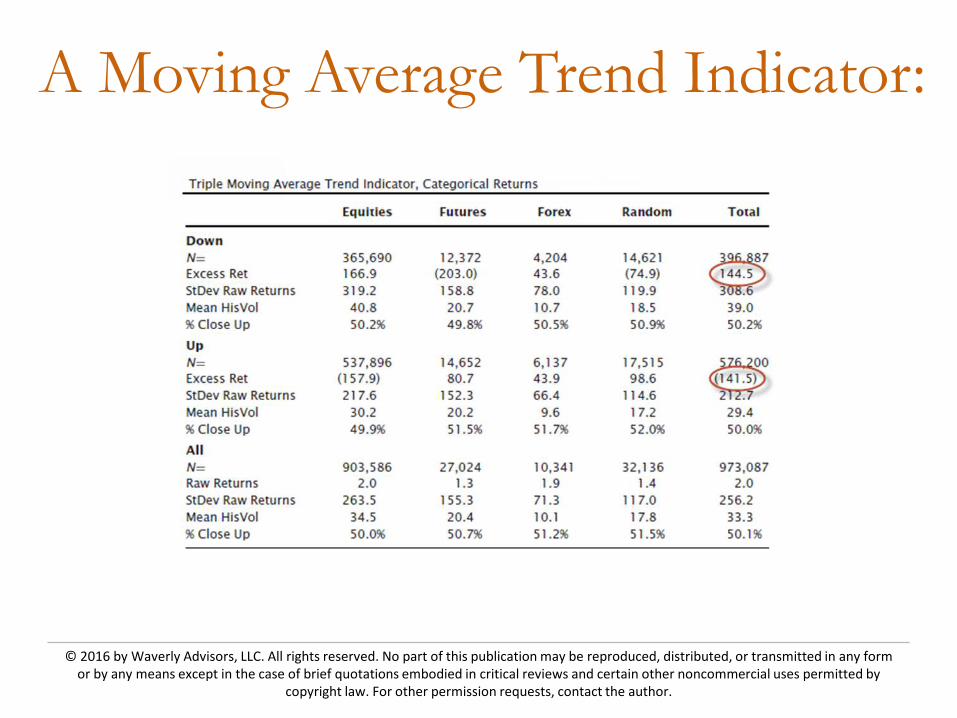
Testing Moving Averages - Conclusions:
– Across a very wide sample universe, no moving average shows a departure from baseline tendencies.
– Moving averages do not provide support and resistance.
– Trend indicators based on moving averages provide no edge.
– There is no quantifiable justification for moving averages, yet these are one of the most-used tools in technical analysis.
© 2016 by Waverly Advisors, LLC. All rights reserved. No part of this publication may be reproduced, distributed, or transmitted in any form or by any means except in the case of brief quotations embodied in critical reviews and certain other noncommercial uses permitted by
copyright law. For other permission requests, contact the author.
A Moving Average Trend Indicator:

© 2016 by Waverly Advisors, LLC. All rights reserved. No part of this publication may be reproduced, distributed, or transmitted in any form or by any means except in the case of brief quotations embodied in critical reviews and certain other noncommercial uses permitted by
copyright law. For other permission requests, contact the author.
Traditional TA: Fibonacci Ratios: – Traders look for support and resistance at common
Fibonacci retracements 38.2% 61.8% 50.0%
– Retracement ratios are used many ways – Entering trades near retracement ratios – Placing stops just beyond retracement ratios – Using “Fibonacci numbers” as inputs into other technical
studies – How to test this?

© 2016 by Waverly Advisors, LLC. All rights reserved. No part of this publication may be reproduced, distributed, or transmitted in any form or by any means except in the case of brief quotations embodied in critical reviews and certain other noncommercial uses permitted by
copyright law. For other permission requests, contact the author.
How Retracement Ratios are “supposed to” work:

© 2016 by Waverly Advisors, LLC. All rights reserved. No part of this publication may be reproduced, distributed, or transmitted in any form or by any means except in the case of brief quotations embodied in critical reviews and certain other noncommercial uses permitted by
copyright law. For other permission requests, contact the author.
Fibonacci Test: – Create a tool that defines “swings” in markets – Many ways to do this – Consider volatility, price movement, etc. – Measure each swing relative to previous swing – Can qualify in other ways – “Good” trades vs “bad” trades – If Fibonacci ratios work, a histogram of retracements
should look like this:

© 2016 by Waverly Advisors, LLC. All rights reserved. No part of this publication may be reproduced, distributed, or transmitted in any form or by any means except in the case of brief quotations embodied in critical reviews and certain other noncommercial uses permitted by
copyright law. For other permission requests, contact the author.
Retracement Ratios: What the Data Says

© 2016 by Waverly Advisors, LLC. All rights reserved. No part of this publication may be reproduced, distributed, or transmitted in any form or by any means except in the case of brief quotations embodied in critical reviews and certain other noncommercial uses permitted by
copyright law. For other permission requests, contact the author.
Enough of What Doesn’t Work… What Does?
– Markets are usually in equilibrium and usually move randomly. No technical edge is possible in such an environment.
– Patterns in prices are determined by the interaction of buying and selling interests.
This is profoundly important because it means that behavioral factors can influence price patterns.
– Every technical edge we have, as technical traders, comes from an imbalance of buying and selling pressure.

© 2016 by Waverly Advisors, LLC. All rights reserved. No part of this publication may be reproduced, distributed, or transmitted in any form or by any means except in the case of brief quotations embodied in critical reviews and certain other noncommercial uses permitted by
copyright law. For other permission requests, contact the author.
A Framework for Technical Analysis: – Two basic forces in price movement: Mean reversion Range expansion
– Find patterns that have a statistical edge.
– Which of the forces is more likely to be in play?
– We only want to be involved in markets when there is an edge.
– Exposure = risk

© 2016 by Waverly Advisors, LLC. All rights reserved. No part of this publication may be reproduced, distributed, or transmitted in any form or by any means except in the case of brief quotations embodied in critical reviews and certain other noncommercial uses permitted by
copyright law. For other permission requests, contact the author.
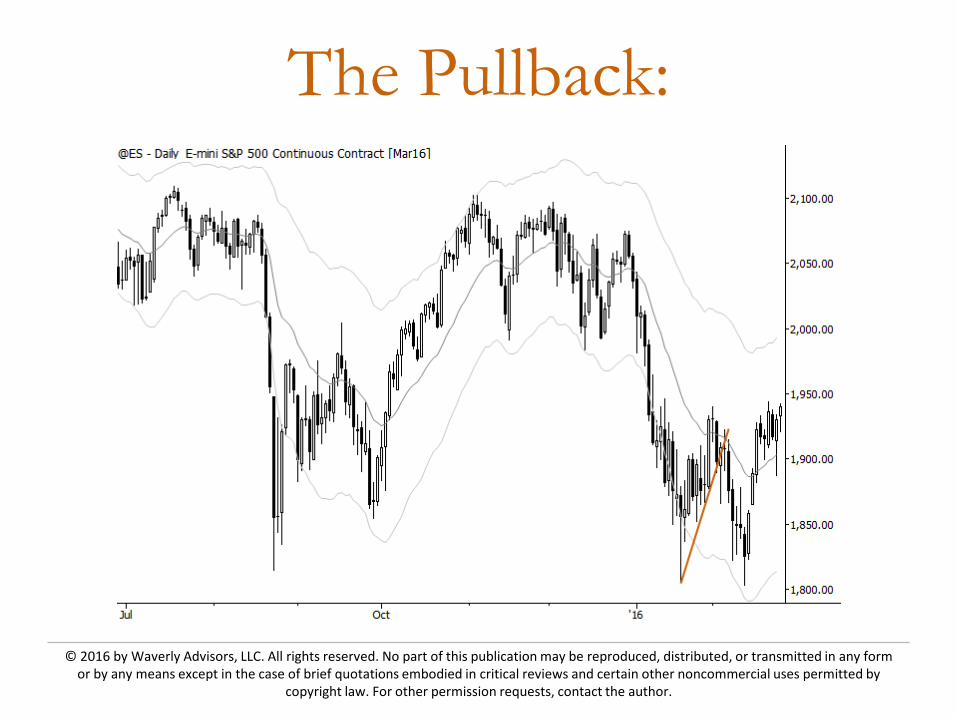
Some Basic Patterns: – A market makes a sharp move in one direction followed by
a pause or pullback. This generally sets up another move in the same direction. Pullback trades Flags
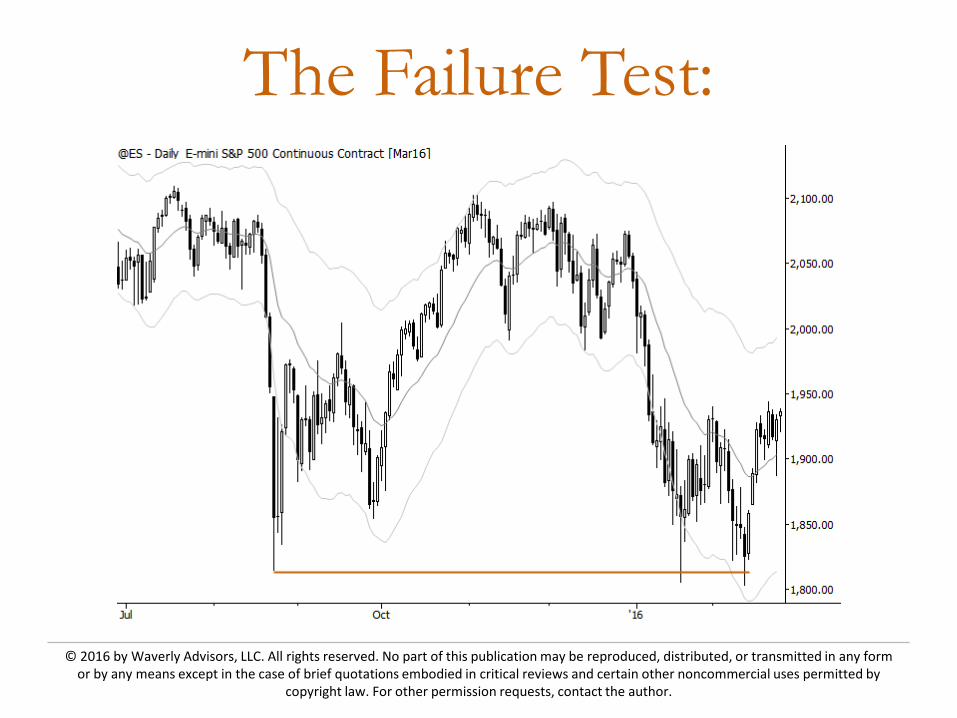
– A market probes beyond a previous level, but finds no conviction there. Failure test “2B trade” Bull or bear traps Wyckoff springs and upthrusts

© 2016 by Waverly Advisors, LLC. All rights reserved. No part of this publication may be reproduced, distributed, or transmitted in any form or by any means except in the case of brief quotations embodied in critical reviews and certain other noncommercial uses permitted by
copyright law. For other permission requests, contact the author.
The Failure Test:

© 2016 by Waverly Advisors, LLC. All rights reserved. No part of this publication may be reproduced, distributed, or transmitted in any form or by any means except in the case of brief quotations embodied in critical reviews and certain other noncommercial uses permitted by
copyright law. For other permission requests, contact the author.
The Pullback:

© 2016 by Waverly Advisors, LLC. All rights reserved. No part of this publication may be reproduced, distributed, or transmitted in any form or by any means except in the case of brief quotations embodied in critical reviews and certain other noncommercial uses permitted by
copyright law. For other permission requests, contact the author.
The Pullback
© 2016 by Waverly Advisors, LLC. All rights reserved. No part of this publication may be reproduced, distributed, or transmitted in any form or by any means except in the case of brief quotations embodied in critical reviews and certain other noncommercial uses permitted by
copyright law. For other permission requests, contact the author.
The Pullback:

© 2016 by Waverly Advisors, LLC. All rights reserved. No part of this publication may be reproduced, distributed, or transmitted in any form or by any means except in the case of brief quotations embodied in critical reviews and certain other noncommercial uses permitted by
copyright law. For other permission requests, contact the author.
Quantitative Screens Traders and investors work across a spectrum from
purely quantitative to purely discretionary. It may be a mistake to see these as opposites
– Successful discretionary trading is guided by quantitative principles.
– Successful discretionary trading requires “knowing the odds” – Successful quantitative work incorporates some element of
discretion. – If nothing else, we have to decide what to test (what to do that
quantitative work on), and that requires some discretion!
Blending quantitative and discretionary tools is a possibility.

© 2016 by Waverly Advisors, LLC. All rights reserved. No part of this publication may be reproduced, distributed, or transmitted in any form or by any means except in the case of brief quotations embodied in critical reviews and certain other noncommercial uses permitted by
copyright law. For other permission requests, contact the author.
A Blended Approach There are many stock “screeners”, but a key question
that is never asked: what edge does the screener have? – In other words, when the screen conditions align, does it
say anything about the future direction of the market? – (This is simply the same methodology we apply to patterns.)
One way to blend quantitative and discretionary tools is to combine a certain type of screen with human trade entry and risk management.

© 2016 by Waverly Advisors, LLC. All rights reserved. No part of this publication may be reproduced, distributed, or transmitted in any form or by any means except in the case of brief quotations embodied in critical reviews and certain other noncommercial uses permitted by
copyright law. For other permission requests, contact the author.
A Few More Thoughts: – Entry patterns are only one small piece of the puzzle. – The decisions you make after you get into a position (trade
management) are at least as important for profitability. – (The same patterns inform both sets of decisions.)

© 2016 by Waverly Advisors, LLC. All rights reserved. No part of this publication may be reproduced, distributed, or transmitted in any form or by any means except in the case of brief quotations embodied in critical reviews and certain other noncommercial uses permitted by
copyright law. For other permission requests, contact the author.
Behavioral Considerations: – As technical traders, all we are doing is playing the slight
probabilistic tilts in markets. Flipping a coin, but the coin is weighted in our favor.
– Most people can’t trade successfully. Why?
– The market has evolved to put our normal cognitive tools and behavior adaptations against us.
– It is not so much that the market is against us as that the market sets up against ourselves.
– Part of the task of trading is learning to manage behavior and risk.
© 2016 by Waverly Advisors, LLC. All rights reserved. No part of this publication may be reproduced, distributed, or transmitted in any form or by any means except in the case of brief quotations embodied in critical reviews and certain other noncommercial uses permitted by
copyright law. For other permission requests, contact the author.
Tools for Success: – Understanding how markets move
– Using this information to know when to get in and out of trades.
– Discipline
– Consistency
– Correct position sizing

© 2016 by Waverly Advisors, LLC. All rights reserved. No part of this publication may be reproduced, distributed, or transmitted in any form or by any means except in the case of brief quotations embodied in critical reviews and certain other noncommercial uses permitted by
copyright law. For other permission requests, contact the author.
Using Our Research Idea Generation Risk Management Timing Blended systematic/discretionary trades Tactical inputs to existing processes
– Educational background – Using inputs from relative strength, tactical equity tools,
etc. as part of bigger decision making process – Incorporating relative strength – Inputs (return assumptions, etc.) to portfolio processes

© 2016 by Waverly Advisors, LLC. All rights reserved. No part of this publication may be reproduced, distributed, or transmitted in any form or by any means except in the case of brief quotations embodied in critical reviews and certain other noncommercial uses permitted by
copyright law. For other permission requests, contact the author.
My Blog http://adamhgrimes.com
© 2016 by Waverly Advisors, LLC. All rights reserved. No part of this publication may be reproduced, distributed, or transmitted in any form or by any means except in the case of brief quotations embodied in critical reviews and certain other noncommercial uses permitted by
copyright law. For other permission requests, contact the author.
Waverly Advisors, LLC: Research Products
Tactical Playbook – Available on Interactive Brokers – Written for the active trader on the daily/weekly
timeframes – Bigger-picture overview of all liquid asset classes.
Tactical Portfolio Outlook – Contact Waverly Directly
– Written for the longer-term manager / allocator – Focus on Equities, Equity Sectors, and other asset classes

© 2016 by Waverly Advisors, LLC. All rights reserved. No part of this publication may be reproduced, distributed, or transmitted in any form or by any means except in the case of brief quotations embodied in critical reviews and certain other noncommercial uses permitted by
copyright law. For other permission requests, contact the author.
Waverly Advisors 5607 Pittsford-Palmyra Rd. 1034
Pittsford, NY 14534
(607) 684-5300
www.waverlyadvisors.com [email protected]
Adam Grimes Managing Partner, Chief Investment Officer [email protected] Chris Noye Managing Partner [email protected]