what would happen if the m 7.3 (1721) and m 7.4 (1780
TRANSCRIPT

ISPRS Int. J. Geo-Inf. 2021, 10, 657. https://doi.org/10.3390/ijgi10100657 www.mdpi.com/journal/ijgi
Review
What Would Happen if the M 7.3 (1721) and M 7.4 (1780) Historical Earthquakes of Tabriz City (NW Iran) Occurred Again in 2021? Mohammad Ghasemi 1, Sadra Karimzadeh 1,2,3,*, Masashi Matsuoka 3 and Bakhtiar Feizizadeh 1,2
1 Department of Remote Sensing and GIS, University of Tabriz, Tabriz 5166616471, Iran; [email protected] (M.G.); [email protected] (B.F.)
2 Remote Sensing Laboratory, University of Tabriz, Tabriz 5166616471, Iran 3 Department of Architecture and Building Engineering, Tokyo Institute of Technology, 4259-G3-2 Nagatsuta,
Midori-ku, Yokohama 226-8502, Japan; [email protected] * Correspondence: [email protected]
Abstract: Tabriz is located in the northwest of Iran. Two huge earthquakes with magnitudes of 7.4 and 7.3 occurred there in 1780 and 1721. These earthquakes caused considerable damage and casu-alties in Tabriz. Using the method of scenario building, we aim to investigate what would happen if such earthquakes occurred in 2021. This scenario building was carried out using deterministic and GIS-oriented techniques to find the levels of damage and casualties that would occur. This proce-dure included two steps. In the first step, a database of factors affecting the destructive power of earthquakes was prepared. In the next step, hierarchical analysis was used to weigh the data, and then the weighted data were combined with an earthquake intensity map. The obtained results were used to predict the earthquake intensity in Tabriz. According to our results, the earthquake with a magnitude of 7.3 that occurred in 1721 caused huge destruction in the north of Tabriz, as this earth-quake occurred inside the site. However, this earthquake caused minimal damage to the south of the city owing to the geological situation of this area of Tabriz. The earthquake with a magnitude of 7.3 that occurred in 1780 caused less damage because of its distance from the site. In the third step of this analysis, the vulnerability of buildings and the population were examined. According to the estimates, District 4 would experience the highest damage rate in the earthquake of 1721, with 15,477 buildings destroyed, while this area would have a lower damage rate in the earthquake that occurred in 1780. The total casualties in Tabriz would number 152,092 and 505 people in the earth-quakes of 1721 and 1780, respectively.
Keywords: earthquake; intensity; vulnerability; seismic hazard; GIS; Tabriz
1. Introduction The rapid, unplanned growth of cities along with the excessive growth in population
during the past few decades have led to the use of land that is susceptible to seismic move-ment. The lack of suitable urban land for the accommodation of this population has re-sulted in the increased vulnerability of cities to natural disasters, especially earthquakes and landslides. According to the United Nations (UN) and the World Bank, earthquakes are the foremost factor causing life and financial losses around the world [1–3]. This is also true in Iran, which is prone to landslides due to its specific geological and climatic conditions, as well as its topography. This has caused the country to experience incredible yearly losses [4–6].
The risk of earthquakes resulting in natural disasters has always existed for human beings. Despite advances in science and technology, earthquakes are still unpredictable,
Citation: Ghasemi, M.; Karimzadeh,
S.; Matsuoka, M.; Feizizadeh, B.
What Would Happen if the M 7.3
(1721) and M 7.4 (1780) Historical
Earthquakes of Tabriz City (NW
Iran) Occurred Again in 2021? ISPRS
Int. J. Geo-Inf. 2021, 10, 657.
https://doi.org/10.3390/ijgi10100657
Academic Editor: Wolfgang Kainz
Received: 8 August 2021
Accepted: 27 September 2021
Published: 30 September 2021
Publisher’s Note: MDPI stays neu-
tral with regard to jurisdictional
claims in published maps and institu-
tional affiliations.
Copyright: © 2021 by the authors. Li-
censee MDPI, Basel, Switzerland.
This article is an open access article
distributed under the terms and con-
ditions of the Creative Commons At-
tribution (CC BY) license (http://crea-
tivecommons.org/licenses/by/4.0/).

ISPRS Int. J. Geo-Inf. 2021, 10, 657 2 of 40
and frequently cause life and financial losses [7–10]. According to the World Health Or-ganization (WTO), 1150 major earthquakes have occurred in the current century alone [11]. Although natural disasters usually occur in developing areas, developed countries tend to have sufficient resources and equipment to help survivors. However, these are not always available in developing countries [12,13].
Iran is a developing country that has experienced major earthquakes which have caused the collapse of many urban and rural houses, and have taken many lives. For ex-ample, in the last few years, more than 170,000 people died during large earthquakes in Bam, Ahar, Varzaghan, Larijan, Rudbar, Tabas, Kerman, and Torbat Heidarriyeh [14]. The earthquake of Sare-Pol Zahab, Kermanshah, for example, destroyed most of the villages in the area and caused great damage to the city. In total, 620 people died [15]. Recently, a few large earthquakes also occurred which have caused huge damage to cities—e.g., the Si-Sakht earthquake in Bandar Genaveh [16].
Iran is located on the Alpine–Himalayan folded belt, as well as the compression zone resulting from the convergence of the Arabian and Eurasian plates. The convergence of these two plates has caused a regional deformation of the continental crust, with an area of approximately 3,000,000 km2, making the area one of the largest convergence-bounded deformed areas on Earth [17]. The convergence of the Arabian and Eurasian plates at a rate of 2 mm/year has created a complex system of reverse and strike-slip faults (Figure 1a) [18]. Strike-slip faults are among the most important structural elements at the bound-ary of the plates [19]. These faults, which have a length of more than 100 km, have been observed and reported in many seismic continental areas [20].
Figure 1. The tectonics of Iran. (a) is inset map showing Iranian plateu; (b) seismotectonic regions of Iran.
The core of the formation of the city of Tabriz was near the Tabriz Fault, and over time, with the growth of the city, it has become closer to the fault, so that today part of the city is located on the fault .
The 1721 Tabriz earthquake occurred on April 26th, with an epicenter near the west of the city of Tabriz, Iran, at approximately 7:00 in the morning, one and a half hours after sunrise. The earthquake was estimated to have a 7.3 magnitude on the Richter Scale. The

ISPRS Int. J. Geo-Inf. 2021, 10, 657 3 of 40
earthquake occurred along the North Tabriz Fault (NTF). The population of Tabriz in 1721 was about 500,000 people. Over 80,000 deaths occurred as a result of the earthquake, kill-ing over one-sixth of the population [21–24].
The largest historical earthquake in Tabriz, in 1780, occurred on January 8, Friday night, in the southeast of Tabriz. The earthquake was estimated to have a 7.3 magnitude on the Richter Scale. The earthquake occurred along the Tabriz Fault (NTF), in which all of the buildings that had been affected by the 1721 earthquake collapsed, and many build-ings were destroyed. As a result of this earthquake, the palace of the ruler collapsed and all of its inhabitants were killed. The death toll was estimated at approximately 50,000 [21–24]. Alisha Ark, Kaboud Mosque, and Sahib Al-Amr Mosque were damaged due to the mentioned earthquakes, and repairs have been performed; however, there are traces of the earthquake in them.
SEISMOCARE is also a model that runs on an Arc map, and was developed in Greece to estimate the extent of the damage and vulnerability of an area. This model is used as a database for storing information [25]. SELENA is a type of software that can be used to estimate the seismic risk in urban areas using the Capacity Spectrum Method (CSM). The data required for the software are statistics and data related to buildings, the population, and the earthquake scenario, etc. This model constructs a shake map and calculates the probability of economic damage, and the number of lives lost [26,27].
As the vulnerability diagrams differ for different regions of the world, each country needs to have its specific model to assess vulnerability and carry out rapid damage as-sessments. In Iran, the Karmania Hazard Model (KHM) was developed in 2013 by Has-sanzadeh et al. for the city of Kerman. This model has an interactive environment that provides layers of spatial data and the vulnerability coefficients of buildings and the pop-ulation in order to estimate the amount of damage to buildings and facilities that are nec-essary to care for survivors and the injured. In this model, surface and subsurface data, as well as building vulnerability diagrams and resident population statistical data, are used for the estimation of vulnerability [28].
Based on the above-mentioned statements, the main objective of this research is to identify vulnerabilities and estimate losses/damages for planning to reduce them. For this goal, all of the effective parameters—including the geoid shape, topography, lithology, alluvial thickness, groundwater level, sediments, shear wave velocity, and the predomi-nant period of the site—were used through interpolation or conversion to GIS layers to obtain a site amplification map for different areas using the Saati hierarchical weighting method [29,30].
Then, to obtain the maximum seismic intensity map, the site amplification map was combined with the modified Mercalli map for both the 1780 and 1721 earthquakes, and the maximum seismic intensity map was obtained. The information about the types of buildings in the city of Tabriz was updated using detailed and comprehensive plans and field observations. Finally, the vulnerability levels of buildings in the city of Tabriz were calculated for all of the districts for both scenarios of Tabriz’s historical earthquakes.
2. Study Area The study area is the entire metropolis of Tabriz. Tabriz is located in the center of
East Azarbaijan province. It is the most populous city in the northwest of the country, and the fifth-largest city in Iran. The city is located 636 km away from the capital city of Tehran. The average altitude of Tabriz is 1351 m above sea level, and its area is approximately 625 km2. Tabriz city is located at the eastern end of the Tabriz plain in the Sahand foothills. It is bordered by the Inali Mountains on the north, the northern slopes of the Sahand Vol-canic Massif on the south, the trails of the Eynali Mountains on the east, and the Tabriz Plain on the west. Tabriz is like a massive pit surrounded by mountains on three sides. The area to the west is mainly formed by salt marshes. The altitude of the city is 1350 to 1550 m, the general slope of which decreases towards the center and west [31–33].

ISPRS Int. J. Geo-Inf. 2021, 10, 657 4 of 40
The city of Tabriz was developed mainly based on young alluvium. In addition, the city spread across sandstone and Miocene marl in the north, and especially the northeast. It also lies on different areas of Plio-Pleistocene hard conglomerates, sandstones, igneous rocks, Pleocene tuff, and clastic deposits in the south, southeast, and part of the southwest, as well as young alluvium in the southwest. The bedrock of alluvium is composed of Mi-ocene or Pleocene sediments [34–37].
The northern part of the city has been eroded by alluvial fans, including young or relatively old alluvial masses of relatively steep slopes and foothills. Upstream, these sed-iments join the Miocene (upper red formations). Oun Ibn Ali Mountain, with its red color due to red marls and sandstones, forms the northern heights of the city. Tabriz’s northern fault passes between these hard sediments and relatively loose alluvial fans [38,39]. The city of Tabriz has ten districts, the most populous of which is District 4. District 9 is an uninhabited area [32].
Figure 1a indicates the movement of the Saudi plate towards the plateau of Iran, while Figure 1b shows the sedimentary and structural conditions of earthquakes in the country. For a better analysis, Iran has been divided into several segments. This segmen-tation was modified by [40,41], and depicts the large fault of Iran.
Figure 2 indicates the location of the faults in the vicinity of the city of Tabriz, and other faults around the city. This fault has caused earthquakes with high destructive power. The epicenter of the earthquakes in Tabriz and the surrounding area from 1700 to 2021 [16] is shown in the figure, and the locations of the different districts of the Tabriz municipality are also depicted. In order to create the relevant scenario, it is necessary to gain full knowledge of the status of the faults and earthquakes. Due to the different natu-ral features of each district of Tabriz, it is necessary to explain their environmental char-acteristics individually.
Figure 2. Summarized structural map of Tabriz. The seismicity is based on Berberian 1997, the Centroid Moment Tensor (http://www.globalcmt.org/ accessed on 25 August 2021) and the Inter-national Institute of Earthquake Engineering and Seismology (http://www.iiees.ac.ir accessed on 25 August 2021) catalogs between 1900 and 2012. North Tabriz Fault (NTF), South Misho Fault (SMF), and North Misho Fault (NMF).

ISPRS Int. J. Geo-Inf. 2021, 10, 657 5 of 40
The active tectonics in the study area, as in other parts of Iran, result from the con-vergence of the Arabian and Eurasian plates, which, as can be seen in Figure 1, affects the whole country.
The North Tabriz Fault (NTF) is a complex active fault system that lies below the city of Tabriz in NW Iran (Figures 1 and 2). It has an average strike of NW–SE over a length of about 150 km, and appears to be generally close to vertical in the dip. The NTF merges northwest and southeast with zones of reverse faults, the strikes of which have more of a tendency toward east–west [42]. Right-lateral movement along this fault has been docu-mented from the study of aerial photographs and GPS measurements, and can also be seen clearly in the field [43–46]. Geomorphic features and paleo seismological studies northwest of Tabriz city show evidence for repeated surface faulting events along the NTF [47].
The results of these studies indicate a return period of about 300 years for the Tabriz earthquake [48,49]. All of the studies conducted have pointed to the right-lateral strike-slip movement of the NTF due to the general movement of the area, which is the move-ment of the Arabian plate to the north [18,42,44,48–54]. In terms of tectonics, there are several different theories regarding the city of Tabriz.
Based on the studies of Berberian, Iran is divided into regions with similar character-istics, including Zagros of Central Iran, Alborz, and Köpet Dag [31,36]. In terms of the seismicity in the city of Tabriz, the northern fault has been the source of many large earth-quakes. Studies have shown that two large earthquakes have occurred here that have al-most destroyed the city. The first occurred in 1721 in the west of Tabriz, with a magnitude of 7.3, while the second occurred in 1780 in the east of Tabriz, with a magnitude of 7.4. According to Berberian, in the last 76 years, the fault has shown no activity, which indi-cates the possibility that a large earthquake could occur [38,43,55]. Hesami et al. (2003) found the average return period of large earthquakes to be 820 years based on age and the seismic events observed in the excavated trenches. The fact that the last major earthquake occurred in Tabriz in 1780 AD indicates that there is an increased seismic hazard in this area [47].
In Figure 2, above, the positions of the 1721 and 1780 earthquakes and their corre-sponding faults are marked. However, in order to assess the initial seismic hazard, it is necessary to calculate the magnitude of a potential earthquake in a particular area due to a particular fault. The estimated value and perceived intensity in Tabriz were calculated for the fault dataset using various experimental equations. These are summarized in Table 1.
Table 1. Seismic parameters of the faults found in the study area (see Figure 2 for their locations).
Fault Name Length (km) Magnitude of Possible Earthquake
Average Magni-tude
Perceivable MMI in Tabriz Nowroozi [56]
Mohajer and Now-roozi [57] Bonilla et al. [58]
NW-NTF 45 6.7 7 7.5 7 IX+ SE-NTF 46.5 6.7 7 7.6 7.1 VII
SMF 45 6.7 7 7.6 7 VIII F1 14 6 6.5 6.6 6.3 VII F2 9.5 5.8 6.3 6.3 6.2 VII F3 15.3 6 6.6 6.7 6.4 VII F4 13.2 6 6.5 6.6 6.4 VII F5 10.2 5.9 6.2 6.4 6.2 VII
Two historic earthquakes with the same destructive power were simulated in the same situation [59,60]. This value is 10 in the modified Mercalli intensity scale, which amounts to a huge level of destruction. Due to the location of the fault near the northern part of Tabriz and the location of the southern fault relatively far from Tabriz, there is the possibility that a devastating earthquake could take place. A time-series analysis of radar

ISPRS Int. J. Geo-Inf. 2021, 10, 657 6 of 40
images of Tabriz from 2004 to 2010 indicates the accumulation of energy in this area, in-creasing the possibility of an earthquake with a high destructive power occurring along the Tabriz fault [61]. Based on the data obtained from earthquakes that occurred in the northwest of Tabriz, these earthquakes usually occur at a depth of 20 km [58].
3. Method Seismic microzoning evaluation is a major factor in the identification of the earth-
quake impact on the area. Thus, the effect of earthquakes on the site is assessed using various factors that determine the site properties. In the process of seismic microzonation assessment, the most important factors are the geology of the area [62]. The estimation of the seismic hazard for different parts of the world requires different methods and param-eters. Therefore, a standard approach to assess damage has been lacking. This study ben-efits from a relational geodatabase for queries. In this study, we used different parameters and methods with proven accuracy that were utilized in previous studies in Iran. Two previous earthquakes in Tabriz in 1721 and 1780 were used as the scenarios. In order to prepare different parameters for the microzonation stages, it is necessary to create a rich database based on sources from different reputable organizations which include different parameters. The more we increase the number of effective parameters, the higher the ac-curacy will be. The various parameters obtained were collected using field methods and research. The database could affect other steps of seismic microzonation. However, some information that was obtained from different organizations is discrete, and this increases the uncertainty of our calculations. Therefore, we used the shear wave velocity method close to the surface (down to a depth of 30 km) to reduce the uncertainty [63].
This paper deals with the relationship between a hybrid domain map (micro zoning) and a definite risk model in Tabriz. Initially, the primary hazard map and local data were collected from various organizations and stored in a suitable database. The domain map was obtained with the Vs30 measurements, geological components, and recent reports of the geotechnical research group of the subway project.
Consequently, each parameter for a hierarchy process approach requires a specific weight based on expert judgments. We used the KHM (Karmania Hazard Model) stand-ard method, which was designed to assess building and human losses in Iran. Based on a GIS-upheld database, the principal tasks of the presented earthquake scenario can be fol-lowed in 3 steps (Figure 3).
The main steps of the scenario are provided in the flowchart below.

ISPRS Int. J. Geo-Inf. 2021, 10, 657 7 of 40
Figure 3. Flowchart of the 1721 and 1780 earthquake scenarios.
Our first step was the construction of a database based on different resources; this study deals with the relationship between a hybrid domain map (microzoning) and a def-inite risk model in Tabriz. Initially, the hazard map and local data were collected from various organizations and stored in a suitable database. The domain map was obtained with the Vs30 measurements, geological components, and a recent report of the geo-tech-nical research group of the subway project [28].
The catalog of ancient earthquakes was obtained from the studies of Berberian, while the catalog of contemporary earthquakes was obtained from the International Institute of Earthquake Engineering and Seismography based on the spatial coordinates of magni-tude and depth according to the day/month/year; these are provided in Figure 2 [16,59].
Since the type of land involved is one of the important factors in intensity transmis-sion in seismic areas, in order to prepare the land layer, a 1:100,000 geological map was obtained from the Geological Survey of Iran and converted into a GIS layer. This shows that the lands in the southern and southwestern parts of Tabriz have a special geological uniformity. The southern lands are located on the Plio-Pleistocene Formation, which is a combination of conglomerates with volcanic components with high strength (Figure 4c). While the northern part of Tabriz has a complex composition due to the fault, and is com-posed of Miocene sediments with a red conglomerate on Paleozoic rocks, as shown in Figure 4f, the central part of Tabriz was destroyed by old earthquakes. It is located on young alluvium and has a low strength (Figure 4f) [39,60,61,64–66].
In order to evaluate the slope of the region, we used the ALOS 12.5 m digital elevation model (DEM). Based on the obtained data, it can be seen that the city of Tabriz has a lower slope in the city center, and an average slope from west to east. The slope of the southern parts is 5 to 10 degrees [67].
Tabriz is a mountainous city with a high altitude. The altitude of the city starts from 1300 meters and reaches 1750 meters. The central part of Tabriz is located in the low-alti-tude range of 1350 meters. The southern parts have an average height of 1700 meters due to being located at the foothills of Sahand [31,33] (Figure 4e).
Geoid mapping is another important aspect of seismology. Studies have shown that there is a significant spatial relationship between slopes and earthquakes. A geoid slope map was prepared by the International Center for Global Earth Models (ICGEM). To put

ISPRS Int. J. Geo-Inf. 2021, 10, 657 8 of 40
it simply, a geoid is a specific equipotential surface of the Earth's gravitational field that generally corresponds to the surface of open waters, and not the Earth's crust. The amount of geoid in the northwest of Iran—i.e., the study area—is 15 to 25 m [68,69].
Other important parameters used in this study are the thickness of the alluvium layer and the groundwater layer, which were obtained using the Tabriz district water organi-zation. In general, 149 shallow wells (average depth: 30 m) were drilled in Tabriz based on the district’s water information (Figure 4b). It should be noted that—according to the experts of the water organization—due to illegal drilling, the number of wells is greater than this. In this study, we used the wave-cut methodology to investigate the effect of earthquake waves on the soil conditions in 21 stations in different areas of Tabriz (Figure 4). Simply put, when an earthquake occurs, its waves start moving, and when they reach the Earth's surface, the geological conditions of the soil and topographic slope affect the velocity and shear wave of the propagated earthquake. The surface layers are mainly formed in the central and northern regions of alluvial sediments, while in some boreholes, there are weak rock layers such as clay and conglomerate. According to these data, the regional soil can be divided into three general categories, which are listed in Table 2 [65,70,71].
Table 2. Soil profile classification based on the Iranian Code of Practice for the Seismic Resistant Design of Buildings: Standard No. 2800 [72].
Vs (m/s) Description Soil Type
>750
(a) Igneous rock (with coarse and fine grade texture), stiff sedimentary rocks and massive metamorphic
rocks and conglomerate. (b) Stiff soils (compact sand and gravel, very stiff clay) with a thickness more than
30 m above the bedrock.
I
375 ≤ Vs ≤ 750
(a) Loose igneous rocks (i.e., tuff), loose sedimentary rocks, foliated metamorphic rocks and in general
rocks that have become loose and decomposed due to weathering (b) Stiff soils (compact sand and gravel, very stiff clay) having a thickness more than 30 m
above the bedrock.
II
175 ≤ Vs ≤3 75
(a) Rocks that are disintegrated due to weathering. (b) Soils with medium compaction, layers of sand and gravel with medium intra-granular bond and clay
with intermediate compaction.
III

ISPRS Int. J. Geo-Inf. 2021, 10, 657 9 of 40
Figure 4. Effective local factors in the regions of the ten municipalities of Tabriz city. (a) predominant soil map; (b) ground water map; (c) geology map, (d) alluvial thickness map; (e) topography map; (f) sedimentology map.
The southern part of Tabriz has conglomerate igneous rocks and, as shown in Table 2, they have a high thickness and can resist earthquakes. The central area of Tabriz, which is similar to a pit, generally consists of soft sediments with a low thickness that is not resistant to earthquakes.
The data collected from different organizations have discrepancies and shortcom-ings, reducing their accuracy. These shortcomings, such as the distribution of earthquakes and water wells, which are discrete spatial data and show the trend of changes in a par-ticular context within the environment, should be ameliorated. However, these are place-bound and only give information about one place. They can be converted into networks through interpolation to show the changes across the whole surface. In this research, the Kriging method was used, which is the most well-known method used in soil science and geology. Kriging is a geostatistical estimation method based on a weighted moving aver-age that estimates unknown values using the values of known points and a semi-vario-gram. The semi-variogram is the spatial distance-based variance that represents spatial correlation.
The estimated values for unknown points are a linear combination of the values of adjacent samples (1); therefore:
�̂�𝜇𝑘𝑘 = �𝜆𝜆𝑖𝑖
𝑛𝑛
𝑖𝑖=1
𝑥𝑥𝑖𝑖 , (1)
where �̂�𝜇𝑘𝑘 is the Kriging estimate and 𝜆𝜆𝑖𝑖 is the weight vector assigned to the sample. In other words, a Kriging or estimated value is obtained by assigning 𝜆𝜆𝑖𝑖 weights to known values measured at adjacent points. In this method, after measuring the value of the variable for multiple samples, along with its position, the value of the variable in the unsampled points can also be estimated according to its position and distance from the

ISPRS Int. J. Geo-Inf. 2021, 10, 657 10 of 40
known points. This study was performed using the Kriging interpolation tool in ArcGIS software [73–75].
Based on the parameters required in the KHM model, in order to produce the site resonance map the various parameters mentioned above were used, and the map was produced using the AHP weighting method [29,30,76]. The results were weighted based on expert opinions (Figure 5). According to Saaty’s methodology, in order to calculate the parameter weights the values of the columns were added together and divided by the sums of the columns. Thus, the numbers were normalized. Then, the averages of the rows of the normalized table were the relative weight of the measures. The binary comparison of the indicators shows that the geological characteristics and alluvium thickness will have the highest impact and importance. The other parameters are on the next level. In the next step, using the results of pairwise comparisons, a score of between 1 and 9 was assigned to each of the parameter elements (Figure 5), and they were weighted.
One of the advantages of hierarchical analysis is the consistency control in decision-making; in other words, in the process of hierarchical analysis, the consistency of the de-cisions can always be calculated and judged as good, bad, acceptable, or unacceptable. The acceptable range of inconsistency in any system depends on the decision-maker, but in general, Saaty suggests that if the decision inconsistency is higher than 0.1, the decision-maker should reconsider their judgment. In order to produce a site amplification map, the weights obtained from the hierarchical method were applied, these layers were added together, and then the generated map was normalized; the seismic microzonation map (Figure 6) is produced by overlaying and combining the five layers (Figure 5, obtained from Equation (2)).
𝐼𝐼 = �𝐺𝐺𝑖𝑖 𝑀𝑀𝑖𝑖𝑇𝑇𝑖𝑖𝑊𝑊𝑖𝑖𝑆𝑆𝑖𝑖 (2)
Where, I is the seismic amplitude map in area I, Gi is the geology and sedimentology in area I, Wi is the ground water level in area i, Ti is the alluvial thickness in area i, Mi is the Microtremor measurement in area I, and Si is the slope map in area i.
Figure 5. Final analytical hierarchy process adoption for the influential parameters.
ISPRS Int. J. Geo-Inf. 2021, 10, 657 11 of 40
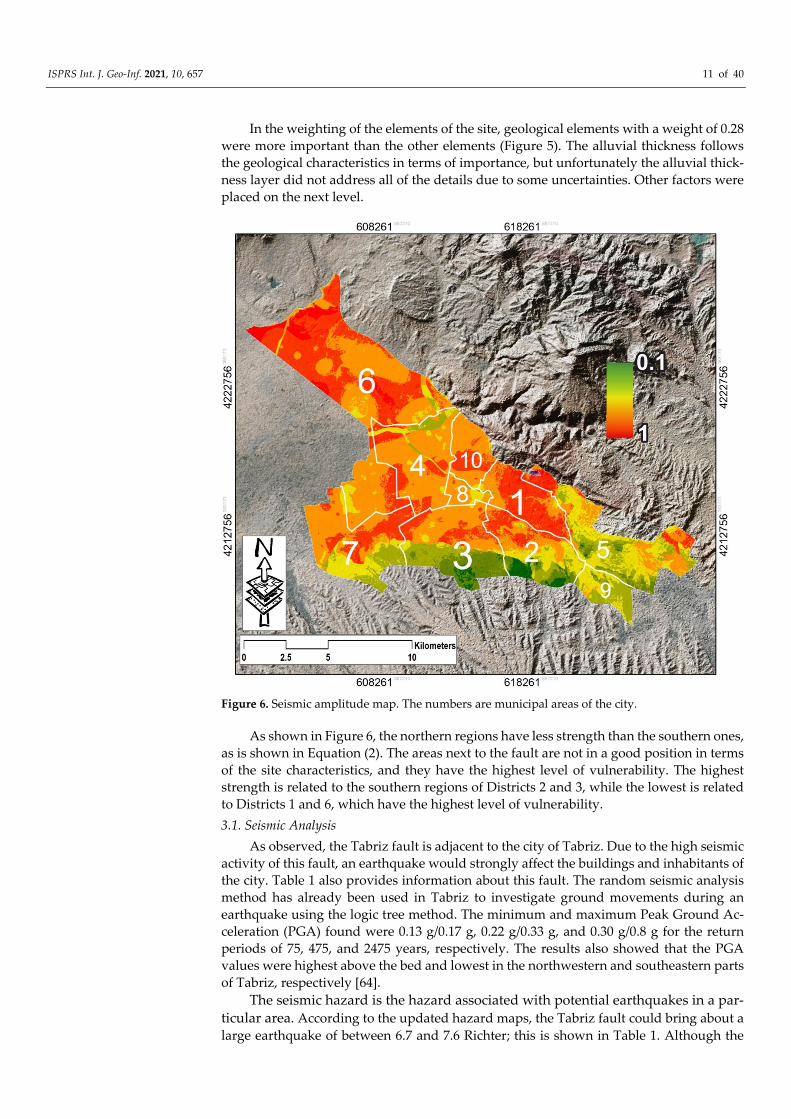
In the weighting of the elements of the site, geological elements with a weight of 0.28 were more important than the other elements (Figure 5). The alluvial thickness follows the geological characteristics in terms of importance, but unfortunately the alluvial thick-ness layer did not address all of the details due to some uncertainties. Other factors were placed on the next level.
Figure 6. Seismic amplitude map. The numbers are municipal areas of the city.
As shown in Figure 6, the northern regions have less strength than the southern ones, as is shown in Equation (2). The areas next to the fault are not in a good position in terms of the site characteristics, and they have the highest level of vulnerability. The highest strength is related to the southern regions of Districts 2 and 3, while the lowest is related to Districts 1 and 6, which have the highest level of vulnerability. 3.1. Seismic Analysis
As observed, the Tabriz fault is adjacent to the city of Tabriz. Due to the high seismic activity of this fault, an earthquake would strongly affect the buildings and inhabitants of the city. Table 1 also provides information about this fault. The random seismic analysis method has already been used in Tabriz to investigate ground movements during an earthquake using the logic tree method. The minimum and maximum Peak Ground Ac-celeration (PGA) found were 0.13 g/0.17 g, 0.22 g/0.33 g, and 0.30 g/0.8 g for the return periods of 75, 475, and 2475 years, respectively. The results also showed that the PGA values were highest above the bed and lowest in the northwestern and southeastern parts of Tabriz, respectively [64].
The seismic hazard is the hazard associated with potential earthquakes in a par-ticular area. According to the updated hazard maps, the Tabriz fault could bring about a large earthquake of between 6.7 and 7.6 Richter; this is shown in Table 1. Although the
ISPRS Int. J. Geo-Inf. 2021, 10, 657 12 of 40
Probabilistic Seismic Hazard Analysis (PSHA) is well known to be the best method for seismic hazard studies [77], it is mostly theoretical, and may lead to overly conservative public policy [54,63]. This is in contrast with the deterministic method, which is easily applicable in the GIS environment. Deterministic Seismic Hazard Analysis (DSHA) will be more useful due to fault consideration, especially in cases where the tectonic features are fully active and defined, as they are in the Tabriz region. In this approach, the method considers the largest and most valid ground movement [34,54,78–80].
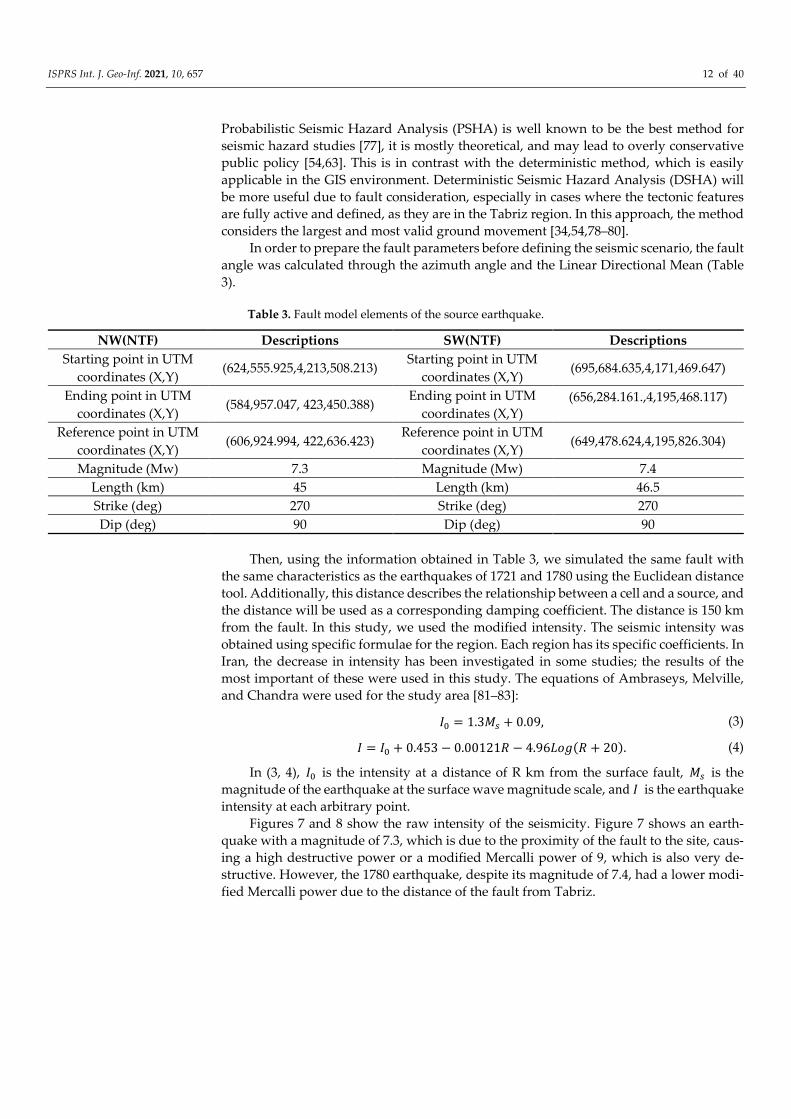
In order to prepare the fault parameters before defining the seismic scenario, the fault angle was calculated through the azimuth angle and the Linear Directional Mean (Table 3).
Table 3. Fault model elements of the source earthquake.
Descriptions SW(NTF) Descriptions NW(NTF)
(695,684.635,4,171,469.647) Starting point in UTM coordinates (X,Y) (624,555.925,4,213,508.213) Starting point in UTM
coordinates (X,Y) (656,284.161.,4,195,468.117)
Ending point in UTM
coordinates (X,Y) (584,957.047, 423,450.388) Ending point in UTM coordinates (X,Y)
(649,478.624,4,195,826.304) Reference point in UTM coordinates (X,Y) (606,924.994, 422,636.423) Reference point in UTM
coordinates (X,Y) 7.4 Magnitude (Mw) 7.3 Magnitude (Mw)
46.5 Length (km) 45 Length (km) 270 Strike (deg) 270 Strike (deg) 90 Dip (deg) 90 Dip (deg)
Then, using the information obtained in Table 3, we simulated the same fault with the same characteristics as the earthquakes of 1721 and 1780 using the Euclidean distance tool. Additionally, this distance describes the relationship between a cell and a source, and the distance will be used as a corresponding damping coefficient. The distance is 150 km from the fault. In this study, we used the modified intensity. The seismic intensity was obtained using specific formulae for the region. Each region has its specific coefficients. In Iran, the decrease in intensity has been investigated in some studies; the results of the most important of these were used in this study. The equations of Ambraseys, Melville, and Chandra were used for the study area [81–83]:
𝐼𝐼0 = 1.3𝑀𝑀𝑠𝑠 + 0.09, (3)
𝐼𝐼 = 𝐼𝐼0 + 0.453 − 0.00121𝑅𝑅 − 4.96𝐿𝐿𝐿𝐿𝐿𝐿(𝑅𝑅 + 20). (4)
In (3, 4), 𝐼𝐼0 is the intensity at a distance of R km from the surface fault, 𝑀𝑀𝑠𝑠 is the magnitude of the earthquake at the surface wave magnitude scale, and 𝐼𝐼 is the earthquake intensity at each arbitrary point.
Figures 7 and 8 show the raw intensity of the seismicity. Figure 7 shows an earth-quake with a magnitude of 7.3, which is due to the proximity of the fault to the site, caus-ing a high destructive power or a modified Mercalli power of 9, which is also very de-structive. However, the 1780 earthquake, despite its magnitude of 7.4, had a lower modi-fied Mercalli power due to the distance of the fault from Tabriz.

ISPRS Int. J. Geo-Inf. 2021, 10, 657 13 of 40
Figure 7. Intensity map of a 7.3 (1721) magnitude earthquake (the Roman numerals represent the Modified Mercalli Intensity).

ISPRS Int. J. Geo-Inf. 2021, 10, 657 14 of 40
Figure 8. Intensity map of a 7.4 (1780) magnitude earthquake (the Roman numerals represent the Modified Mercalli Intensity).
Therefore, for the deterministic seismic analysis in Tabriz, an intensity reduction equation compatible with the site should be selected, and then the magnitude of the earth-quake should be calculated. Using damping equations, it can be shown how strongly the earthquake is felt in each area. The vulnerability diagram is used to analyze the vulnera-bility of buildings in Iran as a function of the Modified Mercalli intensity. Therefore, in-stead of using damping equations based on PGA or PGV, the damping equations based on the MMI, which are given in Equitation 1, were used. The results are plotted in Figures 7 and 8 for the 1721 and 1780 earthquakes, respectively. This shows the high magnitude of the earthquake that took place in 1721.
In order to produce the final map of the magnitude of the earthquake in the city of Tabriz, it is also necessary to take into account the effect of the site. For this purpose, a site intensity map was first prepared and then combined with the earthquake intensity map in Figures 7 and 8 for the 1721 and 1780 earthquakes.
𝐺𝐺𝑆𝑆𝑀𝑀 = �𝑆𝑆𝐼𝐼 (5)
where GSM is the ground shaking map, S is the seismic amplitude map, and I is the intensity map.
The ground shaking map of the earthquake, which is shown in Figure 7 for the 1721 earthquake and Figure 8 for the 1780 earthquake, was combined with the seismic ampli-tude map in Figure 6, and the final map was obtained.
ISPRS Int. J. Geo-Inf. 2021, 10, 657 15 of 40
3.2. Vulnerability Vulnerability is generally used to determine the ways in which buildings and com-
munication networks are damaged in an event. The examination of the vulnerability of existing buildings is a way of predicting the damage from possible earthquakes [84]. Vul-nerability analysis is the process of estimating the vulnerability of certain elements that are potentially at risk due to catastrophic hazards. The most important factors that in-crease the vulnerability of cities include being located on faults, having a high population, not observing construction standards, having large amounts of informal housing, having unprincipled high-rise buildings, using low-quality materials, having an absence of crisis management programs, and having a lack of general training [85–87].
The following is an analysis of the vulnerability of buildings and the population to the two earthquake scenarios of 1721 and 1780.
3.2.1. Vulnerability Analysis of the Buildings The earthquake resistance of buildings varies from region to region and from country
to country. Even if the buildings are similar in appearance to each other, they may be different in terms of their earthquake resistance characteristics. The relationship between the earthquake and the damage ratio is not always the same. Therefore, collecting records of catastrophic earthquakes and extracting the damage function based on local experience is one of the best methods for estimating damage. When the relationship between earth-quake motion and the damage ratio is determined, it becomes possible to estimate the damage caused to a large number of buildings in a large city according to these criteria. In order to evaluate the buildings in Tehran based on the information of buildings in such earthquakes as Ghaenat, Lordegan, and Ardakan, and based on the evaluation of JICA experts, vulnerability diagrams were devised for different types of buildings. The Modi-fied Mercalli Intensity Scale (MMI) was used to produce JICA vulnerability diagrams ac-cording to the type of structure, the year of construction, and the number of floors of the buildings. The building vulnerability diagram based on JICA studies is provided in the following [88].
Figure 9 was obtained using the vulnerability diagram made by Hassanzadeh et al. [28] based on their observations of earthquakes in Iran. It was modified based on the Mer-calli magnitude scale. It shows the extent of the building destruction based on the Mercalli magnitude scale and the type of structure involved. It also classifies the extent of the build-ing destruction into six general categories, as shown in Table 4 [28,88].

ISPRS Int. J. Geo-Inf. 2021, 10, 657 16 of 40
Figure 9. Fragility curves of 6 building types in the study region as a function of the Modified Mercalli Intensity scale (MMI) [88].
Table 4. Description of the building damage level estimated by Hassanzadeh et al. [35] and the corresponding damage level estimated by EMS 1998 [89].
Destruction Level Damage Percent Description No destruction (D6) 0–2 Damages are underestimate
Light destruction (D5) 3–10 Very tiny cracks
Moderate destruction (D4) 11–30 5-20mm cracks are ob-served in the building
High destruction (D3) 31–60
>20mm cracks are observed and some components of the building such as walls
are destroyed
Very high destruction (D2) 61–80 A part of the roof and one
building’s wall is destroyed
Totally destroyed (D1) 81–100 Entire of roof and more
than one building’s wall de-stroyed
According to Table 4, level D1 is the highest level of destruction, meaning that all of the walls and roofs of the structure are destroyed. Level D2 is the next level, meaning a very high rate of destruction, with a large area of the structure being destroyed (at least 60% of the structure is destroyed; all or part of the roof may be destroyed). Then, level D3 means a high level of destruction, causing >20 mm cracks in the walls and ceilings. The cracks widen due to aftershocks. The destruction rate of the structure is at least 30%. Level D4 is the average level of destruction, damaging at least 11% of the structure and leaving 5–20 mm cracks. Level D5 brings about very few cracks, and its destruction rate is 3–10%. At level D6, there is no damage to the building. This condition generally occurs for struc-tures made of reinforced concrete and located at a great distance from the epicenter.
For this study, we collected information from municipality buildings and field obser-vations. This information is in the form of readable maps in the Arc GIS software. The

ISPRS Int. J. Geo-Inf. 2021, 10, 657 17 of 40
information that was prepared in the field was in the form of the IDs of buildings and data columns in Excel. Then, using the tools available in Arc GIS, we joined new data with the existing data through a common field. Descriptive tables can be used to identify the type of structures (using editor tools and update and intersect commands). The current data included descriptive and spatial information that was updated through the tools used for Arc GIS. In general, the conditions of the structures in Tabriz are provided separately in different municipality areas in the form of tables and maps.
In the city of Tabriz, there is no known and fixed model for the construction of build-ings in urban areas or towns. As a result, in each district of the city, we are facing different shapes and types of structures, which have been constructed throughout time. This makes it impossible to relate each area to one type of structure. Accordingly, this study has based its study criteria on the five main classifications of the structure types that are reflected in Figure 17 by collecting information about the type of structure of the buildings in each district. Sample images of each of these classifications are given in Figures 10–14. These images will give you an idea about each category.
Figure 10. RC moment-resisting or shear-wall frame building.
Figure 11. Steel-1 structures up to 3 floors.
Figure 12. Steel-2 structures with more than 3 floors.

ISPRS Int. J. Geo-Inf. 2021, 10, 657 18 of 40
Figure 13. Surrounding masonry wall with an interior steel column.
Figure 14. All interior and exterior walls are made of cement blocks. Table 5 shows the conditions of the structures in the city of Tabriz and its different
districts. In Table 5, RC means reinforced concrete for all buildings with any number of floors. Figure 10 shows several examples in the city of Tabriz. District 3 of Tabriz is ranked first among all of the districts of Tabriz. The neighborhoods of Shahrivar, Kooche Mehran, Saeb, and Pasteur consist of new buildings with strong structures due to devel-opments and renovations. The second type of structure is Steel-1 structures, which are made of steel. They are up to three floors high. These structures are the most frequent ones encountered. In terms of frequency, this type of structure is the most common in District 4. As mentioned previously, this area is densely populated, and all kinds of urban textures can be observed in it. Older structures have been renovated in the last twenty years. Most of the structures are made of steel, which is both less expensive and more resistant than older structures. The third type of structure again includes steel buildings, but with the difference that these types of structures generally have more than three floors. Figure 13 shows several examples of this type of building, mostly in areas that began to develop apartments twenty years ago. This type of structure is more frequently seen in District 1. The fourth type of structure is those that have been built with masonry walls, and that generally do not observe safety principles. These structures are mostly found in suburban areas, and are used by those who only seek shelter. They can be found in other areas as well, but only in very small numbers. These structures are generally old. These structures were far more common before 2011 [31], with their number decreasing due to population growth, the development of the city, and growing awareness of the importance of build-ing safety. New buildings have since replaced them. Figure 13 shows two examples of these structures. These are structures that are made entirely of cement blocks. This type of structure is very rare in the city of Tabriz. More examples are shown in Figure 14.

ISPRS Int. J. Geo-Inf. 2021, 10, 657 19 of 40
Table 5. Building classes and the numbers of buildings.
Type of Building Structure Total Cement Block BS/SS Steel-2 Steel-1 RC 42,230 1 3967 3033 26,180 9049 District 1 30,400 0 13 10,634 9599 10,154 District 2 62,824 1 145 3220 43,107 16,351 District 3 79,804 0 467 1909 67,627 9801 District 4 15,679 3 12 1128 6048 8488 District 5 14,974 86 704 813 11,373 2000 District 6 27,338 0 1 1359 21,329 4649 District 7 22,097 2 135 1216 17,381 3363 District 8 46,257 16 1557 2348 39,392 2944 District 10
106 7001 25,660 242,036 66,799 Total
According to the statistical information shown in Table 5 and Figure 15, District 4 has the largest number of buildings (79,804), as well as the largest population among the 10 districts of Tabriz. A total of 12% of these buildings are made of reinforced concrete, 84% are of type-1 steel, and 2% are of type-2 steel. Less than 1% of the buildings are made of other materials which do not observe engineering principles, using masonry walls. Due to its great age, District 8 (the core of the city, including important historical monuments which survived the historic earthquake of Tabriz, such as the Blue Mosque) is of great importance both inside and outside the country. In this district, 15% of the structures are made of reinforced concrete, mostly in the south of the district. A total of 78% are type-1 steel structures that have been renovated in the last 10 to 20 years. Next, 5% are type-2 steel structures. Additionally, <1% are other types of structures.
In general, the city of Tabriz has the highest number of type-1 and -2 steel structures, which has greatly improved the seismic conditions of the city compared to the last 10 years [33].
Figure 15. Diagram of the status of structures according to the districts of the Tabriz municipality.
Figure 16 shows the distribution of different types of buildings in various districts of Tabriz. These are located in all of the regions, with the exception of District 9. As can be seen, District 5 (Figure 16e) is in better condition than the other districts; most of the build-ings in this district are made of concrete. This is because this is one of the affluent neigh-borhoods of Tabriz, and the buildings here are completely suitable and newly constructed.

ISPRS Int. J. Geo-Inf. 2021, 10, 657 20 of 40
District 1 (Figure 16a) of Tabriz has 42,230 structures. The majority of the structures in the eastern part are concrete, while in the western part most of the structures are type-1 steel. District 2 (Figure 16b) of Tabriz, with 30,400 structures, has a better structural condition, and is improving this situation currently. District 3 (Figure 16c) of Tabriz has the highest number of structures, with 16,351 concrete structures. District 4 (Figure 16d) of Tabriz is in first place in terms of the number of structures, with 79,804. Of these, 67,627 are type-1 steel structures. Additionally, District 6 (Figure 16e) of Tabriz is in a similar situation to District 4 of Tabriz, with most of the structures in this area being type-1 steel. District 7 (Figure 16g) of Tabriz, because it has mostly been used for residential complexes, has type-1 steel structures. It is over 45 years old. District 8 (Figure 16h) of Tabriz is a historical area with 22,097 structures, most of which are type-1 steel. District 10 (Figure 16i) of Tabriz, with 46,257 structures, is one of the smallest areas, and is the most marginalized.
Figure 16. Status of the structural dispersion in the Tabriz municipality areas. (a) district 1; (b) district 2; (c) district 3; (d) district 4; (e) district 5; (f) district 6; (g) district 7; (h) district 8; (i) district 10.
Figure 17 shows the altitude of Tabriz, especially in the suburbs. As shown, the build-ings in these areas do not have enough strength, and create an unsuitable urban fabric. Three areas in the northwest of Districts 1 and 10, and the north of District 4 were organ-ically and quickly filled by immigrants; the structures here are largely unacceptable.

ISPRS Int. J. Geo-Inf. 2021, 10, 657 21 of 40
Figure 17. General condition of the unsuitable urban fabric in Tabriz.
3.2.2. Population Vulnerability Estimation The consequences of accidents include mortality, injury, and damage to property,
products, services and infrastructure. These cause impacts on lifestyles and social and psychological dimensions.
Three-quarters of the world's population has experienced at least one of the four lead-ing causes of death in recent decades. The number of people injured in the last two dec-ades has risen to more than 1.5 million. A total of 1 in every 3000 people who are at risk are killed [90,91].
The most effective way to manage these crises is risk management. Risk management is a process that identifies the level of influence of a hazard in a community; this infor-mation is used to decide on measures to reduce the effects of hazards and deal with them. This process is conducted according to the benefits and costs of risk reduction.
The scenario presented in this report provides a basis for the estimation of the casu-alties caused by these earthquakes. The number of casualties could be effectively used in planning the preparation and adjustment of response operations in crises [91].
In this study, the results of the fragility function presented by the JICA were used. In that report, the solution presented by Coburn et al. was used [92].
The casualties of an earthquake occur due to various mechanisms, such as the col-lapse of buildings, car accidents, heart attacks, and others. Coburn et al. showed that, in most earthquakes, casualties are mainly caused by the collapse of buildings. This factor causes more than 75% of casualties. If we exclude secondary accidents following an earth-quake, this figure could reach approximately 90%. The remaining 25% of the casualties are caused by non-structural factors or subsequent hazards [92].
The rate of casualties in earthquakes that cause low or moderate damage to <5000 buildings is very variable. In these earthquakes, the number of people injured and killed due to non-structural and medical causes makes up a significant share of the total number of casualties. This is due to a combination of different factors, and is largely unpredictable. In more devastating earthquakes, which this study focuses on, the collapse of buildings or landslides account for the majority of deaths [93]. According to JICA studies [88] (Fig-ure 18), the coefficients are such that their relationship with the number of casualties holds for the past earthquakes in Iran. These studies also assume that the earthquake occurs at

ISPRS Int. J. Geo-Inf. 2021, 10, 657 22 of 40
night, and that all residents are at home. Considering the diagrams below, it is interesting that the resulting losses are low (about ten percent) up to a magnitude of eight, and this value reaches 50% and 80% at magnitudes of 9 and 10. Another point is the difference between the loss numbers during the day and night. Casualties are much higher at night, when all of the occupants are indoors, than during the day, when the occupants are more likely to be outdoors or in the more resistant structures of work buildings, etc.
Figure 18. Observations of the casualty ratios in past earthquakes in Iran based on JICA studies [87].
3.3. The Proportion of Casualties in Past Earthquakes in Iran Considering the above items, as shown in Figure 19, relief aid reduces the amplitude
of the diagrams, and thus the proportion of casualties is reduced accordingly. Once the building classes and the number of individuals affected are identified, the probability of casualties (the number of deaths, hospitalized injured, and non-hospitalized population) can be considered, based on questionnaire surveys and reports of previous earthquakes. This is summarized in Table 6. The human vulnerability function (Equation (5)) can then be found for the categories of the buildings and the number of people exposed to an injury level .
H = �BPi ∗ PKi, (6)
where H is the population vulnerability, BPi is the number of people in the buildings in each specific damaged zone, and PKi is the injury probability state (died, hospitalized injured, non-hospitalized, and not injured).

ISPRS Int. J. Geo-Inf. 2021, 10, 657 23 of 40
Table 6. Classification of the expected population damage based on questionnaire surveys and re-ports of previous earthquakes in Iran [94]. Karmania Hazard Model User Manual. Kerman, Iran: Kerman Disaster Management.
Type of Destruction Status of People Damage %
No destruction
Dead 0 Hospitalized 0
Non-hospitalized 1 Not injured 99
Light destruction
Dead 2 Hospitalized 5
Non-hospitalized 9 Not injured 84
Moderate destruction
Dead 4 Hospitalized 9
Non-hospitalized 15 Not injured 72
High destruction
Dead 13 Hospitalized 17
Non-hospitalized 23 Not injured 47
Very high destruction
Dead 16 Hospitalized 22
Non-hospitalized 28 Not injured 34
Totally destroyed
Dead 41 Hospitalized 16
Non-hospitalized 21 Not injured 22
According to the statistics of 2015, the city of Tabriz is the most populous region in northwestern Iran [31] and, according to the statistics published in the statistical yearbook of 2019, the population of Tabriz will see a growth rate of 1.1 percent, based on the statis-tical estimates of the Plan and Budget Organization [94]. A statistical rate of population growth of 1.1% estimates that the population will be 1,842,904, of which the majority will live in District 4, with a population of 444,443, as shown in Figure 19. District 10 also has a high density, with a population of 321,519, who are generally marginalized. The western area of District 1 also has a high density. District 9 is empty of inhabitants because it was constructed only recently. It can be concluded that areas with time-worn and marginal textures have higher population densities. In the south of Tabriz, in District 2, a certain small area also has a high density. This area is a village that has turned into an urban texture. It has a high population density, and demonstrates the direct relationship be-tween marginalized areas and population density: wherever there is marginalization, a high population density can also be observed. The reported population is related to the neighborhoods of urban areas. In this study, using the building block data obtained, we matched the population of each neighborhood to the building blocks based on the average numbers of households, families, and floors, in order to obtain an estimation of the vul-nerability of the population.

ISPRS Int. J. Geo-Inf. 2021, 10, 657 24 of 40
Figure 19. Population density of Tabriz city in 2019.
4. Results and Discussion The model applied to the scenario of the two historical earthquakes in the city of
Tabriz shows the affected area, while the level of destruction of the buildings shows the levels of day and night casualties for the entire city of Tabriz. These results allow decision-makers to plan what actions must be taken. Figure 20, which illustrates the 1721 earth-quake, shows that the northern part of Tabriz mostly has a high vulnerability to a modi-fied Mercalli magnitude of 9 in the north and a magnitude of 5 in the south. As stated above, District 10 is not in a good condition, and is one of the most marginalized areas of Tabriz. District 1 is located in an area with a maximum intensity of 9, and it has a high level of vulnerability. According to the above, the eastern part of the district is in a better condition in terms of its structures and population, but the western part is in an unfavor-able situation. District 9 of Tabriz is uninhabited, and has only a small number of build-ings, so it was ignored in this study. Districts 2 and 3 are in good condition, and, as we go up, the vulnerability rate increases. The reasons for this are the conditions of both the sites and structures in these areas, which are generally old structures with low strength.
Figure 20. Ground shaking map illustrating the regional extent of the intensity that can be ex-pected from a magnitude 7.3 (1721) earthquake on the North Tabriz Fault.

ISPRS Int. J. Geo-Inf. 2021, 10, 657 25 of 40
According to Figure 21, an intensity of 5 to 8 was obtained in the 1780 earthquake. The Modified Mercalli Intensity of 8 is generally observed in Districts 1 and 5. Other dis-tricts are in better condition. Districts 2 and 3 are better than the others in terms of their vulnerability. In general, the intensity decreases from the center and northeast to the south and northwest. The lowest intensity can be found in District 5.
Figure 21. Ground shaking map illustrating the regional extent of the intensity that can be ex-pected from a magnitude 7.4 (1780) earthquake on the North Tabriz Fault.
4.1. Estimation of the Structural Vulnerability to the Tabriz Earthquake in 1721 with a Magnitude of 7.3 Richter
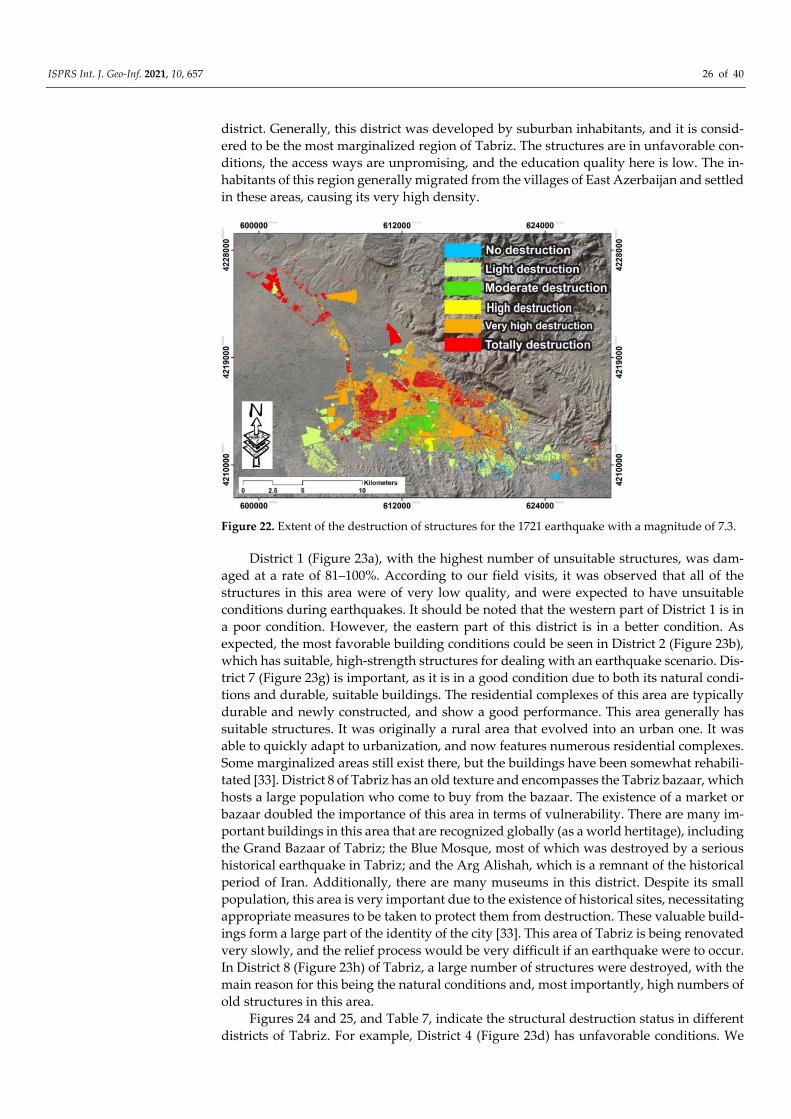
Figure 22 indicates the damage caused to buildings based on the earthquake scenario in the west of Tabriz. As shown in Figure 22, the southern part of Tabriz has a low de-struction rate, the main reason for this being the presence of the foothills of Sahand Moun-tain and the existing natural conditions—i.e., strong bedrock—as well as other factors in-fluencing its vulnerability. The southeast of Tabriz is generally a very suitable area, both ecologically and tectonically, and the buildings located in this area are generally engi-neered strong buildings. This area of the city is generally highly developed, but the neigh-boring areas are still being developed due to the conditions mentioned. These are some of the most dynamic urban areas in Tabriz. The south of Tabriz includes District 2, which is the most developed and dynamic area of Tabriz. This area is located in the south of Tabriz, and has structures of acceptable quality. This district is the most developed area of Tabriz after District 1, and it is the second district in terms of its many floors. Only a small part of this district has unsuitable urban textures, which is the region that was transformed from a rural area to an urban area only recently, and which is currently under construction to improve its conditions [33]. District 3 is a very wide area that includes three types of textures: old textures, new and engineered textures, and marginal textures. It includes the areas of Maralan and Imamiyeh. Under these conditions, the texture becomes older as you move from the south of the district to the north. However, extensive renovation has been carried out in this area. As we travel towards the south, although the tectonic conditions become better, the buildings can be seen to be increasingly unacceptable in terms of urban planning. This has caused a great deal of damage to these buildings, and in general, the center of District 3 in Tabriz is in a more favorable condition due to the renovations that have been performed.
District 10 is a suburban area where unprincipled construction is generally dominant, with masonry walls and poor access ways. There are very unfavorable conditions in this
ISPRS Int. J. Geo-Inf. 2021, 10, 657 26 of 40
district. Generally, this district was developed by suburban inhabitants, and it is consid-ered to be the most marginalized region of Tabriz. The structures are in unfavorable con-ditions, the access ways are unpromising, and the education quality here is low. The in-habitants of this region generally migrated from the villages of East Azerbaijan and settled in these areas, causing its very high density.
Figure 22. Extent of the destruction of structures for the 1721 earthquake with a magnitude of 7.3.
District 1 (Figure 23a), with the highest number of unsuitable structures, was dam-aged at a rate of 81–100%. According to our field visits, it was observed that all of the structures in this area were of very low quality, and were expected to have unsuitable conditions during earthquakes. It should be noted that the western part of District 1 is in a poor condition. However, the eastern part of this district is in a better condition. As expected, the most favorable building conditions could be seen in District 2 (Figure 23b), which has suitable, high-strength structures for dealing with an earthquake scenario. Dis-trict 7 (Figure 23g) is important, as it is in a good condition due to both its natural condi-tions and durable, suitable buildings. The residential complexes of this area are typically durable and newly constructed, and show a good performance. This area generally has suitable structures. It was originally a rural area that evolved into an urban one. It was able to quickly adapt to urbanization, and now features numerous residential complexes. Some marginalized areas still exist there, but the buildings have been somewhat rehabili-tated [33]. District 8 of Tabriz has an old texture and encompasses the Tabriz bazaar, which hosts a large population who come to buy from the bazaar. The existence of a market or bazaar doubled the importance of this area in terms of vulnerability. There are many im-portant buildings in this area that are recognized globally (as a world hertitage), including the Grand Bazaar of Tabriz; the Blue Mosque, most of which was destroyed by a serious historical earthquake in Tabriz; and the Arg Alishah, which is a remnant of the historical period of Iran. Additionally, there are many museums in this district. Despite its small population, this area is very important due to the existence of historical sites, necessitating appropriate measures to be taken to protect them from destruction. These valuable build-ings form a large part of the identity of the city [33]. This area of Tabriz is being renovated very slowly, and the relief process would be very difficult if an earthquake were to occur. In District 8 (Figure 23h) of Tabriz, a large number of structures were destroyed, with the main reason for this being the natural conditions and, most importantly, high numbers of old structures in this area.
Figures 24 and 25, and Table 7, indicate the structural destruction status in different districts of Tabriz. For example, District 4 (Figure 23d) has unfavorable conditions. We

ISPRS Int. J. Geo-Inf. 2021, 10, 657 27 of 40
found a 60–80% destruction rate for 60,205 buildings. These values are very high com-pared to those for the other areas. In this district, these are typical buildings that are old, with weak structures, meaning that they could not resist the earthquakes.
Figure 23. Extent of the destruction of structures for the earthquake of 1721 with a magnitude of 7.3 Richter, by municipal area. (a) district 1; (b) district 2; (c) district 3; (d) district 4; (e) district 5; (f) district 6; (g) district 7; (h) district 8; (i) district 10.
Table 7. Number of buildings damaged in terms of the level of destruction for the 1721 earthquake.
Vulnerability Level Total D6 D5 D4 D3 D2 D1 42,230 6 547 15 538 22,807 18,320 District 1 30,400 2272 11,474 8 349 16,285 12 District 2 62,824 302 3302 29,147 6678 22,817 578 District 3 79,804 2 4125 35 30 60,135 15,477 District 4 15,679 555 7162 158 851 5150 1803 District 5 14,974 0 200 3 8 5919 8844 District 6 27,338 0 17,144 12 0 4347 5835 District 7 22,097 140 38 5097 26 15,211 1585 District 8 46,257 0 419 0 17 24,457 21,364 District 10
- 3277 44,411 34,443 8497 177,128 72,198 Total

ISPRS Int. J. Geo-Inf. 2021, 10, 657 28 of 40
Figure 24. Graph showing the level of destruction of some of the buildings for the earthquake that took place in 1721.
Figure 25. Status of District 1 of Tabriz.
As can be seen in Figure 25 (area B), District 1 has two different textures. In the east, a completely standard texture is observed, with new buildings and large houses. The in-habitants of this area are generally rich. However, the more distance we travel from the east to the west, the more suburban textures we can observe. This area has a completely non-standard urban fabric. The access here is highly unsuitable, and the structures are completely non-standard and made of low-quality materials. Despite being close to rich neighborhoods, poor inhabitants reside in this area who are not economically capable of improving the conditions of their structures. As can be seen in Figure 25 (area A), the

ISPRS Int. J. Geo-Inf. 2021, 10, 657 29 of 40
buildings west of District 1 are generally suitable and strong buildings; in contrast, in the marginal area, the buildings are generally unsuitable. Thus, this area contains two com-pletely separate and unequal regions. Faced with the 1721 earthquake, the eastern part has a high resistance, access to aid, and better access ways, while the western part has inadequate access to aid and is more likely to face serious problems.
4.2. Estimation of the Structural Vulnerability to the Tabriz Earthquake in 1780 with a Magnitude of 7.4 Richter .
As can be seen in Figures 26 and 27, and Table 8, in the southeast of Tabriz the earth-quake induces the lowest amount of damage compared to the 1721 earthquake. Accord-ingly, the highest amount of damage is likely to occur in the east of Tabriz, which would be closer to the center of the earthquake. Districts 1, 2, and 5 would be exposed to the highest magnitude of the earthquake, but due to the high quality of the structures in these areas and the suitable natural conditions, they would have a low rate of destruction. The highest level of destruction is 31–60% for Districts 10, 3, and 4, which would experience a higher level of destruction than the others. In general, District 6 has a lower destruction rate than the other regions due to its distance from the epicenter. According to field visits, it was observed that the main factor causing District 6 to be safe from damage is its dis-tance from the epicenter. Therefore, a less severe earthquake would hit this area, meaning that it would be in better condition. Although District 10 is also far from the epicenter, it would suffer a D3 destruction level due to the existence of time-worn buildings in the suburban area.
.
Figure 26. Extent of the destruction of the buildings according to their municipal area for the earthquake of 1780.

ISPRS Int. J. Geo-Inf. 2021, 10, 657 30 of 40
Table 8. Number of buildings damaged in terms of the level of destruction for the 1780 earthquake.
Vulnerability Level
D6 D5 D4 D3 D2 D1
42,230 110.0 182.0 13,347.0 17,831.0 10,760.0 0.0 District 1 30,400 0 5501 10,963 12,749 1169 18 District 2 62,824 2044 14 18,039 39,726 3001 0 District 3 79,804 139 4553 37,494 36,790 737 91 District 4 15,679 0 0 0 10,144 5490 45 District 5 14,974 54 5923 502 8003 492 0 District 6 27,338 1750 302 15,810 9476 0 0 District 7 22,097 0 200 3021 17,228 1634 14 District 8 46,257 0 0 3410 42,796 51 0 District 10
3987 27,265 106,784 190,259 12,756 278 Total
Figure 27. Graph showing the level of destruction of different buildings for the earthquake of 1780.
4.3. Estimation of the Human Casualties of the 1721 Earthquake in Tabriz, with a Magnitude of 7.3
Tables 9–18 shows the number of casualties in the city of Tabriz after the 1721 earth-quake. As can be seen, the death rate would be 22,280 at night. According to Tables 10, 13, 15, and 18, a large number of these casualties would come from Districts 1, 4, 6, and 10, which accommodate most of the population and have largely unsuitable structures. A total of 802,087 people would remain healthy and not be injured; most of these people would be residents of Districts 2 and 3, which, as can be seen from Tables 9 and 17, have suitable structures. Districts 4, 3, and 10, due to their high population, would have high rates of casualties. District 4 would have the highest mortality rate. The inappropriate structures, old textures, and poor access ways in this area make it a primary target for improvements to crisis management. District 3 is generally a suitable area, and is close to areas with an old texture, meaning that it will have a higher mortality rate according to Figure 27. This necessitates the creation of a comprehensive plan to renovate this area. The south of Tabriz, due to its large areas of open space, could be a good area in which to establish relief bases. The existence of several large parks, as well as large amounts of unused land in the south of District 3, makes this area a much more suitable place than District 4 for carrying out relief operations. District 10 would experience serious effects in an emergency due to the compact texture of its completely un-engineered structures and

ISPRS Int. J. Geo-Inf. 2021, 10, 657 31 of 40
large population. Therefore, this area is in a completely unfavorable condition, and will face serious problems in providing aid. Due to the small width of the passageways in this area, it will require aid from the air. Despite its low mortality rate, District 8 needs proper planning for aid due to its old fabric, poor access ways, and small number of street ways.
The important point about District 8 is that it is generally a commercial area and, at night, is generally empty of inhabitants. However, in the morning a large number of peo-ple from different parts of Tabriz, and even other cities, come to this area to shop or for other reasons. Tabriz Bazaar is located in this area, and it hosts a large number of people every day. Therefore, in the event of an earthquake in the morning, the area will face ex-tensive life and financial losses. Sending aid to this area through mechanized means will be virtually impossible. Because Tabriz Bazaar is a covered area, in addition to the histor-ical significance of the region, the need for saving people doubles the importance of this area, meaning that a proper plan is required for crisis management.
Table 9. Mortality rate in Tabriz city for the 1721 earthquake.
D1 D2 D3 D4 D5 D6 Total Dead(N) 152,092 150,175 7154 7742 5116 0 322,280 Dead(D) 38,023 37,544 1789 1936 1279 0 80,570
Hospitalized(N) 59,353 206,491 9356 17,420 12,791 0 305,411 Hospitalized(D) 27,893 97,040 4397 8187 6011 0 143,527 Non-hospital-
ized(N) 77,901 262,807 12,658 29,034 23,024 215 405,637
Non-hospital-ized(D)
52,212 123,519 5949 13,646 10,821 101 206,248
Not injured(N) 81,610 319,122 25,866 139,364 214,886 21238 802,087 Not injured(D) 252,827 680,493 42,900 169,792 237,706 21352 1,405,070
Table 10. Number of casualties in the 1721 earthquake in District 1 of Tabriz. D1 D2 D3 D4 D5 D6 Total
Dead(N) 34,453 16,738 321 3 50 0 51,565 Dead(D) 8613 4185 80 1 13 0 12,891
Hospitalized(N) 13,445 23,015 420 6 125 0 37,011 Hospitalized(D) 6319 10,816 197 3 59 0 17,393 Non-hospital-
ized(N) 17,647 29,292 568 10 226 0 47,743
Non-hospital-ized(D)
11,828 13,767 267 5 106 0 25,973
Not injured(N) 18,487 35,569 1160 50 2108 27 57,400 Not injured(D) 57,273 75,846 1924 60 2331 27 137,462
Table 11. Number of casualties in the 1721 earthquake in District 2 of Tabriz.
. D1 D2 D3 D4 D5 D6 Total Dead(N) 33 17,246 300 2 1519 0 19,099 Dead(D) 8 4311 75 1 380 0 4775
Hospitalized(N) 13 23,713 393 5 3797 0 27,920 Hospitalized(D) 6 11,144 185 2 1784 0 13,121 Non-hospital-
ized(N) 17 30,180 531 8 6835 150 37,721
Non-hospital-ized(D)
11 14,185 250 4 3212 71 17,732
Not injured(N) 17 36,647 1086 38 63,792 14887 116,467 Not injured(D) 54 78,146 1801 46 70,566 14967 165,580

ISPRS Int. J. Geo-Inf. 2021, 10, 657 32 of 40
Table 12. Number of casualties in the 1721 earthquake in District 3 of Tabriz. D1 D2 D3 D4 D5 D6 Total
Dead(N) 1537 23,671 5629 7559 428 0 38,824 Dead(D) 384 5918 1407 1890 107 0 9706
Hospitalized(N) 600 32,547 7361 17,009 1070 0 58,587 Hospitalized(D) 282 15,295 3459 7993 503 0 27,533 Non-hospital-
ized(N) 787 41,424 9959 28,348 1927 20 82,464
Non-hospital-ized(D) 527 19,469 4681 13,323 906 9 38,916
Not injured(N) 824 50,300 20,351 136,069 17,984 1939 227,467 Not injured(D) 2554 107,260 33,752 165,779 19,894 1949 331,188
Table 13. Number of casualties in the 1721 earthquake in District 4 of Tabriz.
D1 D2 D3 D4 D5 D6 Total Dead(N) 35,340 53,584 22 8 459 0 89,413 Dead(D) 8835 13,396 5 2 115 0 22,353
Hospitalized(N) 13,791 73,679 28 18 1149 0 88,664 Hospitalized(D) 6481 34,625 13 8 540 0 41,668 Non-hospital-
ized(N) 18,101 93,773 38 29 2068 0 114,009
Non-hospital-ized(D)
12,132 44,073 18 14 972 0 57,209
Not injured(N) 18,963 113,867 79 140 19,297 11 152,357 Not injured(D) 58,746 242,808 130 171 21,346 11 323,214
Table 14. Number of casualties in the 1721 earthquake in District 5 of Tabriz.
D1 D2 D3 D4 D5 D6 Total Dead(N) 5776 6438 864 49 1119 0 14,248 Dead(D) 1444 1610 216 12 280 0 3562
Hospitalized(N) 2254 8853 1130 111 2798 0 15,147 Hospitalized(D) 1059 4160 531 52 1315 0 7118 Non-hospital-
ized(N) 2959 11267 1529 185 5037 43 21,020
Non-hospital-ized(D)
1983 5296 719 87 2367 20 10,472
Not injured(N) 3099 13,682 3125 889 47,008 4293 72,096 Not injured(D) 9602 29,175 5183 1083 52,000 4316 101,359
Table 15. Number of casualties in the 1721 earthquake in District 6 of Tabriz. D1 D2 D3 D4 D5 D6 Total
Dead(N) 3380 883 1 0 4 0 4267 Dead(D) 845 221 0 0 1 0 1067
Hospitalized(N) 1319 1214 1 0 9 0 2543 Hospitalized(D) 620 570 1 0 4 0 1195 Non-hospital-
ized(N) 1731 1545 2 0 17 0 3295
Non-hospital-ized(D)
1160 726 1 0 8 0 1895
Not injured(N) 1813 1876 4 2 157 0 3851 Not injured(D) 5618 4000 6 2 173 0 9799

ISPRS Int. J. Geo-Inf. 2021, 10, 657 33 of 40
Table 16. Number of casualties in the 1721 earthquake in District 7 of Tabriz. D1 D2 D3 D4 D5 D6 Total
Dead(N) 10,312 2998 0 2 1478 0 14,791 Dead(D) 2578 750 0 1 370 0 3698
Hospitalized(N) 4024 4122 0 5 3695 0 11,846 Hospitalized(D) 1891 1937 0 2 1736 0 5567 Non-hospital-
ized(N) 5282 5247 0 8 6651 0 17,187
Non-hospital-ized(D) 3540 2466 0 4 3126 0 9136
Not injured(N) 5533 6371 0 37 62,076 0 74,018 Not injured(D) 17,143 13,585 0 45 68,668 0 99,441
Table 17. Number of casualties in the 1721 earthquake in District 8 of Tabriz. D1 D2 D3 D4 D5 D6 Total
Dead(N) 379 1418 2 119 0 0 1918 Dead(D) 95 355 0 30 0 0 479
Hospitalized(N) 148 1950 3 267 1 0 2369 Hospitalized(D) 69 916 1 126 1 0 1113 Non-hospital-
ized(N) 194 2482 3 445 2 1 3127
Non-hospital-ized(D)
130 1166 2 209 1 0 1509
Not injured(N) 203 3013 7 2138 19 81 5461 Not injured(D) 629 6426 12 2605 21 81 9774
Table 18. Number of casualties in the 1721 earthquake in District 10 of Tabriz. D1 D2 D3 D4 D5 D6 Total
Dead(N) 60,883 27,199 15 0 58 0 88,156 Dead(D) 15,221 6800 4 0 15 0 22,039
Hospitalized(N) 23,759 37,399 20 0 146 0 61,323 Hospitalized(D) 11,166 17,575 9 0 68 0 28,819 Non-hospital-
ized(N) 31,184 47,598 27 0 262 0 79,071
Non-hospital-ized(D) 20,901 22,371 13 0 123 0 43,408
Not injured(N) 32,669 57,798 56 0 2446 0 92,969 Not injured(D) 101,208 123,247 92 0 2706 0 227,253
4.4. Estimation of the Human Casualties of the 1780 Earthquake in Tabriz, with a Magnitude of 7.4
Table 19 shows the proportion of casualties in Tabriz. There would be fewer casual-ties caused by the 1780 earthquake than the number caused by the earthquake that oc-curred in 1721. As previously mentioned, the distance of the fault from the site and the conditions of the areas close to the epicenter indicate the good conditions of the city. Less than ten percent of Tabriz’s population would be affected by this earthquake. However, according to Tables 19–28, District 1, which would experience 364 deaths in an earthquake taking place at night, would have the highest death rate among all of the districts, fol-lowed by District 4, with 283 deaths.

ISPRS Int. J. Geo-Inf. 2021, 10, 657 34 of 40
Table 19. Mortality rate in Tabriz city for the 1780 earthquake.
D1 D2 D3 D4 D5 D6 Total Dead(N) 452 13,391 138,619 22,598 2104 0 177,166 Dead(D) 113 3347 34,654 5649 526 0 44,291
Hospitalized(N) 176 18,413 181,271 50,847 5260 0 255,969 Hospitalized(D) 83 8653 85,187 23,895 2472 0 120,292 Non-hospital-
ized(N) 232 23,435 245,248 84,746 9468 216 363,347
Non-hospital-ized(D) 155 11,014 115,267 39,830 4450 101 170,819
Not injured(N) 243 28,457 501,160 406,781 88,371 21404 1,046,420 Not injured(D) 753 60,683 831,190 495,598 97,756 2151 1,507,500
Table 20. Number of casualties in the 1780 earthquake in District 1 of Tabriz.
D1 D2 D3 D4 D5 D6 Total Dead(N) 207 134 7959 3272 987 0 559,12 Dead(D) 52 33 1990 818 247 0 3140
Hospitalized(N) 81 184 40,810 7362 2468 0 50,220 Hospitalized(D) 38 86 4891 3460 1160 0 9635
Non-hospitalized(N) 106 234 8214 26,912 4442 0 13,331 Non-hospitalized(D) 71 110 6619 5767 2088 0 14654
Not injured(N) 111 284 77,628 89,258 461,41 0 525,129 Not injured(D) 344 605 72,647 75,171 86,445 0 290,166
Table 21. Number of casualties in the 1780 earthquake in District 2 of Tabriz. D1 D2 D3 D4 D5 D6 Total
Dead(N) 49 1238 10,970 2902 728 0 15,887 Dead(D) 12 309 2742 726 182 0 3972
Hospitalized(N) 19 1702 14,345 6530 1820 0 24,417 Hospitalized(D) 9 800 6741 3069 856 0 11,475 Non-hospital-
ized(N) 25 2166 19,408 10,884 3277 0 35,760
Non-hospitalized(D) 17 1018 9122 5116 1540 0 16,812 Not injured(N) 26 2631 39,659 52,244 30,584 0 125,144 Not injured(D) 81 5610 65,776 63,651 33,832 0 168,949
Table 22. Number of casualties in the 1780 earthquake in District 3 of Tabriz.
D1 D2 D3 D4 D5 D6 Total Dead(N) 207 134 7959 3272 987 0 55,912 Dead(D) 52 33 1990 818 247 0 3140
Hospitalized(N) 81 184 40,810 7362 2468 0 50,220 Hospitalized(D) 38 86 4891 3460 1160 0 9635
Non-hospitalized(N) 106 234 8214 26,912 4442 0 13,331 Non-hospitalized(D) 71 110 6619 5767 2088 0 65,414
Not injured(N) 111 284 77,628 89,258 46,141 0 525,129 Not injured(D) 344 605 72,647 75,171 86,445 0 290,166

ISPRS Int. J. Geo-Inf. 2021, 10, 657 35 of 40
Table 23. Number of casualties in the 1780 earthquake in District 4 of Tabriz. D1 D2 D3 D4 D5 D6 Total
Dead(N) 208 657 26,636 8352 507 0 36,360 Dead(D) 52 164 6659 2088 127 0 9090
Hospitalized(N) 81 903 34,831 18,793 1268 0 55,876 Hospitalized(D) 38 424 16,369 8832 596 0 26,259
Non-hospitalized(N) 106 1149 47,125 31,322 2282 8 81,992 Non-hospitalized(D) 71 540 22,149 14,721 1073 4 38,558
Not injured(N) 111 1396 96,298 150,344 21,299 766 270,215 Not injured(D) 345 2976 159,714 183,170 23,561 770 370,537
Table 24. Number of casualties in the 1780 earthquake in District 5 of Tabriz. D1 D2 D3 D4 D5 D6 Total
Dead(N) 144 6864 10,304 0 0 0 17,312 Dead(D) 36 1716 2576 0 0 0 4328
Hospitalized(N) 56 9437 13,475 0 0 0 22,968 Hospitalized(D) 26 4435 6332 0 0 0 10,794
Non-hospitalized(N) 74 12,011 18,230 0 0 0 30,315 Non-hospitalized(D) 49 5645 8568 0 0 0 14,263
Not injured(N) 77 14,585 37,253 0 0 0 51,916 Not injured(D) 240 31,101 61,786 0 0 0 93,126
Table 25. Number of casualties in the 1780 earthquake in District 6 of Tabriz. D1 D2 D3 D4 D5 D6 Total
Dead(N) 0 73 970 19 110 0 1172 Dead(D) 0 18 242 5 28 0 293
Hospitalized(N) 0 101 1268 42 276 0 1687 Hospitalized(D) 0 47 596 20 130 0 793
Non-hospitalized(N) 0 128 1716 70 497 1 2411 Non-hospitalized(D) 0 60 806 33 234 0 1133
Not injured(N) 0 156 3506 337 4637 50 8685 Not injured(D) 0 332 5814 410 5130 50 11,737
Table 26. Number of casualties in the 1780 earthquake in District 7 of Tabriz. D1 D2 D3 D4 D5 D6 Total
Dead(N) 0 0 5310 2726 26 0 8062 Dead(D) 0 0 1328 681 7 0 2016
Hospitalized(N) 0 0 6944 6133 65 0 13,143 Hospitalized(D) 0 0 3263 2882 31 0 6176
Non-hospitalized(N) 0 0 9395 10,222 117 75 19,810 Non-hospitalized(D) 0 0 4416 4805 55 35 9311
Not injured(N) 0 0 19,198 49,068 1094 7468 76,827 Not injured(D) 0 0 31,840 59,781 1210 7508 100,340

ISPRS Int. J. Geo-Inf. 2021, 10, 657 36 of 40
Table 27. Number of casualties in the 1780 earthquake in District 8 of Tabriz. D1 D2 D3 D4 D5 D6 Total
Dead(N) 3 152 1305 70 2 0 1533 Dead(D) 1 38 326 18 1 0 383
Hospitalized(N) 1 209 1706 158 6 0 2081 Hospitalized(D) 1 98 802 74 3 0 978 Non-hospital-
ized(N) 2 267 2309 264 10 0 2852
Non-hospitalized(D) 1 125 1085 124 5 0 1341 Not injured(N) 2 324 4718 1267 98 0 6409 Not injured(D) 6 690 7825 1544 108 0 10,173
Table 28. Number of casualties in the 1780 earthquake in District 10 of Tabriz. D1 D2 D3 D4 D5 D6 Total
Dead(N) 0 57 38,670 948 0 0 39,675 Dead(D) 0 14 9668 237 0 0 9919
Hospitalized(N) 0 78 50,569 2133 0 0 52,780 Hospitalized(D) 0 37 23,765 1002 0 0 24,804
Non-hospitalized(N) 0 99 68,416 3555 0 0 72,071 Non-hospitalized(D) 0 47 32,156 1671 0 0 33,873
Not injured(N) 0 121 139,807 17,065 0 0 156,993 Not injured(D) 0 257 231,875 20,791 0 0 252,923
5. Conclusions We implemented two historic earthquake scenarios from 1721 and 1780 using the
Karmania Hazard Model, which is a GIS-based damage model [28]. The earthquake mi-crozonation map, ground shaking map, and building and population maps were pro-duced in this process. In order to construct these scenarios, we used the latest GIS layers (historical and instrumental earthquake catalogs, active fault maps near the site, geology information, underground water, etc.) together with a deterministic seismic hazard anal-ysis to create maps to show the intensity of the ground shaking. The damage map of the city was created using the existing fragility curves and building types. Considering this information, the human losses were also extracted from the updated GIS population layer. As the structural conditions show, District 1, District 4, District 10, and District 8 would be less durable in the event of an earthquake. The simulation of historical earthquakes helps us to evaluate the resilience of the city to the earthquakes that occurred in 1721 and 1780. The models used for the damage assessment and to estimate the human losses show that this city is still vulnerable to large earthquakes, and that there would be considerable numbers of casualties. Therefore, obtaining realistic damage information for possible earthquake scenarios is important and will help to improve scenario-based studies in the future. The major points of this study are as follows: • In the scenario of the earthquake of 1721, the majority of the buildings would be in
the D2 damage level (very high destruction). • In the scenario of the earthquake of 1789, the majority of the buildings would be in
the D3 damage level (high destruction). • The results of this study should be considered in disaster planning. • These scenarios should be used to encourage people who live in seismically active
areas to be aware of seismic hazards. • Researchers should create vulnerability maps to prevent construction projects from
being carried out in highly vulnerable regions of cities.

ISPRS Int. J. Geo-Inf. 2021, 10, 657 37 of 40
• These scenarios show that some historical and old buildings need immediate retro-fitting, which should be carried out on time.
Author Contributions: Conceptualization, Sadra Karimzadeh and Masashi Matsuoka; methodol-ogy, Sadra Karimza-deh and Mohammad Ghasemi; software, Mohammad Ghasemi; validation, Sadra Karimzadeh, Bakhtiar Feizizadeh and Mohammad Ghasemi; formal analysis, Mohammad Ghasemi; investiga-tion, Sadra Karimzadeh and Mohammad Ghasemi; resources, Mohammad Ghasemi ; data cura-tion, Mohammad Ghasemi; writing—original draft preparation, Mohammad Ghasemi, Sadra Karimzadeh, Masashi Matsuoka and Bakhtiar Feizizadeh; writing—review and ed-iting, Sadra Karimzadeh; visualization, Mohammad Ghasemi; supervision, Sadra Karimzadeh and Bakhtiar Feizizadeh; project administration, Sadra Karimzadeh and Masashi Matsuoka; funding ac-quisi-tion, Masashi Matsuoka. All authors have read and agreed to the published version of the manuscript.
Funding: This work was supported by the Japanese Society for the Promotion of Science (JSPS) and Grants-in-Aid for Scientific Research (KAKENHI), grant numbers 20H02411 and 19H02408, and the Science and Technology Research Partnership for Sustainable Development (SATREPS) project ti-tled “Development of integrated expert system for estimation and observation of damage level of infrastructure in Metropolitan Lima” (Principal Investigator: Koichi Kusunoki). This work also has been supported by the University of Tabriz, International and Academic Cooperation Directorate, in the framework of TabrizU-300 program.
Institutional Review Board Statement: Not applicable.
Informed Consent Statement: Not applicable.
Data Availability Statement: Not applicable.
Conflicts of Interest: The authors declare no conflicts of interest.
References 1. UNDRR. Sendai Framework for Disaster Risk Reduction 2015–2030; United Nations Office for Disaster Risk Reduction (UNDRR):
Geneva, Switzerland, 2015. 2. UN. Transforming Our World: The 2030 Agenda for Sustainable Development; United Nations (UN): Geneva, Switzerland, 2015. 3. CRED; UNISDR. Economic Losses, Poverty and Disasters 1998–2017; The Centre for Research on the Epidemiology of Disasters
(CRED): Brussels, Belgium, 2017. 4. Rasoul Maleki, M.; Arjmandi, A. Earthquake risk analysis due to North Tabriz fault in a definite method at least critical distance
from Tabriz Metro Line 2. In Proceedings of the 1st International Conference on Urban Construction in the Vicinity of Active Faults, Tehran, Iran, 3–5 September 2011.
5. Najafi, M.; Zare Mehrjerdi, A.; Abedini, H. Definitive seismic hazard analysis in Khormuj. In Proceedings of the 1st National Conference on Seismology and Earthquake Engineering, Iran, Tehran, 29 November 2013.
6. Kamalian, M.; Jafari, M.K. General criteria for urban construction planning based on seismic geotechnical considerations. Safeh 2007, 16, 140–165.
7. Wu, Z.; Xu, J.; He, L. Psychological consequences and associated risk factors among adult survivors of the 2008 Wenchuan earthquake. BMC Psychiatry 2014, 14, 126–137.
8. Paton, D.; Sagala, S.; Okada, N.; Jang, L.-J.; Bürgelt, P.T.; Gregg, C.E. Making sense of natural hazard mitigation: Personal, social and cultural influences. Environ. Hazards 2010, 9, 183–196.
9. Şalcıoğlu, E.; Başoğlu, M. Psychological effects of earthquakes in children: Prospects for brief behavioral treatment. World J Pediatr. 2008, 4, 165–172.
10. Budhathoki, S.S.; Bhattachan, M.; Castro-Sánchez, E.; Sagtani, R.A.; Rayamajhi, R.B.; Rai, P. Menstrual hygiene management among women and adolescent girls in the aftermath of the earthquake in Nepal. BMC Womens Health 2018, 18, 33–41.
11. Bathrellos, G.D.; Gaki-Papanastassiou, K.; Skilodimou, H.D.; Papanastassiou, D.; Chousianitis, K.G. Potential suitability for ur-ban planning and industry development using natural hazard maps and geological–geomorphological parameters. Environ. Earth Sci. 2012, 66, 537–548.
12. Ekanayake, S.; Prince, M.; Sumathipala, A.; Siribaddana, S.; Morgan, C. “We lost all we had in a second”: Coping with grief and loss after a natural disaster. World Psychiatry 2013, 12, 69–75.
13. Varela, E.; Koustouki, V.; Davos, C.H.; Eleni, K. Psychological consequences among adults following the 1999 earthquake in Athens, Greece. Disasters 2008, 32, 280–291.
14. Soltani Nejad, A.; Barshan, A.; Baniasad, A.; Sadie, A. Investigating social vulnerability of the elderly in the earthquakes of Bam, Varzaghan, and Ahar. Iran J. Ageing 2017, 12, 360–371.
15. Nobakht, H.N.; Ojagh, F.S.; Dale, K.Y. Risk factors of post-traumatic stress among survivors of the 2017 Iran earthquake: The importance of peritraumatic dissociation. Psychiatry Res. 2019, 271, 702–707.

ISPRS Int. J. Geo-Inf. 2021, 10, 657 38 of 40
16. International Institute of Earthquake Engineering and Seismology (IIEES). 2021. Available online: www.iiees.ac.ir (accessed on 25 August 2021).
17. Allen, M.B.; Jackson, J.; Walker, R. Late Cenozoic reorganization of the Arabia-Eurasia collision and the comparison of short-term and long-term deformation rates. Tectonics 2004, 23, TC2008.
18. Vernant, P.; Nilforoushan, F.; Hatzfeld, D.; Abbassi, M.R.; Vigny, C.; Masson, F.; Nankali, H.; Martinod, J.; Ashtiani, A.; Bayer, R.; Tavakoli, F.; et al. Present-day crustal deformation and plate kinematics in middle East Constrained by GPS measurements in Iran and north northern Oman. Geophys. J. Int. 2004, 157, 381–398.
19. Barka, A.A.; Kadinsky Cade, K. Strike-slip fault geometry in Turkey and its influence on earthquake activity. Tectonics 1988, 7, 663–684.
20. Jackson, J.; McKenzie, D. Active Tectonics of the Alpine-Himalayan Belt between Western Turkey and Pakistan. Geophys. J. Int. 1984, 77, 185–264.
21. Moazami-Goudarzi, K.; Hossein-Javaheri, J.; Hafizi, M.K. Seismic zoning of Tabriz. J. Earth Space Phs., lnst. Geophys., Tehran Univ., 1 (3). p, 71-MORIER, J.J., 1812. First Journey to Persia, London, 1972.
22. Mirza, N. Dar ol Saltaneh-e-Tabriz. Tehran, on the evidence of the youngest activity of the North Tabriz Fault and the seismicity of Tabriz City. 1906.
23. Tchalenko, J.S.; Iranmanesh, M.H. Recent earthquakes in Azarbaidjan. Geol. Surv. Iran. Int. Rep. 1971, 54 lip. 24. Zaka, Y. Tabriz Earthquakes, 1st ed.; Ketabsara: Tehran, Iran, 1989. 25. Anagnostopoulos, S.; Providakis, C.; Salvaneschi, P.; Athanasopoulos, G.; Bonacina, G. SEISMOCARE: An efficient GIS tool for
scenario-type investigations of seismic risk of existing cities. Soil Dyn. Earthq. Eng. 2008, 28, 73–84. 26. Molina, S.; Lindholm, C.D. A capacity spectrum method-based tool developed to properly include the uncertainties in the seis-
mic risk assessment, under a logic tree scheme. In Proceedings of the ECI Geohazards Technical, Economic and Social Risk Evaluation, Lillehammer, Norway, 18–21 June 2006.
27. Molina, S.; Lang, D.H.; Lindholm, C.D. SELENA–An open-source tool for seismic risk and loss assessment using a logic tree computation procedure. Comput. Geosci. 2010, 36, 257–269.
28. Hassanzadeh, R.; Nedović-Budić, Z.; Razavi, A.A.; Norouzzadeh, M.; Hodhodkian, H. Interactive approach for GIS-based earth-quake scenario development and resource estimation (Karmania hazard model). Comput. Geosci. 2013, 51, 324–338.
29. Karaman, H. Integrated multi-hazard map creation by using AHP and GIS. Geomatics Engineering Department, Istanbul Tech-nical University, Recent Advances on Environmental and Life Science. 2015. http://www.wseas.us/e-library/confer-ences/2015/Seoul/ERG/ERG-15.pdf (accessed on 25 August 2021).
30. New, Z.Z.; Tun, K.T. Seismic hazard Analysis using AHP-GIS. Environmental Role Consulting Engineers. Tabriz Master Plan. Iran, Tabriz in 2013. Int. J. Res. Chem. Metallurg. Civ. Eng. 2016, 3, 1442–1450.
31. Malakeh, A. Dissertation on Natural Environment and Physical Development of the City: A Case Study of an Appropriate Model of Development in the City of Tabriz. Master’s Thesis, University of Tabriz, Tabriz, Iran, 1997.
32. Geographical organization of the country. Topographic map of Tabriz. 1980, Scale, 1:250000. 33. Housing and Urban Development of East Azarbaijan Province. Microzontion Studies of Tabriz; Tehran Padir Consulting Engi-
neers: Tehran, Iran, 2008; Volume 11. 34. Executor of Sahand New City Plan. Location Plan of Separate Development of Tabriz City. 1988. 35. Sadr Karimi, J. Numerous Information Obtained from Various Resistance Reports Related to the City of Tabriz; Zamin Azma Consulting
Engineers: Tabriz, Iran, 1995. 36. Waqar Mousavi, A. Transformation of Tabriz Plain Geomorphology; University of Tabriz: Tabriz, Iran, 1990. 37. Mohammadi, A.; Karimzadeh, S.; Valizadeh Kamran, K.; Matsuoka, M. Extraction of Land Information, Future Landscape
Changes and Seismic Hazard Assessment: A Case Study of Tabriz, Iran. Sensors 2020, 20, 7010. 38. Course Consulting Engineers. Tabriz City Wastewater Collection and Treatment Ministry of Energy 1978 Housing and Urban Devel-
opment of East Azarbaijan Province Microzontion Studies of Tabriz Consulting Engineers Tehran Padir; Course Consulting Engineers: Tabriz, Iran, 2008; Volume 11.
39. Aghanabati, A. The Geology of Iran; Geological Survey of Iran: Tehran, Iran, 2004; 586p. 40. Javadi, H.R.; Ghassemi, M.R.; Shahpasandzadeh, M.; Guest, B.; Ashtiani, M.E.; Yassaghi, A.; Kouhpeyma, M. History of faulting
on the Doruneh Fault System: Implications for the kinematic changes of the Central Iranian Microplate. Geol. Mag. 2013, 150, 651–672.
41. Berberian, M. An explanatory note on the first seismotectonic Map of Iran. A seismotectonic review of the country. In Contribu-tion to the Seismotectonics of Iran (Part II); Geological Survey of Iran: Tehran, Iran, 1976; pp. 7–142.
42. McClusky, S.; Reilinger, R.; Mahmoud, M.; Ben Sari, D.; Tealeb, A. GPS constraints on Africa and Arabia plate motions. Geophys. J. Int. 2003, 155, 126–138.
43. Masson, F.; Anvari, M.; Djamour, Y.; Walpersdorf, A.; Tavakoli, F.; Daignières, M.; Van Gorp, S. Large-scale velocity field and strain tensor in Iran inferred from GPS measurements: New insight for the present-day deformation pattern within NE Iran. Geophys. J. Int. 2007, 170, 436–440.
44. Berberian, M.; Arshadi, S. On the evidence of the youngest activity of the North Tabriz Fault and the seismicity of Tabriz City. In Contribution to the Seismotectonics of Iran (Part II); Geological Survey of Iran: Tehran, Iran, 1976.

ISPRS Int. J. Geo-Inf. 2021, 10, 657 39 of 40
45. Karkhanian, A.S.; Trifonov, V.G.; Philip, H.; Avagayan, A.; Hessami, K.; Jamali, F.; Bayraktutan, M.S.; Bagdassarian, H.; Ara-kelian, S.; Davtian, V. Active faulting and natural hazards in Armenia, Eastern Turkey and North-Western Iran. Tectonophysics 2003, 24, 215–226.
46. Hessami, K.; Nilfouroushan, F.; Talbot, C. Active deformation within the Zagros Mountain deduced from GPS measurements. J. Geol. Soc. 2006, 163, 143–148.
47. Karimzadeh, S.; Miyajima, M.; Kamel, B.; Pessina, V. A fast topographic characterization of seismic station locations in Iran through integrated use of digital elevation models and GIS. J Seismol. 2015, 19, 949–996.
48. Karimzadeh, S.; Feizizadeh, B.; Matsuoka, M. From a GIS-based hybrid site condition map to an earthquake damage assessment in Iran: Methods and trends. Int. J. Disaster Risk Reduct. 2017, 22, 23–36.
49. Copley, A.; Jackson, J. Active tectonics of the Turkish-Iranian Plateau. Tectonics 2006, 25, 6. 50. Andrew, M. Principles of Sedimentary Basin Analysis; Springer: New York, NY, USA, 1990. 51. Mirzaei, N.; Mengtan, G.; Yuntai, C. Seismic source regionalization for seismic zoning of Iran: Major seismotectonic provinces.
J Earthq Predict Res. 1998, 7, 465–495. 52. Nabavi, M.H. Introduction to Geology of Iran; Geological Survey of Iran: Tehran, Iran, 1976. 53. Eftikharnejad, J.; Qureshi, M.; Mehr Perto, M.; Arshadi, S.; Zohreh Bakhsh, A. Geological Map 250,000: 1; Geological Survey of
Iran: Tehran, Iran, 1990. 54. Darvishzadeh, A. Geology of Iran; Amirkabir Publications: Tehran, Iran, 2015. 55. Nowroozi, A.A. Empirical relations between magnitude and fault parameters for earthquakes in Iran. Bull. Seismol. Soc. Am.
1985, 75, 1327–1338. 56. Mohajer, A.; Nowroozi, A.A. Observed and probable Intensity Zoning of Iran. Tectonophysics 1987, 49, 21–30. 57. Bonilla, M.G.; Mark, R.K.; Lienkaemper, J.J. Statistical relations among earthquake magnitude, surface rupture length, and sur-
face fault displacement. Seismol. Soc. Am. Bull. 1984, 74, 2379–2411. 58. Berberian, M. Natural hazards and the first earthquake catalog of Iran. Int. Inst. Earthq. Eng. Seismol. 1994, 1, 266. 59. Dehghani, G.A.; Makris, J. The Gravity Field and Crustal Structure of Iran; Geologic Survey of Iran: Tehran, Iran, 1983; pp. 51–68. 60. Karimzadeh, S.; Cakir, Z.; Osmanoğlu, B.; Schmalzle, G.; Miyajima, M.; Amiraslanzadeh, R. Inter seismic strain accumulation
cross the North Tabriz Fault (NW Iran) deduced from InSAR time series. J. Geody. 2013, 66, 53–58. 61. Saita, J.; Bautista, M.L.P.; Nakamura, Y. On relationship between Theestimated strong motion characteristic of surface layer and
the earthquakedamage—Case study at intramuros, Metro Manila. In Proceedings of the 13th World Conference on Earthquake Engineering, Vancouver, BC, Canada, 1–6 August 2004.
62. Karimzadeh, S.; Miyajima, M.; Hassanzadeh, R.; Amir aslanzadeh, R.; Kamel, B.-A. GIS-Based Seismic Hazard, Building Vul-nerability and Human Loss Assessment for The Earthquake Scenario in Tabriz Soil Dyn. Earthq. Eng. 2014, 66, 263–280.
63. Tehran Padir Consulting Co. Tabriz Seismic Microzoation Investigations; Tehran Padir Consulting Co.: Tabriz, Iran, 2006. 64. Assadian, O.; Eftekharnejad, J.; Jalilian, M.; Afsharianzadeh, A.M. Geology map of Tabriz region. Geological survey of Iran. 1
sheet, scale 1:100,000. 65. Pazhouhesh Omran Rahvar Engineering Consultants. Interim Report of Geotechnical Investigations of Tabriz Urban Railway Project;
Pazhouhesh Omran Rahvar Engineering Consultants: Tehran, Iran, 2008. 66. ALOS PALSAR. https://asf.alaska.edu/data-sets/sar-data-sets/alos-palsar/ (accessed on 25 August 2021). 67. Barthelmes, F. Definition of Functionals of the Geopotential and Their Calculation from Spherical Harmonic Models. 2013.
Available online: http://icgem.gfz-potsdam.de/ICGEM (accessed on 16 August 2019). 68. Kiamehr, R.; Sjöberg, L.E. Impact of a precise geoid model in studying tectonic structures—A case study in Iran. J. Geodyn. 2006,
42, 1–11. 69. Fallahi, A.; Erami, M.H.; Mashayekhi, H.R.; Miyajima, M. Microtremor and shear wave velocity measurements in Tabriz to use
in seismic microzonation. In Proceedings of the 6th International Conference of Seismology and Earthquake Engineering, Teh-ran, Iran, 15 May 2011.
70. Abdolahi, M.R.; Jamali, F.; Pedrami, M.; Haddadan, M.; Ghaemi, J.; Ghomashi, A. Engineering geological maps of Tabriz. En-gineering (compressive strength, susceptibility to slide, discontinuity surface). Geological Survey of Iran. 1 Sheet, Scale 1:50,000.
71. Building and Housing Research Center (BHRC). Iranian Code of Practice For Seismic Resistance Design of Buildings. Iranian Building Codes and Standards, Standard No. 2800, 3rd ed.; Building and Housing Research Center (BHRC): Tehran, Iran, 1999.
72. Child, C. Interpolating surfaces in ArcGIS spatial analyst. Arc Use 2004, 32–35. 73. Ghohroudi Tali, M. A survey of interpolation through the griging method. Geogr. Res. Q. 2003, 34, 95–108. 74. Davis, J.C. Statistics and Data Analysis in Geology; John Wiley and Sons: London, UK, 1973. 75. Satty, T. The Analytical Hierarchy Process; McGraw Hill: New York, NY, USA, 1980. 76. Wang, Z. Seismic hazard assessment: Issues and alternatives. Pure Appl. Geophys. 2011, 168, 11–25. 77. Mualchin, L.; Jones, A. Peak Acceleration from Maximum Credible Earthquakes in California; Open-File Rep; California Department
Conservation: Sacramento, CA, USA, 1992; pp. 92–101. 78. Mualchin, L. Development of the Caltrans deterministic fault and earthquake hazard map of California. Eng. Geol. 1996, 42, 217–
222. 79. Mualchin, L. History of modern earthquake hazard mapping and assessment in California using a deterministic or scenario
approach. Pure Appl. Geophys. 2011, 168, 383–407.
ISPRS Int. J. Geo-Inf. 2021, 10, 657 40 of 40
80. Ambraseys, N.N.; Melville, C.P. “A history of Persian Earthquakes” Cambridge Earth. In Science Servies; Bolt, B.A., Ed.; Free Man and Compay: New York, NY, USA, 1993.
81. Chandra, V.; Mc Whorter, J.G.; Nowroozi, A.-A. Attenuation of intensities in Iran. Bull. Seismol. Soc. Am. 1979, 69, 237–250. 82. Zahraei, S.; Ershad, L. Study on seismic vulnerability of building structures in Qazvin. J. Fac. Eng. 2005, 39, 287–297. 83. Roostaiee, S. Zoning the risk of Tabriz fault for different usages of urban lands with gis. Geogr. Dev. 2011, 9, 27–41. 84. Ahadnezhad Reveshti, M.; Gharakhlou, M.; Ziyari, K. Modeling the vulnerability of urban buildings against earthquake by
method of analytical hierarchy process (ahp) (case study of Zanjan city). Geogr. Dev. 2010, 8, 171–198. 85. Ghanbari, A.; Saleki Maleki, M.; Ghasemi, M. Zoning of cities level of vulnerability to earthquake hazard (case study: Tabriz).
Geogr. Environ. Hazards 2013, 2, 21–35. 86. Zangiabadi, A.; Mohammadi, J.; Safaei, H.; Ghaed Rahmati, S. Vulnerability indicators assessment of urban housing against the
earthquake hazard (case study: Isfahan housing). Geogr. Dev. 2009, 6, 61–79. 87. JICA; CEST; Tehran Municipality. The Study on Seismic Microzoning of the Greater Tehran Area in the Islamic Republic of Iran; Final
Report; Japan International Cooperation Agency (JICA): Tokyo, Japan; Centre for Earthquake and Environmental Studies of Tehran (CEST): Tehran, Iran; Tehran Municipality: Tehran, Iran, 2000.
88. Grünthal, G. European Macroseismic Scale (EMS-98). Cahiers du Centre Europeen de Geodynamique et de Seismologie, Centre Europeen de Geodynamique et de Seismologie: Walferdange, Luxemburg, 1998; Volume 99.
89. Hosseini, M. Crisis Management, Crisis Prevention and Management Organization of Tehran; Shahr Publishing Institut: Tehran, Iran, 2008.
90. Mansoori, B.; Ghaemghian, M.; Hosseini, K.; Tasnimi, A.; Haghshenas, A.; Ghovahi, N. Determination of Site Intensification Coef-ficients and Extraction of Fragility Functions and Relationships of Human Losses Due to Earthquake for Buildings in Tehran; International Research Institute of Seismology and Earthquake Engineering: Tsukuba, Japan, 2010.
91. Coburn, A.; Spence, R. Earthquake Protection, 2nd ed.; John Wiley and Sons Ltd.: West Sussex, UK, 2002. 92. Najafalipou, M. Estimation of Casualties for Earthquake Scenarios in Shahriar. Master’s Thesis, Islamic Azad University, Teh-
ran, Iran, 2017. 93. Kerman Disaster Management Center (KDMC). Karmania Hazard Model User Manual; Kerman Disaster Management Center
(KDMC): Kerman, Iran, 2008; Volume 235. 94. The City of Tabriz, Tabriz Plan and Budget Organization. Plan and Budget Organization Statistical Yearbook 2018; The City of
Tabriz, Tabriz Plan and Budget Organization: Tabriz, Iran, 2020.