what’s in a picture? - booth school of business · what’s in a picture? ... devin pope is an...
TRANSCRIPT

T H E J O U R N A L O F H U M A N R E S O U R C E S • 46 • 1
What’s in a Picture?Evidence of Discrimination from Prosper.com
Devin G. PopeJustin R. Sydnor
A B S T R A C T
We find evidence of significant racial disparities in a new type of creditmarket known as peer-to-peer lending. Loan listings with blacks in the at-tached picture are 25 to 35 percent less likely to receive funding thanthose of whites with similar credit profiles. Despite the higher average in-terest rates charged to blacks, lenders making such loans earn a lower netreturn compared to loans made to whites with similar credit profiles be-cause blacks have higher relative default rates. These results provide in-sight into whether the discrimination we find is taste-based or statistical.
I. Introduction
There is a long history within economics of studies attempting tounderstand discrimination in a variety of markets. Much of this interest stems fromconcerns that because of discrimination, certain groups— for example, blacks andwomen—may not enjoy the same access to markets and opportunities as their coun-terparts. Theories of discrimination usually fall into one of two classes: statisticaldiscrimination (Phelps 1972; Arrow 1973) or taste-based discrimination (Becker1957).1 Accurate statistical discrimination is economically efficient for the decisionmaker, while taste-based discrimination stems from an animus toward one groupand is often costly to the decision-maker. Because costly discrimination may bedriven out of competitive markets, and because these different theories often leadto different policy recommendations, understanding the extent to which observed
Devin Pope is an assistant professor at the Wharton School, University of Pennsylvania. Justin Sydnoris an assistant professor of economics at Case Western Reserve University. The authors thank DavidCard, David Clingingsmith, Stefano DellaVigna, Jonathan Guryan, Erzo Luttmer, Nicola Persico, JimRebitzer, Stephen L Ross, Heather Royer, Jonathan Skinner, Nick Souleles, Betsey Stevenson, JustinWolfers, and seminar participants at the NBER Summer Institute, Case Western Reserve University, andthe University of Pennsylvania for helpful comments and suggestions. The data in this article are avail-able from the authors from August 2011 through July 2014.[Submitted April 2009; accepted November 2009]ISSN 022-166X E-ISSN 1548-8004 � 2011 by the Board of Regents of the University of Wisconsin System1. For other literature on theories of discrimination, see Aigner and Cain (1977) and Lundberg and Starz(1983).

54 The Journal of Human Resources
discrimination is consistent with these theories is an important goal. However, it isoften difficult to test for discrimination in markets2 and generally even harder toassess the different theories of discrimination.3
This paper examines discrimination in a new type of credit market known as peer-to-peer lending. Specifically, we study data from the website Prosper.com, a leaderin online peer-to-peer lending in the United States. Peer-to-peer lending is an alter-native credit market that allows individual borrowers and lenders to engage in credittransactions without traditional banking intermediaries. While still small, these mar-kets are growing quickly and may represent an important niche, especially in thearea of consumer-debt consolidation.4 Websites like Prosper aggregate smallamounts of money provided by a number of individual lenders to create moderatelysized, uncollateralized loans to individual borrowers. In order to request funding,borrowers in these markets create a loan listing that resembles auction listings forgoods on websites like eBay. Like most standard credit applications, this listingdisplays desired loan parameters and reports information from the prospective bor-rower’s credit profile. Unlike typical credit applications, however, borrowers mayinclude optional and unverified personal information in their listings in the form ofpictures and text descriptions. These pictures and descriptions often provide potentiallenders with signals about characteristics such as race, age, and gender that antidis-crimination laws typically prevent traditional lending institutions from using.
Our first research question focuses on the determinants of access to credit in theProsper marketplace, and in particular on how signals from pictures about charac-teristics, such as race, age, and gender, affect the likelihood of receiving loan fundingand the interest rates borrowers pay. In the language of the legal literature we testfor “disparate treatment” of certain groups by estimating whether they are treateddifferently than their counterparts who are similar on other dimensions.5 Our em-pirical approach uses observational market data.6 The typical problem with this typeof analysis is the potential for omitted variable bias.7 An advantage of our data set
2. See Altonji and Blank (1999) and Blank, Dabady, and Citro (2004) for reviews of empirical work onassessing discrimination in labor markets, and Ross and Yinger (2002) for a similar review in credit marketswith a focus on mortgage lending.3. A few notable papers that have used clever empirical methodologies to examine statistical discriminationvs. taste-based discrimination include Altonji and Pierret (2001), Knowles, Persico, and Todd (2001), Levitt(2004), Antonovics and Knight (2004), and Charles and Guryan (2007).4. See Freedman and Jin (2008) for an analysis of the evolution of the Prosper market and the profitabilityof loans on Prosper.5. The other important definition within the legal literature is “disparate impact,” which arises when de-cision-makers do not explicitly account for characteristics such as race and gender, but use variables thatare highly correlated with these characteristics. See Ross and Yinger (2002) for a discussion of disparatetreatment vs. disparate impact with a focus on discrimination in credit markets.6. This observational-market-data approach is similar to that used in the influential studies of redliningand racial discrimination in mortgage lending by the Boston Federal Reserve (Munnell, Tootell, Browne;McEneaney 1996; and Tootell 1996).7. Audit studies and field experiments are an important alternative technique for examining the existenceof discrimination (specifically disparate treatment) in a range of markets. For instance, in a very influentialpaper Bertrand and Mullainathan (2004) study racial discrimination in the labor market by randomlyassigning race to fictitious resumes and find that resumes with black-sounding names are less likely toreceive a call-back for an interview. Examples of audit studies include Turner et al. (2002) on mortgagelending, Turner et al. (1991) on the labor market, and Ayers and Siegelman (1995) on automobile purchases.

Pope and Sydnor 55
is that we are able to control for nearly all of what a lender knows about a borrowerwhen making funding decisions. Prosper.com generously provides a data set thatcontains information from loan listings created on the site, including links to picturesincluded with the listings. In order to conduct the analysis, we systematically codedvariables from pictures and text descriptions for over 110,000 loan listings that werecreated on Prosper.com between June 2006 and May 2007.
The empirical analysis reveals significant racial discrimination in this market.Compared to the response to otherwise similar whites, we estimate that listings withblacks in the picture are 2.4–3.2 percentage points less likely to be funded. Comparedto the average probability of funding, 9.3 percent, this represents an approximately30 percent reduction in the likelihood of receiving funding. A range of specificationsand numerous robustness checks and alternative cuts of the data reveal very stableeffects of race on the likelihood of funding. This discrimination against blacks inthe lending decision is also reflected in the interest rates these borrowers pay con-ditional on receiving a loan; their interest rates are 60–80 basis points higher thanthose of whites with similar credit profiles.
While smaller and less robust than the results for race, we find a number of otherinteresting market responses to the information in pictures and text. For instance,the market discriminates somewhat against the elderly and significantly overweight,but in favor of women and those that signal military involvement. The market alsofavors listings where the borrower expresses a desire to pay down credit-card debt(the most popular stated loan purpose) over credit requests for other purposes, suchas loans for business expansions or automotive repairs/purchases.
It is perhaps somewhat surprising that we find evidence of discrimination in thismarket. Because the pictures and descriptions are optional and unverifiable, a naturalprediction would be that the market would respond little to this type of “cheap talk.”Yet the fact that borrowers include a wide variety of pictures and the market re-sponds to those signals, suggests that the information is not treated as cheap talk inthe market. In fact, we find the Prosper market responds negatively to listings thatdo not include a picture. Another reason that the finding of racial discriminationmight be somewhat surprising is that lenders are given a wide range of informationabout each borrower’s credit profile, including credit grade, debt-to-income ratio,and a measure of income. However, we find that lenders respond to signals aboutrace above and beyond this wealth of credit information.
Given that we find discrimination in this market, an obvious question is whetherthis discrimination is efficient for lenders—in other words, are these differencesconsistent with lenders engaging in accurate and economically efficient statisticaldiscrimination? Because of the availability of data and the nature of the market, we
By manipulating the race or gender of applicants for jobs or loans, these types of studies are able to identifyclean causal links between group status and treatment without concerns of omitted variables or the correctempirical specification. On the other hand, because they usually lack any ex-post performance data, withaudit or field-experiment approaches, it is generally hard to assess different theories of the sources ofdiscrimination. Heckman (1998) argues that the audit approach over-states the importance of discrimination,arguing that while some employers, salesmen, or lenders may discriminate, that minorities will seek outthose who do not, thereby lessening the impact of the discrimination. It is worth noting that the discrim-ination we find on Prosper.com is at the market level.

56 The Journal of Human Resources
can address this question using loan-performance data.8 A unique feature of theProsper market is that it operates as an auction that allows interest rates to be biddown below an initial rate set by the borrower, if enough lenders find a loan attrac-tive. The basic intuition behind the analysis, then, is that if lenders care only aboutthe net return of a loan (adjusted for expected default), funds will flow to loans thatare attractive given the observable information to lenders. This process should adjusttheir interest rates and equalize expected returns. If the market correctly incorporatescharacteristics from pictures and text when assessing creditworthiness, accurate sta-tistical discrimination will result in funded loans that have equal average net returnsirrespective of the listing characteristics. On the other hand, if taste-based discrim-ination is the sole cause of disparate treatment in the market, loans made to thegroup subject to negative discrimination should have higher net returns ex post.
The comparison of the net return on loans made to blacks and otherwise similarwhites is striking. The estimated average net return on a dollar from investing in aloan from a black borrower is 7.3–8.6 percentage points lower over a three-yearperiod. Although blacks are discriminated against in the lending process, the higherinterest rates that they pay are not enough to account for their greater propensity todefault. This runs counter to the predictions of both accurate statistical discrimination(equal net returns) and taste-based animus against blacks (higher net returns on loansto blacks).9
How can we reconcile the evidence of discrimination against blacks in the lendingprocess with the fact that their loans result in lower net returns? The evidence isconsistent with a combination of accurate statistical discrimination against blackscoupled with taste-based discrimination against whites. But such an interpretationruns counter to intuition and to previous literature, which rarely concludes that thereis a taste-based preference against whites. We discuss the interpretation of theseresults in detail at the end of the paper. Perhaps the most likely interpretation is thatlenders understand the correlations between race and important characteristics forpredicting default that they cannot perfectly observe, such as education and social-
8. Exploring theories of discrimination—statistical discrimination vs. taste-based discrimination —is gen-erally quite difficult. In many settings there is no ex-post performance data available. Even when perfor-mance data is available, it may not be informative because decisionmakers use a threshold cutoff fordecisions such as loan approval. For example, see the critiques of the use of default analysis to assesstheories of discrimination in mortgage lending that appeared in the May, 1996 edition of Cityscape, es-pecially articles by John Yinger, George Galster, Stephen Ross, and John Quigley.9. After we had gathered our data and were conducting our analysis, we learned of a working paper byRavina (2008) that conducts an analysis similar to ours but uses a smaller sample of loans (one month ofloan listings on Prosper relative to the 12 months used in our analysis). Ravina’s strongest findings are forthe effect of beauty, and she finds that more beautiful people are more likely to receive funding. In contrastwe find little effect of our attractiveness measure, which we attribute to her more precise coding of beauty.Our race coding, however, is quite accurate and we find a number of differences in our results for race.While Ravina finds that blacks pay higher interest rates conditional on funding (consistent with our results),her estimates do not show a difference in the probability of funding related to race. Furthermore, Ravinaconcludes that there is no evidence of differential default rates between loans made to blacks and whites.Most of these differences can likely be attributed to the large differences in sample sizes, as the standarderrors on her estimates are large and cannot reject our point estimates for any of the estimations eventhough our results are highly statistically significant.

Pope and Sydnor 57
support networks, but they fail to fully appreciate the strength of these correlationsor the importance of these unobservable factors in predicting default.
The remainder of the paper proceeds as follows: Section I describes peer-to-peerlending and the dynamics of the Prosper marketplace. Section II describes the datamade available by Prosper.com and our process for coding information from picturesand text. Section III presents our empirical results, focusing first on the probabilityof obtaining a successful loan and then turning to estimates of the net return (tolenders) of loans made to different groups. We conclude the paper in Section IVwith a discussion of the interpretation of our results and their relationship to andimplications for the literature on theories of discrimination.
II. Institutional Background of Online Peer-to-PeerLending
Online peer-to-peer lending encompasses a range of new and ex-panding markets that allow individual borrowers and lenders to engage in credittransactions without traditional intermediaries such as banks. These markets aresmall but growing quickly: The U.S. peer-to-peer market grew from an estimated$269 million in outstanding loans in 2006 to $647 million in 2007.10
Part of the appeal of peer-to-peer lending is that it offers lower overhead and theability to cut out the bank or “middle man.” Of course, there are many reasons whybanks and other credit agencies have historically been the primary source for per-sonal loans. Prosper has addressed some of the most important advantages of tra-ditional lending institutions, including enabling individuals to diversify their peer-to-peer lending portfolio and providing individuals the sort of credit-profileinformation that until recently has been the purview of banks and other large lenders.Naturally, it is questionable whether individuals have the sophistication and trainingto make efficient use of this credit information in the way banks can. On the otherhand, peer-to-peer markets provide lenders with a wealth of personal and contextualinformation about borrowers that traditional intermediaries do not use and are oftenexplicitly barred from using by anti discrimination laws. This extra information maybe a source of advantage for peer-to-peer markets. Ultimately, because they are sonew, it is still too early to know whether peer-to-peer credit markets will actuallysucceed, but they are an intriguing alternative to traditional credit markets and areattracting both borrowers and lenders.
Details of Prosper.comOur analysis focuses on the Prosper.com marketplace. Started in February, 2006,Prosper is somewhat similar to auction sites such as eBay, except that instead ofbidding on or listing a consumer item, individuals bid on or list personal loans. All
10. This information comes from an article entitled “How to Use Peer-to-Peer Lending Sites to BorrowMoney,“ that appeared on foxbusiness.com on Monday, January 28, 2008, and cites its source as theresearch firm Celent. According to the article, Celent projects the market to grow to a total of $5.8 billionby 2010.

58 The Journal of Human Resources
loans in this market are uncollateralized and have three-year terms with a fixedrepayment schedule. Individuals wishing to borrow money create a listing that lastsfor a prespecified length of time, usually between seven and 14 days. The listingincludes the amount of money requested (up to $25,000), the maximum interest ratethe borrower is willing to pay, credit information obtained by Prosper via a creditcheck, and voluntarily provided (and unverified) information, such as pictures anddescriptions of what they plan to do with the money. Lenders browse the variouslistings and bid on specific loans by committing a portion of the principal (minimumof $50) and setting the lowest interest rate at which they are willing to provide thosefunds. The loan gets funded if and only if the total amount of money bid by lenderscovers the size of the requested loan. Lenders get priority for the loan based on theminimum interest rate they are willing to accept, with low-rate bids getting higherpriority. If enough lenders bid on the loan, the final interest rate on the loan can bebid down from the maximum interest rate initially set by the borrower; the final rateis determined by the lowest reservation rate set by a bidder who does not get tofund a portion of the loan.11 Prosper makes money by charging closing costs of 1–2 percent of the loan amount to borrowers and 0.5–1 percent to lenders.
An example may help clarify the market dynamics. Imagine that a borrower re-quests a $5,000 loan and is willing to pay a maximum annual interest rate of 10percent. For simplicity, assume that all potential lenders will bid the minimum fund-ing size of $50. It then takes 100 lenders to fund the $5,000 loan. Each of theselenders enters a reservation interest rate when they bid, which is the lowest interestrate they are willing to accept. If there are exactly 100 lender bids, the $5,000 loanwill fund at an interest rate of 10 percent. However, if more than 100 lenders bidon the loan, the final interest rate would be determined by the 101st lowest reser-vation interest rate. The 100 bidders with the lowest reservation interest rates wouldeach provide $50 for the loan and would be entitled to 1/100th of the repaymentsmade by the borrower over the three-year term.
Substantial information is available to individuals who are interested in biddingon loans. Lenders see the parameters of the loan: its size, the ending time of thelisting, the total amount that has been funded through bids by other lenders, thehistory of bids on the listing, and the current interest rate, which is either the max-imum rate the borrower will accept or (for fully funded loans) the rate to which theloan has been bid down. Other than these loan parameters, perhaps the most im-portant information available to lenders is a credit profile for each borrower obtainedby Prosper through a standard credit check. Prosper obtains an Experian credit scoreand provides lenders with a credit grade (for example, AA or B) for each borrowerusing bins of credit score.12 The cutoffs for the different credit grades are found
11. Although we (and Prosper) use the term “lenders” to refer to the individuals making bids for the loan,technically speaking the loan contract is between the borrower and Prosper. So borrowers do not have tomake separate repayments to each lender, but rather simply repay Prosper based on the final interest ratefor their loan. Prosper allocates the repayments to the individual lenders based on the portion of the loanfunds they provided.12. Credit grade bins include the following: AA (760 and up), A (720–759), B (680–719), C (640–679),D (600–639), E (560–599), and HR (520–559). Individuals with a credit score below 520 are not allowedto create a loan listing.
Pope and Sydnor 59
easily on the Prosper website, but lenders do not see borrowers’ exact credit scores.Lenders also see a host of other information commonly found on credit reports,including delinquencies, revolving credit balance, and bank-card utilization.13 Po-tential borrowers also supply information about their employment status, occupation(chosen from a list), and income. The income borrowers report is also used byProsper to create a debt-to-income ratio that is prominently displayed on the listingpages. This debt-to-income ratio is calculated by dividing the borrower’s self-reported income by his or her debt burden (excluding housing) as reported by thecredit check, and includes the value of the Prosper loan the borrower is requesting.Prosper does not verify the employment, occupation, and income information whenloan listings are created, but does verify this information for some borrowers oncethe loan becomes fully funded and before the money is disbursed. Lenders are alsoprovided with an indicator for whether the borrower is a homeowner or not.
In addition to this financial information borrowers can include supplemental ma-terial in their listing consisting of: (a) a picture with their listing, (b) a one-linedescription for the loan, and (c) a separate longer description, where borrowers areencouraged (by Prosper) to describe what they plan to do with the money and whylenders should consider their request. None of the information in these pictures ordescriptions is verified by Prosper or verifiable by lenders.
Prosper also incorporates additional social components through the use of bor-rower (and lender) groups. Borrower groups are generally organized around somesort of theme (for example, alumni of a particular university) and include a rating.The group rating is affected by the repayment activities of its members so that groupmembership provides extra social pressure to repay loans.
Other than social pressure and conscience, the primary incentive for a borrowerto repay the uncollateralized loan is the impact that default can have on the bor-rower’s credit. If a borrower fails to repay the loan, Prosper reports the default tothe credit-scoring agencies and turns the loan over to a collection agency that at-tempts to recover some money.14 Ultimately the penalties to a borrower from de-faulting on a loan in this market are similar to those of failing to repay a credit card.
III. Data
A. Data Overview
Prosper.com generously makes its data available to academics and prospective lend-ers. Data are available for every loan listing since the inception of the website. Thedata include all of the information seen by lenders when they make their lendingdecisions, as well as the outcome of the listing (funded or not). Demographic andother information about lenders is not available.
13. Additional information in the credit profile includes the numbers of public records in the last year andlast ten years, the number of inquiries in the last six months, the date of the borrower’s first credit line,and the numbers of current, open, and total credit lines.14. Any money recovered by the collection agency is repaid to the individual lenders in proportion to theamount of the loan they funded.

60 The Journal of Human Resources
Figure 1Total Listings Across Time by Funded StatusNotes: This figure illustrates monthly counts of the total number of listings and the total number of listingsthat were eventually funded on Prosper.com since the company went public in February 2006. The loanlistings that we analyze in this study come from the one-year period between June 2006 and May 2007.These dates are indicated by the vertical lines.
Figure 1 graphs the number of requested loan listings made on the website overtime. The number of listings grew quickly after Prosper’s official launch in February,2006, reaching 5,000 requested loans per month by May, 2006 and rising to over10,000 listings per month by January, 2007. The number of loans that actually getfunded, however, has risen much more slowly. Of the 203,917 loans requested be-tween February, 2006 and November, 2007, 16,395 were funded (8.04 percent),with lenders providing a total of $101,913,173 in funds (mean $6,216 per loan) toborrowers. The large number of loan requests that go unfunded motivates our interestin understanding how the market chooses which loans to fund.
The vertical bars in Figure 1 highlight the time-period we study in this paper. Wefocus on all loans that were listed during a one-year period in the Prosper marketfrom June 2006 through May 2007, which leaves out the first few months of themarket and ensures that we have at least seven months of repayment data for anyloan made. Table 1 provides a series of summary statistics for the loan listings thatoccurred during the sample year. The columns in the table provide information aboutthe full sample of loan listings and the subset of listings that actually funded. Duringthis year, there were 110,333 distinct loan listings, of which 10,207 (9.3 percent)funded. The average requested loan size for all listings was $7,154 and was $5,930for the funded listings, revealing that during this period just over $60 million infunds were lent through Prosper. On average borrowers set a maximum interest rateof 17 percent on loan listings. Among the loans that actually funded, however,borrowers set a maximum interest rate of 20 percent and had an average final interest

Pope and Sydnor 61
rate (after bid down) of 18 percent. It is also worth noting that 43 percent of loansare specified as loans that “fund immediately.” Rather than letting lenders bid downthe interest rate, borrowers of these loans request that the loan is processed as soonas funding is available at the initial interest rate that was specified.
B. Credit Data
Prosper uses eight credit grades in their credit-scoring process. The majority (54percent) of the requested loans are made by individuals who fall into Prosper’s “highrisk” (HR) credit grade with credit scores from 520–59. Listings with these creditgrades are less likely to fund, however, and represent only 20 percent of the fundedlistings. Listings from individuals with the best credit grades (AA and A), who havecredit scores above 720, each make up 3 percent of the total listings, but are morelikely to fund and make up 10 percent and 9 percent of the funded listings, respec-tively. The average debt-to-income (DTI) ratio of 63 percent for those requestingloans also confirms the poor credit situation of the typical prospective borrower.Those who actually get loans are in a better financial situation, but still have ratherhigh average DTI at 39 percent.
C. Coded Data from Pictures and Text
To obtain data from pictures and descriptions, we employed a number of under-graduate research assistants to systematically code up the information in the bor-rower’s picture (if included) and the borrower’s one-line description of the loan forall 110,333 loan listings on Prosper during the sample year. These assistants werepaid a simple piece-rate per listing, and were informed that we would randomlycheck approximately 10 percent of their entries for accuracy. On the rare occasionthat one of the coders made a large number of errors, he or she was asked to redothe coding and was not paid until a thorough accuracy check was performed. Thecoders were not told about the underlying hypotheses of the research, and impor-tantly did not see any of the parameters of the loan listing other than the pictureand one-line description while coding.15
The coders used the text descriptions to classify the purpose of the loan. Thiscategorization provides an interesting picture of why borrowers are asking for moneyon Prosper.com. The categories for these purposes are listed in Table 1 and werechosen as the most frequent and important categories after a review of 750 loanlistings. Around 30 percent of the listings used a description that stated the purposeof the loan as being some form of debt consolidation (for example, “consolidatingcredit card debt,” “pay down debt,” and “paying off credit cards”). This is consistentwith media reports that often stress the potential value of the peer-to-peer creditmarket as a way out of credit-card debt. Another popular category (10 percent ofall listings) is business or entrepreneurship loans (for example, “expanding my suc-cessful small business,” “a new truck for landscaping business”). Smaller percent-ages communicated that they needed money for education expenses (3 percent),medical/funeral expenses (3 percent), home repairs (2 percent), automobile purchases
15. Copies of the coding protocols that we gave to the research assistants are available on request.

62 The Journal of Human Resources
Tab
le1
Sum
mar
ySt
atis
tics
Info
rmat
ion
from
Lis
tings
Info
rmat
ion
from
Pict
ures
(for
thos
ew
itha
pict
ure)
Var
iabl
esA
llL
istin
gsFu
nded
Lis
tings
Var
iabl
esA
llL
istin
gsFu
nded
Lis
tings
Cre
dit
Gra
deM
ain
Con
tent
ofPi
ctur
eA
A(7
60–8
00)
0.03
0.10
Adu
lt/A
dults
0.65
0.67
A(7
20–7
60)
0.03
0.09
Just
Chi
ldre
n0.
100.
07B
(680
–720
)0.
040.
11B
uild
ings
0.04
0.05
C(6
40–6
80)
0.07
0.16
Ani
mal
s0.
040.
04D
(600
–640
)0.
110.
17A
utom
obile
s0.
020.
02E
(560
–600
)0.
180.
17H
R(5
20–5
60)
0.54
0.20
For
Pict
ures
with
Adu
lts:
NC
0.01
0.01
Gen
der
Sing
leM
ale
0.38
0.40
Loa
nIn
form
atio
nSi
ngle
Fem
ale
0.35
0.31
$R
eque
sted
7,15
45,
930
Cou
ple
0.20
0.22
Bor
row
er’s
Max
Rat
e0.
170.
20G
roup
0.07
0.07
Fina
lR
ate
NA
0.18
Frac
tion
Fund
ed0.
121.
00R
ace
Clo
sed
Auc
tion
Loa
ns0.
430.
37W
hite
0.67
0.83
Bla
ck0.
200.
11O
ther
Info
rmat
ion
Prov
ided
Asi
an0.
030.
03D
ebt
toIn
com
eR
atio
0.63
0.39
His
pani
c0.
030.
02G
roup
Mem
ber
0.51
0.69

Pope and Sydnor 63
Ow
nsa
Hom
e0.
270.
39A
gePr
ovid
eda
Pict
ure
0.46
0.64
Les
sth
an35
yrs
0.53
0.54
35–6
0yr
s0.
410.
41In
form
atio
nC
oded
From
Des
crip
tions
:M
ore
than
60yr
s0.
020.
02Pu
rpos
eof
Loa
nH
appi
ness
Con
solid
ate
orPa
yD
ebt
0.30
0.33
Hap
py0.
740.
77B
usin
ess/
Ent
repr
eneu
rshi
p0.
100.
10N
eutr
al0.
230.
21Pa
yB
ills
0.04
0.02
Unh
appy
0.01
0.01
Edu
catio
nE
xpen
ses
0.03
0.03
Med
ical
/Fun
eral
Exp
ense
s0.
030.
02W
eigh
tH
ome
Rep
airs
0.02
0.03
Not
Ove
rwei
ght
0.73
0.75
Aut
oPu
rcha
se0.
020.
02So
mew
hat
Ove
rwei
ght
0.20
0.18
Hom
e/L
and
Purc
hase
0.02
0.02
Ver
yO
verw
eigh
t0.
030.
02A
uto
Rep
airs
0.01
0.01
Lux
ury
Item
Purc
hase
0.01
0.01
Attr
activ
enes
sW
eddi
ng0.
010.
01V
ery
Attr
activ
e0.
050.
06R
einv
est
inPr
ospe
r0.
010.
02A
vera
ge0.
910.
91T
axes
0.01
0.01
Ver
yU
nattr
activ
e0.
030.
02V
acat
ion
orT
rip
0.01
0.01
Mul
tiple
ofA
bove
Rea
sons
0.06
0.05
Oth
erU
ncle
ar/O
ther
0.34
0.33
Prof
esio
nally
Dre
ssed
0.13
0.14
Chi
ldA
lso
inPi
ctur
e0.
210.
21Si
gns
ofM
ilita
ryIn
volv
emen
t0.
020.
02O
bser
vatio
ns11
0,33
310
,207
50,8
206,
571
Not
es:
Thi
sT
able
pres
ents
sum
mar
yst
atis
tics
for
the
110,
333
loan
listin
gspo
sted
onPr
ospe
r.co
mbe
twee
nJu
ne20
06an
dM
ay20
07.
The
sum
mar
yst
atis
tics
for
each
vari
able
are
repo
rted
sepa
rate
lyfo
ral
llo
anlis
tings
and
the
set
oflo
anlis
tings
that
even
tual
lyfu
nded
.T
he“C
redi
tG
rade
,”“L
oan
Info
rmat
ion,
”an
d“O
ther
Info
rmat
ion
Prov
ided
”ca
tego
ries
prov
ide
info
rmat
ion
that
was
obta
ined
dire
ctly
from
vari
able
spr
ovid
edby
Pros
per.
com
.T
he“P
urpo
seof
Loa
n”ca
tego
ryan
d“I
nfor
mat
ion
from
Pict
ures
”ca
tego
ryw
asco
ded
byus
usin
gth
ede
scri
ptio
nsan
dpi
ctur
esth
atin
divi
dual
spo
sted
aspa
rtof
thei
rlo
anlis
tings
.
64 The Journal of Human Resources
(2 percent), automobile repairs (1 percent), or to pay back taxes (1 percent). Asizeable number of listings (34 percent) did not fall into these main categories (forexample, “need help”) and were coded under a category of unclear/other.16 Inter-estingly, and in contrast to the financial information, the distribution of loan purposeis quite similar between the funded listings and the full sample of listings, suggestingthat the stated purpose of the loan is not a particularly important determinant of loanfunding.
We hand-coded only the text in the one-line description and not in the longerdescription that borrower’s provide with their loan. The costs to hand-coding infor-mation from these longer descriptions were simply prohibitive. Instead we ran thelonger text descriptions through a simple text-analysis program that outputs the num-ber of characters, words, and sentences in the text, an index of readability based onthe average word-length and average sentence-length, and the percent of words thatare misspelled.17 These text-analysis variables are slightly correlated with measuresof creditworthiness and picture characteristics,18 and we include controls for themthroughout our analysis.
Turning to the pictures, Table 1 reveals that less than half (46 percent) of all loanlistings included a picture. However, the market seems to value the pictures, as 64percent of the funded listings contained a picture. There is an incredible diversityof pictures on the Prosper site, ranging from earnest looking couples, to dogs wearingantlers, to pictures of nature scenery, and the occasional bikini-clad young woman.Among listings with pictures, 65 percent included one or more adults as the centralfocus of the picture, and 21 percent included both adults and children. Another 10percent were pictures of just children without adults. A sizeable (though smaller)fraction of pictures contained no people, including 4 percent that were primarily ofa building (for example, a home or storefront), 4 percent primarily picturing animals(for example, pet dog), and 2 percent picturing an automobile.
For pictures that included adults, coders were instructed to code a number ofperceived characteristics. These include, gender, race, age, happiness, weight, andattractiveness. We also included categories of secondary interest, such as whetherthe people were professionally dressed or displayed signs of military involvement.19
16. Approximately 6 percent of listings included multiple reasons for wanting the loan within their de-scriptions (for example, “pay off a car loan and attend a family reunion”), and we coded these multiple-purpose listings under a separate category.17. The one-line descriptions may be a more first-order influence on the lending decision than the longerdescriptions. When prospective lenders browse loan listings, they first see a large page of listings (similarto a results page on Ebay), on which listings can be sorted or limited by a number of criteria. On thisinitial page, lenders see: a) the loan parameters (size, current interest rate, percent of the requested loanthat has been funded, and the number of bids), b) credit grade and DTI, c) a picture (if provided byborrower), and d) the borrowers one-line loan description. Thus, the picture and the one-line descriptionare the information that lenders have when deciding which of the roughly 4,000 listings active at any onetime to look at in detail.18. For example, the correlation between the number of words in the longer text description and listingswith a low-credit grade of“HR” is �0.01, with white listings is 0.03, and with black listings is �0.03.19. For each of these characteristics, the coding options included an unclear/uncertain category. Indicatorvariables for these unclear/uncertain categories are included throughout the analysis, but have very smallcell counts, and to save space we drop them from our summary statistics and regression tables.

Pope and Sydnor 65
The right-hand side of Table 1 gives summary statistics for the information codedfrom the pictures. Looking first at gender, there is a rough balance between menand women in the genders displayed in the loan listings. Of the pictures with people,pictures of single males make up 38 percent of the full sample and 40 percent ofthe funded listings. The analogous figures for females are 35 percent and 31 percent,and for male-female couples are 20 percent and 22 percent. The coders also recordedthe perceived race of the people pictured, using the primary categories of white/Caucasian, black/African American, Hispanic/Latino, and Asian.20 The majority, 67percent, appear to be white, while 20 percent are coded as black, 3 percent asHispanic, and 3 percent as Asian.21 Looking at the listings that actually fundedreveals that (unconditionally) minorities are much less likely than whites to receiveloans on Prosper—83 percent of the funded listings with adult pictures were ofapparently white individuals. The patterns for age, weight, and the secondary char-acteristics are all sensible and reveal relatively little difference between the fullsample of listings and the listings that fund.
Comparing the distributions of these variables between the full sample of listingsand the funded listings suggests that the market: (1) favors pictures of whites overminorities by a significant margin, (2) modestly favors pictures of men over women,of happy people over unhappy people, and thin people over overweight people, and(3) does not react very strongly to the stated purpose of the loan. Of course, sincethese characteristics may be highly correlated with other financial characteristics, thesummary statistics could be misleading.
IV. Empirical Results
A. Probability of Funding
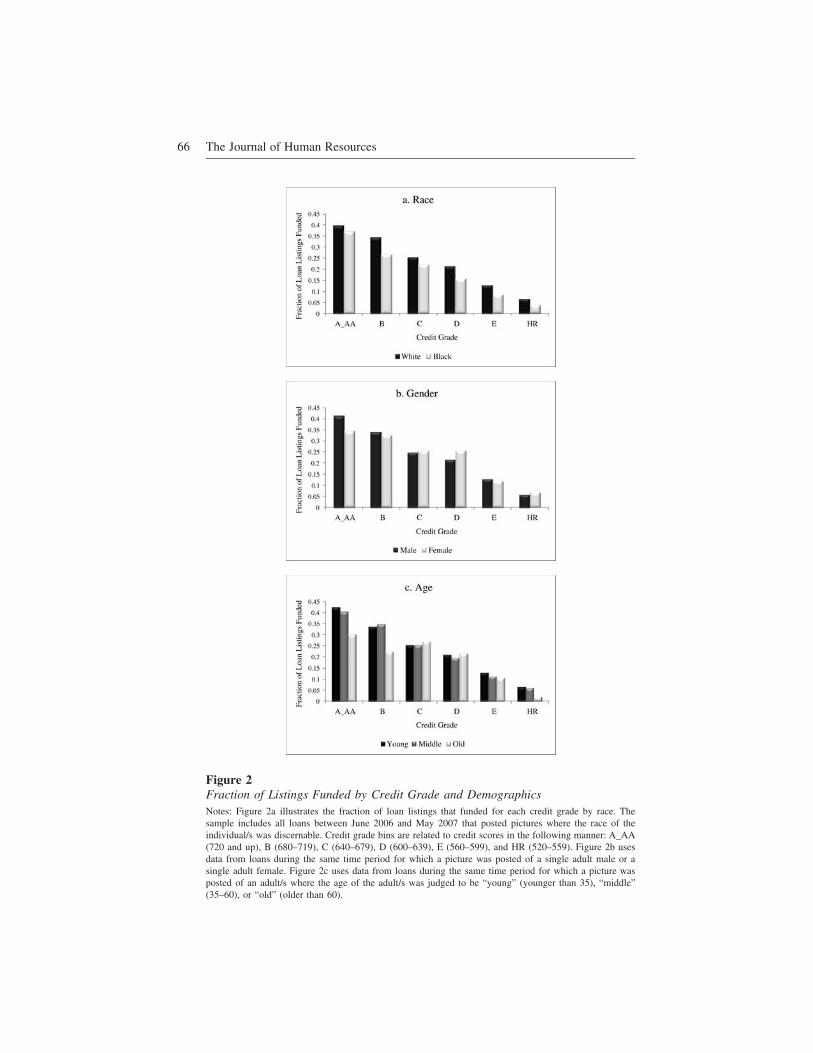
In this section we investigate how the information contained in pictures and descrip-tions affects the probability of funding holding all else equal. The summary statisticsin Table 1 provided the first hint that disparate treatment may exist in fundingdecisions. Figure 2 provides additional suggestive evidence. Figure 2a illustrates thefunding rate by each credit grade by white and black borrowers. Two main findingscan be taken from this figure. High-credit grade borrowers are more likely to befunded than low-credit grade borrowers, and whites are more likely to be fundedthan blacks at every credit grade. Figure 2b and 2c are less conclusive, but suggestthat females may be more likely to be funded than males (especially at lower creditgrades) and that older borrowers are less likely to be funded than younger borrowers.
As always, the challenge here is to overcome problems associated with omitted-variable bias so that our estimates can reasonably be interpreted as the market re-
20. These codings may not always agree with the race the borrower would list for him or herself if asked;however, it is the perception of race as conveyed through the pictures and not the actual race of borrowersthat may affect lenders’ decisions.21. Compared to statistics for the overall population from the 2000 Census—White (73.9 percent), Black(12.2 percent), Hispanic (14.8 percent), and Asian (4.4 percent)—blacks are overrepresented in our sample,while whites and Hispanics are underrepresented.
66 The Journal of Human Resources
Figure 2Fraction of Listings Funded by Credit Grade and DemographicsNotes: Figure 2a illustrates the fraction of loan listings that funded for each credit grade by race. Thesample includes all loans between June 2006 and May 2007 that posted pictures where the race of theindividual/s was discernable. Credit grade bins are related to credit scores in the following manner: A_AA(720 and up), B (680–719), C (640–679), D (600–639), E (560–599), and HR (520–559). Figure 2b usesdata from loans during the same time period for which a picture was posted of a single adult male or asingle adult female. Figure 2c uses data from loans during the same time period for which a picture wasposted of an adult/s where the age of the adult/s was judged to be “young” (younger than 35), “middle”(35–60), or “old” (older than 60).

Pope and Sydnor 67
sponse to the information provided by borrowers. Fortunately, the Prosper data areideally suited to help with this type of analysis. While there will always be aspectsof a loan listing for which we are unable to control (for example certain aspects ofthe picture that were not coded), the percent of information available to lenders forwhich we can control is much higher in this setting than in most other studies ofcredit markets. Further, the stability of our results across various specifications androbustness checks lends credibility to our identification strategy.
Our basic empirical strategy involves estimating the probability that a loan listinggets funded as a function of the listing characteristics that are observed by thelenders. We use both linear probability models, estimated via OLS, and Logit re-gressions. The basic linear regression framework is:
Y ���X ��Z ��ε ,(1) i i i i
where Yi is an indicator variable for whether or not listing i was funded, Xi is amatrix of characteristics coded from the pictures and one-line description of thepurpose of each loan, and Zi is a matrix of other characteristics of the listing andborrower, including credit controls and loan parameters. The regressions are esti-mated over the full sample of 110,333 listings made during the one-year sampleperiod. Because many borrowers relist their requests when their listings expire with-out funding (generally with higher maximum interest rates), we cluster at the bor-rower level to obtain standard errors.
1. Baseline Regression Estimates
Our baseline regression specification includes indicators for the characteristics codedfrom pictures and text along with a large set of flexible controls for the other pa-rameters of the loan listing. These controls (Zi) include credit grade crossed with acubic of the maximum interest rate the borrower set, a cubic of the size of therequested loan, the duration of the loan listing, the log of self-reported income, anda cubic of DTI. The other variables from a borrower’s credit profile available tolenders are: number of current delinquencies, delinquencies in the last seven years,total number of credit lines, total number of open credit lines, number of inquiriesin the last six months, revolving credit balance, and bank card utilization. Thesevariables are included in the regressions in log form.22 We also include dummyvariables for homeownership status, occupation type, employment status, whetherthe borrower was a member of a group, and the rating (one to five stars) of thegroup. Additionally, we include variables created using our text analysis from thelong-description: the log number of total characters, a readability index (which usesword and sentence length), and the percent of words which are misspelled. Finally,since this is an evolving market and one that can be affected by fluctuations in theoverall economy, we include month dummies to capture time effects unrelated tospecific listing parameters. The estimated coefficients on credit and loan-parametercontrols ( ) are sensible and unsurprising and generally highly statistically signifi-�̃cant. Because these variables enter the regression nonlinearly or with interaction
22. To avoid problems associated with ln(0), we added one to each variable before taking the log.

68 The Journal of Human Resources
effects and due to space constraints, we do not report the coefficients here. However,later we discuss a robustness table that shows estimates for some of these variablesfrom a simpler linear specification.
Table 2 shows the coefficient estimates for the variables we coded from the pic-tures and descriptions ( ). Columns 1 and 3 display the results using OLS and�̃Columns 2 and 4 display the Logit results as the marginal effects of the variableson the probability of funding. For each of the categories listed in the table, we havealso listed the base-group on which the coefficient estimates are based. In order touse all of the available data in our regressions, we included dummy variables toindicate when a listing had no picture or a picture without people in it. The coef-ficients on these dummies are not reported in the table, because they depend on thebase-groups chosen for the race, gender, age, and other controls. However, in asimilar regression that includes the same credit controls, but codes only for whetheror not a listing had a picture, we find that listings without pictures are approximatelythree percentage points less likely to fund.
Consistent with the raw summary statistics, the largest effects of the picture char-acteristics are for race. The OLS estimates imply that listings with a picture of anapparently black or African American person are 3.2 percentage points less likelyto get funded than an equivalent listing with a picture of a white person. Relativeto the overall average funding rate of 9.3 percent, this is a 34 percent drop in thelikelihood of funding. The marginal effects from the Logit regression imply a slightlysmaller but still economically meaningful difference of 2.4 percentage points. Bothestimates are statistically significant at the 1 percent level. Interestingly, the negativeeffect of a black picture is approximately the same as that of displaying no pictureat all.
After controlling for credit characteristics, the estimated effect of displaying apicture of a woman is the reverse of what we saw in the summary statistics. In theraw summary statistics, women are less likely to have their loan requests funded,but this is driven by the correlation between female pictures and credit score. Theestimated effects in Table 2 are positive, and in the Logit specification imply thatall else equal listings with a picture of a woman are 1.1 percentage points morelikely to fund. This result is statistically significant and approximately half the sizeof the estimated effect of a black photo.
The apparent age of the person in the picture is also an important predictor ofsuccessful funding. Compared to the base group of 35–60-years-old, those whoappear younger than 35 have a predicted rate of funding that is between 0.4 and 0.9percentage points higher, while those who appear to be over 60 years old are between1.1 and 2.3 percentage points less likely to succeed in acquiring a loan. However,it is worth noting that the elderly comprise only 2 percent of the pictures in thesample.
There are also some interesting results related to the perceived happiness, weight,and attractiveness of individuals in their pictures, though the results are generallysomewhat weaker. For instance, the OLS estimates imply that listings of significantlyoverweight people are 1.6 percentage points less likely to fund, which is statisticallysignificant at the 5 percent level. However, the marginal effect in the Logit speci-fication is only �0.6 percentage points and is not statistically distinguishable fromzero. The coefficients on our measures of attractiveness imply directionally that more

Pope and Sydnor 69
attractive people are more likely to have their loans funded; however, the coefficientestimates are rather small and are not statistically significant.23 The strongest effectsfrom this set of characteristics are for perceived happiness. People who look unhappyare between 1.6 (Logit) and 1.8 (OLS) percentage points less likely to have theirloans funded. While these differences are statistically significant at the 10 percentlevel in both specifications, it is important to note that unhappy people make uponly 1 percent of all pictures.
Finally, we coded some secondary characteristics of pictures with adults, includingwhether the adult had a child with them in the photo, whether the person wasprofessionally dressed (for example, wearing a tie), and whether there were signs ofmilitary involvement (for example, uniform). We find no significant effect of a childin the picture or of professional dress on funding. While statistically insignificant inthe OLS specification, in the Logit specification military involvement increases thelikelihood of funding by 2.5 percentage points.
The estimated effects of the coded loan purpose are generally weaker than thoseof the picture characteristics, though there are some important and sensible patterns.The base-group for these purpose dummies is the listings with no clear purpose thatcould be discerned from the one-line loan description. Relative to that group, theloans listings that express interest in consolidating or paying down debt (usuallyhigh-interest credit-card debt) are between 0.4 (Logit) and 0.5 (OLS) percentagepoints more likely to get funded. Loans with most other purposes are less likely tofund, though many of the effects are not statistically significant.
2. Robustness
In Table 3 we begin to investigate the robustness of these results, focusing on theestimated effects for race. The table reports marginal effects from the Logit regres-sion for a number of specifications. In the first column the regressors include onlythe gender and race characteristics coded from the pictures without any credit orloan-parameter controls. They confirm the summary statistics; blacks are five per-centage points less likely to get funded than whites. The second column adds dum-mies for the borrower’s credit grade, continuous linear measures of the maximuminterest rate, DTI, and requested loan size. Adding these controls brings the estimatesmuch closer to the estimates reported in Table 2, and highlights the important cor-relations that race has with credit measures; the estimated effect of being black fallsto �2.8 percentage points. This column also provides easy comparisons of the sizeof the race effect. The marginal effect of being black (�2.8 percent) is somewhatless that the �4.1 percent effect of moving from a credit score of above 760 (AA
23. In other specifications (not reported) we interact gender with this attractiveness measure to see whetherthere is an effect of pictures of especially attractive females. The estimates are in the direction of a positiveinteraction between female and attractiveness, but the magnitude is very small and statistically insignificant.We suspect that the inherent subjectivity of attractiveness and the coarseness of the measure we used mayhave introduced measurement error and subsequent attenuation bias in the attractiveness variable. Ourresults are directionally consistent with those of Ravina (2008), who conducted a more thorough codingof attractiveness using a smaller sample of Prosper loans and finds a strong positive effect of beauty onthe likelihood of funding.

70 The Journal of Human Resources
Tab
le2
The
Eff
ect
ofB
orro
wer
Cha
ract
eris
tics
and
Pur
pose
onL
oans
Bei
ngF
unde
d
Dep
ende
ntV
aria
ble:
Indi
cato
r�
1if
the
Loa
nw
asFu
nded
OL
SL
ogit
OL
SL
ogit
(1)
(2)
(3)
(4)
Mea
nof
Dep
ende
ntV
aria
ble
0.09
30.
093
Loa
nPu
rpos
e(B
G:
Unc
lear
)G
ende
r(B
G:
Sing
leM
ale)
Con
solid
ate
orPa
yD
ebt
0.00
50.
004
Sing
leFe
mal
e0.
004
0.01
1(0
.003
)*(0
.002
)*
(0.0
04)
(0.0
03)**
*B
usin
ess/
Ent
repr
eneu
rshi
p�
0.01
5�
0.00
6C
oupl
e�
0.00
7�
0.00
1(0
.004
)***
(0.0
03)**
(0.0
04)
(0.0
03)
Pay
Bill
s�
0.01
5�
0.01
0G
roup
�0.
011
�0.
004
(0.0
07)**
(0.0
06)
(0.0
06)*
(0.0
04)
Edu
catio
nE
xpen
ses
0.00
10.
001
Rac
e(B
G:
Whi
te)
(0.0
07)
(0.0
05)
Bla
ck�
0.03
2�
0.02
4M
edic
al/F
uner
alE
xpen
ses
�0.
013
�0.
014
(0.0
03)**
*(0
.003
)***
(0.0
07)*
(0.0
06)**
Asi
an0.
002
0.00
4H
ome
Rep
airs
0.01
80.
005
(0.0
09)
(0.0
06)
(0.0
10)*
(0.0
06)
His
pani
c�
0.01
8�
0.00
6A
uto
Purc
hase
�0.
009
�0.
005
(0.0
08)**
(0.0
05)
(0.0
08)
(0.0
06)
Age
(BG
:35
�60
yrs)
Hom
e/L
and
Purc
hase
�0.
023
�0.
015
Les
sth
an35
yrs
0.00
90.
004
(0.0
08)**
*(0
.006
)***
(0.0
03)**
*(0
.002
)*A
uto
Rep
airs
�0.
019
�0.
015
Mor
eth
an60
yrs
�0.
023
�0.
011
(0.0
12)
(0.0
07)**
(0.0
11)**
(0.0
07)*
Lux
ury
Item
Purc
hase
�0.
013
�0.
011

Pope and Sydnor 71
Hap
pine
ss(B
G:
Neu
tral
)(0
.012
)(0
.008
)H
appy
0.00
70.
002
Wed
ding
�0.
005
�0.
006
(0.0
03)**
(0.0
02)
(0.0
12)
(0.0
07)
Unh
appy
�0.
018
�0.
016
Rei
nves
tin
Pros
per
0.03
4�
0.01
0(0
.010
)*(0
.009
)*(0
.021
)(0
.006
)*
Wei
ght
(BG
:N
otO
verw
eigh
t)T
axes
0.01
00.
008
Som
ewha
tov
erw
eigh
t0.
001
0.00
3(0
.019
)(0
.011
)(0
.004
)(0
.003
)V
acat
ion
orT
rip
0.03
20.
006
Ver
yov
erw
eigh
t�
0.01
6�
0.00
8(0
.020
)�
(0.0
11)
(0.0
08)**
(0.0
06)
Mul
tiplie
ofA
bove
Rea
sons
�0.
004
�0.
003
Attr
activ
enes
s(B
G:
Ave
rage
)(0
.005
)(0
.003
)V
ery
attr
activ
e0.
007
0.00
4Pi
ctur
eC
hara
cter
istic
sX
X(0
.008
)(0
.005
)M
onth
Fixe
dE
ffec
tsX
XV
ery
unat
trac
tive
�0.
002
�0.
005
Cre
dit
Con
trol
sX
X(0
.009
)(0
.007
)R
–Squ
ared
0.31
0M
isc.
Adu
ltIn
form
atio
nO
bser
vatio
ns11
0,33
311
0,33
2Pr
ofes
iona
llyD
ress
ed0.
000
0.00
2(0
.005
)(0
.003
)C
hild
With
Adu
ltin
Pict
ure
�0.
005
0.00
1(0
.003
)(0
.002
)Si
gns
ofM
ilita
ryIn
volv
emen
t0.
014
0.02
5(0
.011
)(0
.009
)***
Not
es:
Coe
ffici
ent
valu
esan
dst
anda
rder
rors
clus
tere
dby
borr
ower
are
pres
ente
dus
ing
anO
LS
regr
essi
on(C
olum
ns1
and
3)an
da
Log
itre
gres
sion
(Col
umns
2an
d4)
-mar
gina
lef
fect
sre
port
ed.
The
depe
nden
tva
riab
lein
both
regr
essi
ons
isa
dum
my
vari
able
indi
catin
gw
heth
era
part
icul
arlo
anlis
ting
was
fund
ed.E
ach
char
acte
rist
icty
pefo
rw
hich
aco
effic
ient
valu
eis
repo
rted
can
bein
terp
rete
dre
lativ
eto
itsba
segr
oup
whi
chis
indi
cate
din
pare
nthe
sis.
The
coef
ficie
nts
onot
her
vari
able
sth
atar
ein
clud
edin
the
regr
essi
on(c
redi
tco
ntro
ls,
mon
thfix
edef
fect
s,et
c.)
are
omitt
eddu
eto
spac
eco
nstr
aint
s.T
heen
tire
set
ofva
riab
les
used
inth
ese
regr
essi
ons
ispr
ovid
edin
the
text
unde
rth
ehe
adin
g“B
asel
ine
Reg
ress
ion
Est
imat
es.”
*si
gnifi
cant
at10
perc
ent;
**si
gnifi
cant
at5
perc
ent;
***
sign
ifica
ntat
1pe
rcen
t

72 The Journal of Human Resources
Tab
le3
The
Eff
ect
ofR
ace
onL
oans
Bei
ngF
unde
d—Sp
ecifi
cati
onR
obus
tnes
s
Dep
ende
ntV
aria
ble:
Indi
cato
r�
1if
the
Loa
nw
asFu
nded
Onl
yL
oans
with
Pict
ures
Onl
y1s
tL
oan
Per
Bor
row
er(1
)(2
)(3
)(4
)(5
)(6
)
Mea
nof
Dep
ende
ntV
aria
ble
0.09
30.
093
0.09
30.
093
0.12
90.
070
Rac
e(B
G:
Whi
te)
Bla
ck�
0.05
1�
0.02
8�
0.02
2�
0.02
4�
0.03
3�
0.02
1(0
.002
)***
(0.0
03)**
*(0
.003
)***
(0.0
03)**
*(.
004)
***
(.00
4)**
*
Asi
an0.
010
0.00
00.
006
0.00
40.
006
�0.
001
(0.0
08)
(0.0
06)
(0.0
06)
(0.0
06)
(.00
7)(.
006)
His
pani
c�
0.02
8�
0.01
3�
0.00
7�
0.00
6�
0.00
90.
001
(0.0
06)**
*(0
.006
)**(0
.006
)(0
.005
)(.
007)
(.00
9)C
redi
tG
rade
(BG
:H
R&
NC
)A
A0.
745
(0.0
04)**
*
A0.
704
(0.0
04)**
*
B0.
624
(0.0
04)**
*
C0.
477
(0.0
04)**
*

Pope and Sydnor 73
D0.
315
(0.0
04)**
*
E0.
106
(0.0
03)**
*
Oth
erK
eyC
redi
tV
aria
bles
Max
imum
Bor
row
er’s
Rat
e1.
756
(0.0
22)**
*
Deb
tto
Inco
me
Rat
io�
0.01
4(0
.001
)***
$R
eque
sted
(tho
usan
ds)
�0.
000
(.00
0)**
*
All
othe
rC
redi
tC
ontr
ols
XX
XX
Lon
gD
escr
iptio
nT
ext
Con
trol
sX
XX
Mon
thFi
xed
Eff
ects
XX
XO
ther
Pict
ure
Cha
ract
eris
tics
XX
XL
oan
Purp
ose
Fixe
dE
ffec
tsX
XX
Obs
erva
tions
110,
333
110,
333
110,
333
110,
333
50,8
2051
,676
Not
es:
Coe
ffici
ent
valu
esan
dst
anda
rder
rors
clus
tere
dby
borr
ower
are
pres
ente
dus
ing
Log
itre
gres
sion
s–
mar
gina
lef
fect
sre
port
ed.
The
depe
nden
tva
riab
lein
all
regr
essi
ons
isa
dum
my
vari
able
indi
catin
gw
heth
era
part
icul
arlo
anlis
ting
was
fund
ed.
Eac
hC
olum
ns1–
4pr
ogre
ssiv
ely
incl
ude
ala
rger
set
ofco
ntro
lva
riab
les.
The
coef
ficie
nts
onth
ese
cont
rol
vari
able
sar
eom
itted
due
tosp
ace
cons
trai
nts.
The
entir
ese
tof
vari
able
sus
edin
thes
ere
gres
sion
sis
prov
ided
inth
ete
xtun
der
the
head
ing
“Bas
elin
eR
egre
ssio
nE
stim
ates
.”C
olum
n5
rest
rict
sth
esa
mpl
eto
loan
sth
atpo
sted
api
ctur
e.C
olum
n6
rest
rict
sth
esa
mpl
eto
first
loan
spo
sted
bya
uniq
uebo
rrow
er(s
ubse
quen
tlo
anlis
tings
are
elim
inat
edfr
omth
esa
mpl
e).
*si
gnifi
cant
at10
perc
ent;
**si
gnifi
cant
at5
perc
ent;
***
sign
ifica
ntat
1pe
rcen
t

74 The Journal of Human Resources
credit) to a credit-score range of 720–59 (A credit), and about one and a half timesas large as the effect of a 1 percentage-point change in the maximum interest rate.
Columns 3 and 4 of Table 3 add in interaction terms in the financial variables,additional credit controls, the long-description text-analysis controls (for example,percent of words misspelled), time trends, other picture controls, and loan purposevariables. There is a slight drop in the race effect when additional credit controlsare added, but otherwise the effect of a black photo does not change meaningfullywith these additional characteristics. Column 5 restricts the sample to loans thatposted a picture (46.1 percent of all loans). Focusing on this subsample allows usto avoid any potential interaction effects between choosing to post a picture andrace. This sample restriction strengthens the significant results that we find in termsof the absolute percentage point difference between black and white funding; how-ever, it is a similar percentage change from the base rate. Column 6 restricts thesample to only the first loan posted by each borrower. This restriction eliminatesconcerns that subsequent posting behavior may bias the results we find. The effectsize in Column 6 is similar to that found in Column 4 in terms of percentage pointsand slightly larger in terms of percent off the new baseline.
There are a few main takeaways from this robustness table. Approximately halfof the disparity in loan funding between blacks and whites observed in the sampleaverages can be accounted for by the different financial characteristics. It is alsoimportant to note that once basic credit controls are included in the regressions, theestimated effects on race are quite stable across different specifications.24
In Table 4 we investigate the race results under a number of different cuts of thedata. Each cut uses the baseline Logit specification from Table 2 and reports mar-ginal effects. Cutting by credit grade reveals that across all credit grades there is asignificant negative response to black pictures. The percentage point difference inthe likelihood of funding between blacks and whites is actually higher for bettercredit grades: Blacks are 4–6 percentage points less likely to be funded amongstborrowers with credit scores above 640 (grades of C and above), compared to a 3.3percentage point difference for D&E credit (560–640) and a 1.3 percentage pointdifference for the high-risk borrowers (520–560). Comparing these differences tothe mean probability of funding for the different groups, however, reveals that thelikelihood of funding is 37 percent lower for blacks in the high-risk category versus12.2 percent for blacks in the highest credit grades.
The second cut we investigate splits the one-year sample in half and contrastsresults estimated over listings in the first six months of the sample versus those inthe second six months. None of the results are meaningfully different between thesesamples. Although the market itself is evolving rapidly, the market response toinformation contained in pictures and text has remained relatively stable.
For the third cut in Table 4, we divide the sample into quartiles of self-reportedincome. The negative marginal effect of a black picture versus a white picture is
24. Another potential worry is that despite the controls we use, our coding procedure does not take on aflexible enough function form which may lead to biased estimates. To test for these, we implemented apropensity-score matching estimation where black and white loan listings were matched on key character-istics. The results from this analysis (which were included in a previous version of this paper) are consistentwith those presented in this paper and are available from the authors upon request.

Pope and Sydnor 75
slightly larger for higher income quartiles—ranging from �2.1 percentage pointsfor the lowest income quartile to �3.4 percentage points for the highest incomequartile. Of course, these income quartiles have different mean rates of funding, andthus in percentage terms the negative effect of a black picture is quite a bit largerin the lowest quartiles.
The final cut in the Table 4 investigates whether the race and gender effects varydepending on the borrower’s stated occupation. We split the sample based on oc-cupations that are likely to require a college degree versus those that do not. Thenegative marginal effect of a black picture is slightly more than a percentage pointlarger for those with high education jobs (�3.3 percent to �1.9 percent). Whencompared to the funding base rates of the two groups, however, the marginal effectsare quite similar in percent terms. The fact that the results for blacks are not stronglyrelated to these occupation cuts, again suggests that any failure on our part to fullycapture inferences that lenders can make about educational attainment of the bor-rowers based on observables is unlikely to explain the race results.
One final note on the robustness of our estimates of the probability of funding isin order. Lenders have the option of creating settings that automatically bid on loansbased on lender-chosen criteria of credit score, DTI, and the like. We are not ableto ascertain how many lenders use this option, but if all lenders exclusively usedthis process, we would not find any effect on the picture or text characteristics.Hence our results may underestimate the market response that would be observedin a market without automatic bidding. The results also highlight that market par-ticipants do in fact react to the nonfinancial information and that many forgo theoption to bid on loans without reviewing the listing in detail.
B. Final Interest Rate on Funded Loans
The differences in the likelihood of funding translate into different final interest ratesconditional on a loan getting funded. Table 5 presents the results from an OLSregression of the final interest rate of a funded loan on the borrower and listingcharacteristics used in the baseline specification (Table 2), excluding the maximuminterest rate the borrower set. The estimates are in the directions one would expectbased on the estimates of the probability of loan funding. The first column of thetable is estimated over all 10,207 loans made in the Prosper market during oursample year. All else equal, a funded listing with a picture of a black borrower endsup with an interest rate that is 60 basis points higher than an equivalent listing fora white borrower. Single females have rates that are 40 basis points lower thanmales. The results for age and happiness are much smaller and not statisticallydistinguishable from zero. The very unattractive end up with rates that are 60 basispoints higher than their average-looking counterparts. The effects of the stated loanpurposes are also sensible given the results above. For instance, those expressing adesire to consolidate credit-card debt obtain loans with interest rates that are 20 basispoints lower than their counterparts who express a need for a business loan.
These estimates are consistent with the predictions of the idea that the differentreservation rates lenders set for loans from otherwise similar “majority” and “mi-nority” borrowers would lead to different interest rates on funded loans for thegroups. However, there is a potential problem with interpreting these interest-rate

76 The Journal of Human Resources
Tab
le4
The
Eff
ect
ofR
ace
onL
oans
Bei
ngF
unde
d—Sa
mpl
eC
uts
Dep
ende
ntV
aria
ble:
Indi
cato
r�
1if
the
Loa
nw
asFu
nded
Pane
lA
Sam
ple
Cut
byC
redi
tG
rade
sSa
mpl
eC
utby
Tim
e
AA
&A
B&
CD
&E
HR
&N
CFi
rst
6M
onth
sL
ast
6M
onth
s(1
)(2
)(3
)(4
)(5
)(6
)
Mea
nof
Dep
ende
ntV
aria
ble
0.33
50.
225
0.10
80.
035
0.08
70.
096
Rac
e(B
G:
Whi
te)
Bla
ck�
0.04
1�
0.05
4�
0.03
3�
0.01
3�
0.02
�0.
026
(0.0
31)
(0.0
14)**
*(0
.005
)***
(0.0
02)**
*(0
.004
)***
(0.0
03)**
*
Asi
an0.
011
0.00
0�
0.00
40.
006
0.00
20.
005
(0.0
27)
(0.0
19)
(0.0
11)
(0.0
06)
(0.0
11)
(0.0
06)
His
pani
c0.
072
0.00
5�
0.01
1�
0.00
6�
0.02
20.
006
(0.0
54)
(0.0
26)
(0.0
10)
(0.0
04)
(0.0
08)**
*(0
.007
)O
ther
Pict
ure
Cha
ract
eris
tics
XX
XX
XX
Loa
nPu
rpos
eFi
xed
Eff
ects
XX
XX
XX
Mon
thFi
xed
Eff
ects
XX
XX
XX
Cre
dit
Con
trol
sX
XX
XX
XO
bser
vatio
ns5,
587
12,1
2332
,154
60,3
9145
,941
64,3
86

Pope and Sydnor 77
Pane
lB
Sam
ple
Cut
byIn
com
eQ
uart
iles
Sam
ple
Cut
byO
ccup
atio
n
Low
Qua
rtile
2nd
Qua
rtile
3rd
Qua
rtile
Hig
hQ
uart
ileN
oC
olle
geC
olle
ge(1
)(2
)(3
)(4
)(5
)(6
)
Mea
nof
Dep
ende
ntV
aria
ble
0.05
90.
072
0.09
10.
147
0.08
60.
116
Rac
e(B
G:
Whi
te)
Bla
ck�
0.02
1�
0.02
2�
0.02
2�
0.03
4�
0.01
9�
0.03
2(.
004)
***
(0.0
04)**
*(0
.005
)***
(0.0
07)**
*(0
.004
)***
(0.0
06)**
*
Asi
an�
0.00
3�
0.00
10.
008
0.01
6�
0.00
60.
003
(.00
9)(0
.010
)(0
.011
)(0
.013
)(0
.008
)(0
.010
)H
ispa
nic
�0.
020
0.00
00.
003
�0.
013
�0.
003
�0.
012
(.00
6)**
*(0
.009
)(0
.013
)(0
.013
)(0
.007
)(0
.014
)O
ther
Pict
ure
Cha
ract
eris
tics
XX
XX
XX
Loa
nPu
rpos
eFi
xed
Eff
ects
XX
XX
XX
Mon
thFi
xed
Eff
ects
XX
XX
XX
Cre
dit
Con
trol
sX
XX
XX
XO
bser
vatio
ns28
,480
26,0
5427
,244
27,2
8856
,208
20,4
32
Not
es:
Coe
ffici
ent
valu
esan
dst
anda
rder
rors
clus
tere
dby
borr
ower
are
pres
ente
dus
ing
Log
itre
gres
sion
s—m
argi
nal
effe
cts
repo
rted
.T
hede
pend
ent
vari
able
inal
lre
gres
sion
sis
adu
mm
yva
riab
lein
dica
ting
whe
ther
apa
rtic
ular
loan
listin
gw
asfu
nded
.Col
umns
1–4
ofPa
nel
Apr
esen
tre
sults
from
regr
essi
ons
usin
gda
tacu
tby
cred
itgr
ades
.T
hese
cond
half
ofPa
nel
Apr
esen
tsre
sults
from
regr
essi
ons
usin
gda
tafr
omJu
ne20
06to
Nov
embe
r20
06(C
olum
n5)
and
Dec
embe
r20
06to
May
2007
(Col
umn
6).
Col
umns
1–4
ofPa
nel
Bpr
esen
tre
sults
from
regr
essi
onus
ing
data
cut
byin
com
equ
artil
es.
The
seco
ndha
lfof
Pane
lA
pres
ent
resu
ltsfr
omre
gres
sion
sus
ing
data
from
indi
vidu
als
who
sese
lf-r
epor
ted
occu
patio
ndo
esno
tty
pica
llyre
quir
ea
colle
gede
gree
(Col
umn
5)an
dfo
rth
ose
who
seoc
cupa
tion
typi
cally
does
requ
ire
aco
llege
degr
ee(C
olum
n6)
.T
heco
effic
ient
son
othe
rva
riab
les
that
are
incl
uded
inth
ere
gres
sion
(cre
dit
cont
rols
,m
onth
fixed
effe
cts,
etc.
)ar
eom
itted
due
tosp
ace
cons
trai
nts.
The
entir
ese
tof
vari
able
sus
edin
thes
ere
gres
sion
sis
prov
ided
inth
ete
xtun
der
the
head
ing
“Bas
elin
eR
egre
ssio
nE
stim
ates
.”*
sign
ifica
ntat
10pe
rcen
t;**
sign
ifica
ntat
5pe
rcen
t;**
*si
gnifi
cant
at1
perc
ent
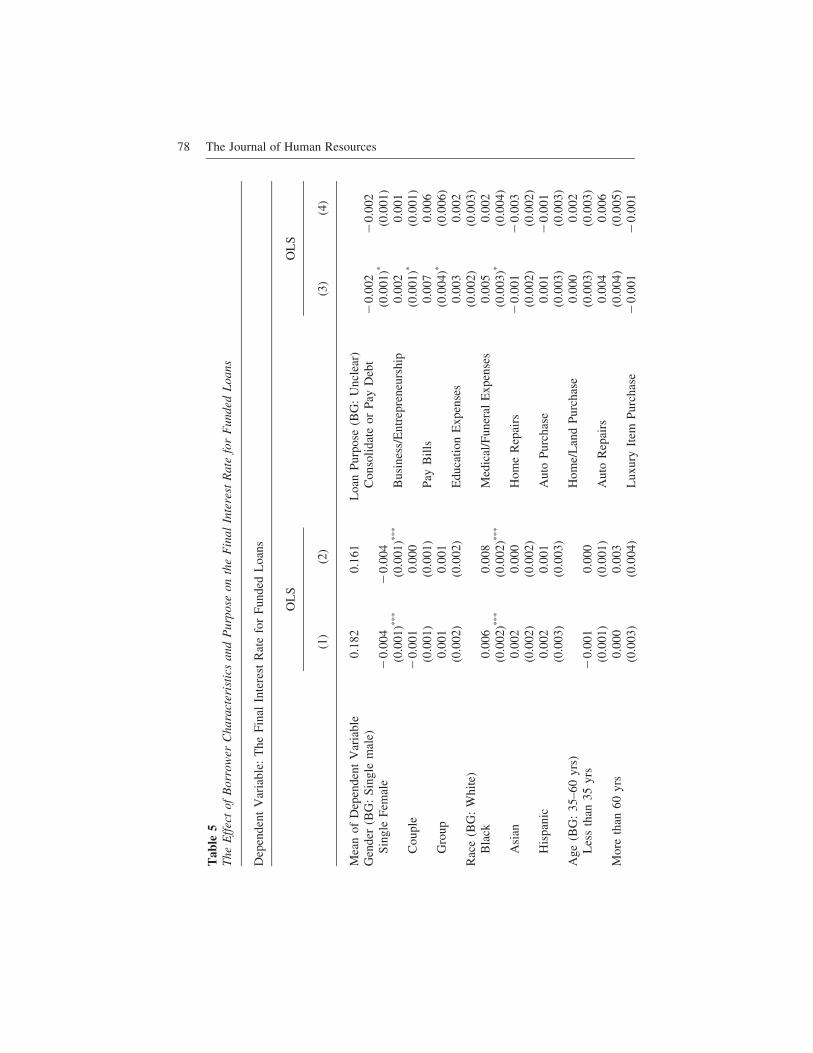
78 The Journal of Human Resources
Tab
le5
The
Eff
ect
ofB
orro
wer
Cha
ract
eris
tics
and
Pur
pose
onth
eF
inal
Inte
rest
Rat
efo
rF
unde
dL
oans
Dep
ende
ntV
aria
ble:
The
Fina
lIn
tere
stR
ate
for
Fund
edL
oans
OL
SO
LS
(1)
(2)
(3)
(4)
Mea
nof
Dep
ende
ntV
aria
ble
0.18
20.
161
Loa
nPu
rpos
e(B
G:
Unc
lear
)G
ende
r(B
G:
Sing
lem
ale)
Con
solid
ate
orPa
yD
ebt
�0.
002
�0.
002
Sing
leFe
mal
e�
0.00
4�
0.00
4(0
.001
)*(0
.001
)(0
.001
)***
(0.0
01)**
*B
usin
ess/
Ent
repr
eneu
rshi
p0.
002
0.00
1C
oupl
e�
0.00
10.
000
(0.0
01)*
(0.0
01)
(0.0
01)
(0.0
01)
Pay
Bill
s0.
007
0.00
6G
roup
0.00
10.
001
(0.0
04)*
(0.0
06)
(0.0
02)
(0.0
02)
Edu
catio
nE
xpen
ses
0.00
30.
002
Rac
e(B
G:
Whi
te)
(0.0
02)
(0.0
03)
Bla
ck0.
006
0.00
8M
edic
al/F
uner
alE
xpen
ses
0.00
50.
002
(0.0
02)**
*(0
.002
)***
(0.0
03)*
(0.0
04)
Asi
an0.
002
0.00
0H
ome
Rep
airs
�0.
001
�0.
003
(0.0
02)
(0.0
02)
(0.0
02)
(0.0
02)
His
pani
c0.
002
0.00
1A
uto
Purc
hase
0.00
1�
0.00
1(0
.003
)(0
.003
)(0
.003
)(0
.003
)A
ge(B
G:
35–6
0yr
s)H
ome/
Lan
dPu
rcha
se0.
000
0.00
2L
ess
than
35yr
s�
0.00
10.
000
(0.0
03)
(0.0
03)
(0.0
01)
(0.0
01)
Aut
oR
epai
rs0.
004
0.00
6M
ore
than
60yr
s0.
000
0.00
3(0
.004
)(0
.005
)(0
.003
)(0
.004
)L
uxur
yIt
emPu
rcha
se�
0.00
1�
0.00
1

Pope and Sydnor 79
Hap
pine
ss(B
G:
Neu
tral
)(0
.003
)(0
.004
)H
appy
�0.
001
�0.
001
Wed
ding
0.01
00.
007
(0.0
01)
(0.0
01)
(0.0
04)**
(0.0
05)
Unh
appy
0.00
20.
002
Rei
nves
tin
Pros
per
0.00
40.
004
(0.0
04)
(0.0
05)
(0.0
02)**
(0.0
02)**
Wei
ght
(BG
:N
otO
verw
eigh
t)T
axes
�0.
007
�0.
012
Som
ewha
tov
erw
eigh
t0.
002
0.00
2(0
.004
)*(0
.005
)**
(0.0
01)*
(0.0
01)
Vac
atio
nor
Tri
p0.
005
0.00
7V
ery
over
wei
ght
0.00
30.
005
(0.0
04)
(0.0
08)
(0.0
02)
(0.0
03)
Mul
tiplie
ofA
bove
Rea
sons
0.00
30.
003
Attr
activ
enes
s(B
G:
Ave
rage
)(0
.002
)(0
.002
)V
ery
attr
activ
e0.
003
0.00
3O
pen
Fund
ing
Opt
ion
Onl
yX
(0.0
02)*
(0.0
02)
Pict
ure
Cha
ract
eris
tics
XX
Ver
yun
attr
activ
e0.
006
0.00
9M
onth
Fixe
dE
ffec
tsX
X(0
.003
)**(0
.003
)***
Cre
dit
Con
trol
sX
XM
isc.
Adu
ltIn
form
atio
nR
–Squ
ared
0.79
0.76
Prof
esio
nally
Dre
ssed
0.00
30.
003
Obs
erva
tions
10,2
076,
419
(0.0
01)**
(0.0
01)*
Chi
ldW
ithA
dult
inPi
ctur
e0.
003
0.00
2(0
.001
)***
(0.0
01)
Sign
sof
Mili
tary
Invo
lvem
ent
�0.
002
0.00
0(0
.003
)(0
.004
)
Not
es:
Coe
ffici
ent
valu
esan
dst
anda
rder
rors
clus
tere
dby
borr
ower
are
pres
ente
dus
ing
two
OL
Sre
gres
sion
s.T
hede
pend
ent
vari
able
inbo
thre
gres
sion
sis
the
final
inte
rest
rate
that
borr
ower
sha
veto
pay
for
apa
rtic
ular
loan
.T
here
gres
sion
pres
ente
din
Col
umns
1an
d3
uses
the
entir
esa
mpl
eof
fund
edlo
ans
whi
leth
ere
gres
sion
repo
rted
inC
olum
ns2
and
4re
stri
cts
the
sam
ple
tolo
ans
for
whi
chth
ese
tting
ofth
elo
anlis
ting
was
such
toal
low
anau
ctio
nsy
stem
tode
term
ine
the
final
inte
rest
rate
.E
ach
char
acte
rist
icty
pefo
rw
hich
aco
effic
ient
valu
eis
repo
rted
can
bein
terp
rete
dre
lativ
eto
itsba
segr
oup
whi
chis
indi
cate
din
pare
nthe
sis.
The
coef
ficie
nts
onot
her
vari
able
sth
atar
ein
clud
edin
the
regr
essi
on(c
redi
tco
ntro
ls,
mon
thfix
edef
fect
s,et
c.)
are
omitt
eddu
eto
spac
eco
nstr
aint
s.T
heen
tire
set
ofva
riab
les
used
inth
ese
regr
essi
ons
ispr
ovid
edin
the
text
unde
rth
ehe
adin
g“B
asel
ine
Reg
ress
ion
Est
imat
es.”
*si
gnifi
cant
at10
perc
ent;
**si
gnifi
cant
at5
perc
ent;
***
sign
ifica
ntat
1pe
rcen
t

80 The Journal of Human Resources
results in that way. Borrowers may elect to forgo the “bid-down” process and receivetheir loan funds at the maximum interest rate they set as soon the loan becomesfully funded. The worry here is that if, for example, black borrowers were morelikely to use this feature and occasionally set maximum interest rates that were highlyattractive to lenders, it might result in higher interest rates for funded black loansthan similar funded white loans, even if the reservation rates of the lenders were thesame for the two groups. To address this concern, Column 2 of Table 5 restricts theanalysis to the 6,419 funded loans that used the “open funding” option that allowsinterest rates to be bid down to the reservation rate of the marginal lender. Theresults are quite similar, and in fact the effect of a black loan increases from 60basis points in Column 1 to 80 basis points for the loans that allow bid down.
C. Net Return on Funded Loans
The preceding analysis reveals that the market discriminates based on informationcontained in pictures and text and that this discrimination leads to disparities ininterest rates on funded loans. Here we ask whether the discrimination we observein the Prosper.com market is efficient for the lenders.
1. Loan-Performance Data25
Prosper provides performance data on all loans that have been made in the market-place. The analysis here is based on the available performance data as of December,2007, at which point the loans made during our sample year ranged in age fromseven months to 19 months. Prosper provides information on payment status of eachloan showing whether the loan was current, paid off, one month late, two monthslate, three months late, four months late or more, and officially defaulted. Table 6shows summary statistics for this performance data, combining defaulted loans withthose that are four months late or more (which exceeds the usual standards forconsidering a loan in default). Among all loans made during the sample year, as ofDecember 2007, 78 percent had been paid off or were in good standing. Approxi-mately 2 percent fell in each of the categories, one month late, two months late, andthree months late. A sizeable fraction (17 percent) of all loans was four months lateor more.
The table breaks down the performance data by the age of the loan. Naturally,the number of loans in good standing is higher for the more recent loans. Forinstance, only 2 percent of the loans made in May, 2007 were four months late ormore in payments as of December, 2007, which is sensible when one considers thatthese borrowers would have had to stop paying by the third month of their loan tofall into this category. The payment characteristics are rather stable, however, forloans that are at least 13 months old, suggesting that most default in the Prospermarket may occur during the first year of the loan. Somewhere between 71 percentand 74 percent of loans were in good standing after 13 months, while payments for20–25 percent of loans were at least four months late.
25. Disclaimer: None of the loans made on Prosper.com have reached full maturity. Because of this, allestimates of loan profitability in this marketplace are only valid subject to the assumptions discussed.
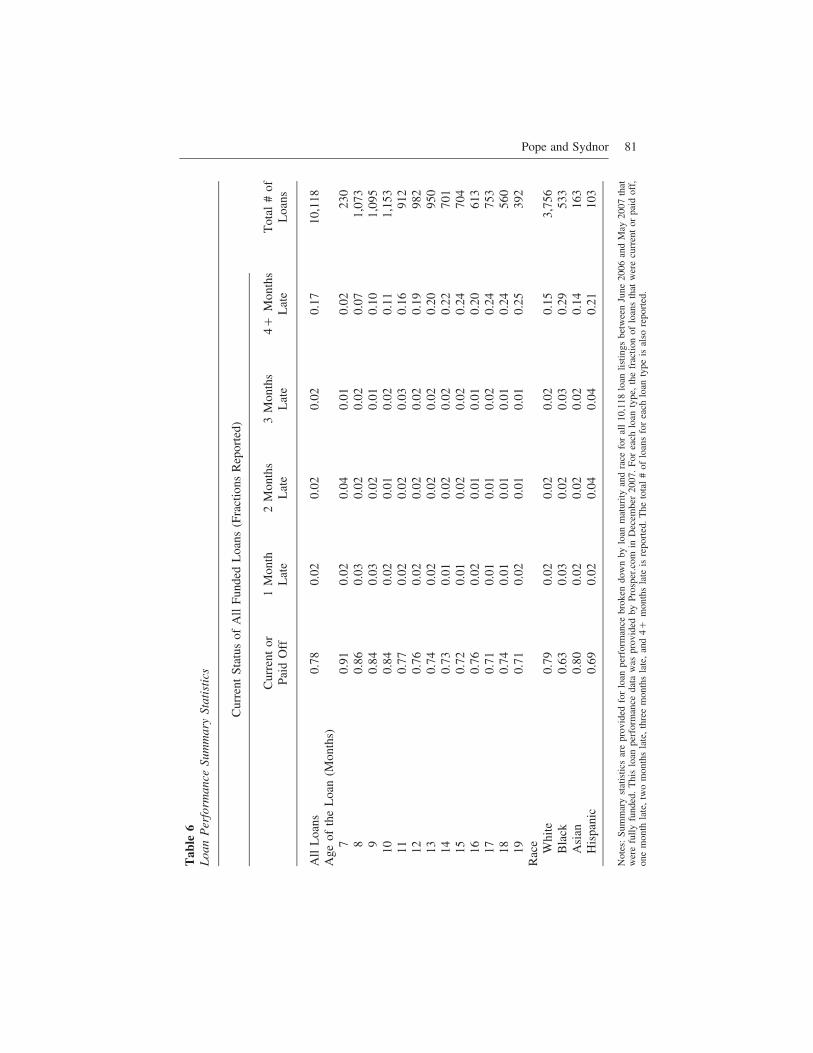
Pope and Sydnor 81
Tab
le6
Loa
nP
erfo
rman
ceSu
mm
ary
Stat
isti
cs
Cur
rent
Stat
usof
All
Fund
edL
oans
(Fra
ctio
nsR
epor
ted)
Cur
rent
orPa
idO
ff1
Mon
thL
ate
2M
onth
sL
ate
3M
onth
sL
ate
4�M
onth
sL
ate
Tot
al#
ofL
oans
All
Loa
ns0.
780.
020.
020.
020.
1710
,118
Age
ofth
eL
oan
(Mon
ths)
70.
910.
020.
040.
010.
0223
08
0.86
0.03
0.02
0.02
0.07
1,07
39
0.84
0.03
0.02
0.01
0.10
1,09
510
0.84
0.02
0.01
0.02
0.11
1,15
311
0.77
0.02
0.02
0.03
0.16
912
120.
760.
020.
020.
020.
1998
213
0.74
0.02
0.02
0.02
0.20
950
140.
730.
010.
020.
020.
2270
115
0.72
0.01
0.02
0.02
0.24
704
160.
760.
020.
010.
010.
2061
317
0.71
0.01
0.01
0.02
0.24
753
180.
740.
010.
010.
010.
2456
019
0.71
0.02
0.01
0.01
0.25
392
Rac
e Whi
te0.
790.
020.
020.
020.
153,
756
Bla
ck0.
630.
030.
020.
030.
2953
3A
sian
0.80
0.02
0.02
0.02
0.14
163
His
pani
c0.
690.
020.
040.
040.
2110
3
Not
es:
Sum
mar
yst
atis
tics
are
prov
ided
for
loan
perf
orm
ance
brok
endo
wn
bylo
anm
atur
ityan
dra
cefo
ral
l10
,118
loan
listin
gsbe
twee
nJu
ne20
06an
dM
ay20
07th
atw
ere
fully
fund
ed.
Thi
slo
anpe
rfor
man
ceda
taw
aspr
ovid
edby
Pros
per.
com
inD
ecem
ber
2007
.Fo
rea
chlo
anty
pe,
the
frac
tion
oflo
ans
that
wer
ecu
rren
tor
paid
off,
one
mon
thla
te,
two
mon
ths
late
,th
ree
mon
ths
late
,an
d4�
mon
ths
late
isre
port
ed.
The
tota
l#
oflo
ans
for
each
loan
type
isal
sore
port
ed.

82 The Journal of Human Resources
Table 6 continues by indicating loan performance information by race. There arelarge differences in default rates across racial groups. Most notably, 29 percent ofloans made to black individuals are four months late or more. In comparison, only14–15 percent of loans made to white or Asian borrowers are four months late ormore. Hispanic default rates fall in between these groups with 21 percent of loansthat are four or more months late. Once again, however, given the correlations thatexist between these groups and other variables (for example credit grades), the sum-mary statistics do not provide conclusive evidence that these groups have higherdefault rates controlling for all of the other information available to lenders.
2. Hazard Model of Default
In order to formally test whether there exist ceteris paribus differences in defaultrates across gender, race, and other groups, we employ a simple hazard model wheredefault is considered to be a nonnegative random variable. We estimate the hazardfunction, , as defined in the analysis of Cox’s proportional hazard model (Cox,�(t)1972). measures the instantaneous failure rate at time t given that the individual�(t)survives until time t. In our model, a “failure” is a loan that goes into default. Forthis model, we define a loan as entering default when the borrower misses threeconsecutive pay cycles (a common assumption in the literature on loan repayment).In this model the baseline hazard rate, , remains unspecified and through the� (t)0
exponential link function, the same covariates and that are used in our baselineX Zi i
regressions in Table 2 act multiplicatively on the hazard rate.The hazard-model estimation results are presented in Column 1 of Table 7. Once
again, the largest and most significant effects that we find in the estimation of thehazard model involve the race variables. Blacks are approximately 36 percent morelikely to default on their loans than are whites with similar characteristics. Thesummary statistics indicated that blacks were twice as likely to default as whites.While the estimate on the black coefficient is smaller after controlling for credit andother variables, it is still statistically significant and obviously economically large.While not statistically significant, Asians and Hispanics are estimated to be 24 per-cent less likely and 10 percent more likely to default than whites, respectively.
Few of the coefficients on the other picture characteristics are statistically signifi-cant. However, the direction of the effects is interesting. The parameter estimatessuggest, for instance, that women are 14 percent more likely to default than men.The difference across age groups is essentially zero. Borrowers that the coders re-corded as appearing unhappy are estimated to be 42 percent more likely to default.The results of being somewhat or very overweight relative to being thin are mixed.Borrowers coded as being very unattractive are estimated to be 32 percent morelikely to default, though not significant and borrowers that indicated signs of militaryinvolvement are estimated to be 49 percent more likely to default.
3. Estimates of Net Return
The default data alone do not tell us about discrimination in this market. Differencesin default rates are necessary for the earlier results to be explained by accuratestatistical discrimination, yet they are not sufficient. In order to answer this question,we need to combine the default rate data with the interest rates that borrowers

Pope and Sydnor 83
actually paid. We begin with a simple graph. Figure 3 presents the fraction of loansdefaulted versus the final interest rate on the loan using linear smoothing.26 It isclear from the graph that at each interest rate, the proportion of black loans defaultingis higher than the proportion of white loans defaulting. Figure 4 adds to the evidencepresented in Figure 3 by illustrating the dynamics of loan performance. We beginby calculating the returns lenders see as an average annual percentage rate (APR)across black and white loans for each month as the loans age. Under the assumptionthat borrowers who are current or less than two months behind will continue tomake payments until loan maturity and that borrowers that are three or more monthsbehind are in default, we graphically demonstrate how the average APR by racedeclines over the maturation of loans as defaults begin occurring. Figure 4a and 4billustrate this by looking at loans for which we have at least 12 and 15 months ofloan-performance data, respectively. As can be seen in each of these figures, blackloans have a higher APR at the beginning (due to the fact that they are required topay higher interest rates on average). As loans mature, however, the higher defaultrate on black loans causes the net return on these loans to fall below the net returnon white loans. In fact, the black default rates are such that by four months the netreturn on black loans is lower than the for white loans, at nine months the net returnon black loans is negative, and at 12 months the average APR on black loans isapproximately �5 percent relative to a 5 percent APR for the average white loan.
While Figures 3 and 4 provide a nice visual representation of loan repayment byrace, it does not allow us to estimate the difference in net return for race whilecontrolling for credit grade and other important variables. In order to do this morerigorous analysis, we begin by calculating the net return over a three-year period ona dollar invested.27 The calculation uses the monthly payment on the loan, andthereby incorporates the interest rate on the loan. We consider three different mea-sures of net return, based on different assumptions about the future repayment ofloans. Each measure assumes that any loan that is in good standing (current or paidoff), in December, 2007 will continue to be paid off throughout the remainder ofthe three-year loan period. This assumption is obviously generous, as some of theloans in good standing will default in the future. Furthermore, assuming that theloans that are paid off earn the full three-year return, is equivalent to assuming thatlenders who are paid early can costlessly find another loan with the same terms.The differences between the return measures come from different assumptions aboutthe repayment stream for loans that were late as of December 2007. Our first netreturn variable, Return Type I, is the most pessimistic about future loan performance;we assume that any loan that is not in good standing (one month or more late) inDecember, 2007 will not produce any future payments. For Return Type II weassume that a loan that is only one month late will eventually pay in full, and for
26. This graph makes use of the lowess command in STATA. For this Figure, we define a loan to be indefault if the borrower has missed three or more consecutive pay cycles.27. In Figure 4, we use APR as the relevant statistic for evaluating the net return on a loan. We are unableto use this measure in the regression analysis due to the fact that APR is undefined when a borrower doesnot make any payments on a loan. Thus, while APR could be used when we were looking at averagesacross a group, we employ the three-year net return on a dollar as the relevant statistic for the individual-level regressions.
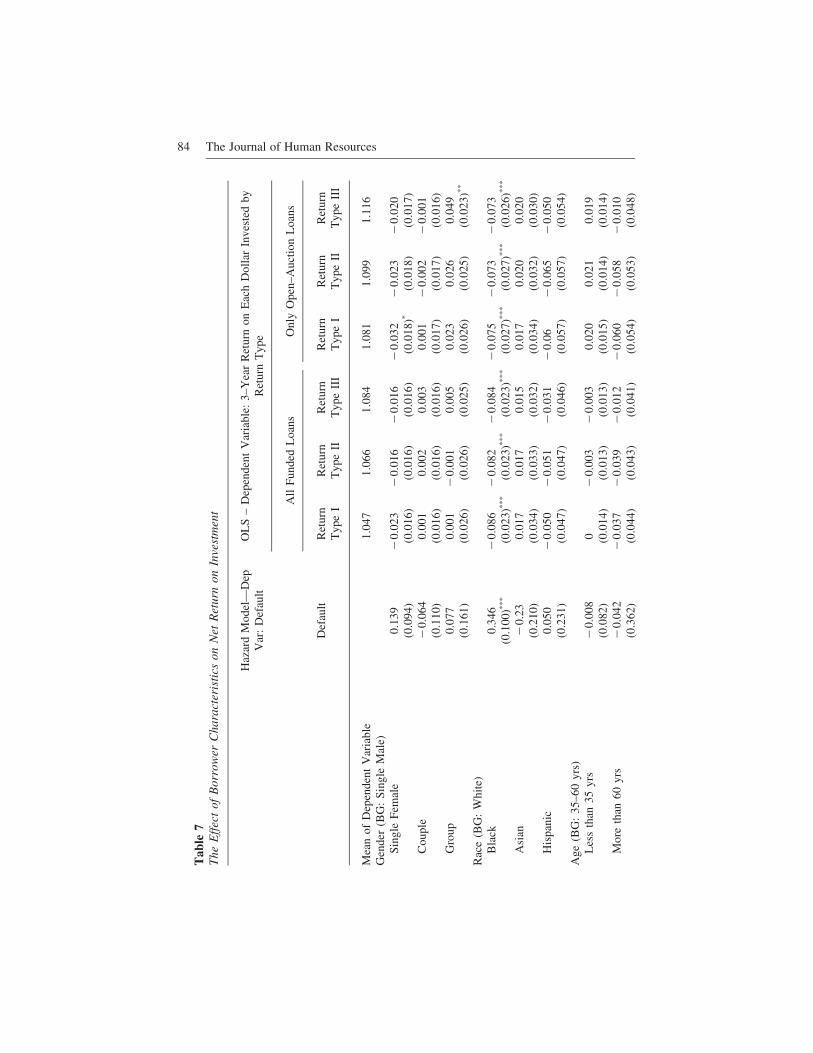
84 The Journal of Human Resources
Tab
le7
The
Eff
ect
ofB
orro
wer
Cha
ract
eris
tics
onN
etR
etur
non
Inve
stm
ent
Haz
ard
Mod
el—
Dep
Var
:D
efau
ltO
LS
–D
epen
dent
Var
iabl
e:3–
Yea
rR
etur
non
Eac
hD
olla
rIn
vest
edby
Ret
urn
Typ
e
All
Fund
edL
oans
Onl
yO
pen–
Auc
tion
Loa
ns
Def
ault
Ret
urn
Typ
eI
Ret
urn
Typ
eII
Ret
urn
Typ
eII
IR
etur
nT
ype
IR
etur
nT
ype
IIR
etur
nT
ype
III
Mea
nof
Dep
ende
ntV
aria
ble
1.04
71.
066
1.08
41.
081
1.09
91.
116
Gen
der
(BG
:Si
ngle
Mal
e)Si
ngle
Fem
ale
0.13
9�
0.02
3�
0.01
6�
0.01
6�
0.03
2�
0.02
3�
0.02
0(0
.094
)(0
.016
)(0
.016
)(0
.016
)(0
.018
)*(0
.018
)(0
.017
)C
oupl
e�
0.06
40.
001
0.00
20.
003
0.00
1�
0.00
2�
0.00
1(0
.110
)(0
.016
)(0
.016
)(0
.016
)(0
.017
)(0
.017
)(0
.016
)G
roup
0.07
70.
001
�0.
001
0.00
50.
023
0.02
60.
049
(0.1
61)
(0.0
26)
(0.0
26)
(0.0
25)
(0.0
26)
(0.0
25)
(0.0
23)**
Rac
e(B
G:
Whi
te)
Bla
ck0.
346
�0.
086
�0.
082
�0.
084
�0.
075
�0.
073
�0.
073
(0.1
00)**
*(0
.023
)***
(0.0
23)**
*(0
.023
)***
(0.0
27)**
*(0
.027
)***
(0.0
26)**
*
Asi
an�
0.23
0.01
70.
017
0.01
50.
017
0.02
00.
020
(0.2
10)
(0.0
34)
(0.0
33)
(0.0
32)
(0.0
34)
(0.0
32)
(0.0
30)
His
pani
c0.
050
�0.
050
�0.
051
�0.
031
�0.
06�
0.06
5�
0.05
0(0
.231
)(0
.047
)(0
.047
)(0
.046
)(0
.057
)(0
.057
)(0
.054
)A
ge(B
G:
35–6
0yr
s)L
ess
than
35yr
s�
0.00
80
�0.
003
�0.
003
0.02
00.
021
0.01
9(0
.082
)(0
.014
)(0
.013
)(0
.013
)(0
.015
)(0
.014
)(0
.014
)M
ore
than
60yr
s�
0.04
2�
0.03
7�
0.03
9�
0.01
2�
0.06
0�
0.05
8�
0.01
0(0
.362
)(0
.044
)(0
.043
)(0
.041
)(0
.054
)(0
.053
)(0
.048
)
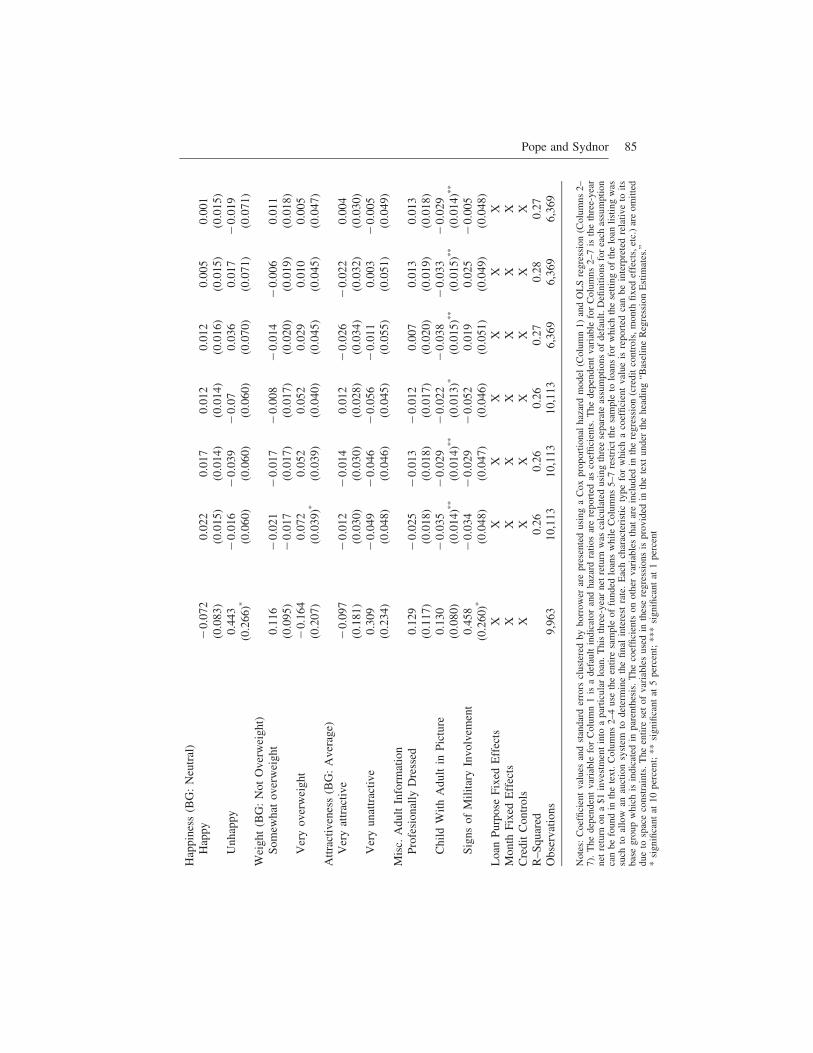
Pope and Sydnor 85
Hap
pine
ss(B
G:
Neu
tral
)H
appy
�0.
072
0.02
20.
017
0.01
20.
012
0.00
50.
001
(0.0
83)
(0.0
15)
(0.0
14)
(0.0
14)
(0.0
16)
(0.0
15)
(0.0
15)
Unh
appy
0.44
3�
0.01
6�
0.03
9�
0.07
0.03
60.
017
�0.
019
(0.2
66)*
(0.0
60)
(0.0
60)
(0.0
60)
(0.0
70)
(0.0
71)
(0.0
71)
Wei
ght
(BG
:N
otO
verw
eigh
t)So
mew
hat
over
wei
ght
0.11
6�
0.02
1�
0.01
7�
0.00
8�
0.01
4�
0.00
60.
011
(0.0
95)
�0.
017
(0.0
17)
(0.0
17)
(0.0
20)
(0.0
19)
(0.0
18)
Ver
yov
erw
eigh
t�
0.16
40.
072
0.05
20.
052
0.02
90.
010
0.00
5(0
.207
)(0
.039
)*(0
.039
)(0
.040
)(0
.045
)(0
.045
)(0
.047
)A
ttrac
tiven
ess
(BG
:A
vera
ge)
Ver
yat
trac
tive
�0.
097
�0.
012
�0.
014
0.01
2�
0.02
6�
0.02
20.
004
(0.1
81)
(0.0
30)
(0.0
30)
(0.0
28)
(0.0
34)
(0.0
32)
(0.0
30)
Ver
yun
attr
activ
e0.
309
�0.
049
�0.
046
�0.
056
�0.
011
0.00
3�
0.00
5(0
.234
)(0
.048
)(0
.046
)(0
.045
)(0
.055
)(0
.051
)(0
.049
)M
isc.
Adu
ltIn
form
atio
nPr
ofes
iona
llyD
ress
ed0.
129
�0.
025
�0.
013
�0.
012
0.00
70.
013
0.01
3(0
.117
)(0
.018
)(0
.018
)(0
.017
)(0
.020
)(0
.019
)(0
.018
)C
hild
With
Adu
ltin
Pict
ure
0.13
0�
0.03
5�
0.02
9�
0.02
2�
0.03
8�
0.03
3�
0.02
9(0
.080
)(0
.014
)**(0
.014
)**(0
.013
)*(0
.015
)**(0
.015
)**(0
.014
)**
Sign
sof
Mili
tary
Invo
lvem
ent
0.45
8�
0.03
4�
0.02
9�
0.05
20.
019
0.02
5�
0.00
5(0
.260
)*(0
.048
)(0
.047
)(0
.046
)(0
.051
)(0
.049
)(0
.048
)L
oan
Purp
ose
Fixe
dE
ffec
tsX
XX
XX
XX
Mon
thFi
xed
Eff
ects
XX
XX
XX
XC
redi
tC
ontr
ols
XX
XX
XX
XR
–Squ
ared
0.26
0.26
0.26
0.27
0.28
0.27
Obs
erva
tions
9,96
310
,113
10,1
1310
,113
6,36
96,
369
6,36
9
Not
es:
Coe
ffici
ent
valu
esan
dst
anda
rder
rors
clus
tere
dby
borr
ower
are
pres
ente
dus
ing
aC
oxpr
opor
tiona
lha
zard
mod
el(C
olum
n1)
and
OL
Sre
gres
sion
(Col
umns
2–7)
.T
hede
pend
ent
vari
able
for
Col
umn
1is
ade
faul
tin
dica
tor
and
haza
rdra
tios
are
repo
rted
asco
effic
ient
s.T
hede
pend
ent
vari
able
for
Col
umns
2–7
isth
eth
ree-
year
net
retu
rnon
a$1
inve
stm
ent
into
apa
rtic
ular
loan
.Thi
sth
ree-
year
net
retu
rnw
asca
lcul
ated
usin
gth
ree
sepa
rate
assu
mpt
ions
ofde
faul
t.D
efini
tions
for
each
assu
mpt
ion
can
befo
und
inth
ete
xt.
Col
umns
2–4
use
the
entir
esa
mpl
eof
fund
edlo
ans
whi
leC
olum
ns5–
7re
stri
ctth
esa
mpl
eto
loan
sfo
rw
hich
the
setti
ngof
the
loan
listin
gw
assu
chto
allo
wan
auct
ion
syst
emto
dete
rmin
eth
efin
alin
tere
stra
te.
Eac
hch
arac
teri
stic
type
for
whi
cha
coef
ficie
ntva
lue
isre
port
edca
nbe
inte
rpre
ted
rela
tive
toits
base
grou
pw
hich
isin
dica
ted
inpa
rent
hesi
s.T
heco
effic
ient
son
othe
rva
riab
les
that
are
incl
uded
inth
ere
gres
sion
(cre
dit
cont
rols
,mon
thfix
edef
fect
s,et
c.)
are
omitt
eddu
eto
spac
eco
nstr
aint
s.T
heen
tire
set
ofva
riab
les
used
inth
ese
regr
essi
ons
ispr
ovid
edin
the
text
unde
rth
ehe
adin
g“B
asel
ine
Reg
ress
ion
Est
imat
es.”
*si
gnifi
cant
at10
perc
ent;
**si
gnifi
cant
at5
perc
ent;
***
sign
ifica
ntat
1pe
rcen
t

86 The Journal of Human Resources
Figure 3Final Interest Rate and Default by RaceNotes: Figure 3 illustrates the relationship between the final interest rate on a loan and the fraction of loanswith that interest rate that have defaulted. Here we define default as a loan that is delinquent three monthsor more. This relationship is illustrated separately for funded loans of borrowers that listed a picture of ablack individual/s and borrowers that listed a picture of a white individual/s. The lines are smoothed usinga locally weighted estimation (lowess) with a bandwith of 0.3.
Return Type III that a loan that is two or fewer months late will eventually pay infull. Hence, these return types are increasingly optimistic in that they assume thatloans that are in good standing as well as loans that are only 1–3 months late willall be paid in full.
Columns 2–4 of Table 7 show the results of OLS regressions of net return on thebaseline covariates that have been used throughout for the full set of funded loans.The top row provides the mean of the net-return variable across all funded loansfor each return type. The average three-year return on a dollar lies between 1.047(Return Type I) and 1.084 (Return Type III). Translating these three-year returnsinto annual percentage rates yields a net APR range of 3.1 percent to 5.3 percent.28
Turning to the regression estimates, as before, we present the estimated coeffi-cients and clustered standard errors for the various picture characteristics. Acrossthe different return types, the only variable that is consistently statistically significantis the black indicator variable. The estimates for the full sample of funded loans
28. It is worth noting that these low average returns may not bode well for the long-run viability of theProsper model. In fact, our return measures are especially generous, because many of the loans in thesample have been out for less than a year.

Pope and Sydnor 87
Figure 4Average APR Adjusted Across Life of the Loans by RaceNotes: This figure illustrates the average APR over the maturation of a loan for funds invested in loanswhose listings included a picture of a white individual/s or a black individual/s. The APR is calculated ateach month by assuming that the loan will be fully repaid if the loan has not gone into default. We definea loan as going into default if it is three or more months overdue. Thus the first data point (that comesprior to the first payment), assumes that all loans will be paid in full and simply illustrates the averageinterest rate paid by black and white borrowers. Each subsequent data point is adjusted given the numberof loans being defaulted by each group. Panel A illustrates the dynamic APR for all loans for which wehave at least 12 months of loan performance data. Panel B illustrates the dynamic APR for all loans forwhich we have at least 15 months of loan performance data. By restricting each panel to loans for whichwe have data over the entire x-axis time period, we are able to graph this relationship without any attrition(each of the points on a line is reflected by the exact same loans).

88 The Journal of Human Resources
suggests that the average net return on investing in a loan from a black borrower is8.2 to 8.6 percentage points lower over a three-year period than investing in a loanfrom an otherwise similar white borrower. This result implies that the increasedpropensity of default for black loans was not fully offset by the one percentage pointincrease in interest rates that black individuals paid. While not significant, the netreturn on Hispanic loans is estimated to be 3.1–5.5 percentage points less than whiteswhile the net return on loans given to Asian borrowers is estimated to be 1.5–1.7percentage points higher than whites.
The estimated coefficients on the other variables are not consistently statisticallysignificant, but the direction of the coefficients may be of interest nonetheless. Theestimated return on loans to single females is approximately two percentage pointsless than for single males. The return for borrowers coded as being unhappy, older,unattractive, professionally dressed, involved in the military, or with a child is lessthan their counterparts. Conversely, the return on borrowers coded as very over-weight is higher than their counterpart.
Columns 5–7 of Table 7 present the same analysis estimated over the sample ofloans that had “open funding,” indicating that the listing remained open after reach-ing funding level, which allows lenders to continue to bid down the interest rate setby the borrower. Although slightly smaller, these estimates show very similar dif-ferences in net returns between whites and blacks, with blacks having net returnsthat are 7.3–7.5 percentage points lower over the course of three years.
Overall, the net-return results do not appear to differ significantly based on thedifferent return-type definitions. Nonetheless, it is worth thinking about how ourestimates might be affected by the assumptions that we use to generate our estimatesof net return. Specifically, is it possible that the strong negative return effect thatwe find for blacks could change once all three years of return data are available?The estimate on the black coefficient would be attenuated if the default rate of whitesbecomes significantly larger than the default rate of blacks after December, 2007.Given the available data, this possibility can never be ruled out. However, the avail-able data do not suggest that this is the case. In fact, if anything, loans given toblack borrowers are defaulting at a higher rate after the loan has matured for a yearor longer; indicating that we might be underestimating the overall effect of race onnet returns. Furthermore, defaults that occur later are less costly to lenders becausemore of the principle has been repaid. Hence, the difference in default rates as loansmature would have to change dramatically to erase the coefficient that we estimatefor the black indicator variable.29
Another potential concern with the results—one that arises in many studies ofdefault—is that an unanticipated economic shock that hit blacks harder than whitescould affect the results. That is, lenders might have charged interest rates for eachgroup that equalized net returns ex ante but turned out to wrong ex post. While itis difficult to rule out this possibility, two different cuts of the data suggest thatdifferential economic shocks are unlikely to explain the differences in average net
29. As an example of how dramatic the change in trends in default rates would have to be, if we assumethat the total percentage of people defaulting each month continues to be the same over the life of theloans, we estimate that whites would have to immediately begin defaulting at three times the rate of blacksin order to close the gap in net returns.

Pope and Sydnor 89
returns. First, we divide the sample into those funded during the first six monthsand second six months of our one-year sample. If unanticipated economic shocksare the source of the net-return differences, we would not expect the results to bethe same across periods. Although this cut causes us to lose power and is compli-cated by the different time horizons for default in the split samples, we find noevidence of differences in the net return results for the two samples. As a secondapproach to addressing the possibility of differential economic shocks, we exploitthe state identifier on listings to control for changes in the economic environmentthat occur during the repayment process. To do this, we obtain 2006 and 2007unemployment rates by state and race from the Local Area Unemployment Statistics(LAUS) prepared by the BLS. We reestimate Columns 2–4 of Table 7 including aninteraction term between race and the black-white difference in the unemployment-rate change between 2006 and 2007. After controlling for these changes in economicconditions that may differential affect racial groups, we find estimates for each returntype (�0.074, �0.082, and �0.084) that continue to be statistically significant(p � 0.01 for each return type) and are similar to the estimates found in Table 7.
V. Discussion and Conclusions
We have shown that the characteristics borrowers display throughtheir pictures and descriptions strongly affect their access to credit in the Prospermarket. Specifically, we find significant discrimination against listings without apicture and listings with pictures of blacks, older individuals, and people who appearunhappy. In contrast, there is discrimination in favor of listings with pictures ofwomen and pictures that show signs of military involvement.
If this discrimination was solely the result of costly taste-based preferences, wewould expect a negative correlation between the discrimination in funding and sub-sequent net returns on funded loans. Accurate statistical discrimination, on the otherhand, should result in no significant differences in net returns. The results for blackloans run counter to the predictions of both taste-based animus against blacks andaccurate statistical discrimination. Despite the fact that blacks are less likely to havetheir loans funded, the return results would suggest some form of prejudice in favorof blacks. That is, although blacks pay higher interest rates, those rates are not highenough to account for the higher probability of default that we find for black loansafter controlling for other observable characteristics.
How can we interpret these findings? First, we note that clearly skin color is nota causal factor in loan default. Higher default rates for blacks must stem from somedifference in the background and financial characteristics of these borrowers that isnot fully reflected in the standard financial measures (for example, credit score, DTI)that lenders can observe. There are a number of well-known candidates for importantcharacteristics that are not (perfectly) observed by lenders: for example, incomedisparities (perhaps stemming from labor-market discrimination), education differ-entials, and more limited access to financial support from family and friends.30 What-
30. One example that we can test comes from the credit score. Prosper only provides credit-score grades
90 The Journal of Human Resources
ever the relevant differences, the discrimination in the decision to lend suggests thatthe market understands the direction of this correlation between unobservables andthe race in a borrower’s picture. Yet the interest-rate penalty these borrowers payin the market is not enough to account for their higher rate of default.
One explanation for these results could be a combination of accurate statisticaldiscrimination against blacks (based on their greater likelihood of default conditionalon other observables) that is partially offset by taste-based discrimination againstwhites (in favor of blacks). That is, the market might accurately assess the defaultprobability of loans on average, but lenders might have a taste for lending to blacksover whites and that makes them willing to accept a lower return from these loans.If true, this finding in peer-to-peer lending is quite novel, as to our knowledge theprevious literature on discrimination has never found evidence of taste-based dis-crimination that favored blacks over whites.
Another potential explanation of the results is that while lenders understand thedirection of the correlations between race and relevant unobservable characteristics,they fail to appreciate the strength of these correlations or the importance of unob-servable characteristics on default. Although it seems intuitively plausible, this ex-planation implies that biased beliefs exist at the market level. We might expect thesetypes of mistaken beliefs to be driven out of the market in a long-run equilibrium,and perhaps the evidence here is simply consistent with a market that is still evolv-ing. Yet it is important to note that in this case, we are finding that a market withan efficient auction mechanism, real stakes, and large amounts of available data onperformance is still not at its long-run equilibrium two-years out. In fact our splitsof the data reveal little change in the discrimination against blacks between the firsthalf and second half of our sample.
The results here also have implications for the broader literature on assessingtheories of discrimination. Had we found that blacks have higher net returns, it wouldhave been natural to conclude that the evidence was consistent with taste-basedpreferences against blacks. Having instead found the opposite, however, we are facedwith the somewhat awkward conclusion that the evidence is consistent with partialtaste-based discrimination in favor of blacks over whites. The alternative, whichseems somewhat natural in this setting, is to conclude that decision-makers haveinaccurate beliefs. The problem, of course, is that once one allows for the possibilityof inaccurate beliefs, results from other studies that find evidence of taste-based oraccurate statistical discrimination come into question. Thus, the results from thisstudy suggest caution when interpreting evidence in favor of one theory of discrim-ination versus another.
The findings in this paper also highlight the importance of attempting to assessthe efficiency of discrimination before reaching conclusions about sources of dis-crimination. We find racial discrimination in lending decisions despite the wealth ofcredit controls available to lenders, and it might be natural to conclude that suchevidence is suggestive of taste-based animus against blacks. Yet the data tell a very
to the lenders and it is possible that within a credit grade credit score is correlated with being black.Although lenders do not see the credit score, Prosper provided us with this information. Perhaps surpris-ingly, however, we find that being black is not correlated with credit scores within a credit grade whenother variables are controlled for, and thus cannot explain the net-return differences.

Pope and Sydnor 91
different story that suggests that this peer-to-peer lending market actually treats theraces more equally than would be expected in a market with accurate statisticaldiscrimination.
References
Aigner, Dennis, and Glen Cain. 1977. “Statistical Theories of Discrimination in LaborMarkets.” Industrial and Labor Relations Review 30(4):1975–87.
Altonji, Joseph, and Rebecca Blank. 1999. “Race and Gender in the Labor Market.” InHandbook of Labor Economics, ed. Ashenfelter Orley and David Card, 3143–3259.
Altonji, Joseph, and Charles Pierret. 2001. “Employer Learning and StatisticalDiscrimination.” Quarterly Journal of Economics 116(1):313–50.
Antonovics, Kate, and Brian Knight. 2004. “A New Look at Racial Profiling: Evidencefrom the Boston Police Department.” NBER Working Paper #10634.
Arrow, Kenneth. 1973. “The Theory of Discrimination.” In Discrimination in LaborMarkets, ed. Ashenfelter Orley and Albert Rees. Princeton: Princeton University Press.
Ayres, Ian, and Peter Siegelman. 1995. “Race and Gender Discrimination in Bargaining.”American Economic Review 85(1):304–21.
Rebecca Blank, Marilyn Dabady, and Constance Citro, eds. 2004. Measuring RacialDiscrimination Washington, D.C.: National Academies Press.
Becker, Gary. 1957. The Economics of Discrimination Chicago: University of ChicagoPress.
Bertrand, Marianne, and Sendhil Mullainathan. 2004. “Are Emily and Brendan MoreEmployable than Latoya and Tyrone? Evidence on Racial Discrimination in the LaborMarket from a Large Randomized Experiment.” American Economic Review 94(4):991–1013.
Charles, Kerwin, and Jonathan Guryan. 2007. “Prejudice and the Economics ofDiscrimination.” NBER Working Paper #13661.
Cox, David. 1972. “Regression Models and Life Tables (with Discussion).” Journal of theRoyal Statistical Society, Series B 34:187–220.
Freedman, Seth, and Ginger Jin. 2008. “ Dynamic Learning and Selection: the Early Yearsof Prosper.com.” Unpublished.
Galster, George. 1996. “Comparing Loan Performance Between Races as a Test forDiscrimination.” Cityscape 2(1):33–39.
Heckman, James. 1998. “Detecting Discrimination.” Journal of Economic Perspectives12(1):101–16.
Imbens, Guido. 2004. “Nonparametric Estimation of Average Treatment Effects UnderExogeneity: A Review.” Review of Economics and Statistics 86(4):4–29.
Knowles, John, Nicola Persico, and Petra Todd. 2001. “Racial Bias in Motor VehicleSearches: Theory and Evidence.” Journal of Political Economy 109(1):203–32.
Levitt, Steven. 2004. “Testing Theories of Discrimination: Evidence from Weakest Link.”Journal of Law and Economics 47(2):431.
Lundberg, Shelly, and Richard Starz. 1983. “Private Discrimination and Social Interventionin Competitive Labor Markets.” American Economic Review 73(2):340–47.
Munnell, Alicia, Geoffrey Tootell, Lynne Browne, and James McEneaney. 1996. “MortgageLending in Boston: Interpreting HMDA Data.” American Economic Review 86(1):25–53.
Phelps, Edmund. 1972. “The Statistical Theory of Racism and Sexism.” AmericanEconomic Review 62(4):659–61.
Quigley, John. 1996. “Mortgage Performance and Housing Market Discrimination.”Cityscape 2(1):59–64.

92 The Journal of Human Resources
Ravina, Enrichetta. 2008. “ Love & Loans: The Effect of Beauty and PersonalCharacteristics in Credit Markets.” Unpublished.
Rosenbaum, Paul, and Donald Rubin. 1985. “Constructing a Control Group UsingMultivariate Matched Sampling Methods that Incorporate the Propensity Score.” TheAmerican Statistician 39: 33–38.
Ross, Stephen. 1996. “Flaws in the Use of Loan Defaults to Test for Mortgage LendingDiscrimination.” Cityscape 2(1):41–48.
———. 1997. “Mortgage Lending Discrimination and Racial Differences in Loan Default:A Simulation Approach.” Journal of Housing Research 8(2):277–97.
Ross, Stephen, and John Yinger. 2002. The Color of Credit: Mortgage Discrimination,Research Methodology, and Fair-Lending Enforcement Cambridge: MIT Press.
Tootell, Geoffrey. 1996. “Redlining in Boston: Do Mortgage Lenders Discriminate AgainstNeighborhoods?” Quarterly Journal of Economics 111(4):1049–79.
Turner, M.A., R. Struyk, and J. Yinger. Housing Discrimination in America: Summary ofFindings from the Housing Discrimination Study Washington, D.C.: Urban Institute Press,1991.
Turner, Margery, Stephen Ross, George Galster, and John Yinger. 2002. Discrimination inMetropolitan Housing Markets: National Results from Phase 1 of HDS2000 Washington,D.C.: U.S. Department of Housing and Urban Development.
Yinger, John. 1996. “Why Default Rates Cannot Shed Light on Mortgage Discrimination.”Why Default Rates Cannot Shed Light on Mortgage Discrimination 2(1):25–31.