wheat - aegic
TRANSCRIPT
AEGIC | Wheat 2030 1
WHEAT2030August 2020
AEGIC – Economics and Market Insights TeamPRIMARY AUTHORS: Chris Carter and Sean Cowman
Anticipated trends in global
consumption
AEGIC is an initiative of the Western Australian State Government and Grains Research & Development Corporation
Department ofPrimary Industries andRegional Development
WHRP20000EN

AEGIC | Wheat 2030 2
Introduction
This report presents a set of baseline projections of international wheat consumption, based on anticipated trends from analysis of historical data. The baseline projections presented here assume that the status quo in world markets prior to 2020 will continue. However, we know that the status quo is unlikely to be maintained as markets continually adapt to changing, and at times, unpredictable external circumstances. Nevertheless, baseline projections are useful because they help identify what needs to occur for projections to hold. It becomes clearer what the risks and disruptions to Australia’s wheat exports may be if the status quo changes.
From the presented analyses we have extracted a set of recommendations with the intent to stimulate discussion and action within the Australian wheat industry. The recommendations touch on the opportunities to embrace, and potentially, directions to proceed.
As always, we appreciate any feedback.

AEGIC | Wheat 2030 3
Contents
Recommendations 5Primary recommendations 5
Recommendations by region 6
Key messages 9Global trade 10Global usage 12Regional consumption patterns 14
Key regions 15
Key countries 18
Australian wheat supply 23Production 23
Wheat usage 24
Wheat quality 27
Appendix 1 – Global regions 31Appendix 2 – Product segments 32Appendix 3 – Maps 33Further reading 34

AEGIC | Wheat 20304

AEGIC | Wheat 2030 5
RecommendationsPrimary recommendationsCreate an Australian wheat quality classification system that meets the increasingly divergent needs of the domestic and export markets.
Production and consumption trends indicate a shift in the locus of Australian wheat exports towards Western and South Australia. Conversely in other states, their increasing focus will be on supplying food and feed markets within Australia.
ACTION 1: Design an increasingly flexible classification system that caters for differences between domestic and export market requirements.
Australian growers should continue to supply versatile wheat that performs well in multiple applications.
Over the next decade the bulk of Australian wheat must be functionally flexible, and support use in multiple products within multiple markets. While Australian wheat is currently well regarded for noodle applications, the growth in bread products within international markets provides ongoing opportunity. Flexibility to meet quality requirements for multiple products is especially valuable in high wheat production years. This flexibility must be embedded and visible through improvement in the consistency and transparency of the classification and grading systems.
ACTION 2: Maintain engagement to understand customers’ current and future needs in the different markets that use Australian wheat for a range of applications.
ACTION 3: Integrate new information on customers’ wheat quality requirements into classification standards.
Stimulate demand for Australian wheat in South East Asian noodles.
Australian industry to reinforce the inherent quality, functionality and value proposition of Australian wheat when making noodles. Demand could be stimulated though targeted interactions across the value chain in major noodle markets of Indonesia, Vietnam, Thailand, Malaysia and potentially the Philippines.
ACTION 4: Promote and demonstrate the quality and value of Australian wheat in the manufacture of noodles, particularly to consumers to stimulate pull through demand.
Support demand for specialist Australian wheat in key markets.
Australia has strong capacity to develop varieties with specialised characteristics to meet particular end product requirements e.g. udon noodles, biscuit wheat varieties. This advantage should be leveraged to target product segments with these specialised functionalities that can be supplied profitably by Australian farmers.
ACTION 5: Identify emerging opportunities and viable path-to-market value chains for specialist Australian wheat.

AEGIC | Wheat 20306
Recommendations by region
South East AsiaIndonesia
• Re-establish recognition among Indonesian noodle makers of the quality and value proposition of Australian wheat over other origins of wheat.
• Maintain relationships with milling companies to better understand their quality and food safety requirements when servicing the SME segment.
• Interact with customers and conduct research and development that increases their use of Australian soft and soft-type wheats. This could include the development of new ‘true’ soft varieties and/or utilising existing classes and grades in new ways e.g. alternatives to USA Soft Western White in cake and biscuits product segments.
• The opportunity for Australia within the growing bread market is likely to occur as a blend or differentiated component within the smaller, branded product channels, away from industrial pan breads.
• Understand Indonesia-Australia Comprehensive Economic Partnership Agreement (IA-CEPA) opportunities for increasing the utilisation of wheat as feed. This will require development of stronger relationships through in-market technical support and/or training packages for users.
Philippines
• Maintain engagement through continued presence in this strategically important market for Australian ASW and low protein wheat in both food and animal feed applications. This will also serve to monitor where Australia can effectively increase participation within the lucrative bread market.
• Increased noodle consumption is an opportunity for Australian wheat. Seek to capture market share through improved reliability of supply and service provision.
• Improve service provision though opportunistically leveraging bulk shipments to the region to maximise bulk freight cost efficiencies. This could include building on base bulk shipment of ASW and include parcels of APH, AH and APW wheat and better satisfy the interests of the Philippines flour mills and buying groups.
• Australia could tailor its technical education to the needs of the Philippines feed manufacturing industry as it undergoes centralisation and growth.
• Leverage the reputation for safety and cleanliness of Australian wheat within the Philippines feed industry, compared to domestic corn.
Vietnam
• As a high priority, preserve the unique relationship with the Vietnamese market that values Australian wheat in a variety of applications from baking to noodle production.
• Continue to monitor opportunities that arise in both food and feed industries e.g. Vietnam’s strict phytosanitary and quarantine requirements currently support Australian supply prospects against USA, Canada, and Black Sea.

AEGIC | Wheat 2030 7
North Asia• The Australian grains industry must continue to support and protect the unique opportunity
that it has in the supply of noodle wheat to Japan and South Korea. Japan holds a unique value proposition for Australian wheat exports, or more specifically Western Australian exports, as the only supplier of wheat into the udon noodle market. The USA grains industry is working to develop wheat varieties which offer similar quality characteristics.
China
• There may be opportunity for increased export to China because of 2019 WTO rulings encouraging China to increase their intake of wheat against their obligation to import 9.6mmt. The quota is rarely fully subscribed and represents an opportunity to increase trade into this market, noting the need to comply with requirements as per the ‘Plant Quarantine Protocol’ (GIMAF, 2014).
• Australian participation in the supply of wheat to China remains important. China has, and will continue to have, a diverse range of quality requirements that are well suited to the Australian offering. This includes specialised opportunities such as premium salted noodles and whole grain applications.
Middle East and North Africa (MENA)• It is important for Australia to maintain a presence and relationship in the region given the
growing diversity of the MENA wheat demand. This can include government to government, industry, and trade relationships. On a practical level, the Australian industry should maintain relevant registrations for Government tenders, understand the markets, ensure key markets and users are kept abreast of Australian wheat capabilities, and provide support and training to new millers.
Sub-Saharan Africa• Maintain relationships and understanding of the required quality to access the spot
opportunities where and when they arise. In general, investment in long term technical collaboration is unlikely to result in significant return.
South Asia• Maintain awareness of shortfalls in domestic production that provide an opportunity for
Australian wheat, which is similar to white wheat produced in India. Australian wheat remains well suited to production of the flat breads popular in the region.

AEGIC | Wheat 20308

Global trade• Grain originating from Black Sea and Baltic Sea ports will increasingly dominate world wheat
trade.
• MENA will have the strongest growth in wheat imports towards 2030, mostly for food.
• Growth in South East Asian (SEA) wheat demand is slowing but remains important for food and feed.
• Sub-Saharan Africa and South Asia food wheat imports will be increasingly serviced by lowest cost supply, though will increasingly and substantially become opportunistic markets for Australian wheat.
Global usage• Wheat will remain a significant component of the world’s daily food intake.
• In the longer term, income effects will increase consumption of both basic and complex foods1, and include stronger growth in demand for feed wheat.
• Imports for use in the food industry will grow from 92mmt to 116mmt.
• Feed usage is expected to increase by 8.6 mmt (from 17.1mmt to 25.7mmt).
Product segment• For Australia, growth in the noodle segment in SEA presents volume and quality opportunities.
• Bread production – including middle eastern flatbreads and pan breads – will remain the largest single use of wheat, and is expected to grow by 16.1mmt, the largest global growth sector.
• Wheat used for noodles or cakes and biscuits will grow by 2 and 3mmt respectively.
Importing regions2
• SEA: Growing populations, increasing incomes and urbanisation will drive growth in wheat imports for food and feed.
• MENA: Growth in wheat imports will be largely for food due to growing populations. Australian wheat sales will mostly be opportunistic, along with continuing to supply some captive markets.
• North Asia (excluding China): Wheat import demand from North Asia will remain flat due to limited population growth and government self-sufficiency programs.
• Sub-Saharan Africa: Growth in wheat use is mainly in food and driven by population growth. It is a growing market and should be considered an opportunistic market for Australia.
• South Asia: Growth in food demand for wheat is projected to be more than double any other region and mostly will be serviced by domestic production. However, monsoon failure could provide a substantial market opportunity for Australian wheat.
Australian Supply• Australian consumption will increasingly be focused on the eastern coast.
• While feed is the main driver of continued growth in Australian consumption, the domestic milling needs, primarily for bread products, continue to remain important. Consumers are becoming more discerning of quality and health attributes, resulting in increased diversity in demand for bread styles.
Key messages
1 Blog: An old truth rediscovered2 See Appendix 1 for detail on the global regions and countries within those regions, used within this document.
AEGIC | Wheat 2030 9

AEGIC | Wheat 203010
Figure 1 Wheat production in major exporting nations projected to 2030 Source: OECD
Global trade• Grain originating from Black Sea and Baltic Sea ports will increasingly dominate world wheat
trade.
• MENA3 will have the strongest growth in wheat imports towards 2030, mostly for food.
• Growth in SEA wheat demand is slowing but remains important for food and feed.
• Sub-Saharan Africa and South Asia food wheat imports will be increasingly serviced by lowest cost supply, though will increasingly and substantially become opportunistic markets for Australian wheat.
Supply of wheat from the Black Sea and Baltic Sea will continue to growOf the major exporting nations, production in Russia is expected to grow most markedly4. Production in Ukraine5 is also expected to increase through further productivity gain (Figure 1).
The volume of wheat traded in international markets is expected to grow from 185mmt in 2019 to 229mmt in 2030. Of this volume, approximately 70% is exported from six countries: Russia, Ukraine, Canada, USA, Argentina6 and Australia.
Major changes to 2030 include a significant projected increase in share and volume of global exports by Ukraine, Russia, and Argentina. The USA, Australia7 and Canada are losing market share, although increasing in total volume8.
Other countries likely to increase export volumes significantly by 2030 include Eastern European countries (Romania, Serbia, Bulgaria) who can export via the Black Sea ports, and Kazakhstan who can only access Black Sea ports through Russia. While the European Union figures strongly as a wheat exporter, much of the volume is intra-EU trade (Figure 2).
3 See Appendix 1 for detail on the global regions and countries within those regions, used within this document.4 Russia’s wheat industry: Implications for Australia5 Ukraine: An emerging challenge for Australia’s wheat exports6 Argentina’s grains industry: Implications for Australia7 Blog: Slip sliding away, a wakeup call8 See Appendix 4 for maps showing changes in export volume towards 2030
0
20
40
60
80
100
120
140
160
Annu
al p
rodu
ctio
n (m
mt)
Forecast Russia Canada ArgentinaUnited States Australia Ukraine European Union
2000
2001
2002
2003
2004
2005
2006
2007
2008
2009
2010
2011
2012
2013
2014
2015
2016
2017
2018
2019
2020
2021
2022
2023
2024
2025
2026
2027
2028

AEGIC | Wheat 2030 11
Figure 3 Growth in imports by major importers, grouped by regionsSource: USDA
Figure 2 Average volume of wheat exported by major players in 2014-2018 and expectations for 2026-2028. Source: USDA, OECD 2020
Comparing import growth of the top 40 international wheat markets, when grouped by region (see Appendix 1), the MENA market displays the strongest growth in wheat imports, and this is likely to continue towards 2030 (Figure 3). The price sensitive MENA markets are likely to source their grain needs from the nearby grain exporting Black Sea region. SEA is growing at a rate of 4% per annum, with stable growth since the mid 2000s.
Africa and South Asia food wheat imports will be increasingly serviced by lowest cost supply, which is likely to be from the Black Sea, Baltic Sea and Argentina. Both these markets will increasingly and substantially become opportunistic markets for Australian wheat. Disruption to the supply and demand dynamic can represent significant opportunities for Australian wheat e.g. India in 2016 and 2017. Additionally, in years where Australia has a large export surplus, these markets represent large consumptive outlets. It is important for Australia to maintain an understanding of, interaction with, and access into these strategically important markets.
North Asian markets are not likely to grow significantly, with consumption in most key market sectors flattening or declining. The South Korean feed market is the only sector showing potential growth.
Within the greater Chinese market, the Chinese government maintains a 9.6mmt import quota, of which approximately 40% is honoured (2011-2019). This does represent some opportunity, especially for ASW wheat which continues to be highly regarded, although it is an opportunistic market9.
9 See Appendix 4, for maps of likely demand in 2030
Impo
rts
(mm
t)
Forecast China MENA North AsiaSouth Asia South East Asia Other Africa Oceania
2000
2001
2002
2003
2004
2005
2006
2007
2008
2009
2010
2011
2012
2013
2014
2015
2016
2017
2018
2019
2020
2021
2022
2023
2024
2025
2026
2027
2028
0
10
20
30
40
50
60
Expo
rt v
olum
e (m
mt)
0Argentina Australia Canada Russia Ukraine United States European
UnionOther
2008 – 2010 2017 – 2019 2026 – 2028
5
10
15
20
25
30
35
40
45
AEGIC | Wheat 203012
Global usage• Wheat will remain a significant component of the world’s daily food intake.
• Imports for use in the food industry will grow from 92mmt to 116mmt.
• In the longer term, income effects will increase consumption of both basic and complex foods10, and include stronger growth in demand for feed wheat.
• Wheat used for bread will grow by 16.1mmt , the highest usage. Wheat used for noodles or cakes and biscuits will grow by 2 and 3mmt respectively.
• Feed usage is expected to increase by 8.6 mmt (from 17.1mmt to 25.7mmt).
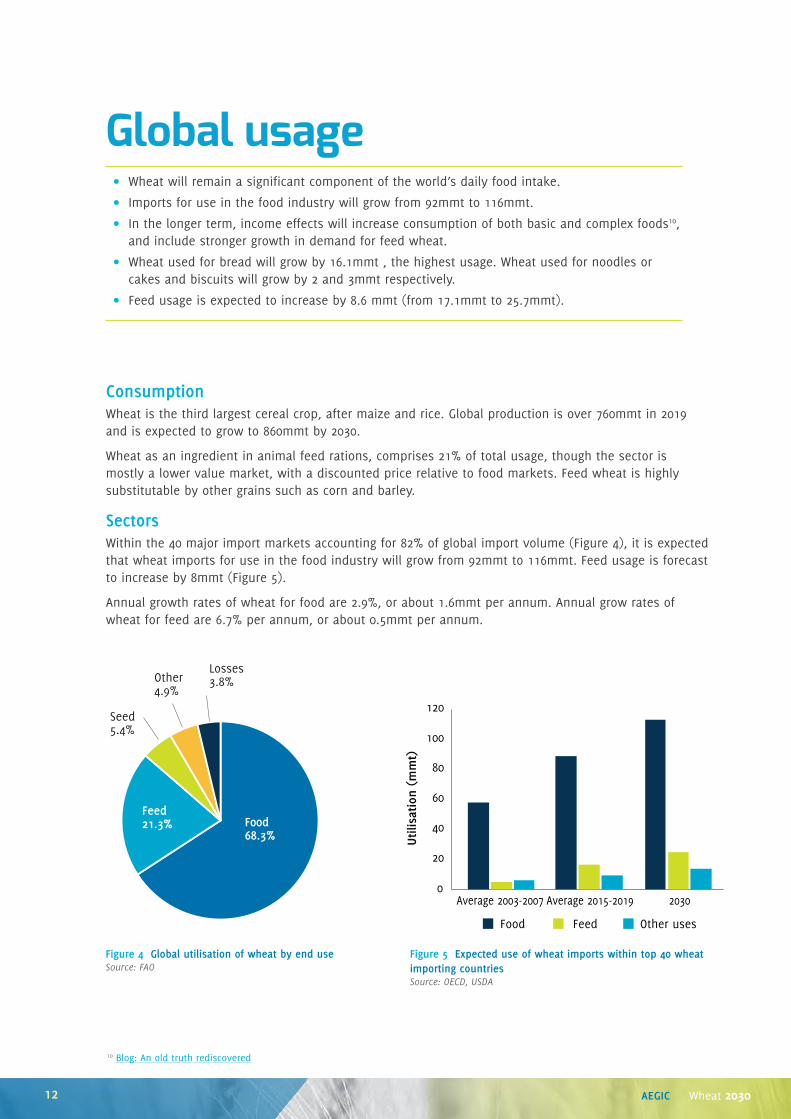
ConsumptionWheat is the third largest cereal crop, after maize and rice. Global production is over 760mmt in 2019 and is expected to grow to 860mmt by 2030.
Wheat as an ingredient in animal feed rations, comprises 21% of total usage, though the sector is mostly a lower value market, with a discounted price relative to food markets. Feed wheat is highly substitutable by other grains such as corn and barley.
SectorsWithin the 40 major import markets accounting for 82% of global import volume (Figure 4), it is expected that wheat imports for use in the food industry will grow from 92mmt to 116mmt. Feed usage is forecast to increase by 8mmt (Figure 5).
Annual growth rates of wheat for food are 2.9%, or about 1.6mmt per annum. Annual grow rates of wheat for feed are 6.7% per annum, or about 0.5mmt per annum.
Feed21.3% F00d
68.3%
Seed5.4%
Other4.9%
Losses3.8%
Figure 4 Global utilisation of wheat by end use Source: FAO
Figure 5 Expected use of wheat imports within top 40 wheat importing countries Source: OECD, USDA
10 Blog: An old truth rediscovered
Utilis
atio
n (m
mt)
0
Food Feed Other uses
Average 2003-2007 Average 2015-2019 2030
20
40
60
80
100
120

AEGIC | Wheat 2030 13
FoodBread will remain the largest wheat product segment
Bread will remain as the product segment11 that uses most wheat (Figure 6). Expected growth in this segment will cause an increase in wheat consumption of 16.1mmt. Cakes, biscuits and sweets are growing segments with an additional 3.0mmt expected to be used for these products. This trend could moderate due to COVID-19 impacts on incomes12 and the likely shift towards consumption of staple foods. Total growth in instant and other noodles (including pasta) is expected be ~2.0mmt.
FeedWith increasing volumes of wheat production, surplus volumes of grain with insufficient quality to be used in food markets will compete in international feed grain markets13 14. Feed markets show strong growth towards 2030, with consumption of fish tipped to increase beyond 200mmt. While fish consumption currently includes wild catch – which does not utilise feed grain – FAO project that the aquaculture industry will supply all additional demand for fish towards 203015. Consumption of poultry and pig meat will grow by 12.5% to reach 270mmt.
Corn is a major feed grain and a standard inclusion in many livestock diets. Wheat only forms a portion of the feed market. Feed markets are highly competitive. Prices for feed wheat (e.g. HRW, Black Sea Feed) are often below those used for human food production by more than $30USD/t.
Figure 6 Expected current and future uses of wheat in food products for the top 40 wheat importing countriesSource: AEGIC, World Bank 2020, Euromonitor 2019
Figure 7 Global meat consumption 2000-2030 Source: OECD-FAO 2019
Whe
at u
sage
(m
mt)
5.9
6.7
9.0
10.2
63.5
79.6
14.1
17.1
3.4
2.9
0 20 40 60 80 100 120 140
2019
2030
Instant noodles
Other noodles
Breads
Cakes and biscuits
Retail
Cons
umpt
ion
(mm
t)
2000 2005 2010 2015 2020 2025 2030
Beef and veal Pig meat Poultry meat Sheep meat Fish
0
50
100
150
200
250
11 See Appendix 2 for information on the product segments12 Novel coronavirus: potential impacts on Australia’s grain producers13 Blog: The global taste for meat and fish14 Blog: The meat in our sandwich15 The state of world fisheries and aquaculture 2020

AEGIC | Wheat 203014
Regional consumption patterns• SEA16 Growing populations, increasing incomes and urbanisation will drive growth in wheat
imports for food and feed. Growth in the noodle segment in SEA presents volume and quality opportunities or Australia.
• MENA Growth in wheat imports will be mostly for food due to growing populations. Australian wheat
sales will mostly be opportunistic, along with continuing to supply some captive markets.
• North Asia (excluding China) Wheat import demand from North Asia will remain flat due to limited population growth and
government self-sufficiency programs.
• Sub-Saharan Africa Growth in wheat use is mainly in food and driven by population growth. It is a growing market
and should be considered an opportunistic market for Australia.
• South Asia Growth in food demand for wheat is projected to be more than double any other region
and mostly is serviced by domestic production. However, monsoon failure could provide a substantial market opportunity for Australian wheat.
Wheat consumption is growing in most global regions (Figure 8). The increase in consumption is mostly a function of growth in population and income, and urbanisation. Government policies also can affect demand and supply of wheat.
Within this section we have focused on the regions and countries that are destinations for the bulk of Australian wheat exports.
Figure 8 Forecast growth in food and feed use of wheat by region from 2020 to 2028
(mm
t)
Feed growth Food growth
4.9
0.5 0.61.9
2.5
0.31.0
3.8
-0.1
9.8
2.5 2.5
China MENA North Asia South Asia South EastAsia
Other Africa-2
0
2
4
6
8
10
12
16 See Appendix 1 for detail on the global regions and countries within those regions, used within this document

AEGIC | Wheat 2030 15
Key regionsSouth East Asia Indonesia, Malaysia, Myanmar, Philippines, Singapore,
Thailand, Vietnam
• Consumption growth in noodles will support increased imports of Australian wheat.
• Consumption growth for bread, and cakes and biscuits, provide additional market opportunities for Australian wheat if suitable quality can be provided.
• Strong growth in demand for feed wheat provides an opportunity for Australian wheat but these markets are hotly contested and impacted by local government policy.
Food and feed forecast• Growth in both the food and feed
markets is occurring in SEA.
• The variance in feed use is much greater than food use. Given the strong growth in feed use over the last decade, growth in use of feed wheat may outstrip forecast demand. However, demand is often strongly influenced by government policy.
Wheat imports by origin• Drought conditions in Australia
that caused short supply have provided opportunity for Black Sea and Argentinian wheat to develop a strong footprint in the market, mostly in mid protein segment.
• Towards 2030 Australia’s market share is expected to erode, despite increasing volumes.
Change in utilisation• Bread will lead growth to 2030. Increasing incomes and urbanisation will support this demand.
• Wheat use for noodles, and cake and biscuits, is expected to grow by 0.9 and 1.1mmt respectively. The annual growth rate for cakes and biscuits is twice that of noodles.
Cons
umpt
ion
(mm
t)
2000 2005 2010 2015 2020 2025 2030
Food use Projection of food useFeed use Projection of feed use
02468
101214161820
Impo
rts
(mm
t)
2000 2005 2010 2015 2020 2025 20300
2
4
6
8
10
12
Australia Canada United StatesBlack Sea South America Other
Whe
at u
sage
(m
mt)
2019
2030
Instant noodlesOther noodlesBreadsCakes and biscuitsRetail
3.9
4.5
1.1
1.4
4.0
5.8
2.5
3.6
2.4
1.9
0 2 4 6 8 10 12 14 16 18 20

AEGIC | Wheat 203016
Middle East and North Africa
Algeria, Bahrain, Egypt, Iran, Iraq, Israel, Jordan, Kuwait, Morocco, Oman, Saudi Arabia, Sudan, Tunisia, United Arab Emirates, Yemen
• Demand for wheat is driven by bread consumption.
• Australian wheat is well suited to flat bread production but is under pressure from low cost competitors. The opportunity for Australian wheat could fluctuate between 1.5–5mmt per year.
Food and feed forecast• Increasing populations will drive
strong growth in food wheat consumption.
• Use of wheat for feed will remain minor due to the dominance of coarse grains.
Wheat imports by origin• Despite Australian wheat having a
favourable reputation throughout MENA, it is being displaced in some markets by wheat from lower cost Black Sea and Baltic Sea origins.
• Markets such as Kuwait, United Arab Emirates and Yemen currently have regular demand for Australian wheat based on its quality.
Change in utilisation• Wheat is mainly used for leavened and unleavened breads in MENA. Australian wheat is well
suited to flatbread.
• Bread and flour are subsidised in many MENA countries. Towards 2030 MENA countries’ governments will continue to scrutinise the cost of these subsidies.
Cons
umpt
ion
(mm
t)
2000 2005 2010 2015 2020 2025 2030
Food use Projection of food useFeed use Projection of feed use
0
20
40
60
80
100
120
Impo
rts
(mm
t)
2000 2005 2010 2015 2020 2025 20300
5
10
15
20
25
30
Australia Canada United StatesBlack Sea South America Other
Whe
at u
sage
(m
mt)
2019
2030
Instant noodlesOther noodlesBreadsCakes and biscuitsRetail
0
0.2
0.3
2.9
3.3
34.4
43.9
4.3
5.1
0.4
0.6
10 20 30 40 50 60

AEGIC | Wheat 2030 17
North Asia Japan, South Korea
• Japan and South Korea will remain important food wheat markets for Australia. There will be a slight decline in the volume of food wheat demanded.
• Australia could opportunistically participate in the growth in feed wheat demand.
Food and feed forecast• Flat to declining populations will
result in a slight decrease in wheat demand for food.
• Rising incomes in South Korea, will lead to increased meat consumption and higher feed wheat imports. The volume of imports will be volatile depending on relative prices with other feed sources.
Wheat imports by origin• There is a strong likelihood that
Australia will hold its food wheat market share because Japan and South Korea purchase specialised noodle wheat that is currently only available from Australia.
• Towards 2030 Australia’s position in the udon noodle market may be threatened by increased noodle wheat supply from the USA.
• Increasing feed wheat imports are most likely to be supplied by lower cost wheat from the Black Sea.
Change in utilisation• There will be little change in the wheat usage by food segment over the next decade.
Cons
umpt
ion
(mm
t)
2000 2005 2010 2015 2020 2025 2030
Food use Projection of food useFeed use Projection of feed use
0
1
2
3
4
5
6
7
8
9
Impo
rts
(mm
t)
2000 2005 2010 2015 2020 2025 20300
2
1
3
4
5
6
7
Australia Canada United StatesBlack Sea South America Other
Whe
at u
sage
(m
mt)
2019
2030
Instant noodlesOther noodlesBreadsCakes and biscuitsRetail
1.6
1.7
1.7
1.6
2.5
2.5
0.8
0.8
0.4
0.3
0 1 2 3 4 5 6 7 8

AEGIC | Wheat 203018
Key countriesIndonesia
• Wheat for food is the primary opportunity for Australia17
• Bread18, cakes and biscuits are increasing greatly in their importance relative to noodles19.
Food and feed forecast• Towards 2030, wheat for food will be the
main market opportunity growing by about 2mmt.
• Opportunities in feed wheat are less, growing by only about 0.6mmt. Feed wheat opportunities may be enhanced through the IA-CEPA agreement.
Wheat imports by origin• Australian exports to Indonesia are
expected to rebound in 2020/21 and stabilise at around 3 to 4mmt per year.
• South America and Black Sea wheat market share will increase substantially over the next decade.
• Wheat from these origins is of sufficient quality to meet low cost flour requirements e.g. general-purpose flours.
• Wheat from the USA is likely to grow in market share due to increased consumption of bread, cakes, and biscuits.
Change in utilisation• Breads, cakes, and biscuits are a growing segment. USA hard and soft wheats are popular in
these applications.
• Small Medium Enterprises (SME) will increasingly account for the majority of wheat flour use in Indonesia.
Cons
umpt
ion
(mm
t)
2000 2005 2010 2015 2020 2025 2030
Food use Projection of food useFeed use Projection of feed use
0
2
4
6
8
10
12
Impo
rts
(mm
t)
2000 2005 2010 2015 2020 2025 2030
Australia Canada United StatesBlack Sea South America Other
0
1
2
3
4
5
6
Whe
at u
sage
(m
mt)
2019
2030
Instant noodlesOther noodlesBreadsCakes and biscuitsRetail
0
2.0
2.3
0.6
0.9
1.6
2.9
1.3
2.1
1.4
0.9
2 4 6 8 10
17 The Indonesian wheat market: Its strategic importance to Australia18 Bread and baked goods in Indonesia19 The Indonesian noodle market

AEGIC | Wheat 2030 19
Philippines
• Feed wheat use is out stripping food use and presents the largest opportunity20.
• Increasing consumption of bread, cakes and biscuits will continue to favour wheat from USA.
• Increased noodle consumption is an opportunity for Australian wheat. Improved reliability of supply and service provision will improve Australia’s prospects.
Food and feed forecast• Total wheat consumption in the
Philippines is expected to increase to 7.2mmt by 2030, up from 5.8mmt in 2020. Much of this growth is expected to come from the feed sector.
• Since 2010, demand for feed wheat has grown strongly to satisfy the increasing feed demand not met by local corn production. Corn imports are restricted by government policy.
Wheat imports by origin• Australia’s market share has increased
from less than 0.2mmt per annum prior to 2010, to 2mmt in 2016. Much of the growth in Australia’s market share has occurred in the feed grain sector and is low protein wheat.
• Price competitiveness with other origins is assisted through favourable tariff treatment for wheat. The zero import tariff on Australian wheat also improves price competitiveness against locally grown corn as a livestock feed source.
• USA wheat dominates the bread and bakery segments. It remains one of their key export markets for wheat.
Change in utilisation• Bread and instant noodles are the two segments expected to grow most on the back of
increasing population and urbanisation trends.
Cons
umpt
ion
(mm
t)
2000 2005 2010 2015 2020 2025 2030
Food use Projection of food useFeed use Projection of feed use
0
2
1
3
4
5
6
7
Impo
rts
(mm
t)
2000 2005 2010 2015 2020 2025 20300
1
2
3
4
Australia Canada United StatesBlack Sea South America Other
Whe
at u
sage
(m
mt)
2019
2030
Instant noodlesOther noodlesBreadsCakes and biscuitsRetail
0
0.5
0.6
0.1
0.1
1.1
1.3
0.5
0.5
0.5
0.5
1 2 3
20 Wheat and Barley Markets in the Philippines

AEGIC | Wheat 203020
Vietnam
• Demand for food and feed wheat is strong and growing similarly21.
• Australian wheat has long been favoured for both bread and noodle manufacture in Vietnam. Increased demand for these products favours ongoing use of Australian wheat.
• Australia and Black Sea will likely remain the largest suppliers of food and feed wheat respectively.
Food and feed forecast• Growth in food and feed wheat imports
will be similar.
• Vietnam is likely to increase wheat imports by 2.1mmt over the next decade.
• Use of feed wheat has increased dramatically since 2008 and will continue to grow.
Wheat imports by origin• Australia and Black Sea are likely to
remain the largest suppliers of food and feed wheat, respectively.
• Black sea wheat is likely to gain market share in the feed market.
• Lower cost origins will continue to expand into some food segments such as instant noodles.
• Vietnam’s strict quarantine requirement (implemented in 2019) and zero tolerance for the weed seed Canadian Thistle in shipments of wheat and soybean, will continue to support Australian supply prospects against USA, Canada, and Black Sea.
Change in utilisation• Bread and instant noodles are the two segments expected to grow most.
• Vietnamese millers have indicated Australian Hard and APH are preferred grades for making banh mi style breads. When Australian supplies of these grades are low, Australia faces strong competition from Canadian CWRS.
Cons
umpt
ion
(mm
t)
2000 2005 2010 2015 2020 2025 2030
Food use Projection of food useFeed use Projection of feed use
0
1
2
3
Impo
rts
(mm
t)
2000 2005 2010 2015 2020 2025 20300
1
2
3
Australia Canada United StatesBlack Sea South America Other
Whe
at u
sage
(m
mt)
2019
2030
Instant noodlesOther noodlesBreadsCakes and biscuitsRetail
0 1 2 3
0.7
0.9
0.1
0.2
0.6
1.0
0.2
0.3
0.2
0.2
20 Wheat and Barley Markets in Vietnam

AEGIC | Wheat 2030 21
Japan
• Little change is expected in the import of wheat by Japan over the next decade.
• Japan has been a stable and reliable market for Australian noodle wheat. This may be threatened by USA breeding new noodle varieties.
Food and feed forecast• Japan imports around 6mmt of wheat,
augmented with 0.9mmt of domestic production.
• Food wheat consumption is trending slightly downwards, with a shrinking and aging population.
Wheat imports by origin• Australia has been the third largest
food wheat exporter to Japan, after USA and Canada, and supplies more than 0.8mmt of Western Australian noodle wheat blend annually.
• Udon noodle production requires special wheat grown domestically and imported from Australia. USA is now breeding varieties that may compete with Australia.
• US and Canadian wheat is primarily used for bread (US – DNS, Can. – CWRS) and cakes and biscuits (US – SWW).
Change in utilisation• Bread and noodle consumption will decline modestly.
Cons
umpt
ion
(mm
t)
2000 2005 2010 2015 2020 2025 2030
Food use Projection of food useFeed use Projection of feed use
0
1
2
3
4
5
6
Impo
rts
(mm
t)
2000 2005 2010 2015 2020 2025 20300
1
2
3
4
5
Australia Canada United StatesBlack Sea South America Other
Whe
at u
sage
(m
mt)
2019
2030
Instant noodlesOther noodlesBreadsCakes and biscuitsRetail
0
0.6
0.6
1.5
1.4
2.4
2.2
0.6
0.6
0.2
0.2
1 2 3 4 5 6

AEGIC | Wheat 203022

AEGIC | Wheat 2030 23
Australian wheat supplyProductionAustralia’s wheat production could increase by up to 2.5mmt over the next decade, despite a challenging climate.
Since 2000 wheat production has increased at 0.75% per annum, fuelling expectations that production could increase by up to 2.5mmt per annum by 2030. Current five-year average production is 23mmt (2015–2019, ABS).
Yields are increasing at a rate of around 1.35% per annum, through genetic improvements, improvements to agronomic management and farming systems. The rate of yield growth is expected to continue or increase toward 2030, due to implementation of new methods such as CRISPR technologies that improve the efficiency of the breeding process. The Australian plant breeding industry has the capacity to effectively utilise these new technologies and is well resourced through the End Point Royalty scheme relative to competitors such as Ukraine and Russia.
Although wheat yields (t/ha) are expected to increase, variable climatic conditions are expected over the next decade. The increased yields will offset some seasonal volatility, making economic returns possible from less rainfall. However, where there are consecutive poor seasons or widespread drought, the increasing climatic variability has potential to constrain Australia’s ability to be a reliable source of exportable surpluses of wheat22. These circumstances affect growers’ capacity to access technology that improves productivity and limits the ability to increase or maintain the area sown to wheat.
From 1989 to the mid-2000s, much of the growth in total wheat production was due to the wheat area increasing by 50%. However, since 2006, the area sown has been declining by 0.6% per annum, partly because of ongoing drought in the Eastern states (ABARES 2020). To factor these area trends into a forecast for total wheat production, if wheat area continues its long-term trend (1989–2019), then production is expected to increase to about 26mmt from its current five-year average of 23mmt. However, if the trend for area sown to wheat observed since 2006 continues, expected wheat production could potentially fall (Figure 9).
Figure 9 Area sown to wheat in Australia (left vertical axis), national yields (right vertical axis) and forecast production to 2030 (left vertical axis), based on the best and worst case scenarios Source: ABARES, AEGIC
22 Australia’s Grain Outlook 2030
Whe
at a
rea
(mHa)
an
d pr
oduc
tion
(m
mt)
Yield (t/ha)
Production (LHS)Wheat area (LHS) Wheat yield (RHS)
Forecast production lower (LHS) Forecast production upper (LHS)
1989
–90
1991
–92
1993
–94
1995
–96
1997
–98
1999
–2000
2001
–2002
2003
–2004
2005
–2006
2007
–2008
2009
–2010
2011
–2012
2013
–2014
2015
–2016
2017
–2018
2019
–2020
f
2021
–2022
f
2023
–2024
f
2025
–2026
f
2027
–2028
f
2029
–2030
f0
1
2
3
0
5
10
15
20
25
30
35

AEGIC | Wheat 203024
Wheat usageDivergent spatial trends are reshaping the usage of Australia wheat
Since 2005, wheat production in Australia has ranged from 17mmt to 32mmt (Figure 10). Volumes available for export have ranged from 22.6mmt (2016/17) to 8.6mmt (2019/20). Domestic consumption is about 6.7mmt per annum, displaying slow, stable growth. The growth in Australian wheat consumption, is mostly due to demand from the animal feed industry (Figure 11). The feed industry is expected to increase total feed demand by 2.2 to 2.5mmt22 resulting in demand for feed wheat increasing by 1.5mmt, from 4.5 to 5.9mmt by 2030. Additionally, demand within the food and industrial sector is expected to increase from 3mmt to 3.2mmt by 2030.
Table 1 Statistics for export and domestic usage for wheat produced in Australia
Export Domestic use
1974–2000 2000–2019 2013–2019 1974–2001 2000–2019 2013–2019Volume (mmt) 13.46 15.85 14.43 4.50 6.45 6.72Growth rate (CAGR) 1.9% -0.2% -2.2% 1.8% 2.4% 2.7%
Source: OECD
Figure 11 Domestic consumption of wheat as food and as feed, with projections to 2030 Source: OECD, AEGIC
mm
t
0
Exports Domestic
5
10
15
20
25
30
1973 1978 1983 1988 1993 1998 2003 2008 2013 2018
Figure 10 Historical volumes of wheat consumed domestically and exported Source: ABARES
Cons
umpt
ion
(mm
t)
0
4
3
2
1
5
6
7
8
9
2000 2005 2010 2015 2020 2025 2030
Food and industry Projection of food and industryFeed use Projection of feed use

AEGIC | Wheat 2030 25
With most Australians (80%) living in Queensland, Victoria and New South Wales and population growth being 1.4% per annum23, the increasing domestic demand for wheat will be centred in Australia’s eastern states22. Within these states, the consumption growth is likely to absorb much of the additional production. The smaller domestic markets in Western Australia and South Australia will not absorb much of their additional production, allowing most to become exportable surplus. The growth in the exportable surplus in Australia will most likely occur in these two states, and towards 2030, exported wheat will increasingly originate from these states.
Table 2 Comparison of export volumes and their coefficient of variation by state
NSW Qld Vic SA WA
2006–2010
Production 5.08 1.26 2.11 2.79 7.29 Exports 1.78 0.75 0.91 1.85 6.66 % Exported 35% 60% 43% 66% 91%Coefficient of variation in exports 47.0% 36.4% 51.7% 22.5% 18.8%2015–2019
Production 5.07 0.88 3.21 4.02 8.33 Exports 1.45 0.33 1.61 3.22 7.48 % Exported 29% 37% 50% 80% 90%Coefficient of variation in exports 51.5% 42.2% 45.8% 18.8% 18.4%
Source: ABS
The shift further towards South Australia and Western Australia as the primary origin of exports will change the quality of wheat available for export. Approximately 20% of the grain delivered annually in these states has protein meeting the AH grade or higher, with the majority being graded as APW or ASW. By contrast, about 40% of grain delivered in eastern Australia is to the AH grade or above. Much of the high protein APH and AH grades are produced24, and will continue to be produced, in the eastern states. Population growth and growth in the animal feed industries will cause a continuing high proportion of APH and AH production to flow onto domestic rather than export markets.
Continued and increasing volatility in Australian wheat export volumes.
Wheat export volumes from Australia25 are more variable than Canada26, Ukraine, and the United States (Table 3). This volatility generally reflects seasonal production in the respective countries. The exceptions are Russia and Argentine where higher volatility in export volumes is a function of both seasonal variability and government policy interventions, including export bans, taxes, and levies. In Australia, the volatility is caused solely by variable seasonal conditions.
Table 3 Coefficient of variation (=Standard deviation/Average) in wheat production and export volumes over a ten-year period 2010–2019
Coefficient of Variation of Argentina Australia Canada Russia Ukraine United States
Production 22% 17% 11% 13% 11% 7%Export 45% 19% 9% 32% 13% 12%
Source: USDA
Australia’s volatility in exports will affect the nature of long-term relationships with some markets. While key markets will (almost by definition) continue to receive service and volume irrespective of seasonal conditions, interactions with secondary markets will tend towards opportunism. Some key markets value the continuity of supply of a consistent quality product and maintain investment in the long-term relationship with Australian suppliers. They are willing to work with the Australian industry on a technical basis, and in many cases are willing to pay for functionality preferred for particular end products.
22 Australia’s Grain Outlook 203023 United Nations: World Population Prospects24 Blog: Follow the mouths, just head to the coast25 Blog: The challenge of yield advancement we are not alone26 The puck stops here: Canada challenges Australia’s grain supply chains

AEGIC | Wheat 203026
Within opportunistic markets, interrupted supply increases a purchaser’s risk, which is then built into pricing. Additionally, opportunistic markets are less reliant on, and less willing to pay for, the intrinsic qualities of the wheat. These markets prefer that the wheat will perform as part of a blend. Within the Australian wheatbelt, some regions provide certainty of supply of consistent quality wheat more successfully than others. This consistency should inform any further investment in long-term supply arrangements, similar to the relationship between Australia and Japan based on supply of ANW wheat for udon noodles.
Implementation of strategies that smooth the supply of exportable wheat, could help reduce seasonal disruption to export markets. For example, co-investment in grain storage, and maintenance of the option to import wheat27, may increase the exportable volume of Australian wheat in poor seasons. As an example of how seasonal conditions can disrupt the export market, in 2018/19 eastern Australia had a poor season and local users of wheat had to pay well above the import parity to access grain. Significant volumes of grain were redirected from WA and SA towards NSW and Qld, as prices offered by the domestic market were higher than export markets. The growers with wheat to sell benefitted from the high prices. However, the usual export customers purchased grain from elsewhere, often from Australia’s competitors. This limited Australian supply and high price forced these customers to firstly, rely on commercial relationships with other origins, and secondly, become more familiar with using wheat from these competitors.
Given the higher cost of grain production in Australia compared to international competitors, efficient, low risk supply chains will be required to support the competitiveness of wheat in export markets28. Strategies to improve the efficiency of Australian supply chains have, and continue to be, implemented by supply chain operators in all states. Reducing the regulatory burden on exporters, whilst encouraging competition and coopetition within supply chains is a critical component of fit-for-purpose supply chains. Effective and efficient incorporation of container trade of wheat within existing bulk supply chains is also a foreseeable feature of future wheat exports for smaller, differentiated market segments to proliferate.
Change in structure of the export market portfolio
Since 2015, the export destinations for Australian grain have undergone structural change (Figure 13).
Prior to 2017, the largest market (ranked by volume), 2nd–5th largest markets, and 6th–10th largest, each purchased roughly 15–20% of the crop. The rest of the crop (45%) was exported to multiple smaller destinations. Since 2017, the Indonesian share of purchases has declined, and the 2nd–5th largest markets have become more important, now purchasing 40% of the crop.
Smaller markets (Others) are now purchasing less than 25%. Continued presence in these markets will often lead to future opportunities, but is not always sustainable.
Figure 12 Purchasing share of Australian wheat exports by ranking group Source: ABS 2020
%
0
10
20
30
40
50
Rank 1: Indonesia Rank 2–5 Rank 6–10 Others
2013 2014 2015 2016 2017 2018 2019
Rank CountryImports: 5 yr. Av.
2015–2019 (mmt)
1 Indonesia 3.172 Philippines 1.383 Vietnam 1.314 China 1.065 South Korea 1.066 Japan 0.917 Malaysia 0.808 Yemen 0.799 India 0.6410 New Zealand 0.48
Others 3.81
27 Blog: Volatility in Australia’s wheat export supply chains28 Australia’s grain supply chains: Costs, risks, and opportunities

AEGIC | Wheat 2030 27
28 Australia’s grain supply chains: Costs, risks, and opportunities
Wheat qualityAustralia must target investment for developing quality-based long-term market partnerships
Ensuring key markets have reliable access to a stable supply of consistent quality Australian wheat is a major challenge for Australia’s wheat export industry, given the marked volatility in production and the growth in domestic demand.
Though the AH grade comprises 26% of the harvested crop, currently the most reliable exportable surpluses are low to mid protein, ASW and APW grades, mostly grown in Western Australia and South Australia (Figure 13). These grades are highly suited to noodle production and serve as a useful blending wheat for other purposes.
Most Australian wheat varieties grown in favourable conditions can meet the specifications required by the domestic baking industry for making bread using no-time dough methods. However, Australia’s key export markets primarily use long fermentation or sponge and dough methods that are better suited to North American wheats. Australian wheats generally have lower protein/gluten levels and dough strength. Choice modelling experiments in the SEA market indicate that higher levels of both attributes are preferred in the sponge and dough process. While some Australian regions can produce wheats with protein and functionality comparable to the North American grades, the volume of production is small and often used domestically.
Markets continue to pay for higher levels of protein (Figure 14). North American wheat including DNS and CWRS which regularly reach 14% protein on an 11% moisture basis, remains the highest priced wheat. However, for many growers – especially so in export-oriented Western Australia and South Australia – the economic return from chasing high protein, and selling AH rather than APW wheat, is marginal. In many cases the environmental conditions, including climate and soils, do not readily support high protein wheat production. The price premiums received for protein increments are insufficient to cover the costs and risks associated with applying the additional inputs, especially nitrogenous fertilisers, required to achieve high protein levels. This growers’ behaviour in chasing protein is revealed through a downwards trend in wheat protein in the last decade28.
Figure 13 Estimated quality profile of Australian crop by grade, average 2014–2019 Source: Australian Crop Forecasters
Perc
enta
ge o
f to
tal cr
op (
%)
0
5
10
15
20
25
30
35
GP/Feed AUH ASW Noodle APW AH HPS APH Durum

AEGIC | Wheat 203028
Figure 14 Expected spread of international wheat classes, as compared to Black Sea Feed wheat (2015–2019 $USD FOB) Note that price spreads for wheat landed in market will differ from the data presented in Figure 13, depending on the freight and other costs from each origin to its destination. Source IGC, AEGIC, USDA, AHDB
Pric
e sp
read
to
Balc
k Se
a Fe
ed (
$USD
) 100
90
80
70
60
50
40
30
20
10
0BSF
Protein content @ 11%mb
Australia North America EU Black Sea South America
8 9 10 11 12 13 14 15
APW–F
APW–PAASW–F
ASW–PA
AH (2009–14)
APH (2009–14)
CWRS–StlCWRS–V
SRW
HRW
DNS–13.5
DNS–14P
DNS–14G
DNS–14LSW
EU1EUB
EUF BSM
ARG
Compounding the effect, Grain Growers Limited23 state that 73% of wheat planted in Australia are AH varieties, and up to 70% of those plantings are graded on delivery as APW and ASW due to protein. So, while the classification standards are critical to maintaining high quality functional wheat, farmers and the industry could potentially access yield benefits by utilising varieties that are better suited to their production conditions and possibly better suited to the customers end product. For example, if a variety is released as a bread variety, it would likely have a reasonable water absorption. However, if the grain is downgraded and used for making noodles, water absorption is much less important.
The market advantage of lifting wheat yields is that it increases Australian wheat production and increases farmers’ profits. It also increases the likelihood of Australia having volumes of grain sufficient to serve key markets in the long-term, with grain qualities required or preferred in those markets.
In short, the industry should consider whether current wheat quality standards appropriately serve the domestic and export market interests of Australian wheat producers. Also, is it technically feasible to produce APW or ASW varieties that frequently are higher yielding than current AH varieties yet which will reliably qualify for APW and ASW status respectively upon delivery in most years.
Wheat for noodles is the best basis for forming long-term technical and commercial relationships
Australian wheat is especially suited to noodle production due to its mid-protein along with other quality and functional traits (Figure 15). In SEA especially, Australian wheat has historically been preferred for making noodles due to a range of quality attributes unique to Australian grain, including colour and texture.
Smaller volumes of Australian wheat are also included in bread grists, often to improve the ‘whiteness’ of breads. However, the most widely used methods of bread production (sponge and dough) in SEA prefer higher protein wheats, often 13% protein and higher, which Australia does not produce in sufficient exportable quantity, on a regular basis (Figure 13).
29 Gains in Grains: Is Australia producing the most profitable quality of wheat?

AEGIC | Wheat 2030 29
Figure 15 Wheat-based foods and the qualities of wheat they draw upon
However, AEGIC’s in market investigations combined with choice analysis experiments – involving instant noodle manufacturers holding greater than 80% market share across seven countries in SEA – reveals their positive regard for Australian wheat in noodle production but also the difficulties of absorbing or passing on costs of manufacture to the consumer. In many instances across SEA, instant noodles represent a low-cost satiety food item. At the entry level the retail price of a packet of noodle is upwards of AUD20 cents a packet with wheat flour making up more than 65% of the ingredient base.
Market feedback to AEGIC and Australian grain traders has indicated some large SEA noodle manufacturers are shifting away from using Australian AH wheat – used in noodle manufacture for many years – towards high protein CWRS, due to price and lack of consistent supply of Australian AH in 2019. The challenge to the Australian wheat industry is understanding how readily users will switch back to Australian wheat and wheat flour when it becomes more available, and at what price premium is the market prepared to pay for quality attributes that Australian wheat can provide. To its advantage, Australian wheat retains non-technical factors that form part of the SEA purchasing decision, including its proximity of supply and management of stocks which helps favour Australian wheat among SEA users.
Durum
Hard
Mixed
Soft
Protein in wheat (%)
8 9 10 11 12 13 14 15
Bread High proteinflour – bread
Pasta
Cake, biscuit, pastry
White Japanese noodles
Yellownoodles
Chapattis,flatbreads
Thickener,grocery

AEGIC | Wheat 203030

AEGIC | Wheat 2030 31
Appendix 1 – Global regionsThe 40 top ranked wheat importing countries by volume (excluding the EU) based on an average from 2017-2019, were grouped by region as in (Table 4). These top importers comprise nearly 85% of demand on international wheat markets.
Table 4 Annual growth rates in key indicators of total wheat consumption, within the top 39 wheat importing nations based on 2017–2019 volumes, grouped by region. The colours represent whether that indicator for that country is in the top third (green), middle third (yellow) or bottom third (brown).
Region Countries Current imports
Population growth
Income growth
Consumption growth (per cap)
Import growth (kt)
China China 4.4 0.6% 2.8% 0.1% 153.8 Taiwan 1.4 0.4% 0.6% 1.4% 20.0
North Asia Japan 5.6 0.0% 0.8% 0.6% 9.3 South Korea 4.1 0.4% 0.1% 1.3% 103.7
South Asia Bangladesh 5.5 1.3% 2.5% 4.6% 258.3 India 1.6 1.4% 1.2% 0.4% 25.5 Pakistan 0.0 2.2% 0.6% -0.3% -31.9 Sri Lanka 1.1 0.7% 0.0% -0.5% 4.5
South East Asia
Indonesia 10.1 1.3% 1.5% 4.1% 402.5 Malaysia 1.6 1.7% 1.1% -0.8% 34.6 Myanmar 0.3 0.8% 0.7% nd -1.0 Philippines 5.8 1.7% 0.1% 2.7% 221.5 Singapore 0.3 2.4% 0.0% -0.6% 5.2 Thailand 3.6 0.5% 2.6% 8.4% 168.1 Vietnam 3.7 1.0% 2.2% 8.7% -1.0
MENA Algeria 7.8 1.7% 1.1% 1.4% 174.3 Bahrain 0.1 4.9% 0.1% 4.8% 5.6 Egypt 11.8 2.0% 0.0% 1.0% 343.5 Iran 1.0 1.2% 0.9% -0.7% -67.1 Iraq 2.0 2.7% 0.2% -0.5% 17.3 Israel 1.7 2.0% 0.1% -0.4% 23.2 Jordan 1.1 4.2% 1.0% -2.0% 12.7 Kuwait 0.5 4.5% 0.0% 0.7% 16.8 Morocco 4.4 1.3% 0.9% 2.1% 110.4 Oman 0.6 4.7% 1.0% 2.8% 28.6 Qatar 0.1 10.6% 0.2% nd -1.0 Saudi Arabia 2.6 2.8% 0.3% 1.1% 228.3 Sudan 2.0 2.4% 0.3% 3.4% 95.3 Tunisia 1.9 1.0% 0.4% 0.1% 22.2 Turkey 6.3 1.5% 80.0% 0.2% 388.5 United Arab Emirates 1.2 7.3% 0.4% -1.2% 46.3 Yemen 3.3 2.8% 1.9% 1.3% 106.6
Oceania New Zealand 0.5 1.1% 0.0% 3.3% 10.5 Fiji 0.1 0.5% 0.9% 3.1% 2.3 Papua New Guinea 0.3 2.2% 0.0% 2.8% 12.1
Sub-Saharan Africa
Nigeria 4.7 2.7% 2.1% 0.8% 158.3 Ethiopia 1.6 2.8% 2.0% 2.8% 69.6 Kenya 1.8 2.7% 1.7% 4.1% 90.2 Malawi 0.2 2.8% 0.8% nd 9.9 Mauritius 0.2 0.4% -0.3% -0.6% -0.1 Mozambique 0.6 2.9% 1.2% 3.8% 25.1 South Africa 1.6 1.4% 0.9% -0.1% 64.2 Tanzania 0.4 2.9% 2.4% 3.1% 38.2

AEGIC | Wheat 203032
Appendix 2 – Product segmentsFor charts presenting wheat usage by product segments, the following groupings are applied.
Instant noodles Instant noodles, cup noodles, packet noodlesOther noodles Yellow alkaline, white salted noodles (udon noodles), ramen noodles, pasta (incl. durum based)
Bread Pan bread, flat bread, Indian breads, hearth bread, rolls, buns, pandesal
Cakes and biscuits Confectionary, cakes, sweet biscuits, crackers, steamed buns
Retail Snack foods, grocery flour, other flour mixes, other refined flour products

AEGIC | Wheat 2030 33
Appendix 3 – Maps
Figure 16 Expected change in import volumes (‘000s t): 2020 to 2030
Figure 17 Expected change in export volumes (‘000s t): 2020 to 2030
-1,500
21,300
Change in Exports
-2100
0
5300
Change in Imports

AEGIC | Wheat 203034
Further readingExtended competitor analysis reports from AEGIC• The puck stops here! Canada challenges Australia’s grain supply chains
• Ukraine – An emerging challenge for Australian Wheat Exports
• Russia’s wheat industry: Implications for Australia
• Argentina’s grains industry: implications for Australia
Grain markets towards 2030 (limited distribution reports)• Indonesia 2030: Wheat Consumption and Supply
• Japan 2030: Wheat Consumption and Supply
• Malaysia 2030: Wheat Consumption and Supply
• Philippines 2030: Wheat Consumption and Supply
• South Korea: 2030: Wheat Consumption and Supply
• Thailand 2030: Wheat Consumption and Supply
• Vietnam 2030: Wheat Consumption and Supply
Grain supply towards 2030• Australia’s grain outlook: 2030
Demand analysis reports from AEGIC• The Indonesian wheat market: its strategic importance to Australia
• The Indonesian noodle market: its importance to Australian wheat exports
• Wheat and barley markets in Vietnam: their strategic importance to Australia
• Wheat and barley markets in the Philippines: opportunities for Australia
DataForecasts within this report are based on AEGIC’s research and in-market intelligence and the data sources listed below.
• Australian Bureau of Statistics
• ABARES
• United Nations Population Division
• OECD-FAO Agricultural Outlook
• UN Comtrade
• USDA International Baseline Data
• USDA International Macroeconomic Data Set
• Euromonitor• Statista

AEGIC | Wheat 2030 35
Other references• www.aegic.org.au
• AEGIC reports
• www.grainsinnovation.org
• Grain Growers Limited (2020), Gains in Grains: Is Australia producing the most profitable quality of wheat?
• GIMAF (2014) Australian Wheat and Barley Industry – Industry Management Plan to supply wheat and barley to the Chinese market

AEGIC | Wheat 2030 36
aegic.org.au AEGIC
Australianexportgrains innovationcentre
All contents copyright ©AEGIC. All rights reserved.
The related bodies corporate, directors and employees of AEGIC accept no liability whatsoever for any injury, loss, claim, damage, incidental or consequential damage, arising out of, or in any way connected with, the use of any information, or any, error, omission or defect in the information contained in this publication. Whilst every care has been taken in the preparation of this publication AEGIC accepts no liability for the accuracy of the information supplied.
Version: August 2020
AEGIC is an initiative of the Western Australian State Government and Grains Research & Development Corporation
Department ofPrimary Industries andRegional Development
Perth3 Baron-Hay CourtSouth PerthWestern Australia 6151
P: +61 (08) 6168 9900
Sydney1 Rivett RoadRiverside Corporate ParkNorth RydeNew South Wales 2113
PO Box 711North RydeNSW 1670, Australia
P: +61 (02) 8025 3200