wheat and oat variety performance tests in tennessee 2010 wheat and oat... · wheat and oat variety...
TRANSCRIPT
Wheat and Oat Variety Performance Tests in Tennessee
2010
Fred L. Allen, Coordinator, Agronomic Crop Variety Testing & Demonstrations Richard D. Johnson, Research Associate, Agronomic Crop Variety Testing & Demonstrations Robert C. Williams Jr., Extension Area Specialist, Grain Crops
Chris Main, Extension Specialist, Cotton & Small Grains
Agronomic Crop Variety Testing and Demonstrations
Department of Plant Sciences University of Tennessee
Knoxville Telephone: (865)974-8821 FAX: (865)974-1947 email: [email protected]
Variety test results are posted on UT’s website at:
http://varietytrials.tennessee.edu
and
UTCrops.com
1
Acknowledgments
This research was funded by the Tennessee Agricultural Experiment Station and UT Extension with partial funding from participating companies. We gratefully acknowledge the assistance of the following individuals in conducting these experiments: Dept. of Plant Sciences Dennis West, Professor and Grains Breeder David Kincer, Research Associate Kara Warwick, Graduate Research Associate Jennifer Lane, Graduate Research Associate Research and Education Centers: East Tennessee Research and Education Center, Knoxville Robert Simpson, Center Director Bobby McKee, Sr. Farm Crew Leader Plateau Research & Education Center, Crossville Walt Hitch, Center Director Greg Blaylock, Light Farm Equipment Operator Sam Simmons, Light Farm Equipment Operator Highland Rim Research and Education Center, Springfield Barry Sims, Center Director Brad S. Fisher, Research Associate Middle Tennessee Research and Education Center, Spring Hill Kevin Thompson, Center Director Frank Musgrave, Research Associate Research and Education Center at Milan, Milan Blake Brown, Center Director Jason Williams, Research Associate James McClure, Research Associate West Tennessee Research and Education Center, Jackson Robert Hayes, Center Director Randi Dunagan, Research Associate
2
County Standard Wheat Test: Coordinator: Robert C. Williams, Jr., Extension Area Specialist, Grain Crops Dyer County Tim Campbell, Extension Director Allen & Keith Sims Farm Franklin County Ed Burns, Extension Agent Steve Dixon Farm Gibson County Philip Shelby, Extension Director Charles & Andy King Farm Henry County Ranson Goodman, Extension Agent Edwin Ables Farm Lake County Gregg Allen, Extension Director Jon Dickey Farm Weakley County Jeff Lannom, Extension Director Gary & Gail Hall Farm
3
Table of Contents
General Information…………………………………………………………………………………... 5 Interpretation of Data…………………………………………………………………………………. 6 Wheat Tests Results................................................................................................................. 6 Location information from Research & Education Centers where the Wheat Variety Tests were Conducted in 2010……………………………………………………………………… 6 Research and Education Center Wheat Performance Data 2010………………………………. 7 County Standard Wheat Performance Data 2010..................................................................... 11 Two year Research & Education Center Wheat Performance Data 2009 - 2010…………….. 13 Three year Research & Education Center Wheat Performance Data 2008 - 2010……….….. 15 Research & Education Center Oat Performance Data 2010…………………….………………. 17 Two year Research & Education Center Oat Performance Data 2009 - 2010………..……….. 19 Three year Research & Education Center Oat Performance Data 2008 - 2010……..……….. 19 Seed Company Contact Information………………………………………………………………... 20
4
General Information Research and Education Center Tests: The 2010 variety performance tests were conducted on 66 soft, red winter wheat varieties in each of the physiographic regions of the state. Tests were conducted at East TN (Knoxville), Plateau (Crossville), Highland Rim (Springfield), Middle TN (Spring Hill), Milan (Milan), and West TN (Jackson) Research and Education Centers. All varieties were seeded at rates from 26 - 32 seed per square foot (Table 1). Plots were seeded with drills using 7–7.5 inch row spacings. The plot size was six, seven or ten rows, 25 to 30 feet in length depending on location equipment. Plots were replicated three times at each location. Seed of all varieties were treated with a fungicide. County Standard Tests: The County Standard Wheat Test was conducted on 20 soft red winter wheat varieties across six counties in West Tennessee (Dyer, Franklin, Gibson, Henry, Lake, and Weakley). Each variety was evaluated in a large strip-plot at each location, thus each county test was considered as one replication of the test in calculating the overall average yield and in conducting the statistical analysis to determine significant differences. At each location, plots were planted, sprayed, fertilized, and harvested with the equipment used by the cooperating producer in their farming operation. The width and length of strip-plots were different in each county; however, within a location in a county, the strips were trimmed on the ends so that the lengths were the same for each variety, or if the lengths were different then the harvested length was measured for each variety and appropriate harvested area adjustments were made to determine the yield per acre. Wheat and Oat Silage Tests: In order to evaluate the 2010 wheat and oat varieties for silage yield, duplicate tests with differing randomizations were planted at the Middle Tennessee Research and Education Center. These data will be presented in the UT Extension Silage Tests publication SP618 later this year. Growing Season: Wet conditions during the fall of 2009 delayed harvesting of summer crops and postponed planting of small grains across much of the state, in some cases as late as mid-December. The winter temperatures were reasonably moderate with some freezing damage to plants at some locations. According to the Tennessee Agricultural Statistics Service (TASS), the crop tolerated the winter in good condition with 75 percent of the crop rated good to excellent in the spring. Record flooding occurred in Middle and Western Tennessee during the first week of May which caused moderate to severe damage to approximately 20 percent of producer fields. Wet and warm conditions April through June caused some foliar and grain disease development. Harvest was aided by hot, dry weather in the latter half of June with most of the crop harvested by the end of that month. Tennessee producers planted approximately 280,000 acres of wheat in the fall of 2009, a reduction of 33 percent from the previous year. Approximately 190,000 acres were harvested for grain in 2010 which is 150,000 acres less than the 2009 harvested acreage of 340,000. The 2010 total wheat production forecast for Tennessee is 10.1 million bushels, down 42 percent from last year. The predicted state average yield for wheat is 56 bu/a.
5
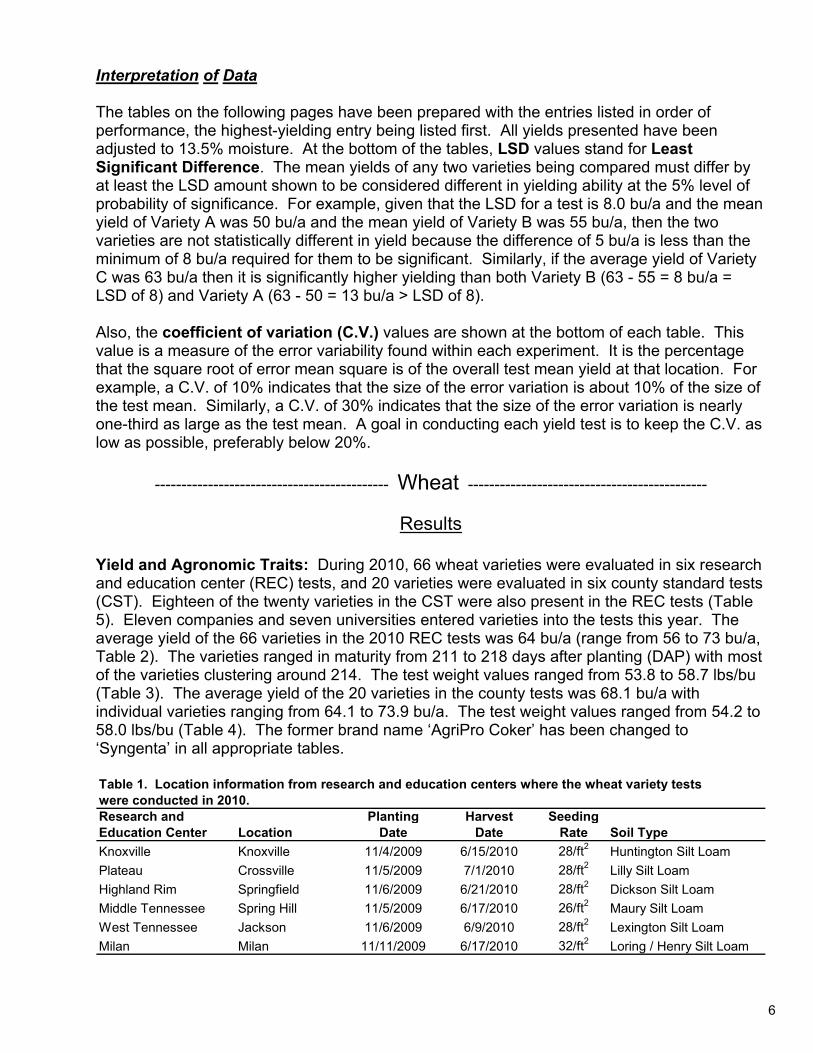
Interpretation of Data The tables on the following pages have been prepared with the entries listed in order of performance, the highest-yielding entry being listed first. All yields presented have been adjusted to 13.5% moisture. At the bottom of the tables, LSD values stand for Least Significant Difference. The mean yields of any two varieties being compared must differ by at least the LSD amount shown to be considered different in yielding ability at the 5% level of probability of significance. For example, given that the LSD for a test is 8.0 bu/a and the mean yield of Variety A was 50 bu/a and the mean yield of Variety B was 55 bu/a, then the two varieties are not statistically different in yield because the difference of 5 bu/a is less than the minimum of 8 bu/a required for them to be significant. Similarly, if the average yield of Variety C was 63 bu/a then it is significantly higher yielding than both Variety B (63 - 55 = 8 bu/a = LSD of 8) and Variety A (63 - 50 = 13 bu/a > LSD of 8). Also, the coefficient of variation (C.V.) values are shown at the bottom of each table. This value is a measure of the error variability found within each experiment. It is the percentage that the square root of error mean square is of the overall test mean yield at that location. For example, a C.V. of 10% indicates that the size of the error variation is about 10% of the size of the test mean. Similarly, a C.V. of 30% indicates that the size of the error variation is nearly one-third as large as the test mean. A goal in conducting each yield test is to keep the C.V. as low as possible, preferably below 20%.
-------------------------------------------- Wheat ---------------------------------------------
Results
Yield and Agronomic Traits: During 2010, 66 wheat varieties were evaluated in six research and education center (REC) tests, and 20 varieties were evaluated in six county standard tests (CST). Eighteen of the twenty varieties in the CST were also present in the REC tests (Table 5). Eleven companies and seven universities entered varieties into the tests this year. The average yield of the 66 varieties in the 2010 REC tests was 64 bu/a (range from 56 to 73 bu/a, Table 2). The varieties ranged in maturity from 211 to 218 days after planting (DAP) with most of the varieties clustering around 214. The test weight values ranged from 53.8 to 58.7 lbs/bu (Table 3). The average yield of the 20 varieties in the county tests was 68.1 bu/a with individual varieties ranging from 64.1 to 73.9 bu/a. The test weight values ranged from 54.2 to 58.0 lbs/bu (Table 4). The former brand name ‘AgriPro Coker’ has been changed to ‘Syngenta’ in all appropriate tables. Table 1. Location information from research and education centers where the wheat variety testswere conducted in 2010.Research and Planting Harvest SeedingEducation Center Location Date Date Rate Soil TypeKnoxville Knoxville 11/4/2009 6/15/2010 28/ft2 Huntington Silt LoamPlateau Crossville 11/5/2009 7/1/2010 28/ft2 Lilly Silt LoamHighland Rim Springfield 11/6/2009 6/21/2010 28/ft2 Dickson Silt LoamMiddle Tennessee Spring Hill 11/5/2009 6/17/2010 26/ft2 Maury Silt LoamWest Tennessee Jackson 11/6/2009 6/9/2010 28/ft2 Lexington Silt LoamMilan Milan 11/11/2009 6/17/2010 32/ft2 Loring / Henry Silt Loam
6
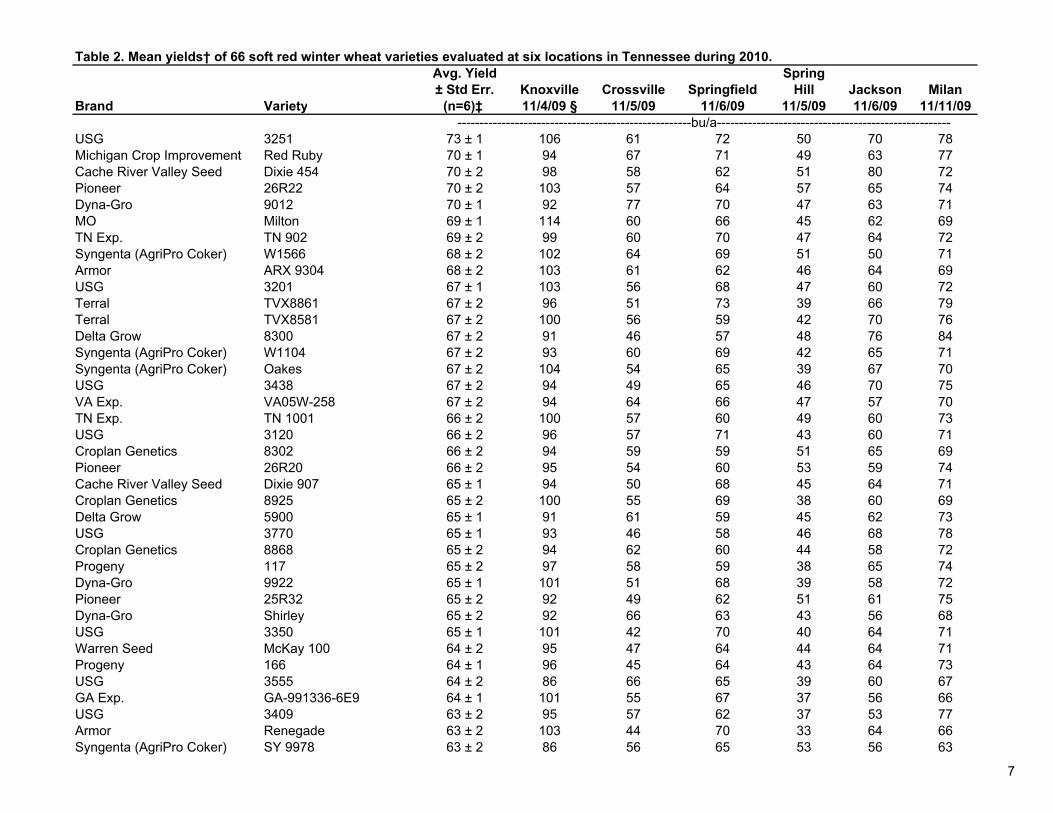
Table 2. Mean yields† of 66 soft red winter wheat varieties evaluated at six locations in Tennessee during 2010.Avg. Yield Spring± Std Err. Knoxville Crossville Springfield Hill Jackson Milan
Brand Variety (n=6)‡ 11/4/09 § 11/5/09 11/6/09 11/5/09 11/6/09 11/11/09 -----------------------------------------------------bu/a-----------------------------------------------------
USG 3251 73 ± 1 106 61 72 50 70 78Michigan Crop Improvement Red Ruby 70 ± 1 94 67 71 49 63 77Cache River Valley Seed Dixie 454 70 ± 2 98 58 62 51 80 72Pioneer 26R22 70 ± 2 103 57 64 57 65 74Dyna-Gro 9012 70 ± 1 92 77 70 47 63 71MO Milton 69 ± 1 114 60 66 45 62 69TN Exp. TN 902 69 ± 2 99 60 70 47 64 72Syngenta (AgriPro Coker) W1566 68 ± 2 102 64 69 51 50 71Armor ARX 9304 68 ± 2 103 61 62 46 64 69USG 3201 67 ± 1 103 56 68 47 60 72Terral TVX8861 67 ± 2 96 51 73 39 66 79Terral TVX8581 67 ± 2 100 56 59 42 70 76Delta Grow 8300 67 ± 2 91 46 57 48 76 84Syngenta (AgriPro Coker) W1104 67 ± 2 93 60 69 42 65 71Syngenta (AgriPro Coker) Oakes 67 ± 2 104 54 65 39 67 70USG 3438 67 ± 2 94 49 65 46 70 75VA Exp. VA05W-258 67 ± 2 94 64 66 47 57 70TN Exp. TN 1001 66 ± 2 100 57 60 49 60 73USG 3120 66 ± 2 96 57 71 43 60 71Croplan Genetics 8302 66 ± 2 94 59 59 51 65 69Pioneer 26R20 66 ± 2 95 54 60 53 59 74Cache River Valley Seed Dixie 907 65 ± 1 94 50 68 45 64 71Croplan Genetics 8925 65 ± 2 100 55 69 38 60 69Delta Grow 5900 65 ± 1 91 61 59 45 62 73USG 3770 65 ± 1 93 46 58 46 68 78Croplan Genetics 8868 65 ± 2 94 62 60 44 58 72Progeny 117 65 ± 2 97 58 59 38 65 74Dyna-Gro 9922 65 ± 1 101 51 68 39 58 72Pioneer 25R32 65 ± 2 92 49 62 51 61 75Dyna-Gro Shirley 65 ± 2 92 66 63 43 56 68USG 3350 65 ± 1 101 42 70 40 64 71Warren Seed McKay 100 64 ± 2 95 47 64 44 64 71Progeny 166 64 ± 1 96 45 64 43 64 73USG 3555 64 ± 2 86 66 65 39 60 67GA Exp. GA-991336-6E9 64 ± 1 101 55 67 37 56 66USG 3409 63 ± 2 95 57 62 37 53 77Armor Renegade 63 ± 2 103 44 70 33 64 66Syngenta (AgriPro Coker) SY 9978 63 ± 2 86 56 65 53 56 63
7
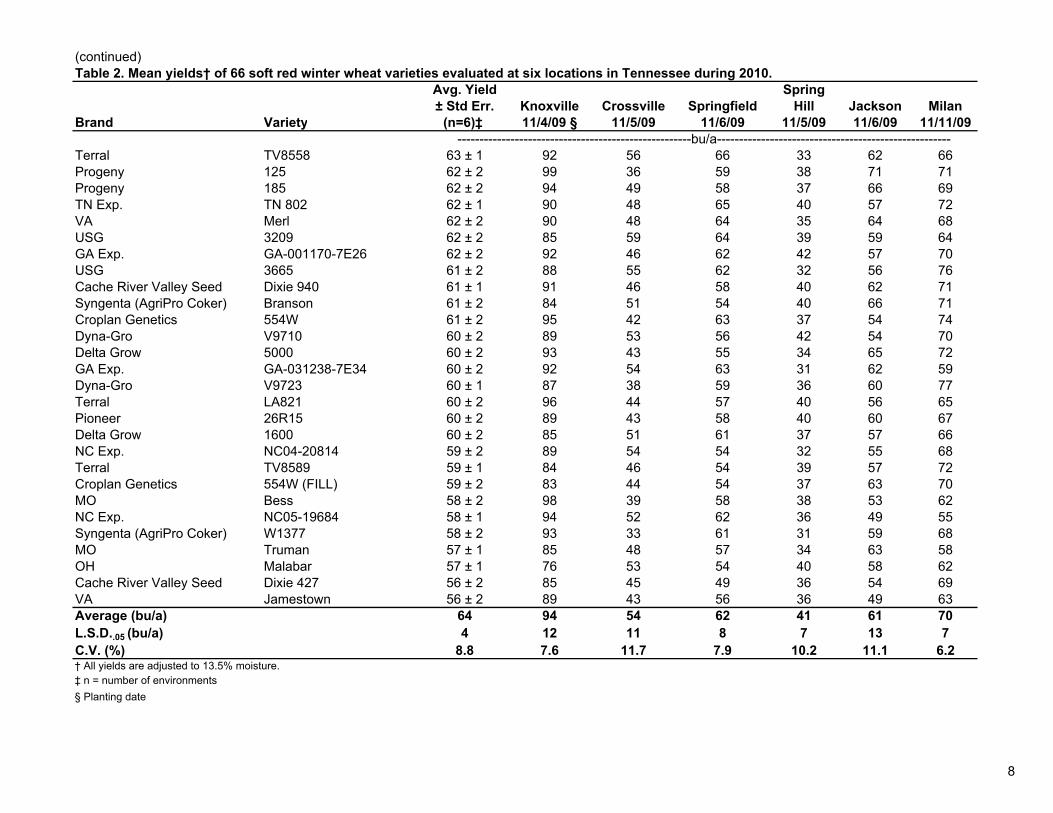
(continued)Table 2. Mean yields† of 66 soft red winter wheat varieties evaluated at six locations in Tennessee during 2010.
Avg. Yield Spring± Std Err. Knoxville Crossville Springfield Hill Jackson Milan
Brand Variety (n=6)‡ 11/4/09 § 11/5/09 11/6/09 11/5/09 11/6/09 11/11/09 -----------------------------------------------------bu/a-----------------------------------------------------
Terral TV8558 63 ± 1 92 56 66 33 62 66Progeny 125 62 ± 2 99 36 59 38 71 71Progeny 185 62 ± 2 94 49 58 37 66 69TN Exp. TN 802 62 ± 1 90 48 65 40 57 72VA Merl 62 ± 2 90 48 64 35 64 68USG 3209 62 ± 2 85 59 64 39 59 64GA Exp. GA-001170-7E26 62 ± 2 92 46 62 42 57 70USG 3665 61 ± 2 88 55 62 32 56 76Cache River Valley Seed Dixie 940 61 ± 1 91 46 58 40 62 71Syngenta (AgriPro Coker) Branson 61 ± 2 84 51 54 40 66 71Croplan Genetics 554W 61 ± 2 95 42 63 37 54 74Dyna-Gro V9710 60 ± 2 89 53 56 42 54 70Delta Grow 5000 60 ± 2 93 43 55 34 65 72GA Exp. GA-031238-7E34 60 ± 2 92 54 63 31 62 59Dyna-Gro V9723 60 ± 1 87 38 59 36 60 77Terral LA821 60 ± 2 96 44 57 40 56 65Pioneer 26R15 60 ± 2 89 43 58 40 60 67Delta Grow 1600 60 ± 2 85 51 61 37 57 66NC Exp. NC04-20814 59 ± 2 89 54 54 32 55 68Terral TV8589 59 ± 1 84 46 54 39 57 72Croplan Genetics 554W (FILL) 59 ± 2 83 44 54 37 63 70MO Bess 58 ± 2 98 39 58 38 53 62NC Exp. NC05-19684 58 ± 1 94 52 62 36 49 55Syngenta (AgriPro Coker) W1377 58 ± 2 93 33 61 31 59 68MO Truman 57 ± 1 85 48 57 34 63 58OH Malabar 57 ± 1 76 53 54 40 58 62Cache River Valley Seed Dixie 427 56 ± 2 85 45 49 36 54 69VA Jamestown 56 ± 2 89 43 56 36 49 63Average (bu/a) 64 94 54 62 41 61 70L.S.D..05 (bu/a) 4 12 11 8 7 13 7C.V. (%) 8.8 7.6 11.7 7.9 10.2 11.1 6.2† All yields are adjusted to 13.5% moisture.‡ n = number of environments § Planting date
8
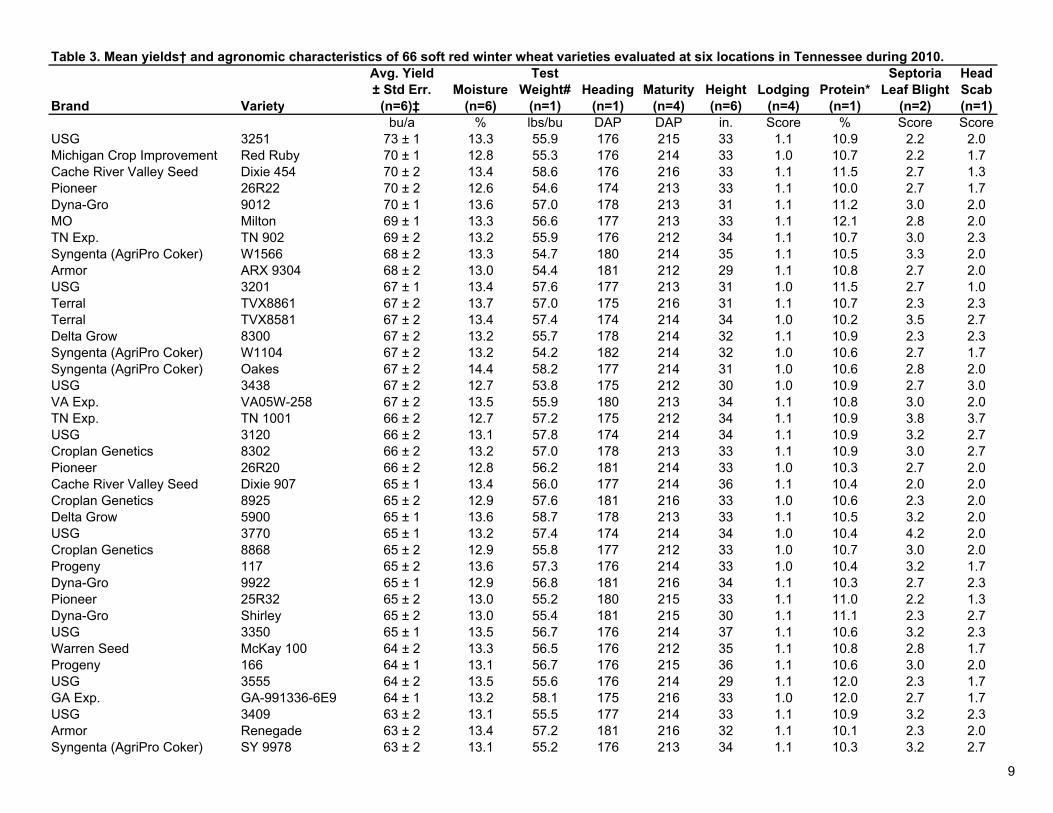
Table 3. Mean yields† and agronomic characteristics of 66 soft red winter wheat varieties evaluated at six locations in Tennessee during 2010.Avg. Yield Test Septoria Head± Std Err. Moisture Weight# Heading Maturity Height Lodging Protein* Leaf Blight Scab
Brand Variety (n=6)‡ (n=6) (n=1) (n=1) (n=4) (n=6) (n=4) (n=1) (n=2) (n=1)bu/a % lbs/bu DAP DAP in. Score % Score Score
USG 3251 73 ± 1 13.3 55.9 176 215 33 1.1 10.9 2.2 2.0Michigan Crop Improvement Red Ruby 70 ± 1 12.8 55.3 176 214 33 1.0 10.7 2.2 1.7Cache River Valley Seed Dixie 454 70 ± 2 13.4 58.6 176 216 33 1.1 11.5 2.7 1.3Pioneer 26R22 70 ± 2 12.6 54.6 174 213 33 1.1 10.0 2.7 1.7Dyna-Gro 9012 70 ± 1 13.6 57.0 178 213 31 1.1 11.2 3.0 2.0MO Milton 69 ± 1 13.3 56.6 177 213 33 1.1 12.1 2.8 2.0TN Exp. TN 902 69 ± 2 13.2 55.9 176 212 34 1.1 10.7 3.0 2.3Syngenta (AgriPro Coker) W1566 68 ± 2 13.3 54.7 180 214 35 1.1 10.5 3.3 2.0Armor ARX 9304 68 ± 2 13.0 54.4 181 212 29 1.1 10.8 2.7 2.0USG 3201 67 ± 1 13.4 57.6 177 213 31 1.0 11.5 2.7 1.0Terral TVX8861 67 ± 2 13.7 57.0 175 216 31 1.1 10.7 2.3 2.3Terral TVX8581 67 ± 2 13.4 57.4 174 214 34 1.0 10.2 3.5 2.7Delta Grow 8300 67 ± 2 13.2 55.7 178 214 32 1.1 10.9 2.3 2.3Syngenta (AgriPro Coker) W1104 67 ± 2 13.2 54.2 182 214 32 1.0 10.6 2.7 1.7Syngenta (AgriPro Coker) Oakes 67 ± 2 14.4 58.2 177 214 31 1.0 10.6 2.8 2.0USG 3438 67 ± 2 12.7 53.8 175 212 30 1.0 10.9 2.7 3.0VA Exp. VA05W-258 67 ± 2 13.5 55.9 180 213 34 1.1 10.8 3.0 2.0TN Exp. TN 1001 66 ± 2 12.7 57.2 175 212 34 1.1 10.9 3.8 3.7USG 3120 66 ± 2 13.1 57.8 174 214 34 1.1 10.9 3.2 2.7Croplan Genetics 8302 66 ± 2 13.2 57.0 178 213 33 1.1 10.9 3.0 2.7Pioneer 26R20 66 ± 2 12.8 56.2 181 214 33 1.0 10.3 2.7 2.0Cache River Valley Seed Dixie 907 65 ± 1 13.4 56.0 177 214 36 1.1 10.4 2.0 2.0Croplan Genetics 8925 65 ± 2 12.9 57.6 181 216 33 1.0 10.6 2.3 2.0Delta Grow 5900 65 ± 1 13.6 58.7 178 213 33 1.1 10.5 3.2 2.0USG 3770 65 ± 1 13.2 57.4 174 214 34 1.0 10.4 4.2 2.0Croplan Genetics 8868 65 ± 2 12.9 55.8 177 212 33 1.0 10.7 3.0 2.0Progeny 117 65 ± 2 13.6 57.3 176 214 33 1.0 10.4 3.2 1.7Dyna-Gro 9922 65 ± 1 12.9 56.8 181 216 34 1.1 10.3 2.7 2.3Pioneer 25R32 65 ± 2 13.0 55.2 180 215 33 1.1 11.0 2.2 1.3Dyna-Gro Shirley 65 ± 2 13.0 55.4 181 215 30 1.1 11.1 2.3 2.7USG 3350 65 ± 1 13.5 56.7 176 214 37 1.1 10.6 3.2 2.3Warren Seed McKay 100 64 ± 2 13.3 56.5 176 212 35 1.1 10.8 2.8 1.7Progeny 166 64 ± 1 13.1 56.7 176 215 36 1.1 10.6 3.0 2.0USG 3555 64 ± 2 13.5 55.6 176 214 29 1.1 12.0 2.3 1.7GA Exp. GA-991336-6E9 64 ± 1 13.2 58.1 175 216 33 1.0 12.0 2.7 1.7USG 3409 63 ± 2 13.1 55.5 177 214 33 1.1 10.9 3.2 2.3Armor Renegade 63 ± 2 13.4 57.2 181 216 32 1.1 10.1 2.3 2.0Syngenta (AgriPro Coker) SY 9978 63 ± 2 13.1 55.2 176 213 34 1.1 10.3 3.2 2.7
9
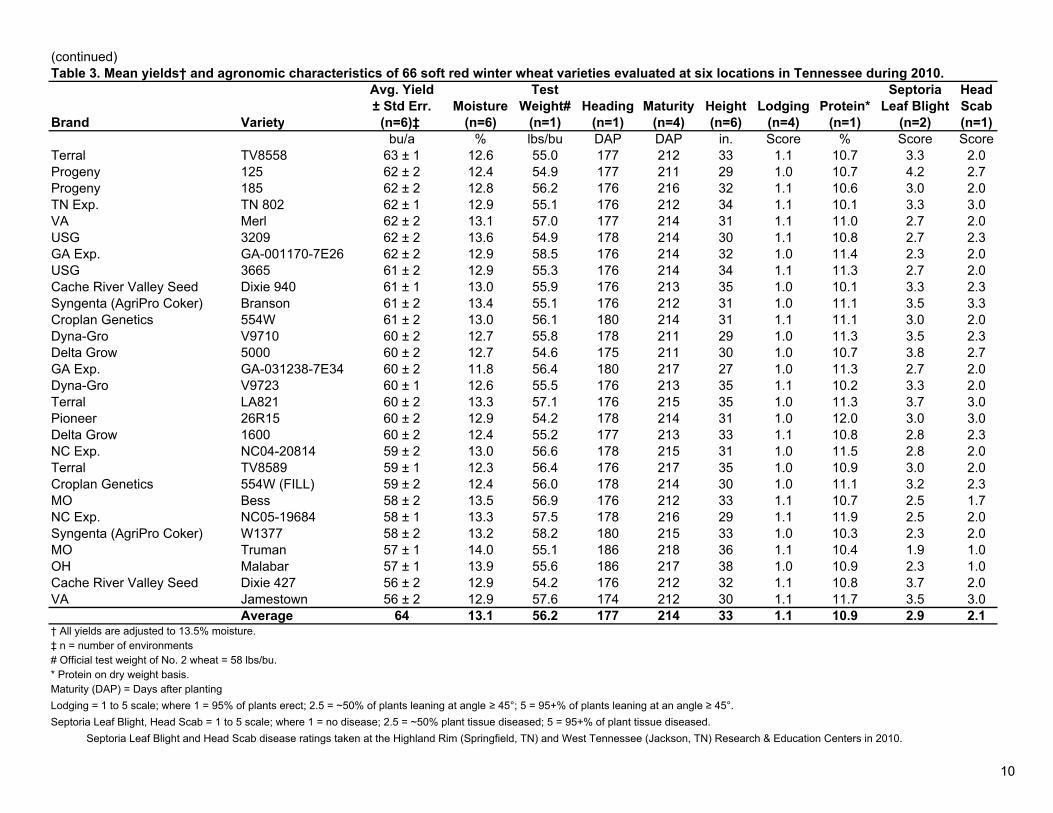
(continued)Table 3. Mean yields† and agronomic characteristics of 66 soft red winter wheat varieties evaluated at six locations in Tennessee during 2010.
Avg. Yield Test Septoria Head± Std Err. Moisture Weight# Heading Maturity Height Lodging Protein* Leaf Blight Scab
Brand Variety (n=6)‡ (n=6) (n=1) (n=1) (n=4) (n=6) (n=4) (n=1) (n=2) (n=1)bu/a % lbs/bu DAP DAP in. Score % Score Score
Terral TV8558 63 ± 1 12.6 55.0 177 212 33 1.1 10.7 3.3 2.0Progeny 125 62 ± 2 12.4 54.9 177 211 29 1.0 10.7 4.2 2.7Progeny 185 62 ± 2 12.8 56.2 176 216 32 1.1 10.6 3.0 2.0TN Exp. TN 802 62 ± 1 12.9 55.1 176 212 34 1.1 10.1 3.3 3.0VA Merl 62 ± 2 13.1 57.0 177 214 31 1.1 11.0 2.7 2.0USG 3209 62 ± 2 13.6 54.9 178 214 30 1.1 10.8 2.7 2.3GA Exp. GA-001170-7E26 62 ± 2 12.9 58.5 176 214 32 1.0 11.4 2.3 2.0USG 3665 61 ± 2 12.9 55.3 176 214 34 1.1 11.3 2.7 2.0Cache River Valley Seed Dixie 940 61 ± 1 13.0 55.9 176 213 35 1.0 10.1 3.3 2.3Syngenta (AgriPro Coker) Branson 61 ± 2 13.4 55.1 176 212 31 1.0 11.1 3.5 3.3Croplan Genetics 554W 61 ± 2 13.0 56.1 180 214 31 1.1 11.1 3.0 2.0Dyna-Gro V9710 60 ± 2 12.7 55.8 178 211 29 1.0 11.3 3.5 2.3Delta Grow 5000 60 ± 2 12.7 54.6 175 211 30 1.0 10.7 3.8 2.7GA Exp. GA-031238-7E34 60 ± 2 11.8 56.4 180 217 27 1.0 11.3 2.7 2.0Dyna-Gro V9723 60 ± 1 12.6 55.5 176 213 35 1.1 10.2 3.3 2.0Terral LA821 60 ± 2 13.3 57.1 176 215 35 1.0 11.3 3.7 3.0Pioneer 26R15 60 ± 2 12.9 54.2 178 214 31 1.0 12.0 3.0 3.0Delta Grow 1600 60 ± 2 12.4 55.2 177 213 33 1.1 10.8 2.8 2.3NC Exp. NC04-20814 59 ± 2 13.0 56.6 178 215 31 1.0 11.5 2.8 2.0Terral TV8589 59 ± 1 12.3 56.4 176 217 35 1.0 10.9 3.0 2.0Croplan Genetics 554W (FILL) 59 ± 2 12.4 56.0 178 214 30 1.0 11.1 3.2 2.3MO Bess 58 ± 2 13.5 56.9 176 212 33 1.1 10.7 2.5 1.7NC Exp. NC05-19684 58 ± 1 13.3 57.5 178 216 29 1.1 11.9 2.5 2.0Syngenta (AgriPro Coker) W1377 58 ± 2 13.2 58.2 180 215 33 1.0 10.3 2.3 2.0MO Truman 57 ± 1 14.0 55.1 186 218 36 1.1 10.4 1.9 1.0OH Malabar 57 ± 1 13.9 55.6 186 217 38 1.0 10.9 2.3 1.0Cache River Valley Seed Dixie 427 56 ± 2 12.9 54.2 176 212 32 1.1 10.8 3.7 2.0VA Jamestown 56 ± 2 12.9 57.6 174 212 30 1.1 11.7 3.5 3.0
Average 64 13.1 56.2 177 214 33 1.1 10.9 2.9 2.1† All yields are adjusted to 13.5% moisture.‡ n = number of environments # Official test weight of No. 2 wheat = 58 lbs/bu.* Protein on dry weight basis.Maturity (DAP) = Days after plantingLodging = 1 to 5 scale; where 1 = 95% of plants erect; 2.5 = ~50% of plants leaning at angle ≥ 45°; 5 = 95+% of plants leaning at an angle ≥ 45°.Septoria Leaf Blight, Head Scab = 1 to 5 scale; where 1 = no disease; 2.5 = ~50% plant tissue diseased; 5 = 95+% of plant tissue diseased. Septoria Leaf Blight and Head Scab disease ratings taken at the Highland Rim (Springfield, TN) and West Tennessee (Jackson, TN) Research & Education Centers in 2010.
10
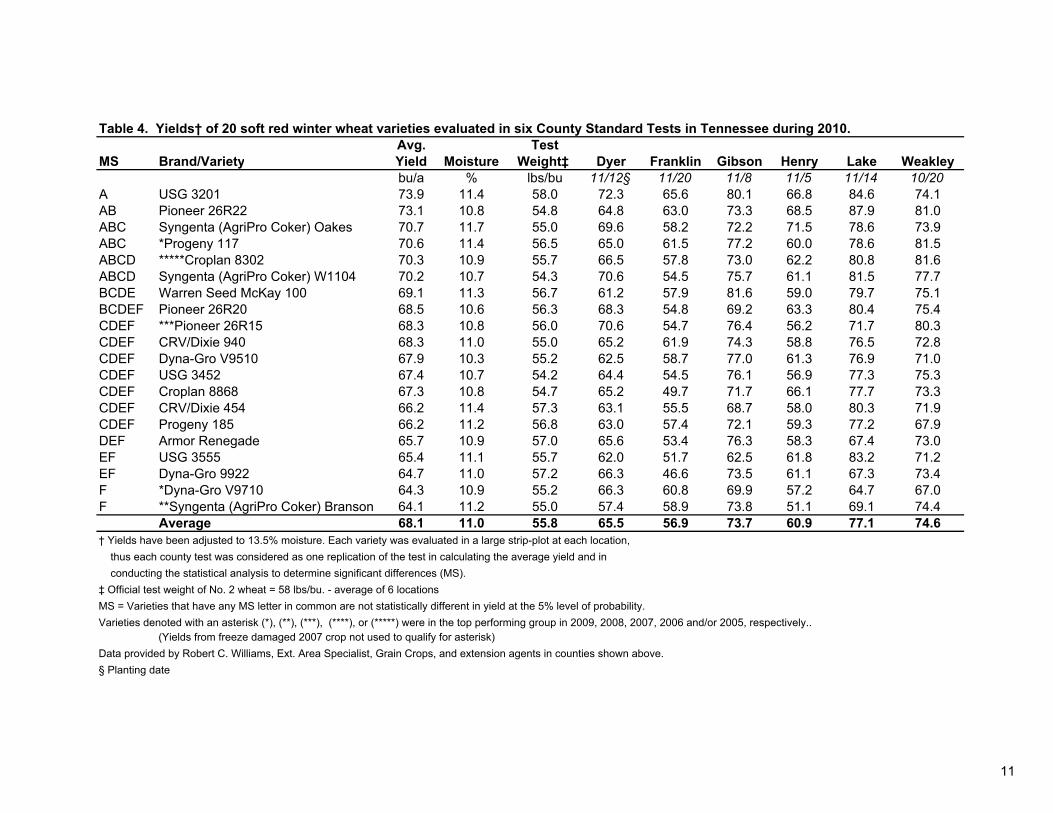
Table 4. Yields† of 20 soft red winter wheat varieties evaluated in six County Standard Tests in Tennessee during 2010.Avg. Test
MS Brand/Variety Yield Moisture Weight‡ Dyer Franklin Gibson Henry Lake Weakleybu/a % lbs/bu 11/12§ 11/20 11/8 11/5 11/14 10/20
A USG 3201 73.9 11.4 58.0 72.3 65.6 80.1 66.8 84.6 74.1AB Pioneer 26R22 73.1 10.8 54.8 64.8 63.0 73.3 68.5 87.9 81.0ABC Syngenta (AgriPro Coker) Oakes 70.7 11.7 55.0 69.6 58.2 72.2 71.5 78.6 73.9ABC *Progeny 117 70.6 11.4 56.5 65.0 61.5 77.2 60.0 78.6 81.5ABCD *****Croplan 8302 70.3 10.9 55.7 66.5 57.8 73.0 62.2 80.8 81.6ABCD Syngenta (AgriPro Coker) W1104 70.2 10.7 54.3 70.6 54.5 75.7 61.1 81.5 77.7BCDE Warren Seed McKay 100 69.1 11.3 56.7 61.2 57.9 81.6 59.0 79.7 75.1BCDEF Pioneer 26R20 68.5 10.6 56.3 68.3 54.8 69.2 63.3 80.4 75.4CDEF ***Pioneer 26R15 68.3 10.8 56.0 70.6 54.7 76.4 56.2 71.7 80.3CDEF CRV/Dixie 940 68.3 11.0 55.0 65.2 61.9 74.3 58.8 76.5 72.8CDEF Dyna-Gro V9510 67.9 10.3 55.2 62.5 58.7 77.0 61.3 76.9 71.0CDEF USG 3452 67.4 10.7 54.2 64.4 54.5 76.1 56.9 77.3 75.3CDEF Croplan 8868 67.3 10.8 54.7 65.2 49.7 71.7 66.1 77.7 73.3CDEF CRV/Dixie 454 66.2 11.4 57.3 63.1 55.5 68.7 58.0 80.3 71.9CDEF Progeny 185 66.2 11.2 56.8 63.0 57.4 72.1 59.3 77.2 67.9DEF Armor Renegade 65.7 10.9 57.0 65.6 53.4 76.3 58.3 67.4 73.0EF USG 3555 65.4 11.1 55.7 62.0 51.7 62.5 61.8 83.2 71.2EF Dyna-Gro 9922 64.7 11.0 57.2 66.3 46.6 73.5 61.1 67.3 73.4F *Dyna-Gro V9710 64.3 10.9 55.2 66.3 60.8 69.9 57.2 64.7 67.0F **Syngenta (AgriPro Coker) Branson 64.1 11.2 55.0 57.4 58.9 73.8 51.1 69.1 74.4
Average 68.1 11.0 55.8 65.5 56.9 73.7 60.9 77.1 74.6† Yields have been adjusted to 13.5% moisture. Each variety was evaluated in a large strip-plot at each location, thus each county test was considered as one replication of the test in calculating the average yield and in conducting the statistical analysis to determine significant differences (MS).‡ Official test weight of No. 2 wheat = 58 lbs/bu. - average of 6 locationsMS = Varieties that have any MS letter in common are not statistically different in yield at the 5% level of probability.Varieties denoted with an asterisk (*), (**), (***), (****), or (*****) were in the top performing group in 2009, 2008, 2007, 2006 and/or 2005, respectively..
(Yields from freeze damaged 2007 crop not used to qualify for asterisk)Data provided by Robert C. Williams, Ext. Area Specialist, Grain Crops, and extension agents in counties shown above.§ Planting date
11
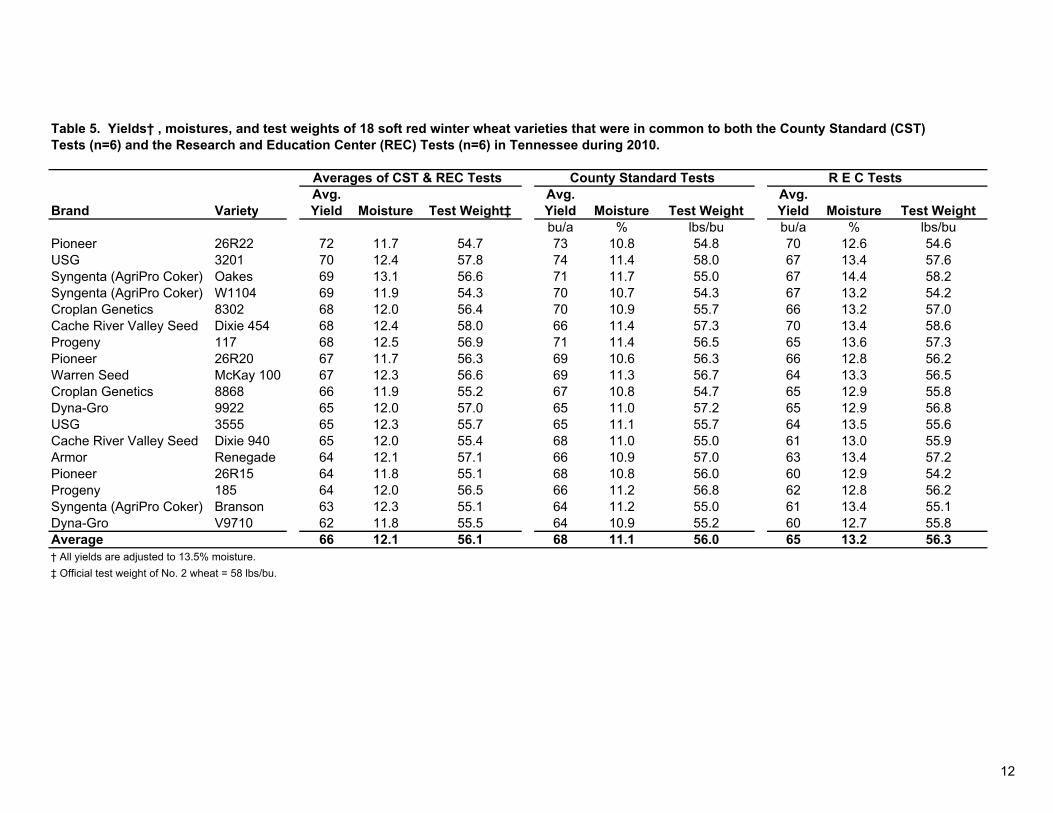
Table 5. Yields† , moistures, and test weights of 18 soft red winter wheat varieties that were in common to both the County Standard (CST)Tests (n=6) and the Research and Education Center (REC) Tests (n=6) in Tennessee during 2010.
Averages of CST & REC Tests County Standard Tests R E C Tests Avg. Avg. Avg.
Brand Variety Yield Moisture Test Weight‡ Yield Moisture Test Weight Yield Moisture Test Weightbu/a % lbs/bu bu/a % lbs/bu
Pioneer 26R22 72 11.7 54.7 73 10.8 54.8 70 12.6 54.6USG 3201 70 12.4 57.8 74 11.4 58.0 67 13.4 57.6Syngenta (AgriPro Coker) Oakes 69 13.1 56.6 71 11.7 55.0 67 14.4 58.2Syngenta (AgriPro Coker) W1104 69 11.9 54.3 70 10.7 54.3 67 13.2 54.2Croplan Genetics 8302 68 12.0 56.4 70 10.9 55.7 66 13.2 57.0Cache River Valley Seed Dixie 454 68 12.4 58.0 66 11.4 57.3 70 13.4 58.6Progeny 117 68 12.5 56.9 71 11.4 56.5 65 13.6 57.3Pioneer 26R20 67 11.7 56.3 69 10.6 56.3 66 12.8 56.2Warren Seed McKay 100 67 12.3 56.6 69 11.3 56.7 64 13.3 56.5Croplan Genetics 8868 66 11.9 55.2 67 10.8 54.7 65 12.9 55.8Dyna-Gro 9922 65 12.0 57.0 65 11.0 57.2 65 12.9 56.8USG 3555 65 12.3 55.7 65 11.1 55.7 64 13.5 55.6Cache River Valley Seed Dixie 940 65 12.0 55.4 68 11.0 55.0 61 13.0 55.9Armor Renegade 64 12.1 57.1 66 10.9 57.0 63 13.4 57.2Pioneer 26R15 64 11.8 55.1 68 10.8 56.0 60 12.9 54.2Progeny 185 64 12.0 56.5 66 11.2 56.8 62 12.8 56.2Syngenta (AgriPro Coker) Branson 63 12.3 55.1 64 11.2 55.0 61 13.4 55.1Dyna-Gro V9710 62 11.8 55.5 64 10.9 55.2 60 12.7 55.8Average 66 12.1 56.1 68 11.1 56.0 65 13.2 56.3† All yields are adjusted to 13.5% moisture.‡ Official test weight of No. 2 wheat = 58 lbs/bu.
12
E
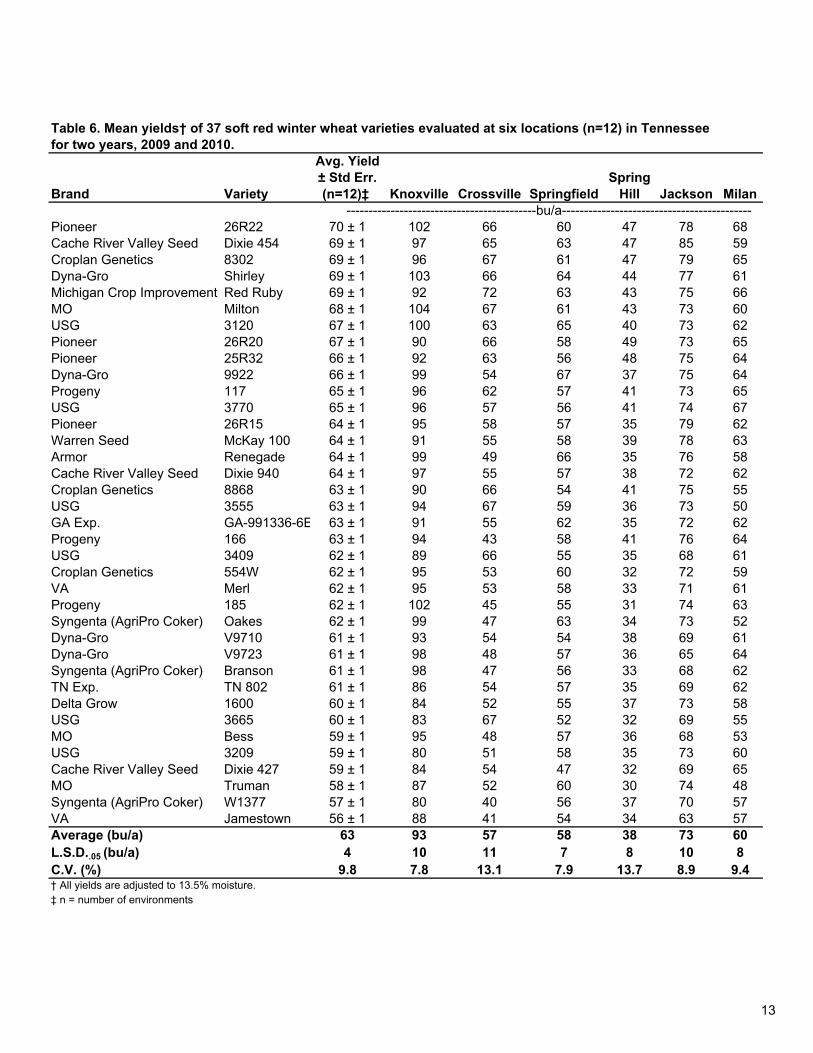
Table 6. Mean yields† of 37 soft red winter wheat varieties evaluated at six locations (n=12) in Tennessee for two years, 2009 and 2010.
Avg. Yield± Std Err. Spring
Brand Variety (n=12)‡ Knoxville Crossville Springfield Hill Jackson Milan -------------------------------------------bu/a-------------------------------------------
Pioneer 26R22 70 ± 1 102 66 60 47 78 68Cache River Valley Seed Dixie 454 69 ± 1 97 65 63 47 85 59Croplan Genetics 8302 69 ± 1 96 67 61 47 79 65Dyna-Gro Shirley 69 ± 1 103 66 64 44 77 61Michigan Crop Improvement Red Ruby 69 ± 1 92 72 63 43 75 66MO Milton 68 ± 1 104 67 61 43 73 60USG 3120 67 ± 1 100 63 65 40 73 62Pioneer 26R20 67 ± 1 90 66 58 49 73 65Pioneer 25R32 66 ± 1 92 63 56 48 75 64Dyna-Gro 9922 66 ± 1 99 54 67 37 75 64Progeny 117 65 ± 1 96 62 57 41 73 65USG 3770 65 ± 1 96 57 56 41 74 67Pioneer 26R15 64 ± 1 95 58 57 35 79 62Warren Seed McKay 100 64 ± 1 91 55 58 39 78 63Armor Renegade 64 ± 1 99 49 66 35 76 58Cache River Valley Seed Dixie 940 64 ± 1 97 55 57 38 72 62Croplan Genetics 8868 63 ± 1 90 66 54 41 75 55USG 3555 63 ± 1 94 67 59 36 73 50GA Exp. GA-991336-6 63 ± 1 91 55 62 35 72 62Progeny 166 63 ± 1 94 43 58 41 76 64USG 3409 62 ± 1 89 66 55 35 68 61Croplan Genetics 554W 62 ± 1 95 53 60 32 72 59VA Merl 62 ± 1 95 53 58 33 71 61Progeny 185 62 ± 1 102 45 55 31 74 63Syngenta (AgriPro Coker) Oakes 62 ± 1 99 47 63 34 73 52Dyna-Gro V9710 61 ± 1 93 54 54 38 69 61Dyna-Gro V9723 61 ± 1 98 48 57 36 65 64Syngenta (AgriPro Coker) Branson 61 ± 1 98 47 56 33 68 62TN Exp. TN 802 61 ± 1 86 54 57 35 69 62Delta Grow 1600 60 ± 1 84 52 55 37 73 58USG 3665 60 ± 1 83 67 52 32 69 55MO Bess 59 ± 1 95 48 57 36 68 53USG 3209 59 ± 1 80 51 58 35 73 60Cache River Valley Seed Dixie 427 59 ± 1 84 54 47 32 69 65MO Truman 58 ± 1 87 52 60 30 74 48Syngenta (AgriPro Coker) W1377 57 ± 1 80 40 56 37 70 57VA Jamestown 56 ± 1 88 41 54 34 63 57Average (bu/a) 63 93 57 58 38 73 60L.S.D..05 (bu/a) 4 10 11 7 8 10 8C.V. (%) 9.8 7.8 13.1 7.9 13.7 8.9 9.4† All yields are adjusted to 13.5% moisture.‡ n = number of environments
13
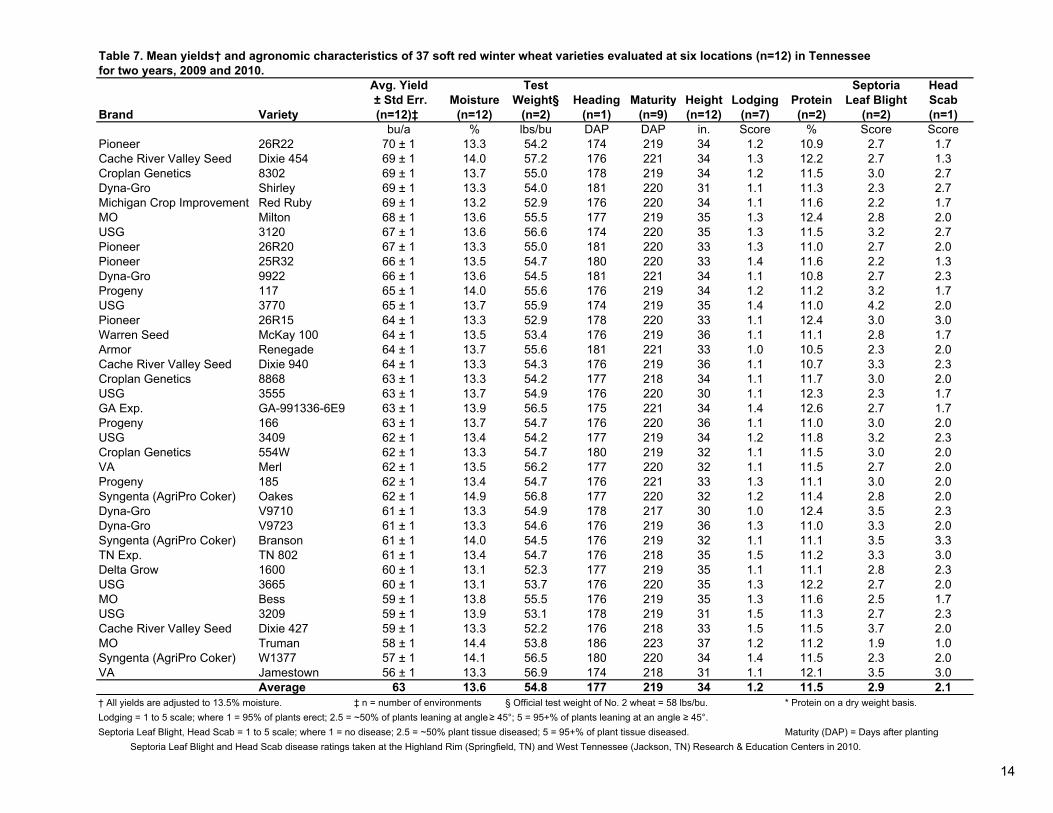
Table 7. Mean yields† and agronomic characteristics of 37 soft red winter wheat varieties evaluated at six locations (n=12) in Tennesseefor two years, 2009 and 2010.
Avg. Yield Test Septoria Head± Std Err. Moisture Weight§ Heading Maturity Height Lodging Protein Leaf Blight Scab
Brand Variety (n=12)‡ (n=12) (n=2) (n=1) (n=9) (n=12) (n=7) (n=2) (n=2) (n=1)bu/a % lbs/bu DAP DAP in. Score % Score Score
Pioneer 26R22 70 ± 1 13.3 54.2 174 219 34 1.2 10.9 2.7 1.7Cache River Valley Seed Dixie 454 69 ± 1 14.0 57.2 176 221 34 1.3 12.2 2.7 1.3Croplan Genetics 8302 69 ± 1 13.7 55.0 178 219 34 1.2 11.5 3.0 2.7Dyna-Gro Shirley 69 ± 1 13.3 54.0 181 220 31 1.1 11.3 2.3 2.7Michigan Crop Improvement Red Ruby 69 ± 1 13.2 52.9 176 220 34 1.1 11.6 2.2 1.7MO Milton 68 ± 1 13.6 55.5 177 219 35 1.3 12.4 2.8 2.0USG 3120 67 ± 1 13.6 56.6 174 220 35 1.3 11.5 3.2 2.7Pioneer 26R20 67 ± 1 13.3 55.0 181 220 33 1.3 11.0 2.7 2.0Pioneer 25R32 66 ± 1 13.5 54.7 180 220 33 1.4 11.6 2.2 1.3Dyna-Gro 9922 66 ± 1 13.6 54.5 181 221 34 1.1 10.8 2.7 2.3Progeny 117 65 ± 1 14.0 55.6 176 219 34 1.2 11.2 3.2 1.7USG 3770 65 ± 1 13.7 55.9 174 219 35 1.4 11.0 4.2 2.0Pioneer 26R15 64 ± 1 13.3 52.9 178 220 33 1.1 12.4 3.0 3.0Warren Seed McKay 100 64 ± 1 13.5 53.4 176 219 36 1.1 11.1 2.8 1.7Armor Renegade 64 ± 1 13.7 55.6 181 221 33 1.0 10.5 2.3 2.0Cache River Valley Seed Dixie 940 64 ± 1 13.3 54.3 176 219 36 1.1 10.7 3.3 2.3Croplan Genetics 8868 63 ± 1 13.3 54.2 177 218 34 1.1 11.7 3.0 2.0USG 3555 63 ± 1 13.7 54.9 176 220 30 1.1 12.3 2.3 1.7GA Exp. GA-991336-6E9 63 ± 1 13.9 56.5 175 221 34 1.4 12.6 2.7 1.7Progeny 166 63 ± 1 13.7 54.7 176 220 36 1.1 11.0 3.0 2.0USG 3409 62 ± 1 13.4 54.2 177 219 34 1.2 11.8 3.2 2.3Croplan Genetics 554W 62 ± 1 13.3 54.7 180 219 32 1.1 11.5 3.0 2.0VA Merl 62 ± 1 13.5 56.2 177 220 32 1.1 11.5 2.7 2.0Progeny 185 62 ± 1 13.4 54.7 176 221 33 1.3 11.1 3.0 2.0Syngenta (AgriPro Coker) Oakes 62 ± 1 14.9 56.8 177 220 32 1.2 11.4 2.8 2.0Dyna-Gro V9710 61 ± 1 13.3 54.9 178 217 30 1.0 12.4 3.5 2.3Dyna-Gro V9723 61 ± 1 13.3 54.6 176 219 36 1.3 11.0 3.3 2.0Syngenta (AgriPro Coker) Branson 61 ± 1 14.0 54.5 176 219 32 1.1 11.1 3.5 3.3TN Exp. TN 802 61 ± 1 13.4 54.7 176 218 35 1.5 11.2 3.3 3.0Delta Grow 1600 60 ± 1 13.1 52.3 177 219 35 1.1 11.1 2.8 2.3USG 3665 60 ± 1 13.1 53.7 176 220 35 1.3 12.2 2.7 2.0MO Bess 59 ± 1 13.8 55.5 176 219 35 1.3 11.6 2.5 1.7USG 3209 59 ± 1 13.9 53.1 178 219 31 1.5 11.3 2.7 2.3Cache River Valley Seed Dixie 427 59 ± 1 13.3 52.2 176 218 33 1.5 11.5 3.7 2.0MO Truman 58 ± 1 14.4 53.8 186 223 37 1.2 11.2 1.9 1.0Syngenta (AgriPro Coker) W1377 57 ± 1 14.1 56.5 180 220 34 1.4 11.5 2.3 2.0VA Jamestown 56 ± 1 13.3 56.9 174 218 31 1.1 12.1 3.5 3.0
Average 63 13.6 54.8 177 219 34 1.2 11.5 2.9 2.1† All yields are adjusted to 13.5% moisture. ‡ n = number of environments § Official test weight of No. 2 wheat = 58 lbs/bu. * Protein on a dry weight basis.Lodging = 1 to 5 scale; where 1 = 95% of plants erect; 2.5 = ~50% of plants leaning at angle ≥ 45°; 5 = 95+% of plants leaning at an angle ≥ 45°.Septoria Leaf Blight, Head Scab = 1 to 5 scale; where 1 = no disease; 2.5 = ~50% plant tissue diseased; 5 = 95+% of plant tissue diseased. Maturity (DAP) = Days after planting Septoria Leaf Blight and Head Scab disease ratings taken at the Highland Rim (Springfield, TN) and West Tennessee (Jackson, TN) Research & Education Centers in 2010.
14
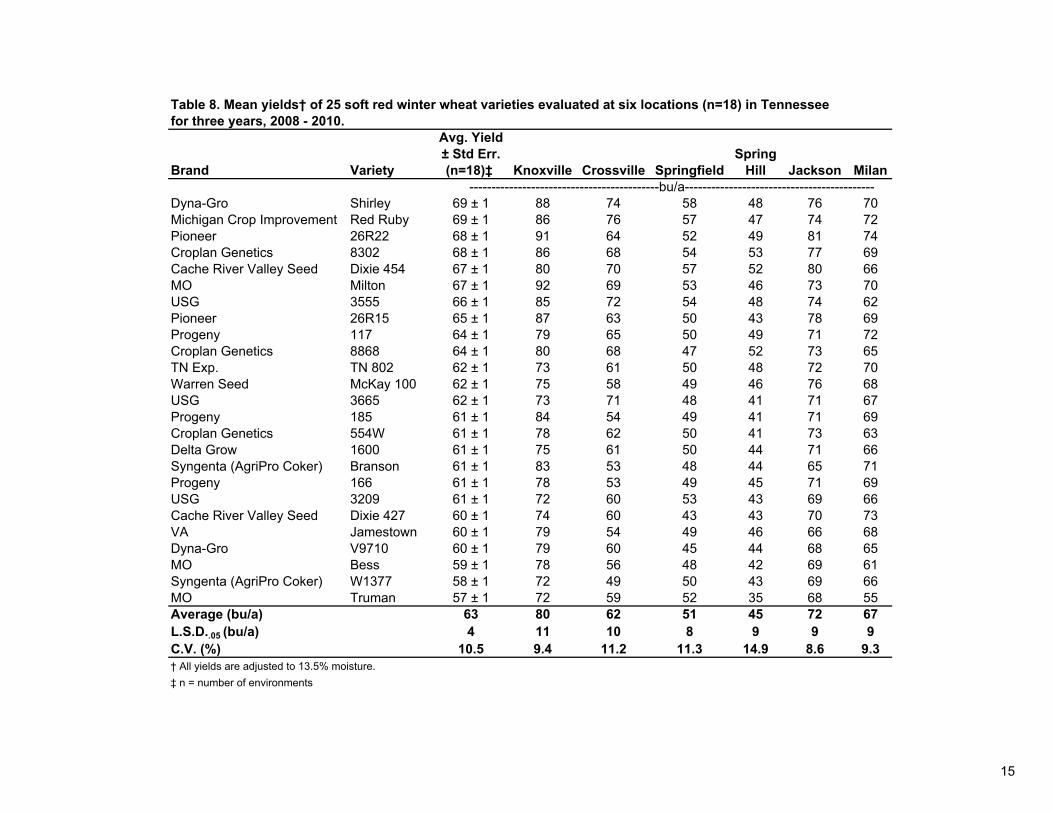
Table 8. Mean yields† of 25 soft red winter wheat varieties evaluated at six locations (n=18) in Tennesseefor three years, 2008 - 2010.
Avg. Yield± Std Err. Spring
Brand Variety (n=18)‡ Knoxville Crossville Springfield Hill Jackson Milan -------------------------------------------bu/a-------------------------------------------
Dyna-Gro Shirley 69 ± 1 88 74 58 48 76 70Michigan Crop Improvement Red Ruby 69 ± 1 86 76 57 47 74 72Pioneer 26R22 68 ± 1 91 64 52 49 81 74Croplan Genetics 8302 68 ± 1 86 68 54 53 77 69Cache River Valley Seed Dixie 454 67 ± 1 80 70 57 52 80 66MO Milton 67 ± 1 92 69 53 46 73 70USG 3555 66 ± 1 85 72 54 48 74 62Pioneer 26R15 65 ± 1 87 63 50 43 78 69Progeny 117 64 ± 1 79 65 50 49 71 72Croplan Genetics 8868 64 ± 1 80 68 47 52 73 65TN Exp. TN 802 62 ± 1 73 61 50 48 72 70Warren Seed McKay 100 62 ± 1 75 58 49 46 76 68USG 3665 62 ± 1 73 71 48 41 71 67Progeny 185 61 ± 1 84 54 49 41 71 69Croplan Genetics 554W 61 ± 1 78 62 50 41 73 63Delta Grow 1600 61 ± 1 75 61 50 44 71 66Syngenta (AgriPro Coker) Branson 61 ± 1 83 53 48 44 65 71Progeny 166 61 ± 1 78 53 49 45 71 69USG 3209 61 ± 1 72 60 53 43 69 66Cache River Valley Seed Dixie 427 60 ± 1 74 60 43 43 70 73VA Jamestown 60 ± 1 79 54 49 46 66 68Dyna-Gro V9710 60 ± 1 79 60 45 44 68 65MO Bess 59 ± 1 78 56 48 42 69 61Syngenta (AgriPro Coker) W1377 58 ± 1 72 49 50 43 69 66MO Truman 57 ± 1 72 59 52 35 68 55Average (bu/a) 63 80 62 51 45 72 67L.S.D..05 (bu/a) 4 11 10 8 9 9 9C.V. (%) 10.5 9.4 11.2 11.3 14.9 8.6 9.3† All yields are adjusted to 13.5% moisture.‡ n = number of environments
15

Table 9. Mean yields† and agronomic characteristics of 25 soft red winter wheat varieties evaluated at six locations (n=18) for three years, 2008 - 2010.
Avg. Yield Test Take All Septoria Head ± Std Err. Moisture Weight§ Heading Maturity Height Lodging Protein Disease Leaf Blight Scab
Brand Variety (n=18)‡ (n=18) (n=4) (n=1) (n=12) (n=18) (n=9) (n=2) (n=1) (n=2) (n=1)bu/a % lbs/bu DAP DAP in. Score % Score Score Score
Dyna-Gro Shirley 69 ± 1 13.4 54.1 181 223 31 1.1 11.3 1.5 2.3 2.7Michigan Crop Improvement Red Ruby 69 ± 1 13.2 54.6 176 223 34 1.1 11.6 1.2 2.2 1.7Pioneer 26R22 68 ± 1 13.4 54.9 174 221 34 1.3 10.9 1.0 2.7 1.7Croplan Genetics 8302 68 ± 1 13.7 55.9 178 222 34 1.1 11.5 1.2 3.0 2.7Cache River Valley Seed Dixie 454 67 ± 1 13.9 57.2 176 224 34 1.2 12.2 2.2 2.7 1.3MO Milton 67 ± 1 13.6 56.3 177 222 35 1.2 12.4 1.5 2.8 2.0USG 3555 66 ± 1 13.8 55.7 176 222 30 1.2 12.3 1.3 2.3 1.7Pioneer 26R15 65 ± 1 13.3 54.2 178 223 33 1.1 12.4 1.0 3.0 3.0Progeny 117 64 ± 1 13.9 55.8 176 221 35 1.2 11.2 1.5 3.2 1.7Croplan Genetics 8868 64 ± 1 13.3 55.5 177 221 34 1.1 11.7 1.8 3.0 2.0TN Exp. TN 802 62 ± 1 13.6 55.3 176 221 36 1.5 11.2 1.2 3.3 3.0Warren Seed McKay 100 62 ± 1 13.6 54.3 176 221 36 1.1 11.1 2.2 2.8 1.7USG 3665 62 ± 1 13.3 54.9 176 222 35 1.2 12.2 1.5 2.7 2.0Progeny 185 61 ± 1 13.5 55.3 176 223 33 1.2 11.1 1.5 3.0 2.0Croplan Genetics 554W 61 ± 1 13.3 55.0 180 222 32 1.1 11.5 2.3 3.0 2.0Delta Grow 1600 61 ± 1 13.3 54.1 177 222 34 1.1 11.1 1.5 2.8 2.3Syngenta (AgriPro Coker) Branson 61 ± 1 14.0 54.6 176 221 32 1.1 11.1 2.2 3.5 3.3Progeny 166 61 ± 1 13.8 54.9 176 222 37 1.1 11.0 1.7 3.0 2.0USG 3209 61 ± 1 14.0 54.0 178 222 31 1.5 11.3 2.8 2.7 2.3Cache River Valley Seed Dixie 427 60 ± 1 13.6 53.2 176 221 33 1.4 11.5 1.3 3.7 2.0VA Jamestown 60 ± 1 13.5 57.4 174 221 31 1.1 12.1 1.0 3.5 3.0Dyna-Gro V9710 60 ± 1 13.4 55.0 178 220 30 1.0 12.4 2.5 3.5 2.3MO Bess 59 ± 1 13.8 55.4 176 221 35 1.2 11.6 2.2 2.5 1.7Syngenta (AgriPro Coker) W1377 58 ± 1 14.1 57.2 180 222 34 1.3 11.5 1.2 2.3 2.0MO Truman 57 ± 1 14.2 54.7 186 225 37 1.2 11.2 2.0 1.9 1.0
Average 63 13.6 55.2 177 222 34 1.2 11.6 1.6 2.9 2.1† All yields are adjusted to 13.5% moisture.‡ n = number of environments § Official test weight of No. 2 wheat = 58 lbs/bu.Maturity (DAP) = Days after plantingLodging = 1 to 5 scale; where 1 = 95% of plants erect; 2.5 = ~50% of plants leaning at angle ≥ 45°; 5 = 95+% of plants leaning at an angle ≥ 45°.* Protein on a dry weight basis.Take All Disease - 1 to 5 scale; where 1 = 95% of plants non-infected; 2.5 = ~50% of plants infected; 5 = 95+% of plants infected. Take All Disease ratings taken at the East Tennessee Research & Education Center, Knoxville, TN in 2008.Septoria Leaf Blight, Head Scab = 1 to 5 scale; where 1 = no disease; 2.5 = ~50% plant tissue diseased; 5 = 95+% of plant tissue diseased. Septoria Leaf Blight and Head Scab disease ratings taken at the Highland Rim (Springfield, TN) and West Tennessee (Jackson, TN) Research & Education Centers in 2010.
16

-------------------------------------------- Oats ---------------------------------------------
Results
A fall seeded oat test was conducted at the East TN (Knoxville) and Middle TN (Spring Hill) Research and Education Centers (REC) during 2009-2010 on 23 winter oat varieties / breeding lines. The average yield of the 23 oat entries was 84 bu/a, ranging from 66 to 109 bu/a. Test weights ranged from 30.7 to 39.0 lbs/bu. The official test weight for oats is 36 lbs/bu. A moderate amount of winter injury occurred on some of the breeding lines at Knoxville, reducing overall stands for those lines. Nine of the 23 varieties have been evaluated over the two year period 2009 - 2010. Six of the 23 varieties have been evaluated over the three year period 2008 – 2010.
17
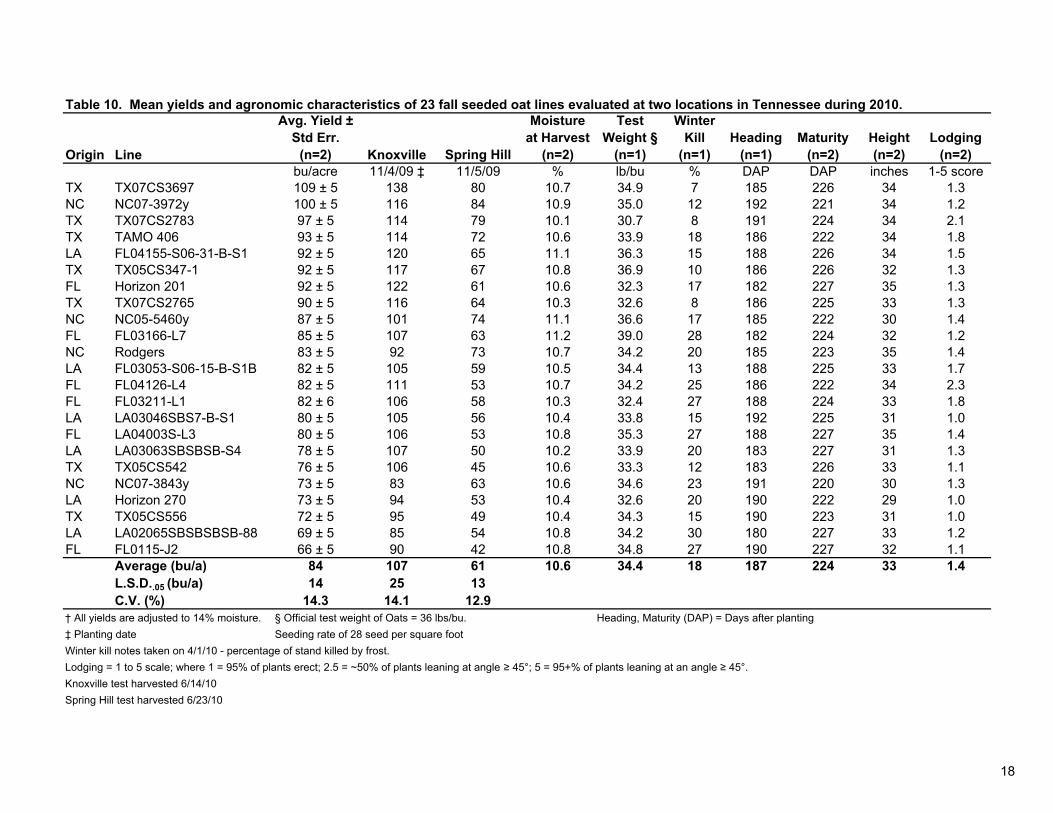
Table 10. Mean yields and agronomic characteristics of 23 fall seeded oat lines evaluated at two locations in Tennessee during 2010.
Origin Line
Avg. Yield ± Std Err.
(n=2) Knoxville Spring Hill
Moisture at Harvest
(n=2)
Test Weight §
(n=1)
Winter Kill
(n=1)Heading
(n=1)Maturity
(n=2)Height (n=2)
Lodging (n=2)
bu/acre 11/4/09 ‡ 11/5/09 % lb/bu % DAP DAP inches 1-5 scoreTX TX07CS3697 109 ± 5 138 80 10.7 34.9 7 185 226 34 1.3NC NC07-3972y 100 ± 5 116 84 10.9 35.0 12 192 221 34 1.2TX TX07CS2783 97 ± 5 114 79 10.1 30.7 8 191 224 34 2.1TX TAMO 406 93 ± 5 114 72 10.6 33.9 18 186 222 34 1.8LA FL04155-S06-31-B-S1 92 ± 5 120 65 11.1 36.3 15 188 226 34 1.5TX TX05CS347-1 92 ± 5 117 67 10.8 36.9 10 186 226 32 1.3FL Horizon 201 92 ± 5 122 61 10.6 32.3 17 182 227 35 1.3TX TX07CS2765 90 ± 5 116 64 10.3 32.6 8 186 225 33 1.3NC NC05-5460y 87 ± 5 101 74 11.1 36.6 17 185 222 30 1.4FL FL03166-L7 85 ± 5 107 63 11.2 39.0 28 182 224 32 1.2NC Rodgers 83 ± 5 92 73 10.7 34.2 20 185 223 35 1.4LA FL03053-S06-15-B-S1B 82 ± 5 105 59 10.5 34.4 13 188 225 33 1.7FL FL04126-L4 82 ± 5 111 53 10.7 34.2 25 186 222 34 2.3FL FL03211-L1 82 ± 6 106 58 10.3 32.4 27 188 224 33 1.8LA LA03046SBS7-B-S1 80 ± 5 105 56 10.4 33.8 15 192 225 31 1.0FL LA04003S-L3 80 ± 5 106 53 10.8 35.3 27 188 227 35 1.4LA LA03063SBSBSB-S4 78 ± 5 107 50 10.2 33.9 20 183 227 31 1.3TX TX05CS542 76 ± 5 106 45 10.6 33.3 12 183 226 33 1.1NC NC07-3843y 73 ± 5 83 63 10.6 34.6 23 191 220 30 1.3LA Horizon 270 73 ± 5 94 53 10.4 32.6 20 190 222 29 1.0TX TX05CS556 72 ± 5 95 49 10.4 34.3 15 190 223 31 1.0LA LA02065SBSBSBSB-88 69 ± 5 85 54 10.8 34.2 30 180 227 33 1.2FL FL0115-J2 66 ± 5 90 42 10.8 34.8 27 190 227 32 1.1
Average (bu/a) 84 107 61 10.6 34.4 18 187 224 33 1.4L.S.D..05 (bu/a) 14 25 13C.V. (%) 14.3 14.1 12.9
† All yields are adjusted to 14% moisture. § Official test weight of Oats = 36 lbs/bu. Heading, Maturity (DAP) = Days after planting‡ Planting date Seeding rate of 28 seed per square footWinter kill notes taken on 4/1/10 - percentage of stand killed by frost.Lodging = 1 to 5 scale; where 1 = 95% of plants erect; 2.5 = ~50% of plants leaning at angle ≥ 45°; 5 = 95+% of plants leaning at an angle ≥ 45°.Knoxville test harvested 6/14/10Spring Hill test harvested 6/23/10
18
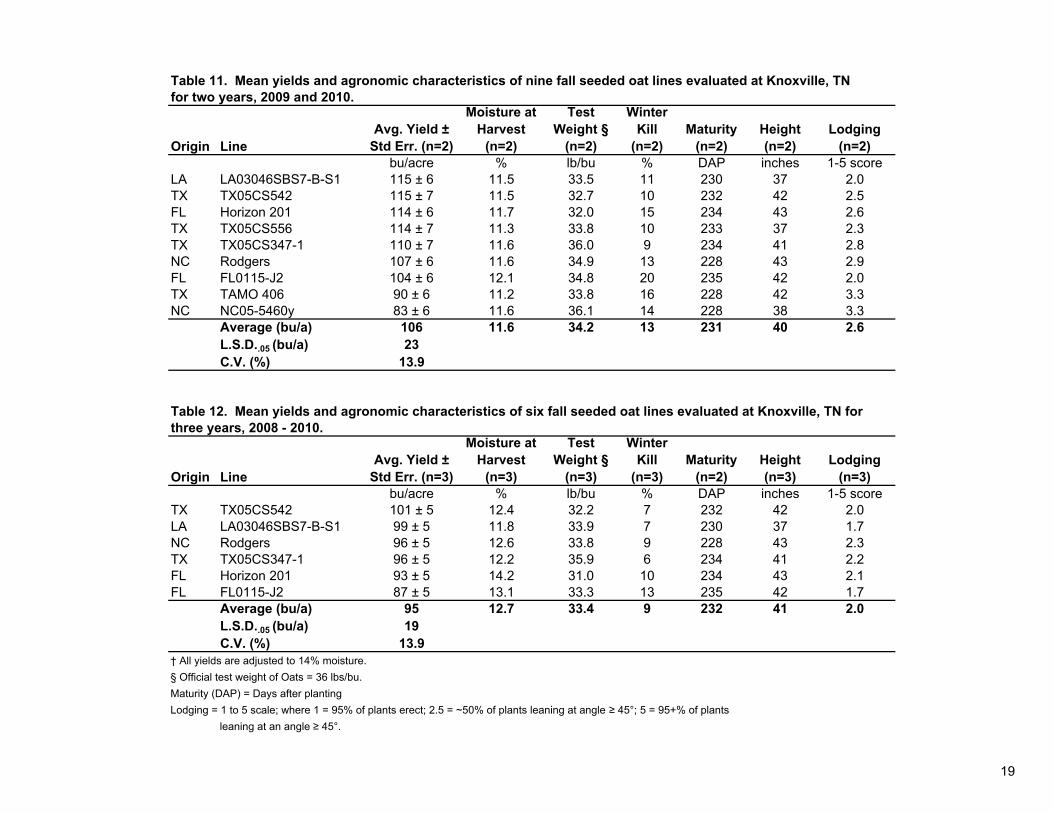
Table 11. Mean yields and agronomic characteristics of nine fall seeded oat lines evaluated at Knoxville, TNfor two years, 2009 and 2010.
Origin LineAvg. Yield ±
Std Err. (n=2)
Moisture at Harvest
(n=2)
Test Weight §
(n=2)
Winter Kill
(n=2)Maturity
(n=2)Height (n=2)
Lodging (n=2)
bu/acre % lb/bu % DAP inches 1-5 scoreLA LA03046SBS7-B-S1 115 ± 6 11.5 33.5 11 230 37 2.0TX TX05CS542 115 ± 7 11.5 32.7 10 232 42 2.5FL Horizon 201 114 ± 6 11.7 32.0 15 234 43 2.6TX TX05CS556 114 ± 7 11.3 33.8 10 233 37 2.3TX TX05CS347-1 110 ± 7 11.6 36.0 9 234 41 2.8NC Rodgers 107 ± 6 11.6 34.9 13 228 43 2.9FL FL0115-J2 104 ± 6 12.1 34.8 20 235 42 2.0TX TAMO 406 90 ± 6 11.2 33.8 16 228 42 3.3NC NC05-5460y 83 ± 6 11.6 36.1 14 228 38 3.3
Average (bu/a) 106 11.6 34.2 13 231 40 2.6L.S.D..05 (bu/a) 23C.V. (%) 13.9
Table 12. Mean yields and agronomic characteristics of six fall seeded oat lines evaluated at Knoxville, TN forthree years, 2008 - 2010.
Origin LineAvg. Yield ±
Std Err. (n=3)
Moisture at Harvest
(n=3)
Test Weight §
(n=3)
Winter Kill
(n=3)Maturity
(n=2)Height (n=3)
Lodging (n=3)
bu/acre % lb/bu % DAP inches 1-5 scoreTX TX05CS542 101 ± 5 12.4 32.2 7 232 42 2.0LA LA03046SBS7-B-S1 99 ± 5 11.8 33.9 7 230 37 1.7NC Rodgers 96 ± 5 12.6 33.8 9 228 43 2.3TX TX05CS347-1 96 ± 5 12.2 35.9 6 234 41 2.2FL Horizon 201 93 ± 5 14.2 31.0 10 234 43 2.1FL FL0115-J2 87 ± 5 13.1 33.3 13 235 42 1.7
Average (bu/a) 95 12.7 33.4 9 232 41 2.0L.S.D..05 (bu/a) 19C.V. (%) 13.9
† All yields are adjusted to 14% moisture.§ Official test weight of Oats = 36 lbs/bu.Maturity (DAP) = Days after plantingLodging = 1 to 5 scale; where 1 = 95% of plants erect; 2.5 = ~50% of plants leaning at angle ≥ 45°; 5 = 95+% of plants
leaning at an angle ≥ 45°.
19
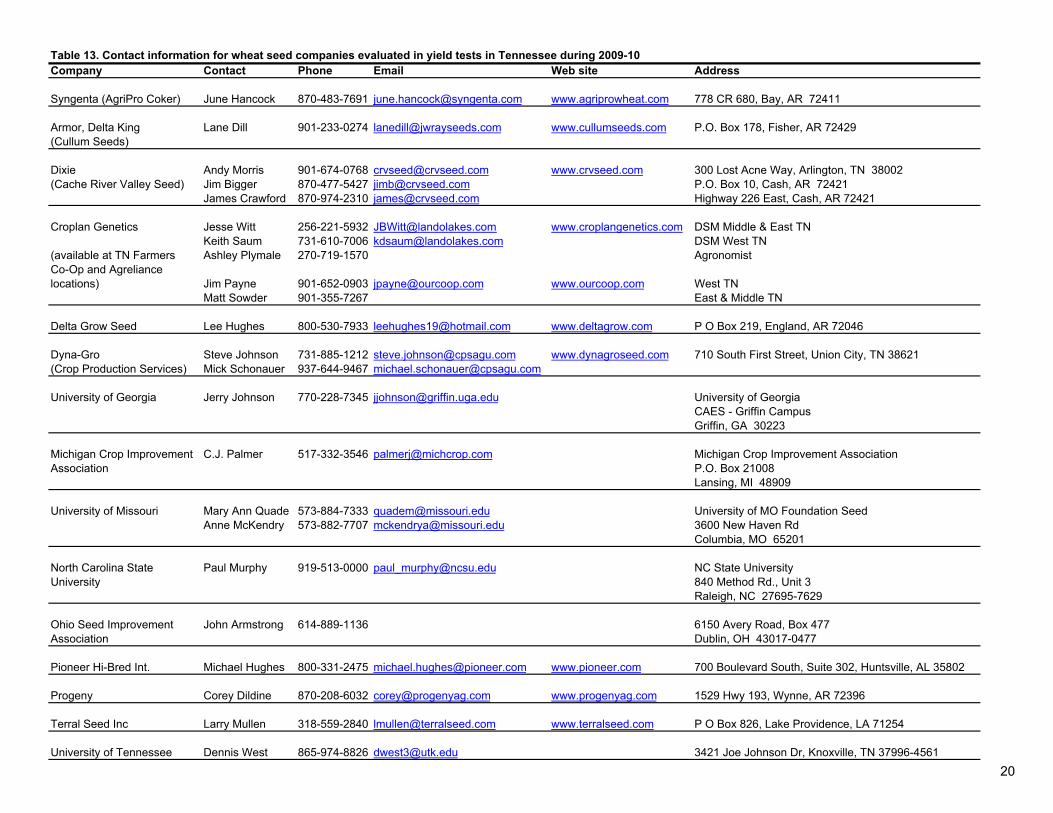
Table 13. Contact information for wheat seed companies evaluated in yield tests in Tennessee during 2009-10Company Contact Phone Email Web site Address
Syngenta (AgriPro Coker) June Hancock 870-483-7691 [email protected] www.agriprowheat.com 778 CR 680, Bay, AR 72411
Armor, Delta King Lane Dill 901-233-0274 [email protected] www.cullumseeds.com P.O. Box 178, Fisher, AR 72429(Cullum Seeds)
Dixie Andy Morris 901-674-0768 [email protected] www.crvseed.com 300 Lost Acne Way, Arlington, TN 38002(Cache River Valley Seed) Jim Bigger 870-477-5427 [email protected] P.O. Box 10, Cash, AR 72421
James Crawford 870-974-2310 [email protected] Highway 226 East, Cash, AR 72421
Croplan Genetics Jesse Witt 256-221-5932 [email protected] www.croplangenetics.com DSM Middle & East TNKeith Saum 731-610-7006 [email protected] DSM West TN
(available at TN Farmers Ashley Plymale 270-719-1570 AgronomistCo-Op and Agreliance locations) Jim Payne 901-652-0903 [email protected] www.ourcoop.com West TN
Matt Sowder 901-355-7267 East & Middle TN
Delta Grow Seed Lee Hughes 800-530-7933 [email protected] www.deltagrow.com P O Box 219, England, AR 72046
Dyna-Gro Steve Johnson 731-885-1212 [email protected] www.dynagroseed.com 710 South First Street, Union City, TN 38621(Crop Production Services) Mick Schonauer 937-644-9467 [email protected]
University of Georgia Jerry Johnson 770-228-7345 [email protected] University of GeorgiaCAES - Griffin CampusGriffin, GA 30223
Michigan Crop Improvement C.J. Palmer 517-332-3546 [email protected] Michigan Crop Improvement AssociationAssociation P.O. Box 21008
Lansing, MI 48909
University of Missouri Mary Ann Quade 573-884-7333 [email protected] University of MO Foundation SeedAnne McKendry 573-882-7707 [email protected] 3600 New Haven Rd
Columbia, MO 65201
North Carolina State Paul Murphy 919-513-0000 [email protected] NC State UniversityUniversity 840 Method Rd., Unit 3
Raleigh, NC 27695-7629
Ohio Seed Improvement John Armstrong 614-889-1136 6150 Avery Road, Box 477Association Dublin, OH 43017-0477
Pioneer Hi-Bred Int. Michael Hughes 800-331-2475 [email protected] www.pioneer.com 700 Boulevard South, Suite 302, Huntsville, AL 35802
Progeny Corey Dildine 870-208-6032 [email protected] www.progenyag.com 1529 Hwy 193, Wynne, AR 72396
Terral Seed Inc Larry Mullen 318-559-2840 [email protected] www.terralseed.com P O Box 826, Lake Providence, LA 71254
University of Tennessee Dennis West 865-974-8826 [email protected] 3421 Joe Johnson Dr, Knoxville, TN 37996-4561
20
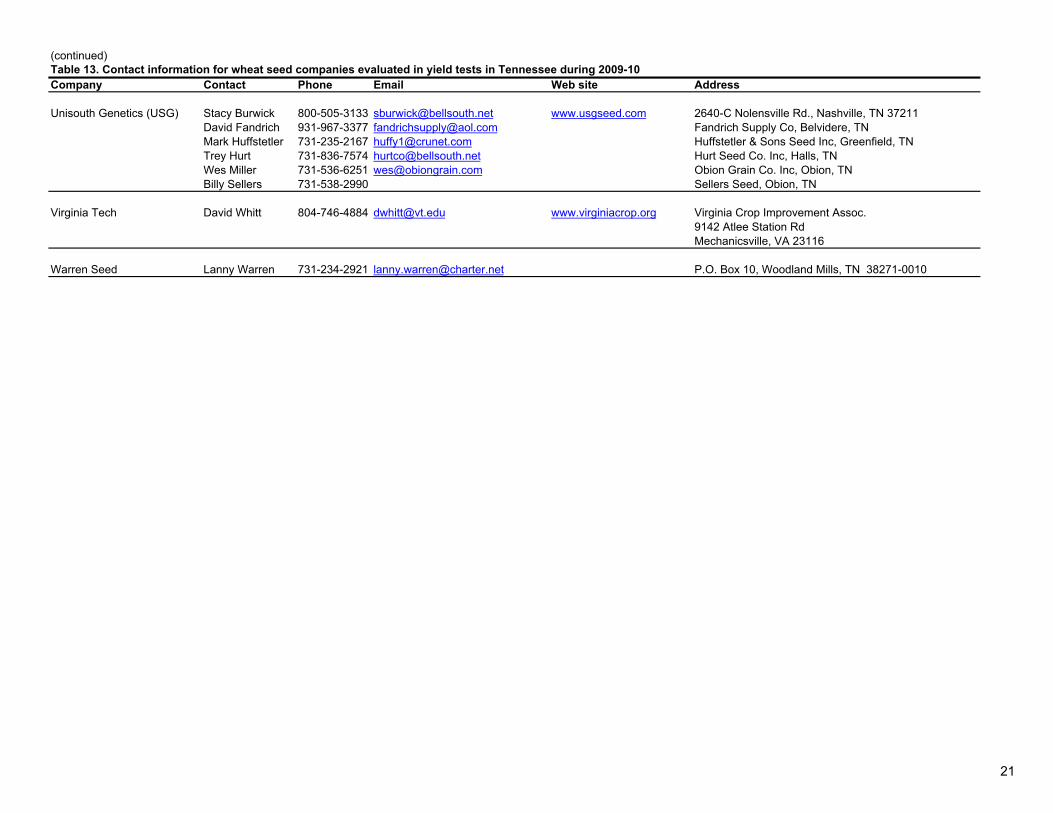
(continued)Table 13. Contact information for wheat seed companies evaluated in yield tests in Tennessee during 2009-10Company Contact Phone Email Web site Address
Unisouth Genetics (USG) Stacy Burwick 800-505-3133 [email protected] www.usgseed.com 2640-C Nolensville Rd., Nashville, TN 37211David Fandrich 931-967-3377 [email protected] Fandrich Supply Co, Belvidere, TNMark Huffstetler 731-235-2167 [email protected] Huffstetler & Sons Seed Inc, Greenfield, TNTrey Hurt 731-836-7574 [email protected] Hurt Seed Co. Inc, Halls, TNWes Miller 731-536-6251 [email protected] Obion Grain Co. Inc, Obion, TNBilly Sellers 731-538-2990 Sellers Seed, Obion, TN
Virginia Tech David Whitt 804-746-4884 [email protected] www.virginiacrop.org Virginia Crop Improvement Assoc.9142 Atlee Station RdMechanicsville, VA 23116
Warren Seed Lanny Warren 731-234-2921 [email protected] P.O. Box 10, Woodland Mills, TN 38271-0010
21