when a movement becomes a party: the 2015 barcelona city council election
DESCRIPTION
Barcelona en Comu ́, an emerging grassroots movement-party, won the 2015 Barcelona City Council election. This candidacy was devised by activists involved in the 15M movement in order to turn citizen outrage into political change. On the one hand, the 15M movement is based on a decentralized structure. On the other hand, political science literature postulates that parties historically develop oligarchical leadership struc- tures. This tension motivates us to examine whether Barcelona en Comu ́ preserved a decentralizated structure or adopted a conventional central- ized organization. In this article we analyse the Twitter networks of the parties that ran for this election by measuring their hierarchical struc- ture, information efficiency and social resilience. Our results show that in Barcelona en Comu ́ two well-defined groups co-exist: a cluster dominated by the leader and the collective accounts, and another cluster formed by the movement activists. While the former group is highly centralized like the other major parties, the latter one stands out for its decentralized, cohesive and resilient structure.TRANSCRIPT
When a Movement Becomes a Party:
The 2015 Barcelona City Council Election
Pablo Aragon, Yana Volkovich, David Laniado, Andreas Kaltenbrunner
Eurecat, Spain{name.surname}@eurecat.org
July 31, 2015
Abstract
Barcelona en Comu, an emerging grassroots movement-party, won the2015 Barcelona City Council election. This candidacy was devised byactivists involved in the 15M movement in order to turn citizen outrageinto political change. On the one hand, the 15M movement is based ona decentralized structure. On the other hand, political science literaturepostulates that parties historically develop oligarchical leadership struc-tures. This tension motivates us to examine whether Barcelona en Comupreserved a decentralizated structure or adopted a conventional central-ized organization. In this article we analyse the Twitter networks of theparties that ran for this election by measuring their hierarchical struc-ture, information efficiency and social resilience. Our results show that inBarcelona en Comu two well-defined groups co-exist: a cluster dominatedby the leader and the collective accounts, and another cluster formed bythe movement activists. While the former group is highly centralized likethe other major parties, the latter one stands out for its decentralized,cohesive and resilient structure.
Keywords: Online Politics, Networked Social Movements, Party Organization
1 Introduction
In the last years a new global wave of citizen protests has emerged: the ArabSpring, the 15M movement in Spain, Occupy Wall Street, #YoSoy132 in Mexico,Occupy Gezi in Turkey, the Brazilian movement #VemPraRua, Occupy Centralin Hong Kong, etc. All these movements share common characteristics such asthe claim for new models of democracy, the strategic usage of social media (e.gTwitter), and the occupation of physical spaces. All of them have encountereddifficulties in modifying the institutional agenda and, hence, the public policies.The 2015 Barcelona City Council election is one of the first cases in which oneof these movements has got to “occupy” the public institutions by buildingBarcelona en Comu (BeC), a political party that won the elections. BeC wasconceived as the confluence of (1) minor and/or emerging parties and, to alarge extent, (2) collectives and activists, with no political party affiliation, whoplayed a prominent role in the 15M movement.
1
arX
iv:1
507.
0859
9v1
[cs
.SI]
30
Jul 2
015

The 15M movement, also referred to as #SpanishRevolution or the “Indig-nados” Movement, emerged in May 2011 and has been defined as a “networkedsocial movement of the digital age” [1]. Networked social movements, like theArab Spring, the 15M and Occupy Wall Street, are claimed to be “a networkof networks, they can afford not to have an identifiable centre, and yet ensurecoordination functions, as well as deliberation, by interaction between multiplenodes” [1]. Other authors have formulated similar hypotheses when definingthis new model of social movement as a “change from logic of collective action,associated with high levels of organizational resources and the formation of col-lective identities, to a logic of connective action, based on personalized contentsharing across media networks” [2]. We should note that some voices have re-fused these theoretical assumptions and argued that “a handful of people controlmost of the communication flow” and, consequently, the existence of leaders insuch movements could not be denied [3]. Empirical studies revealed that the15M network on Twitter is characterised by its “decentralized structure, basedon coalitions of smaller organizations” in spite of “a small core of central users isstill critical to trigger chains of messages of high orders of magnitude” [4]. De-centralization has been also observed in [5] in which the 15M network is definedas open and polycentric.
The 15M network properties (i.e. decentralization, openness, polycentrism)could be perceived as a striking contrast to conventional political organizations,in particular, political parties. The Iron Law of Oligarchy [6] postulates thatpolitical parties, like any complex organization, self-generate an elite (i.e. “Whosays organization, says oligarchy”). Although some scholars have criticised theidea that organizations will intrinsically build oligarchical leadership structures[7, 8, 9], many political and social theorists have supported that, historically,small minorities hold the most power in political processes [10, 11, 12]. Regard-ing Spanish politics, a study of the 2011 national election campaign on Twitterrevealed that “minor and new parties tend to be more clustered and betterconnected, which implies a more cohesive community” [13]. Nevertheless, allthe difussion networks of parties in that study were strongly centralized aroundtheir candidate and/or party profiles. Later studies analysed the interactionson Twitter between the 15M nodes and political parties and conclude that net-worked social movements are para-institutions: perceived as institutions butpreserving an internal networked organization [14]. However, these conclusionswere formulated by analysing the networks when no elections were held, beforeinstitutionalisation began. Election campaigns are competitive processes thatmight favor the centralization of an organization around candidates. Indeed, ithas been proved that the network properties of political parties change whenelections arrive [15].
Given that Barcelona en Comu emerged from the 15M and this networkedmovement is characterised by a decentralized structure, the research question ofthis study is the following: Has Barcelona en Comu preserved a decentralizatedstructure or has it adopted into a conventional centralized organization ruled byan elite?
Previous hypotheses [16] about Podemos, a member party of the Barcelonaen Comu candidacy and also inspired by the 15M movement, postulate an orga-nization formed by a front-end (“spokesmen/spokeswomen who are visible fromthe media perspective”) and a back-end (“muscle of the organization, barelyvisible from the media perspective”). Per contra, there are no empirical vali-
2

dations of this hypothesis. We strongly believe that the answer to the aboveresearch question will provide relevant insights into the institutionalisation ofthese new paradigm of social movements.
Motivated by our research question, we aim to characterise the social struc-tures of Barcelona en Comu by comparing its diffusion network on Twitter to theones of the other political parties running for this election. The identification ofthe sub-network corresponding to each party is made possible by the highly di-vided partisan structure of the information diffusion network. This assumptionrelies on previous studies of political discussions in social media [17, 18]. Recentresearch in data-driven political science has revealed the recurrent existenceof boundaries between ideological online communities, in particular, politicalparties. A study of the 2004 U.S. Presidential election depicted a divided blo-gosphere in which liberals and conservatives barely generated links between thetwo communities [17]. Similarly, the network of retweets for the 2010 U.S. con-gressional midterm elections exhibited a highly segregated partisan structurewhere connections between left- and right-leaning users were extremely lim-ited [18]. Both studies have been taken as relevant empirical validations of theso-called cyber-balkanization, a social phenomenon that occurs when Internetusers form isolated groups around specific interests, e.g. politics. This conceptis closely related to the idea of echo chambers, in which people are “mainly lis-tening to louder echoes of their own voices” [19] and, therefore, reinforce divisionin social media. Indeed, online polarization is not only a particular feature ofU.S. politics but also a social behaviour observed in a diverse range of countries,e.g. Canada [20] and Germany [21]. In Spain, previous studies of the Twitternetworks related to recent elections also showed evidence of online polarization,e.g. in the 2010 Catalan election [22] and in the 2011 Spanish elections [13, 23].
In this study, we first measure the polarization of the network, detect theonline difussion sub-network of each party, and identify the users who buildbridges between these clusters. Then, we analyse the diffusion networks of eachof the detected clusters to characterise the social structure of the correspondingparties. The analysis of the social structures extenses the framework introducedin [15] which focuses on three dimensions: hierarchical structure, effective diffu-sion and social resilience.
2 Data preparation
Here, we describe the construction of the network of retweets and introducea data-driven framework to extract the clusters corresponding to the politicalparties.
2.1 Network construction
Data were collected from Twitter in relation to the campaign for the 2015Barcelona City Council election (May 1-26, 2015). We defined a list of Twit-ter accounts of the seven main political parties: Barcelona en Comu (BeC)1,
1 http://en.wikipedia.org/wiki/Barcelona_en_Com%C3%BA
3

Table 1: Twitter accounts of the selected political parties and candidates.Political Party / Coalition Party account(s) Candidate account
BeC
@bcnencomu@icveuiabcn@podem bcn@equobcn@pconstituentbcn
@adacolau
CiU@cdcbarcelona@uniobcn
@xaviertrias
Cs @cs bcna @carinamejias
CUP@capgirembcn@cupbarcelona
@mjlecha
ERC @ercbcn @alfredboschPP @ppbarcelona @albertofdezxbcnPSC @pscbarcelona @jaumecollboni
Convergencia i Unio (CiU)2, Ciudadanos (Cs)3, Capgirem Barcelona (CUP)4,Esquerra Republicana de Catalunya5, Partit Popular de Catalunya (PP)6, andPartit dels Socialistes de Catalunya (PSC)7. We also added the Twitter ac-counts for corresponding candidates for Mayor and each member party for thecoalitions CiU, BeC and CUP. The users of that list can be found in Table 1.From the Twitter Streaming API, we extracted 373,818 retweets of tweets that(1) were created by, (2) were retweeted by, or (3) mentioned a user from thelist.
From this collection of retweets, we built a directed weighted graph com-prising a set of nodes (users) and a set of edges (retweets between any pair ofusers). The weight of each edge was the number of retweets from the sourcenode to the target node. To exclude anecdotal interactions between users andhighlight the structure of the expected clusters, we only kept the interactionsbetween any pair of nodes that occurred at least 3 times: an edge from user Ato user B implied that user A has retweeted at least three times user B in ourdataset. Nodes without edges after this process were removed. The resultingnetwork comprises 6,492 nodes and 16,775 edges.
2.2 Community detection
Traditionally, community detection is performed by applying a clustering algo-rithm. We chose the Louvain method [24] which is commonly used because of itshigh performance in terms of efficiency and accuracy. Like many clustering al-gorithms, however, this method results into problems when defining boundariesbetween clusters: it assigns each node to one cluster, and also nodes that do notstrongly belong to any cluster are assigned to one. The algorithm’s outcomedepends on the particular execution that is considered. This means that a node
2 http://en.wikipedia.org/wiki/Convergence_and_Union3 http://en.wikipedia.org/wiki/Citizens_(Spanish_political_party)4 http://en.wikipedia.org/wiki/Popular_Unity_Candidates5 http://en.wikipedia.org/wiki/Republican_Left_of_Catalonia6 http://en.wikipedia.org/wiki/People%27s_Party_of_Catalonia7 http://en.wikipedia.org/wiki/Socialists%27_Party_of_Catalonia
4
that appears to belong to a certain cluster could fall in another cluster if we runthe algorithm another time. To solve this issue, we have designed an adaptedversion of the Louvain method: the algorithm is executed several times, andonly the nodes that fall into the same cluster during the large majority of theseexecutions are assigned to it.
We first executed the standard Louvain method and found 151 clusters andachieved a modularity value of 0.727. From Figure S1 in Supporting InformationSection we observed a clear difference between the 8 largest clusters (size ∈[232, 1981]) and the remaining 143 clusters (size ∈ [2, 62]). In order to labelthese 8 clusters, we manually inspected the most relevant users from each clusteraccording to their PageRank value within the full network (the top five usersfor each cluster are listed in Table 2). The results indicate that the communitydetection method identified a single cluster for almost each party: BeC = c1, c4;ERC = c2; CUP = c3; Cs = c5; CiU = c6; PP = c7 and PSC = c8. The onlyexception for such rule is that BeC is composed of two clusters. The manualinspection of the users from these two clusters revealed that cluster c1 is formedby the official accounts of the party (e.g. @bcnencomu, @ahorapodemos), alliedparties (e.g. @ahoramadrid), the candidate (@adacolau) and a large communityof peripheral users. Cluster c4 is composed of activists engaged in the digitalcommunication for the campaign (e.g. @toret, @santidemajo, @galapita). Thatis to say that the most visible accounts from the media perspective belong toc1 while c4 is formed by party activists, many of them related to the 15Mmovement. For this reason, from now on, we distinguish these clusters as “BeC-p” and “BeC-m”, party and movement respectively.
Furthermore, we found a remarkable presence of accounts related to mediain Table 2 for almost every cluster. As we noted above, we aim to study theecosystem of each political party, i.e including only nodes that are reliably as-signed to them. To this end, we applied the adapted version of the Louvainmethod that is described in Section S2.1.2: we ran the algorithm 100 times andassigned to each cluster only the nodes that fell into that cluster more than 95times. By inspecting the results of the 100 executions, we found the presence of8 major clusters, much bigger than the others, as a constant element. The com-position of these clusters is also quite stable: 4,973 nodes (82.25%) are assignedto the same cluster in over 95 executions.
Among the remaining nodes, which could not be reliably assigned to anyof the major clusters, we find that many accounts are media. We additionallyidentified the most relevant users, according to PageRank, in the sub-networkformed only by edges between nodes from different clusters (i.e. “weak ties”[25]). Table S1 presents the 25 most relevant users in this sub-network andconfirms that media played a key role in connecting different clusters.
3 Results
So far we have described the way diffussion network was constructed and theways it was divided into cluster corresponding to major political parties. Forthe next steps we focus on polarization of the network during the campaign andcompare structural peculiarities of the largest clusters in the following dimen-sions: hierarchical structure, effective difussion, and social resilience.
5

Table 2: Top 5 users for the 8 largest clusters according to their PageRank valuewithin the full network (clusters are ordered by size).
Cluster id Cluster label User PageRank Role
c1 BeC-p @bcnencomu 0.092 BeC party accountc1 BeC-p @adacolau 0.029 BeC candidatec1 BeC-p @ahoramadrid 0.009 BeC allied party accountc1 BeC-p @ahorapodemos 0.009 BeC member party accountc1 BeC-p @elperiodico 0.005 media
c2 ERC @ercbcn 0.016 ERC party accountc2 ERC @alfredbosch 0.011 ERC candidatec2 ERC @naciodigital 0.009 mediac2 ERC @arapolitica 0.007 mediac2 ERC @esquerra erc 0.004 ERC party account
c3 CUP @cupbarcelona 0.016 CUP party accountc3 CUP @capgirembcn 0.008 CUP party accountc3 CUP @albertmartnez 0.005 mediac3 CUP @encampanya 0.003 mediac3 CUP @mjlecha 0.002 CUP candidate
c4 BeC-m @toret 0.014 BeC memberc4 BeC-m @santidemajo 0.005 BeC memberc4 BeC-m @sentitcritic 0.005 mediac4 BeC-m @galapita 0.005 BeC memberc4 BeC-m @eloibadia 0.005 BeC member
c5 Cs @carinamejias 0.007 Cs candidatec5 Cs @cs bcna 0.006 Cs party accountc5 Cs @ciudadanoscs 0.004 Cs party accountc5 Cs @soniasi02 0.003 Cs memberc5 Cs @prensacs 0.002 media
c6 CiU @xaviertrias 0.012 CiU candidatec6 CiU @ciu 0.004 CiU party accountc6 CiU @bcn ajuntament 0.003 institutionalc6 CiU @ramontremosa 0.002 CiU memberc6 CiU @cdcbarcelona 0.002 CiU party account
c7 PP @btvnoticies 0.011 mediac7 PP @cati bcn 0.003 mediac7 PP @albertofdezxbcn 0.003 PP candidatec7 PP @maticatradio 0.002 mediac7 PP @ppbarcelona 0.002 PP party account
c8 PSC @elsmatins 0.006 mediac8 PSC @pscbarcelona 0.003 PSC party accountc8 PSC @sergifor 0.003 mediac8 PSC @jaumecollboni 0.002 PSC candidatec8 PSC @elpaiscat 0.002 media
3.1 Polarization
Similar to the previous findings for online political networks we detected a highlevel of polarization when calculated modularity (Q = 0.727) for the first execu-tion of standard Louvain method as described before. The boundaries betweenideological online communities are visible in Figure 1, where we visualized theresulting graph partitioning for N = 100 and ε = 0.05. For a better readabil-
6

ity of the network, we only considered the giant component of the graph andapplied the Force Atlas 2 layout algorithm [26] to enforce cluster graph drawing.
As one could expected in any polarized scenario, the largest number of inter-action links happened within the same cluster. There were however a notablylarge number of links between the two clusters of BeC (BeC-p and BeC-m). Tofurther prove the low levels of interactions between major parties we made aninteraction matrix A, where Ai,j counts all retweets that accounts assigned tocluster i made for the tweets from users of cluster j. Since the clusters are ofthe different size, we then normalized Ai,j ’s by the sum of the all retweets madeby the users assigned to cluster i. From Figure 2, where we draw matrix A, weconfirmed that a vast majority of retweets were made between users from thesame cluster (main diagonal). For Barcelona en Comu we found a presence ofcommunication between movement and party clusters with a prevalence fromBeC-m to BeC-p (0.18, the largest value out of the main diagonal).
3.2 Structure of the party clusters
Inspired by the framework introduced in [15] we proposed to compare the topol-ogy of the intra-network of each cluster in terms of hierarchical structure, infor-mation efficiency, and social resilience.
3.2.1 Hierarchical structure
To evaluate the hierarchical structure we measured the in-degree inequality ofeach cluster based on the Gini coefficient. We also calculated in-degree cen-tralization suggested in [15], however found it uninformative in the case of highvariability of the data.
From results in Table 3 we saw a notable divergence between these hierarchi-cal metrics: the inequality values of CiU and PP are similar (Gin = 0.893 andGin = 0.876, respectively), but PP centralization (Cin = 0.378) is far from themaximum centralization value exhibited by CiU (Cin = 0.770). For Barcelonaen Comu, BeC-m emerges as the least inequal and the least centralized struc-ture, while BeC-p forms the most inequal cluster (Gin = 0.995). We also plottedthe Lorenz curve of the in-degree distribution of the clusters in Figure 3 to visu-ally validate the different levels of inequality among clusters that were presentedin Table 3.
It is easy to demonstrate that for networks with a heavy tailed in-degreedistribution (as the ones of this study) the in-degree centralization formulatedin [27] is approximately equal to the ratio between the maximum in-degree andthe number of nodes8. Therefore, this metric is not a good one to capturehierarchical structure for social diffusion graphs, and Gini coefficient for in-degree inequality represents a more reliable measure.
3.2.2 Information efficiency
Broadly speaking the efficiency of a network aims to measure its small-worldproperty, i.e. phenomenon of strangers being linked by a mutual acquaintance.To assess the efficiency of information transportation within each party cluster
8 This is caused by the differences of several orders of magnitude between the maximumand average in-degree, common situation for social graphs.
7

Figure 1: Network of retweets (giant component). Clusters are represented bycolor: BeC-p in dark green; BeC-m in light green; ERCin yellow; PSC in red;CUP in violet; Cs in orange; CiU in dark blue; PP in cyan. The nodes out ofthese clusters are grey-colored.
8

Figure 2: Normalized weighted adjacency matrix of the network of clusters.
Figure 3: Lorenz curve of the in-degree distribution of each cluster.
9

Table 3: Inequality based on the Gini Coefficient (Gin) and centralization (Cin)of the in-degree distribution of each cluster.
Cluster Gin Cin
BeC-p 0.995 0.639Cs 0.964 0.476ERC 0.954 0.452CUP 0.953 0.635CiU 0.893 0.770PP 0.876 0.378PSC 0.818 0.565BeC-m 0.811 0.290
Table 4: Number of nodes (N) and edges (E), clustering coefficient (Cl) andaverage path length (l) of the intra-network of each cluster.
Cluster N E Cl lBeC-m 427 2 431 0.208 3.35PP 301 1 163 0.188 2.73PSC 211 810 0.182 2.29CiU 337 1 003 0.114 4.66Cs 352 832 0.073 2.57CUP 635 1 422 0.037 2.57ERC 866 1 899 0.027 5.43BeC-p 1 844 2 427 0.002 2.48
we computed the average path length and the clustering coefficient. Small-worldnetworks tend to have a small average shortest path length and a clusteringcoefficient significantly higher than expected by random chance [28].
From Table 4 we observe that BeC-m has the highest clustering coefficient(Cl = 0.208) closely followed by PP and PSC, the two smallest clusters by size.On the contrary the clustering coefficient of BeC-p is almost 0. This findingcould be explained by the topology of BeC-p, roughly formed by stars whosecenter nodes are the most visible Twitter accounts of Barcelona en Comu: theparty official accounts and the candidate.
We do not observe a remarkable pattern regarding the average path length.It is lower than 3 for the majority of the party clusters with the PSC clusterhaving the lowest value (l = 2.29). In the same time ERC, CiU and BeC-mexpose the longest average path length (5.43, 4.66, 3.35 respectively).
3.2.3 Social resilience
The concept of social resilience is the ability of a social group to withstandexternal stresses. To measure social resilience for a social network we appliedthe k-core decomposition for each cluster and evaluated the distributions of thenodes within each k-core.
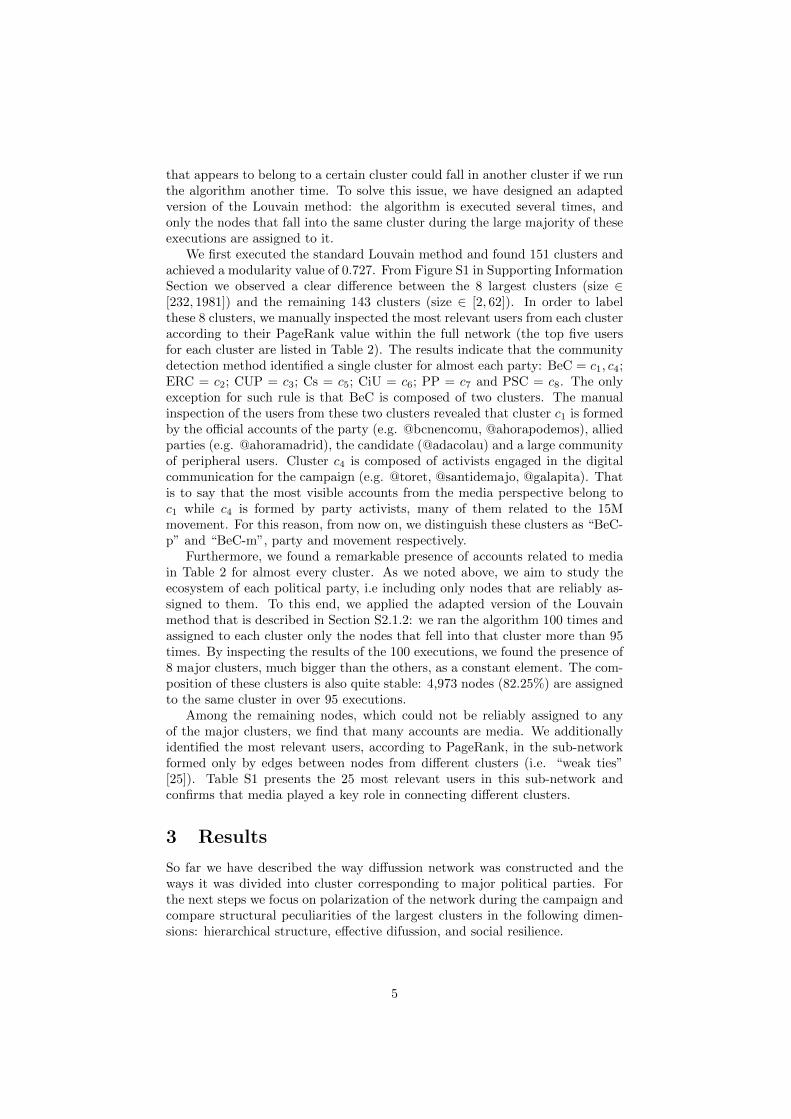
In Table 5 we present maximal and average k-indexes for each cluster andFigure 4 visually shows the corresponding distributions. As in the case of hierar-chical structure and information efficiency we observed a remarkable differencebetween BeC-m (kmax = 17, kavg = 5.90) and BeC-p (kmax = 5, kavg = 1.33),
10
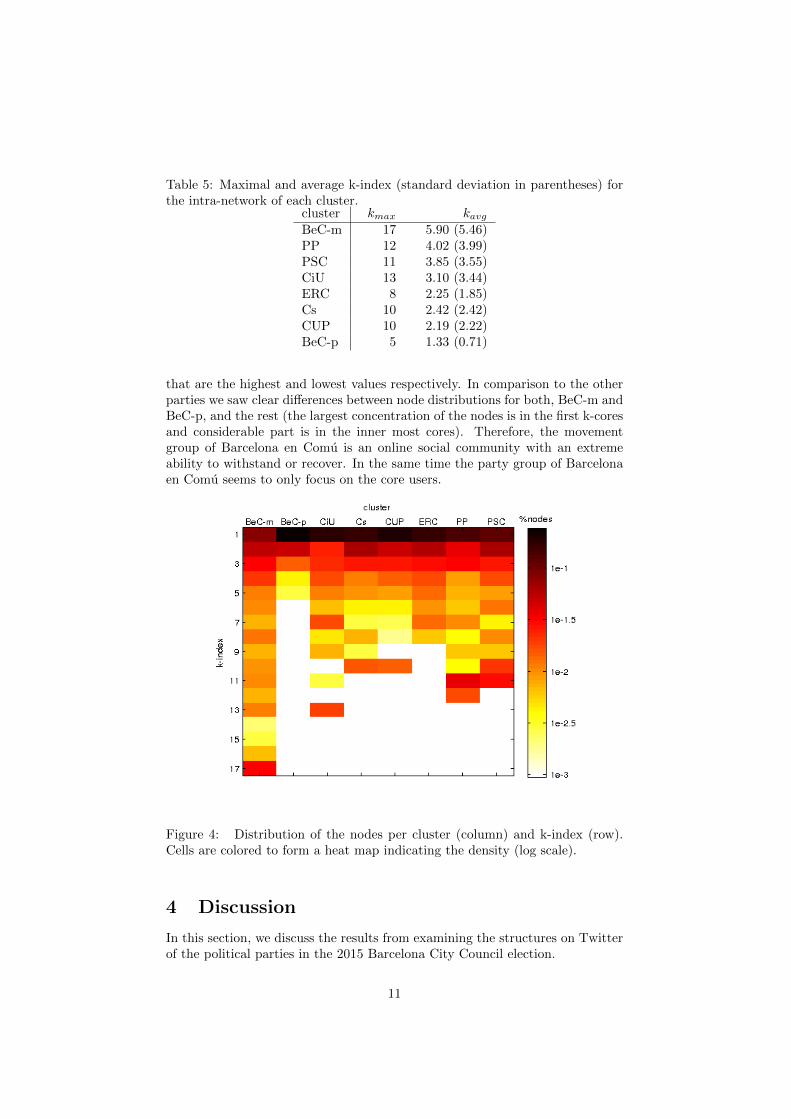
Table 5: Maximal and average k-index (standard deviation in parentheses) forthe intra-network of each cluster.
cluster kmax kavgBeC-m 17 5.90 (5.46)PP 12 4.02 (3.99)PSC 11 3.85 (3.55)CiU 13 3.10 (3.44)ERC 8 2.25 (1.85)Cs 10 2.42 (2.42)CUP 10 2.19 (2.22)BeC-p 5 1.33 (0.71)
that are the highest and lowest values respectively. In comparison to the otherparties we saw clear differences between node distributions for both, BeC-m andBeC-p, and the rest (the largest concentration of the nodes is in the first k-coresand considerable part is in the inner most cores). Therefore, the movementgroup of Barcelona en Comu is an online social community with an extremeability to withstand or recover. In the same time the party group of Barcelonaen Comu seems to only focus on the core users.
Figure 4: Distribution of the nodes per cluster (column) and k-index (row).Cells are colored to form a heat map indicating the density (log scale).
4 Discussion
In this section, we discuss the results from examining the structures on Twitterof the political parties in the 2015 Barcelona City Council election.
11

4.1 Institutionalisation of a networked movement
Our research question deals with the kind of organizational structure thatBarcelona en Comu developed for the campaign. On the one hand, the citedliterature [4, 5] provided evidence of the decentralization of the 15M movement,which inspired the Barcelona en Comu candidacy. On the other hand, many po-litical scientists [6, 10, 11, 12] argued that parties are always ruled by elites and,therefore, result in centralized organizations. Furthermore, the historical modelsof political parties reviewed in [29] (i.e. Caucus parties, Mass parties, Catch-allparties, and Cartel parties) always assumed organization around elites. All ofthese observations motivated us to study whether Barcelona en Comu preserveda decentralizated structure or adopted a conventional centralized organization.
Our results depict a movement-parrty structure in which the two componentsform well-defined clusters. In comparison to the clusters of the rest of politi-cal parties, we found the BeC movement community as the least hierarchichal,better clustered and most resilient one. In contrast, the BeC party communityemerges as the most hierarchical, least clustered and least resilient one. Thecentralization of the party cluster points to the candidate and official accounts,the subjects that are commonly associated with the elite. However, unlike therest of political parties, there is a co-existence of both party and movement clus-ters. This co-existence is consistent with the hypothesis expressed in [16] whendefining Podemos, member party of Barcelona en Comu, as the conjugation ofa front-end and a back-end.
In this article we have characterised the organization of political parties ac-cording to their online diffusion networks. Some authors have reported that theInternet played a key role in the organization of the 15M movement for building“a hybrid space between the Internet social networks and the occupied urbanspace” [1]. According to [5], this hybrid space is the result of technopolitical prac-tices: “the tactical and strategic use of technological devices (including socialnetworks) for organization, communication and collective action”. Are tech-nopolitics the origin of this particular movement-party partition of Barcelonaen Comu? Recently, political scientists have postulated the emergence of cyberparties “with its origins in developments in media and information and com-munication technologies” [30]. Although we can not ensure that the Internet isthe only reason behind this new form of political organization, in this particularcontext some party activists reported that ICT technologies becomes essentialfor campaigning [31]. Therefore, we are convinced of the close link betweentechnopolitics and the structure of Barcelona en Comu.
4.2 Online polarization
The identification of the different clusters was made possible by the high levelof polarization that the network exhibited, as we initially expected. We ob-served that bridges between clusters (i.e. “weak ties” [25]) were mostly builtby accounts related to media. Because media accounts hardly retweet contentfrom other accounts, a great amount of weak ties consists of users from politi-cal clusters retweeting content published by media accounts. This means thatmedia play a key role in generating messages that build a public sphere. Sometheorists suggest that the best response to group polarization is the usage of“mechanisms providing a public sphere” [32]. We found that the most relevant
12

account in the sub-network of weak ties was @btvnoticies, the local and pub-licly owned television. Indeed, this TV channel organized the debate among thecandidates of five of the seven parties. Figure S2 presents the ego-networks offour media accounts: @btvnoticies, @arapolitica @elpaiscat and @naciodigital.We clearly observe that @btvnoticies is linked from every party while the other3 private media are only linked from specific clusters. This finding might indi-cate that public TV became more plural than the other three analysed privatemedia, and pluralism is an effective tool to get “people exposed to a range ofreasonable competing views” [32].
5 Conclusions
In this study we have examined the Twitter networks of Barcelona en Comu incomparison to the other parties for the 2015 Barcelona municipal elections. Weobserved that the tension between the decentralization of networked movementsand the centralization of traditional political parties results into a movement-party structure: the two paradigms co-exist in two well-defined clusters. Fromthis result, we find of interest to further investigate the origin of this partic-ular structure: (1) Did the structure of Barcelona en Comu result from theconfluence of minor parties and the 15M activists? Or (2) instead of evolvinginto a centralized organization, did the 15M networked movement implement aparty interface over its decentralized structure? Further longitudinal analysesof the formation of these networks could help us to provide answer to these openquestions.
It is interesting to note that city council elections were held in every Spanishcity in May 2015 and candidacies similar to Barcelona en Comu were built.Moreover, after these elections, the city councils of several of the largest Spanishcities are ruled by these new organizations (e.g. Ahora Madrid, Zaragoza enComun). For this reason, future work should replicate this analysis to examinewhether the characteristics that we observed in Barcelona en Comu are alsopresent in these other grassroots movement-parties.
Acknowledgments
This research is supported by the EU project D-CENT (FP7/CAPS 610349).The data of this work were collected with KALIUM, a R+D project fundedby the ACC10 program (Generalitat de Catalunya). We would like to thankDatAnalysis15M Research Network and the #GlobalRevExp Forum for theirvaluable discussions and suggestions that helped to improve this study. YanaVolkovich is supported by the People Programme (Marie Curie Actions, fromthe FP7/2007-2013) under grant agreement no.600388 managed by REA andACC1O.
13

References
[1] M. Castells, Networks of outrage and hope: Social movements in the Inter-net age. John Wiley & Sons, 2013.
[2] W. L. Bennett and A. Segerberg, “The logic of connective action: Dig-ital media and the personalization of contentious politics,” Information,Communication & Society, vol. 15, no. 5, pp. 739–768, 2012.
[3] P. Gerbaudo, Tweets and the streets: Social media and contemporary ac-tivism. Pluto Press, 2012.
[4] S. Gonzalez-Bailon, J. Borge-Holthoefer, A. Rivero, and Y. Moreno, “Thedynamics of protest recruitment through an online network,” Scientificreports, vol. 1, 2011.
[5] J. Toret, A. Calleja-Lopez, O. Marın, P. Aragon, M. Aguilera, X. Baran-diaran, and A. Monterde, “Tecnopolıtica y 15m: La potencia de las multi-tudes conectadas,” 2015.
[6] R. Michels, Political parties: A sociological study of the oligarchical ten-dencies of modern democracy. Hearst’s International Library Company,1915.
[7] S. M. Lipset, M. A. Trow, J. S. Coleman, and C. Kerr, Union democracy:The internal politics of the International Typographical Union. Free PressGlencoe, 1956.
[8] J. Rothschild-Whitt, “Conditions facilitating participatory-democratic or-ganizations*,” Sociological Inquiry, vol. 46, no. 2, pp. 75–86, 1976.
[9] J. D. Edelstein and M. Warner, Comparative union democracy: Organisa-tion and opposition in British and American unions. Transaction Publish-ers, 1979.
[10] V. Pareto, A. Livingston, A. Bongiorno, J. H. Rogers, et al., “mind andsociety,” 1935.
[11] G. Mosca, “The ruling class: elementi di scienza politica,” 1939.
[12] C. W. Mills, The power elite. Oxford University Press, 1999.
[13] P. Aragon, K. E. Kappler, A. Kaltenbrunner, D. Laniado, and Y. Volkovich,“Communication dynamics in twitter during political campaigns: The caseof the 2011 spanish national election,” Policy & Internet, vol. 5, no. 2,pp. 183–206, 2013.
[14] I. Pena-Lopez, M. Congosto, and P. Aragon, “Spanish indignados andthe evolution of the 15m movement on twitter: towards networked para-institutions,” Journal of Spanish Cultural Studies, vol. 15, no. 1-2, pp. 189–216, 2014.
[15] D. Garcia, A. Abisheva, S. Schweighofer, U. Serdult, and F. Schweitzer,“Ideological and temporal components of network polarization in onlinepolitical participatory media,” Policy and Internet, vol. 7, no. 1, pp. 46–79, 2015.
14

[16] J. T. Medina, “Una mirada tecnopolıtica al primer ano de podemos. seishipotesis,” Teknokultura, vol. 12, no. 1, pp. 121–135, 2015.
[17] L. A. Adamic and N. Glance, “The political blogosphere and the 2004us election: divided they blog,” in Proceedings of the 3rd internationalworkshop on Link discovery, pp. 36–43, ACM, 2005.
[18] M. Conover, J. Ratkiewicz, M. Francisco, B. Goncalves, F. Menczer, andA. Flammini, “Political polarization on twitter.,” in ICWSM, 2011.
[19] C. R. Sunstein, Republic. com 2.0. Princeton University Press, 2009.
[20] A. Gruzd and J. Roy, “Investigating political polarization on twitter: Acanadian perspective,” Policy & Internet, vol. 6, no. 1, pp. 28–45, 2014.
[21] A. Feller, M. Kuhnert, T. O. Sprenger, and I. M. Welpe, “Divided theytweet: The network structure of political microbloggers and discussion top-ics.,” in ICWSM, 2011.
[22] M. L. Congosto, M. Fernandez, and E. Moro Egido, “Twitter y polıtica:Informacion, opinion y¿ prediccion?,” Cuadernos de Comunicacion Evoca,vol. 4, pp. 11–15, 2011.
[23] J. Borondo, A. Morales, J. Losada, and R. Benito, “Characterizing andmodeling an electoral campaign in the context of twitter: 2011 spanishpresidential election as a case study,” Chaos, vol. 22, no. 2, p. 3138, 2012.
[24] V. D. Blondel, J.-L. Guillaume, R. Lambiotte, and E. Lefebvre, “Fast un-folding of communities in large networks,” Journal of Statistical Mechanics:Theory and Experiment, vol. 2008, no. 10, p. P10008, 2008.
[25] M. S. Granovetter, “The strength of weak ties,” American journal of soci-ology, pp. 1360–1380, 1973.
[26] M. Jacomy, “Force atlas 2 layout,” 2011.
[27] L. C. Freeman, “Centrality in social networks conceptual clarification,”Social networks, vol. 1, no. 3, pp. 215–239, 1979.
[28] D. J. Watts and S. H. Strogatz, “Collective dynamics of ‘small-world’ net-works,” nature, vol. 393, no. 6684, pp. 440–442, 1998.
[29] R. S. Katz and P. Mair, “Changing models of party organization and partydemocracy the emergence of the cartel party,” Party politics, vol. 1, no. 1,pp. 5–28, 1995.
[30] H. Margetts, “The cyber party,” ECPR Joint Sessions. London. Retrievedrom http://www. governmentontheweb. org/sites/governmentontheweb.org/files/Cyber party paper. pdf, 2001.
[31] L. Sandiumenge, “La guerrilla digital de Colau.” http://districte15.
info/la-guerrilla-digital-de-colau/, 2015. [Online; accessed 22-July-2015].
[32] C. R. Sunstein, “The law of group polarization,” University of Chicago LawSchool, John M. Olin Law & Economics Working Paper, no. 91, 1999.
15

[33] M. E. Newman, “Analysis of weighted networks,” Physical Review E,vol. 70, no. 5, p. 056131, 2004.
[34] S. Brin and L. Page, “The anatomy of a large-scale hypertextual web searchengine,” Comput. Netw. ISDN Syst., vol. 30, pp. 107–117, Apr. 1998.
[35] C. Gini, “Variabilita e mutabilita,” Reprinted in Memorie di metodolog-ica statistica (Ed. Pizetti E, Salvemini, T). Rome: Libreria Eredi VirgilioVeschi, vol. 1, 1912.
16

S1 Supporting Information
The supportive figures and tables of this article are presented below.
Figure S1: Distribution of the number of clusters (c) by size (s). Red markersare used to indicate the 8 largest clusters.
17
Figure S2: Ego-networks of 4 media accounts: a) @btvnoticies; b) @arapolit-ica; c) @elpaiscat ; d) @naciodigital. Central nodes (i.e. corresponding mediaaccounts) are black-colored.
18

Table S1: Most relevant nodes by PageRank in the sub-network formed by edgesbetween nodes from different clusters.
User Page Rank Role@btvnoticies 0.014 media@bcnencomu 0.012 party@sicomtelevision 0.010 media@cupbarcelona 0.007 party@elsmatins 0.007 media@capgirembcn 0.006 party@tv3cat 0.006 media@324cat 0.006 media@xaviertrias 0.005 candidate@puntcattv3 0.005 media@revolucio1984 0.004 citizen@sergifor 0.004 media@nuriapujadas 0.004 media@annatorrasfont 0.004 media@arapolitica 0.004 media@maticatradio 0.003 media@cati bcn 0.003 media@elpaiscat 0.003 media@encampanya 0.003 media@albertmartnez 0.002 media@naciodigital 0.002 media@adacolau 0.002 candidate@ramontremosa 0.002 party member@alfredbosch 0.002 candidate@directe 0.001 media
S2 Methods
In this study we have used methods of social network analysis for communitydetection, identification of relevant nodes, and measurement of the topologicalstructure of a network.
S2.1 Community detection
S2.1.1 Modularity
The modularity measures the density of edges inside communities in comparisonto edges between communities [33]. Its value, between -1 and 1, is defined as:
Q =1
2mΣij
[Aij −
kikj2m
]δ(ci, cj).
Here Aij is the edge weight between nodes i and j; ki and kj are the degreesof the nodes i and j, respectively; m represents the total number of edges inthe graph. ci; and cj are the communities of the nodes and δ is a simple deltafunction.
19

S2.1.2 Louvain Method
The Louvain Method is a community detection technique based on a greedyalgorithm that attempts to optimize the modularity of a partition of a givennetwork [24]. The method follows a two-step approach.
First, each node is assigned to its own community. Then, for each node i,the change in modularity is measured for moving i from its own community intothe community of each neighbor j:
∆Q =
[Σin + ki,in
2m−(
Σtot + ki2m
)2]−[
Σin
2m−(
Σtot
2m
)2
−(ki2m
)2],
where Σin is sum of all the weights of the intra-edges of the community wherei being moved into, Σtot is the sum of all the weights of the edges to nodes ofthe community, ki is the degree of i, ki,in is the sum of the weights of the edgesbetween i and other nodes in the community, and m is the sum of the weights ofall edges in the network. Once this value is measured for all communities thati is connected to, the algorithm locates i into the community that producesthe largest increase in modularity. If no increase is possible, i remains in itsoriginal community. This process is applied iteratively until modularity can notbe increase and a local maximum of modularity is achieved.
In the second step, the method groups all of the nodes from the same com-munity and builds a new network where nodes are the communities from theprevious step. Edges between nodes of the same community are represented byself-loops and edges from multiple nodes from the same community to a node ofa different community are represented by weighted edges between correspondingcommunities.
First and second steps are repeated until modularity can not be increased.
Adapted version to enhance the robustness of the largest clustersLike most community detection methods, the Louvain method consists of agreedy algorithm and has a random component, so each execution produces adifferent result. To obtain robust results, avoiding dependency on a particularexecution of the algorithm, we introduce the following method to identify themain clusters of the network in a stable way.
First, we run N executions of the Louvain algorithm, which produce N differ-ent partitions of the network into clusters. Then we select the bigger clusters foreach partition, and identify each cluster through its most representative nodes.In particular, as we expect that the main clusters will represent the politicalparties, we identify each cluster with the most central node corresponding tothe account of a political party or of a political party leader. Finally, we assignto each cluster all the nodes that appear in that cluster in at least the 1− ε ofthe partitions created, where 1− ε represents the confidence interval.
This procedure allows us to validate the results of the community detectionalgorithm, and to guarantee that all the nodes that are assigned to a cluster doactually belong to it with high confidence. The remaining nodes, that cannotbe assigned in a stable way to any of the main clusters, are left out from all theclusters.
20

S2.2 Identification of relevant nodes: PageRank
PageRank is a global characteristic of a node participation in some network andcould be seen as a characteristic of node’s success and popularity [34]. It isdefined as a stationary distribution of a random walk on the directed graph.At each step, with probability c, the random walk follows a randomly chosenoutgoing edge from a node, and with probability (1− c) the walk starts afreshfrom a node chosen uniformly among all nodes. The constant c is called dampingfactor, and takes values between 0 and 1 (traditionally c=0.85). PageRank canbe summarized in the following formula:
PR(i) = c∑j→i
1
djPR(j) +
1− cn
,
where PR(i) is the PageRank of node i, dj is out-degree of node j, the sumis taken over all nodes j that link to node i, and n is the number of nodesin the network. Unlike in- and out-degree which are local characteristics, thePageRank is a global characteristic of a node. In other words, adding/removingan edge between two nodes could affect PageRank values of many nodes.
S2.3 Network topology
S2.3.1 In-degree distribution
The in-degree of node i is the total number of edges onto node i. By countinghow many nodes have each in-degree value, the in-degree distribution P (kin)is equal to the fraction of nodes in the graph with such in-degree kin. Thecumulative in-degree distribution P (K ≥ kin) represents the fraction of nodesin the graph whose in-degree is greater than or equal to kin.
S2.3.2 In-degree Centralization
A existing method to measure degree centralization was introduced by [27] andis based on two concepts: (1) how the centrality of the most central node exceedsthe centrality of all other nodes and (2) setting the value as a ratio by comparingto a star network:
Cin =
n∑i=1
[kin∗ − kini ]
maxn∑
i=1
[kin∗ − kini ],
where kini is the in-degree of node i, kin∗ is the maximum in-degree of the
network and maxn∑
i=1
[kin∗ − kini ] is the maximum possible sum of differences for
a graph with the same number of nodes (a star network).
S2.3.3 In-degree Inequality: Gini coefficient
The Gini coefficient is a statistical metric to quantify the level of inequalitygiven a distribution [35]. It was initially formulated in Economics to measurethe income distribution by using the Lorenz curve. If A is the area between theline corresponding perfect equality and B is the area under the Lorenz curve,
21

the Gini coefficient is equal to A/(A + B). If the Lorenz curve is expressed bythe function Y = L(X), B is calculated as follows:
G = 1− 2
∫ 1
0
L(X)dX
In the context of network topology, the Gini coefficient can be applied to char-acterize the hierarchical structure of a network based on the inequality of itsin-degree distribution.
S2.3.4 Clustering coefficient
Clustering coefficient measures the extent of nodes to clusted together by calcu-lating the number of triangles in the network. For every node i we set Ni to bethe neighborhood, i.e. Nj = {j ∈ V : (i, j) ∈ E}, and define the local clusteringcoefficient as
Cli =2|(j, k) ∈ E : j, k ∈ Nj |
ki(ki − 1).
Then, following [28] the clustering coefficient is just the average of the localclustering coefficients: Cl =
∑i Cli/n, where n is the number of nodes in the
network.
S2.3.5 Average path length
The concept of average path length aims to measure the efficiency of informationpropagation in a social network by taking the mean value of the number of edgesalong the shortest paths for all possible pairs of nodes. In more details, for everypair of nodes i, j we set dij to be the smallest number of steps among all directedpaths between i and j and dij = 0 if there is no such path. Then, the averagepath length is defined as follows: l =
∑i 6=j dij/n(n− 1).
S2.3.6 k-core decomposition
The k-core of a graph is the maximal subgraph in which each vertex is adjacent,ignoring the direction of the edge, to at least k other nodes of the subgraph. Agraph’s node has a k-index equals to k if it belongs to the k-core but not to the(k+1)-core. Thus, a given network, we define a sub-network H induced by thesubset of users C. H is a k-core of the network if and only if for every user inC: degH(i) ≤ k , and H is the maximum sub-graph which fulfils this condition.With degH(i) we denote the degree of the node i in the sub-graph H. A userhas k-index equal k if it belongs to the k-core but not to the (k+1)-core.
In simple words, k-core decomposition starts with k = 1 and removes allnodes with degree equal to 1. The procedure is repeated iteratively until novertices with degree 1 remain. Next, all removed nodes are assigned k-indexto be 1. It continues with the same procedure for k = 2 and obtains verticeswith indexes equal 2, and so on. The process stops when the last node from thenetwork is removed at the kmax
th step. The variable kmax is then the maximumshell index of the graph.
22