when the people draw the lines - the league of women ... · when the people draw the lines league...
TRANSCRIPT

When the People Draw the LinesAn ExAminAtion of thE CAliforniA CitizEns
rEdistriCting Commission
by raphael J. sonensheinwith Generous Support from The James Irvine Foundation


When the People Draw the LinesAn ExAminAtion of thE CAliforniA CitizEns
rEdistriCting Commission
by raphael J. sonenshein
research ConsultantsMelina Abdullah
Mark DrayseBonnie GlaserJustin Levitt
research AssociateNedda Black
EditorSarah Shectman
designe.g. communications
Cover PhotoCA Common Cause
with Generous Support from The James Irvine Foundation


1 Executive Summary
9 Chapter 1: Background
16 Chapter 2: Selecting the Commissioners
25 Chapter 3: Organizing the Commission
34 Chapter 4: Outreach During the Deliberation Process
44 Chapter 5: Mapping
56 Chapter 6: The Voting Rights Act
63 Chapter 7: Timeline and Budget
69 Chapter 8: Assessments and Looking to the Future
75 Appendices
Table of Contents


1When the People Draw the Lines League of Women Voters of California
Executive Summary
On November 8, 2008, a historic presidential election drove voter participation to unusu-ally high levels. Californians cast more than 13.5 million votes for president. Much farther down their ballot, a smaller number of voters (just short of 12 million) voted on Prop 11, also known as the Voters First Act. By a margin of less than 1 percent,1 voters transformed the way the state went about drawing districts for state offices. Instead of the state legis-lature and governor (and at times, the courts), an independent citizen commission—the California Citizens Redistricting Commission—would now accomplish the task. With little notice in the tidal wave of the presidential race, Californians had made a major change to their state’s constitution.
1Prop 11 received 6,095,033 votes (50.90 percent), with 5,897,655 (49.10 percent) opposed. Although the margin of victory was less than 1 percent, the Yes side had almost 200,000 votes more than the No side.
Phot
o C
ourte
sy o
f CA
Com
mon
Cau
se

2 League of Women Voters of California When the People Draw the Lines
Executive Summary
Two years later, by a more comfortable margin,2 the state’s voters approved Prop 20, to include congressional seats in the citizen-led redrawing. On the same ballot, voters rejected Prop 27, which would have eliminated the entire citizen-driven redistricting process.3 A nar-row popular mandate for citizen redistricting became a solid majority.
Of all the states that have experimented with alter-natives to redistricting by elected officials, California was the most distinctive, dedicated to removing as completely as possible the role of incumbent politicians in drawing their own district lines.4 Arizona had the most comparable state system, but it provided a greater role than California for elected officials in selecting commissioners.5
This report analyzes California’s citizen redistrict-ing process, from design to implementation, presenting findings about what worked well and what did not. It also offers recommendations for improvement, in order to assist future California citizen commissions, in addition to any other jurisdiction looking to follow California’s lead.
The League of Women Voters of California pub-lished this report, with funding from The James Irvine Foundation. It draws on the research of four consultants,6 examination of public records, including transcripts of commission meetings, and interviews with participants in the redistricting process. The
2Prop 20 received 61.3 percent of the vote, with 38.7 percent opposed.3Prop 27 received 40.5 percent of the vote, with 59.5 percent opposed.4Justin Levitt, A Guide to Redistricting (New York: Brennan Center for Justice, 2010); Bruce Cain, “Redistricting Commissions: A Better Po-litical Buffer?” Yale Law Journal 121 (2012): 1808–44.5In November 2000, Arizona voters passed Measure 106 to take the power to draw districts away from the legislature and vest it in a citizen commission. The Independent Redistricting Commission is composed of five members. The first four are nominated from a pool selected by the Commission on Appellate Court Appointments. From this pool of twenty-five, party leaders in the legislature each select one, so that there are two of each party. These four members then select a fifth person to be chairperson, choosing from among those in the pool who do not belong to either of the two major parties.6Research consultants for this report were Melina Abdullah, Act-ing Chair and Associate Professor of Pan-African Studies, Califor-nia State University, Los Angeles; Mark Drayse, Associate Professor of Geography, California State University, Fullerton; Bonnie Glaser, Berkeley Law Center for Research and Administration, UC Berke-ley; and Justin Levitt, Assistant Professor of Law, Loyola Law School, Los Angeles. The research associate was Nedda Black, graduate of the Hastings College of the Law. Anna Sonenshein researched media cov-erage of the commission.
author conducted interviews with each of the fourteen commissioners. Unless otherwise indicated, comments attributed to the commissioners are based on these interviews. Outside reviewers commented on drafts of the report.
The author is solely responsible for the findings and recommendations.
findings
Overall, the California citizen redistricting process was a success.
n Those who designed the ballot measures that cre-ated citizen redistricting overcame great historical odds. They were remarkably successful in winning voter support and in creating a commission that was largely independent of incumbent influence and generated a well-received redistricting (chapter 1).
n The designers of the redistricting process created a detailed and effective set of rules for commissioner selection that maximized deliberation, transpar-ency, and independence (chapters 1, 2).
n The James Irvine Foundation contributed nearly $3.5 million to facilitate wider outreach to the state’s diverse geographic and demographic com-munities during the selection process by funding a number of community organizations to encourage applications to the commission and to provide spe-cial outreach and training (chapters 2, 7).
n The Bureau of State Audits (BSA),7 a California state agency, conducted a broad recruiting cam-paign that led more than 30,000 citizens to apply to become commissioners (chapter 2).
n Incumbent elected officials had little influence over the selection of commissioners (chapter 2).
n The BSA’s selection process, operating in public view, yielded a diverse group of commissioners who met the requirements of service set out in Prop 11 (chapter 2).
7The agency has since been renamed the California State Auditor.

3When the People Draw the Lines League of Women Voters of California
Executive Summary
n The commission sought and obtained a massive amount of public input, including testimony at public hearings, emails, draft maps, and other com-munications (chapter 4).
n The commission completed its work on time, issu-ing final maps by the mandated date of August 15, 2011 (chapter 3).
n The commission earned majority votes for its fi-nal maps from all three required groups of com-missioners: Democrats, Republicans, and those not aligned with either major party (chapter 8).
n The maps survived strenuous legal challenges in state and federal courts with no adverse judicial de-cisions (chapter 8).
n According to public-opinion polling, voters re-sponded positively to the work of the commission (chapter 8).
n In a comparative study of transparency of state gov-erning processes in which the state received a B- overall, the citizen redistricting process received an A, with a score of 100 percent8 (chapter 8).
n Four independent studies of the commission’s final product, including two conducted for this project, found generally positive results in achieving the main substantive goals of Prop 11,9 in respecting Communities of Interest (COIs),10 in following ac-cepted techniques and processes in mapping,11 and in following a decision-making process that gener-ally met accepted standards for addressing Voting Rights Act issues12 (chapters 6–8).
8Center for Public Integrity, accessed August 25, 2012, http://www.stateintegrity.org/california_survey_redistricting.9Vladimir Kogan and Eric McGhee, “Redistricting California: An Evaluation of the Citizens Commission’s Final Plans,” California Jour-nal of Politics and Policy 4 (2012): 35–36. 10Nicholas O. Stephanopoulos, “Communities and the Commission,” Stanford Law and Policy Review 23 (2012): 19.11Mark Drayse, research conducted for this report.12Justin Levitt, research conducted for this report. See also Justin Lev-itt, “Democracy on the High Wire: Citizen Commission Implemen-tation of the Voting Rights Act,” U.C. Davis Law Review 46 (2013, forthcoming).
n A comparative analysis of the budget for a citizen commission in Arizona indicates that California’s overall spending on the citizen redistricting com-mission was reasonable (chapter 7).
n In the 2012 elections, many incumbents faced sig-nificant challenges, in part due to redistricting, and some chose not to run for reelection. Turnover was high, and the new legislature had a large share of new members (chapter 8).
Despite the commission’s overall success, there were flaws in the redistricting process.
designn The commission’s organization and operation re-
ceived significantly less attention in time, planning, and funding than did the selection of commission-ers (chapter 2).
n The transition from the BSA’s role in selecting the commissioners to the Secretary of State’s role in getting the commission up and running was not adequately planned (chapter 3).
n The decision to have the first eight commission-ers select the next six commissioners created challenges in forming a unified, cohesive body (chapter 3).
organizational issuesn The commissioners had limited opportunity to de-
sign the expectations and job descriptions of staff and consultants. With tight timelines, commis-sioners increased their own workload in adminis-trative matters (chapter 3).
n Although Prop 11 established a $300 per diem rate of compensation for commissioners, the commis-sioners had to determine important details of the system of compensation themselves (chapter 3).
n State contracting rules hindered the commission’s ability to operate in a timely manner, especially in the commission’s early stages (chapter 3).
n The actual mapping process was compressed into a short timeframe, from late May 2011 through late July 2011 (chapter 5).

4 League of Women Voters of California When the People Draw the Lines
Executive Summary
n Commissioners struggled to weigh public input be-cause of its sheer volume (chapters 4–5).
n Although the commission was established to last ten years, no role was defined for the commission’s work beyond drawing the lines and defending law-suits (chapter 3).
trainingn Commissioner training, particularly in the applica-
tion of the Voting Rights Act, was delayed and/or inadequate (chapter 3).
n Although Props 11 and 20 elevated Communities of Interest (COIs) to a high priority in redistrict-ing, the commission lacked sufficient guidance in making decisions about COIs (chapter 5).
information Accessn The commission did not have the opportunity to
utilize social and economic data that would have complemented the census data that were released in April 2011 (chapters 4–6).
n The commission lacked timely research in the area of polarized voting, an essential aspect of compli-ance with the Voting Rights Act (chapter 6).
n The commission lacked sufficient help in digesting and utilizing public input (chapter 4).
n Some commissioners and members of the public found it difficult to track changes being made in the maps (chapter 5).
Budgetn The BSA issued a contract for media outreach that,
though modest in cost relative to the size of Cali-fornia’s population, consumed a significant portion of the overall budget of the redistricting process (chapter 2).
n The commission lacked a sufficient budget to hire an outreach firm to stimulate, collect, and organize public input outside the public hearings (chapter 4).
recommendations
designn In future redistricting cycles, the greatest share
of resources and time should be devoted to the preparation and deliberations of the commission, including how the commissioners are trained, how they gather information, and how they deliberate (chapter 3).
n Jurisdictions considering adopting citizen redis-tricting should select all commissioners at the same time rather than having one set of commissioners choose the others (chapter 3).
n The next commission should have maximum flex-ibility in contracting, especially in light of its short period of operation (chapter 3).
n A system of commissioner compensation should be in place before the commission takes office. The amount and nature of compensation should be cho-sen with reference to comparable boards and com-missions within and outside the state of California. The salary or per diem should make it possible for people of moderate means to serve (chapter 3).
n The same state agency that selects commissioners should help organize the commission, providing logistical and other support to get the citizen body up and running13 (chapter 3).
n The next commission should have more time to do its work,14 with the commission in place at least five months earlier in the process than the 2011 com-mission was (chapter 7).
n The next commission should begin the mapping process earlier (chapters 5, 7).
organizationn An organizational support system for the operation
of the commission should be in place before the
13The state legislature adopted a recommendation from the commis-sion to follow this approach.14This report concurs with the commission’s recommendation for an additional six months for its deliberations, an extension that the legis-lature shortened to four and a half months. Even the approved exten-sion will be a major help.
5When the People Draw the Lines League of Women Voters of California
Executive Summary
commission convenes. This information should be offered by a single governmental agency or outside organization with relevant experience (chapter 3).
n The State Auditor, or a comparable office known for its impartiality and professional skill, such as the Legislative Analyst, should conduct the selec-tion process in the next iteration (chapter 2).
n Outreach to potential applicants for commission positions should draw on scheduled efforts by the U.S. Census Bureau to contact California adults (chapter 2).
n The commissioners should delegate administrative tasks as much as possible to staff and consultants (chapter 3).
n Commissioners should set the criteria and job descriptions for staff and consultants, through a public process, and make hiring decisions from the widest array of qualified applicants. New staff models should be explored, including bipartisan teams (chapter 3).
n The state should assign a staff person to handle lo-gistical matters for the commission (chapter 3).
n The commission should cast a wide net for staff from both inside and outside the state government with experience working with appointed or elected citizen bodies (chapter 3).
n The line-drawing team and VRA counsel should be hired earlier in the process (chapters 3, 5).
n The existing commission should help fill the gap in preparation that will precede the selection of state agencies and outside institutions to gather research and set the stage for the next redistricting process (chapter 3).
trainingn The commission should receive extensive training
as a unified group after all members have been ap-pointed (chapters 3, 5, 6).
information Accessn Before the commission convenes, demographic
and geographic data should be collected to supple-
ment public hearings for the purpose of assessing COIs (chapters 3, 5, 6).
n Research on historical polarized voting should be undertaken before the commission begins the de-liberation process (chapter 6).
n In the next iteration, the commission should im-prove the tracking of revisions to maps in order to give greater opportunities for public input (chapter 5).
Budgetn The budget for the next commission should in-
clude funds for user-friendly tools and technology that give the public thorough access to data and proposals and easy opportunities to provide effec-tive testimony and proposed maps (chapter 4).
n The commission budget should include funding for a consultant whose main task is to collect and analyze public input to the commission (chapter 4).
n Commissioner travel costs should be reduced by conducting some hearings using distance technol-ogy and in some cases not requiring all commis-sioners to attend15 (chapter 4).
Acknowledgements
This study was funded in its entirety by The James Irvine Foundation, ably represented by Catherine Hazelton. The League of Women Voters of Califor-nia served as the project coordinator, led with great dedication by Chris Carson and Melissa Breach. Sarah Shectman edited the report with care and skill.
I am grateful to the consultants who assisted me in researching this report. A number of anonymous reviewers read all or part of various versions of the text, and their comments were invaluable. I appreciate the generosity of the many people who were willing to be interviewed for this report, including all fourteen com-missioners.
15Any such changes in public hearings must take into account the trad-eoffs of reduced commissioner presence and the need for all commis-sioners to have the same base of information.

On November 8, 2008, Californians voted a major change into their state’s constitution when they approved Proposition 11, the Voters First Act. This proposition
took redistricting out of the hands of the state legislature and governor and put it squarely in the hands of an independent citizen’s commission.
The Voters Ask for a New ProcessProp 11 won a narrow victory in 2008, but in 2010, voters expanded the scope of the measure to include congressional districts through Prop 20, and rejected an attempt to overturn the citizen-led process through Prop 27.
Mapping It OutThe commission was scrupulous in attempting to create maps around the six constitutional criteria. The mapping process included building draft maps, visualizations of districts, and a final set of maps, and was incredibly complex.
Reaching the PeopleInput from the public was a high priority for the commissioners, and they received a staggering amount of public response.
Timeline and BudgetThe redistricting process devoted more attention to the selection of commissioners than to the preparation and deliberations of the commission, making time pressure a key issue for commissioners.
Checking the Commissionʹs WorkThe citizen redistricting process was largely successful in achieving a nonpartisan and transparent process. The final maps survived legal challenge, and the commission’s work was regarded positively by a majority of the voters. The 2012 election results suggested that the new district lines caused significant turnover in elected offices.
Selecting the CommissionersCalifornia’s Bureau of State Audits spent two years adopting new regulations and conducting a major statewide outreach process that led to a diverse, capable, and determined commission of fourteen members.
Public Hearings
Number of Applicantsthat Applied
Prop 11 Prop 20 Prop 27
Deliberation MeetingsSpeakers Written Submissions
Voter Approval on Commission’s Work
Drafting Maps
Months to Develop Selection Process Regulations and Get Off the Ground Organizationally
Months Devoted to Core Deliberations
Score Received in a Study of Transparency of Processes
California Supreme Court Upholds the State Senate Maps
Praise from Independent Reviewers
Government Funding
Private Funding
34 702700
51% 49% 61% 39% 47% 53%
30,0005
Republican
4Neither Major Party
5Democrat
“A”2 to 1
7 – 0
$1m $2m $3m $4m $5m $6m $7m $8m $9m $10m
$3.5
$10.512
8
Vizualization of Districts Final Maps
Prop 11 took redistricting out of the hands of legislators
and placed it in the hands of citizens. The primary duty of the independent citizen’s
commission’s was to draw the lines of 177 districts.
177Number of State and Federal Election District Lines Drawn22,000
Criteria
Population Equality
The VRA and Minority Representation
Geographic Contiguity
Geographic Integrity of Communities of Interest
Geographic Compactness
Nesting
8 League of Women Voters of California When the People Draw the Lines
Executive Summary
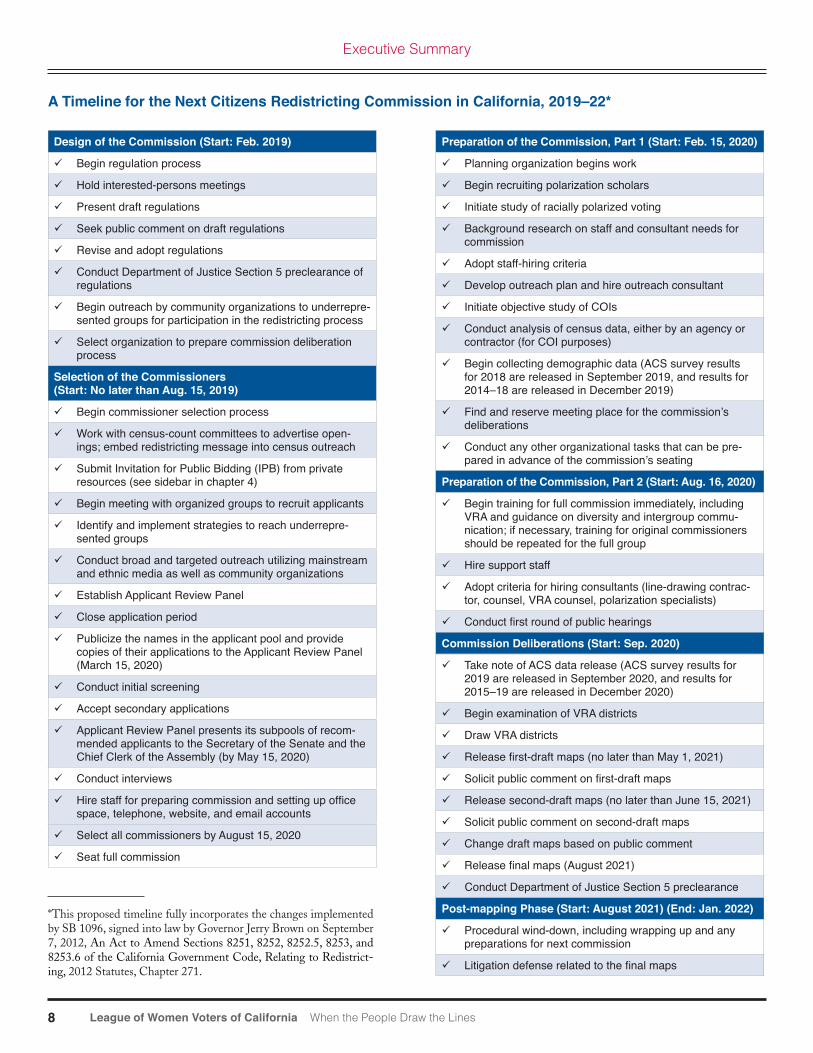
design of the Commission (start: feb. 2019)
Begin regulation process
Hold interested-persons meetings
Present draft regulations
Seek public comment on draft regulations
Revise and adopt regulations
Conduct Department of Justice Section 5 preclearance of regulations
Begin outreach by community organizations to underrepre-sented groups for participation in the redistricting process
Select organization to prepare commission deliberation process
selection of the Commissioners (start: no later than Aug. 15, 2019)
Begin commissioner selection process
Work with census-count committees to advertise open-ings; embed redistricting message into census outreach
Submit Invitation for Public Bidding (IPB) from private resources (see sidebar in chapter 4)
Begin meeting with organized groups to recruit applicants
Identify and implement strategies to reach underrepre-sented groups
Conduct broad and targeted outreach utilizing mainstream and ethnic media as well as community organizations
Establish Applicant Review Panel
Close application period
Publicize the names in the applicant pool and provide copies of their applications to the Applicant Review Panel (March 15, 2020)
Conduct initial screening
Accept secondary applications
Applicant Review Panel presents its subpools of recom-mended applicants to the Secretary of the Senate and the Chief Clerk of the Assembly (by May 15, 2020)
Conduct interviews
Hire staff for preparing commission and setting up office space, telephone, website, and email accounts
Select all commissioners by August 15, 2020
Seat full commission
Preparation of the Commission, Part 1 (start: feb. 15, 2020)
Planning organization begins work
Begin recruiting polarization scholars
Initiate study of racially polarized voting
Background research on staff and consultant needs for commission
Adopt staff-hiring criteria
Develop outreach plan and hire outreach consultant
Initiate objective study of COIs
Conduct analysis of census data, either by an agency or contractor (for COI purposes)
Begin collecting demographic data (ACS survey results for 2018 are released in September 2019, and results for 2014–18 are released in December 2019)
Find and reserve meeting place for the commission’s deliberations
Conduct any other organizational tasks that can be pre-pared in advance of the commission’s seating
Preparation of the Commission, Part 2 (start: Aug. 16, 2020)
Begin training for full commission immediately, including VRA and guidance on diversity and intergroup commu-nication; if necessary, training for original commissioners should be repeated for the full group
Hire support staff
Adopt criteria for hiring consultants (line-drawing contrac-tor, counsel, VRA counsel, polarization specialists)
Conduct first round of public hearings
Commission deliberations (start: sep. 2020)
Take note of ACS data release (ACS survey results for 2019 are released in September 2020, and results for 2015–19 are released in December 2020)
Begin examination of VRA districts
Draw VRA districts
Release first-draft maps (no later than May 1, 2021)
Solicit public comment on first-draft maps
Release second-draft maps (no later than June 15, 2021)
Solicit public comment on second-draft maps
Change draft maps based on public comment
Release final maps (August 2021)
Conduct Department of Justice Section 5 preclearance
Post-mapping Phase (start: August 2021) (End: Jan. 2022)
Procedural wind-down, including wrapping up and any preparations for next commission
Litigation defense related to the final maps
A timeline for the next Citizens redistricting Commission in California, 2019–22*
*This proposed timeline fully incorporates the changes implemented by SB 1096, signed into law by Governor Jerry Brown on September 7, 2012, An Act to Amend Sections 8251, 8252, 8252.5, 8253, and 8253.6 of the California Government Code, Relating to Redistrict-ing, 2012 Statutes, Chapter 271.

9When the People Draw the Lines League of Women Voters of California
ChAPtEr 1
Background
After the 2001 California redistricting, which protected incumbents of both parties, pres-sure grew to reform the redistricting process. For several years, civic organizations discussed possible ballot measures with state legislative leaders. By 2007, these efforts had reached an impasse, and citizen groups created a ballot measure for the 2008 ballot to establish an independent citizens redistricting commission. Previous ballot measures to amend redistricting had failed. Although Prop 11 had its greatest voter support among Republicans, it won enough Democratic and independent ballots to carry it to a narrow victory. In 2010, voters expanded the scope of the measure to include congressional dis-tricts and rejected an attempt to overturn the citizen-led process.
Phot
o C
ourte
sy o
f CA
Com
mon
Cau
se

10 League of Women Voters of California When the People Draw the Lines
ChAPtEr 1
Background
Redistricting has long been controversial in California. On four previous occasions, voters turned down ballot measures intended to create commissions that would take the power of redistricting out of the hands of the state legislature and governor (and at times, the courts):
n Proposition 14, November 1982, to create a com-mission (defeated 54.5 percent to 45.5 percent)
n Proposition 39, November 1984, to create a com-mission (defeated 55.2 percent to 44.8 percent)
n Proposition 119, June 1990, to create a commission appointed by retired judges (defeated 63.8 percent to 36.2 percent)
n Proposition 77, November 2005, to create a com-mission of retired judges for a mid-decade redis-tricting (defeated 59.8 percent to 40.2 percent)
Propositions 11 and 20, the successful 2008 and 2010 measures that transformed California’s redistrict-ing process, grew out of the controversial redistricting that began after the completion of the 2000 Census. In the 1990s, disagreement between the Democratic legislature and Republican Governor Pete Wilson led to the drawing of maps by a court-appointed team. In 2000, with a Democratic governor and majorities in both the state assembly and senate, Democrats seemed poised to work their will on legislative districts.
State law gives voters the authority to overturn a redistricting plan by referendum. Before the passage of Prop 11, a redistricting plan that received a two-thirds vote in both branches of the legislature would be exempt from referendum. Since neither party was like-ly to command a two-thirds majority in each branch of the legislature, both parties would have to contribute some votes to the final plan in order to avoid a refer-endum.
Democrats reached out to Republicans in the legis-lature in order to obtain the necessary two-thirds votes in each house. They offered Republicans protection for their incumbents in return for approval of the overall plan. This “incumbent-protection plan”1 was popu-lar within the legislature and on Capitol Hill but left
1The final vote for the bipartisan plan (Assembly Bill 632, 2001–2 ses-sion, Cedillo) was 38–2 in the senate and 62–10 in the assembly.
many good-government groups feeling that the power of elected officials had become too entrenched.
Some Republicans believed that their party had acquiesced to permanent minority status. Civic groups such as California Common Cause and the League of Women Voters of California favored alternatives to redistricting by elected officials. Some voting-rights organizations, especially those in the Latino and Asian American communities, feared that the plan saved incumbents at the cost of new opportunities for com-munities of color. Some Democrats feared that by protecting all incumbents, the party had failed to iden-tify opportunities to elect more Democrats.
Civic groups began to meet and confer about what could be done to change the system. The process accel-erated after the 2003 recall of Governor Gray Davis and the election of Arnold Schwarzenegger. Voices of Reform, a bipartisan group led by Fred Keeley and Dan Schnur, drafted a set of reform principles, a process in which California Forward played a key role.
In 2005, Republican Ted Costa put forward Prop 77, which would have created a mid-decade redistrict-ing by a panel of retired judges. The reform community split, with California Common Cause in favor and the League of Women Voters of California opposed. Governor Schwarzenegger made Prop 77 a centerpiece of his controversial special election in 2005. The mea-sure went down to defeat along with the governor’s other proposals by a 20-point margin, 60 percent to 40 percent. Key members of both the Republican and Democratic congressional delegations opposed Prop 77 and raised substantial sums of money to defeat it.
Democratic state assemblymember Alan Lowen-thal had also been developing bills to reform the redistricting process. After the failure of Prop 77 he
Redistricting has long been controversial
in California.

11When the People Draw the Lines League of Women Voters of California
ChAPtEr 1
Background
accelerated his efforts. California Common Cause and other citizen organizations worked with Lowenthal in designing his proposed legislation. Lowenthal was familiar with the model adopted by Arizona in 2000, which at that time represented the most advanced citizen-based approach. A number of other legislators including Senate President pro tem Don Perata and Assembly Speaker Fabian Nuñez also made proposals to change the state’s redistricting process. Like Lowen-thal’s bill, none of those efforts gained enough traction among legislators to become law.2
At the same time, civic organizations had been talking with legislators trying to develop a bill. A 2006 survey conducted under the auspices of the Rose Insti-tute, California Common Cause, and the League of Women Voters of California found that 66 percent of voters favored citizen redistricting.3 Although many of those involved hoped that these conversations would lead to a ballot measure, no bills emerged.
Throughout much of 2007, civic groups focused on drafts of legislation in consultation with the Speaker’s office. Numerous methods of selecting commissioners were considered, but no legislation was forthcoming.4
By August 2007, reformers determined that the clock had run out. There were differences over the appointment process. Legislative leaders wanted some say, even if indirect, in the appointment of commis-sioners, but reformers believed that the selection of commissioners had to be independent of the leg-islature.5 In any case, no legislation appeared to be emerging. Unless advocates moved to the ballot imme-diately, the window to create a commission for the next redistricting cycle would pass.
The civic organizations therefore drew on the progress already made in crafting an initiative consti-tutional amendment. The measure called for a citizen commission insulated from incumbent elected officials to draw the lines for state offices but not for congressio-nal districts. As difficult as it would be for any citizen
2Interview with Trudy Schafer.3Lake Research Partners, “Survey Findings on Redistricting Reform in California” (presentation prepared for Rose Institute, California Com-mon Cause, and the League of Women Voters of California, 2006). Of course, an actual ballot measure would have a more difficult time.4Email communication with Kathay Feng.5Interviews with Trudy Schaffer and Kathay Feng.
Ca. gov. Code § 8252 Citizens redistricting Commission selection Process*
(a) (1) By January 1 in 2010, and in each year ending in the number zero thereafter, the State Auditor shall initiate an application process, open to all registered California voters in a manner that promotes a diverse and qualified applicant pool.
(2) The State Auditor shall remove from the applicant pool individuals with conflicts of interest including:
(A) Within the 10 years immediately preceding the date of application, neither the applicant, nor a member of his or her immediate family, may have done any of the following:
(i) Been appointed to, elected to, or have been a candidate for federal or state office.
(ii) Served as an officer, employee, or paid consultant of a political party or of the campaign committee of a candidate for elective federal or state office.
(iii) Served as an elected or appointed member of a political party central committee.
(iv) Been a registered federal, state, or local lobbyist.
(v) Served as paid congressional, legislative, or Board of Equalization staff.
(vi) Contributed two thousand dollars ($2,000) or more to any congressional, state, or local candidate for elective public office in any year, which shall be adjusted every 10 years by the cumulative change in the California Consumer Price Index, or its successor.
(B) Staff and consultants to, persons under a contract with, and any person with an immediate family relationship with the Governor, a Member of the Legislature, a member of Congress, or a member of the State Board of Equalization, are not eligible to serve as commission members. As used in this subdivision, a member of a person’s “immediate family” is one with whom the person has a bona fide relationship established through blood or legal relation, including parents, children, siblings, and in-laws.
*Enacted by Proposition 11, the Voters First Act (2008).

12 League of Women Voters of California When the People Draw the Lines
ChAPtEr 1
Background
redistricting to win at the ballot box, reformers did not want to provoke opposition from the congressio-nal delegation. Some Democratic partisans feared that a citizen process would represent “unilateral disarma-ment” in redistricting wars nationwide, as Republican legislators were perceived to be drawing congressional lines to their liking in states they dominated.
Under the Arizona redistricting measure, legislative leaders made appointments to most of the commission positions. In contrast, Prop 11 broke new ground in the battle between civic organizations and elected offi-cials. The measure went into detail about the barriers to incumbent influence on commissioners (see sidebar on page 9) and limited the legislature to striking a limited number of applicants from the pool, with no hand in the selection. One observer concluded: “It is hard to imagine a more complete effort to squeeze every ounce of incumbent influence out of redistricting than the [Citizens Redistricting Commission].”6
The campaign for Prop 11 was largely a project of the good-government community and some Califor-nia Republicans, including Governor Schwarzenegger. Major financial support for both Prop 11 and the subsequent Prop 20, which included congressional redistricting, came from a moderate Republican activist, Charles Munger. With a few exceptions (including for-mer governor Gray Davis), Democrats were opposed. But with the congressional districts left out in 2008, there was only mild opposition from congressional Democrats.7
In order to weed out incumbent influence, Prop 11 set out detailed requirements regarding conflicts of interest. The new law barred anyone who, with-in 10 years of applying to serve on the commission, had held federal or state office, had served in any of a variety of capacities within a political party or within the state government, had been a registered lobbyist, had contributed more than $2,000 to a candidate for office, or had a family member holding public office (see sidebar on page 9).
6Bruce Cain, “Redistricting Commissions: A Better Political Buffer?,” Yale Law Journal 121 (2012): 1808, 1824.7Interview with Trudy Schaffer.
Coalition Building
The coalition for redistricting reform included groups with differing goals and expectations. Some of the lead-ing advocates of Prop 11 promoted redistricting reform as a way to create competitive districts, thereby allow-ing moderate legislators of both parties to be elected. Governor Schwarzenegger frequently made this argu-ment. However, neither the design of the measure nor its implementation specified competitiveness as a goal. The emphasis on Communities of Interest (COIs),8 established by Prop 11 and enhanced by Prop 20, took redistricting in the direction of homogeneous districts. Because the major political parties draw support from very different socioeconomic blocs, such an emphasis would be unlikely to create the sort of heterogeneous districts that feature greater competition between the two major parties.
According to a preelection poll by the Field Orga-nization, 41 percent of Democrats, 53 percent of Republicans, and 41 percent of nonpartisans and others supported Prop 11.9 Fifty-two percent of conservatives backed Prop 11, but also 41 percent of liberals, a fairly modest difference. Three Survey USA polls in Octo-ber 2008 found a larger partisan gap. By late October, 49 percent of Republicans backed the measure, com-pared to 26 percent of Democrats.10 Large numbers of voters in both parties were undecided, even close to election day.
The same SurveyUSA poll showed that only 25 percent of African Americans and 28 percent of His-
8“Communities of Interest” refers to the goal of designing districts in which residents have significant characteristics in common. This crite-rion is discussed at greater length below.9Field Poll, October 31, 2008.10Survey USA Poll, Number 14761 (October 29–31, 2008).
tABlE 1. Votes on redistricting measures, 2008 and 2010 (by percent)
Yes noProp 11 2008 51 49 Establish CommissionProp 20 2010 61 39 Add Congressional DistrictsProp 27 2010 47 53 Overturn Citizen Redistricting
Process
13When the People Draw the Lines League of Women Voters of California
ChAPtEr 1
Background
panics supported Prop 11. Some voting-rights groups in communities of color were suspicious of the citizens redistricting commission reform model, particularly the stated goal of maintaining current county and city lines. Some minority activists were concerned that the com-missioners might place loyalty to current county and city lines ahead of adherence to the Voting Rights Act (VRA), even when the VRA ranked higher as a prior-ity for the commissioners to consider in drawing maps. Rosalind Gold, of the National Association of Latino Elected and Appointed Officials (NALEO), expressed this concern:
Anything that reduces flexibility, such as a requirement that city or (county) lines be respected, makes it harder to comply with the Voting Rights Act.11
Engaging those who have historically been exclud-ed from the process takes effort. Justin Levitt noted:
In substantial part because of the Voting Rights Act, minority legislators now occupy some senior legislative positions, and may be suspi-cious of attempts to remove redistricting power from the legislature just as they have arrived in positions of substantial influence. Proponents of reform should engage minority constituencies early in the process, to ensure that propos-als adequately protect minority rights, and to gather support, tacit or explicit, for the need for reform.12
Vladimir Kogan and Thad Kousser13 credited the measure’s organizers with expanding the previous coalition for redistricting reform to include more Dem-ocrats and minority voters by addressing some of these suspicions, including, among other things, requiring that commissioners demonstrate “appreciation for Cal-ifornia’s diverse demographics and geography.”
11Interview with Rosalind Gold.12Justin Levitt, A Citizen’s Guide to Redistricting (New York: Brennan Center for Justice, 2010), 82.13Vladimir Kogan and Thad Kousser, “Great Expectations and the California Citizens Redistricting Commission,” in Reapportionment and Redistricting in the West, ed. Gary F. Moncrief (Lanham, MD: Lexington Books, 2011).
Voters Choose Proposition 11 and Proposition 20
Prop 11 passed despite the fact that its support came more from Republicans than Democrats in a Novem-ber 2008 election that was marked by extraordinary levels of Democratic turnout. Its passage testifies to public skepticism, across party lines, of elected officials and the legislature.14 Voting results were still marked by divisions along racial and ethnic lines; African Ameri-can and Latino communities registered the highest levels of opposition, whereas white suburban neighbor-hoods showed the most support.15
Two years later, voters expanded the scope of the commission by approving Prop 20. By a wide margin, voters defeated a measure on the same ballot to elimi-nate the commission entirely (Prop 27). Although the independent citizen-commission model had been approved by a narrow margin in 2008, its base of support had expanded two years later (see table 1).
14The firm that managed the campaign was Goddard Gunster Public Affairs, formerly called Goddard Claussen Public Affairs. The firm described its strategy on its website: “Goddard Claussen tapped into voter dissatisfaction with the legislature and created messaging about ‘holding legislators accountable’ and ‘ending political gridlock’”; God-dard Gunster Public Affairs, accessed September 2, 2012, http://www.goddardgunster.com.15These racial, ethnic, and geographic divisions can be found in unpub-lished research on the vote on Prop 11 by census tract conducted by Mark Drayse for this report.
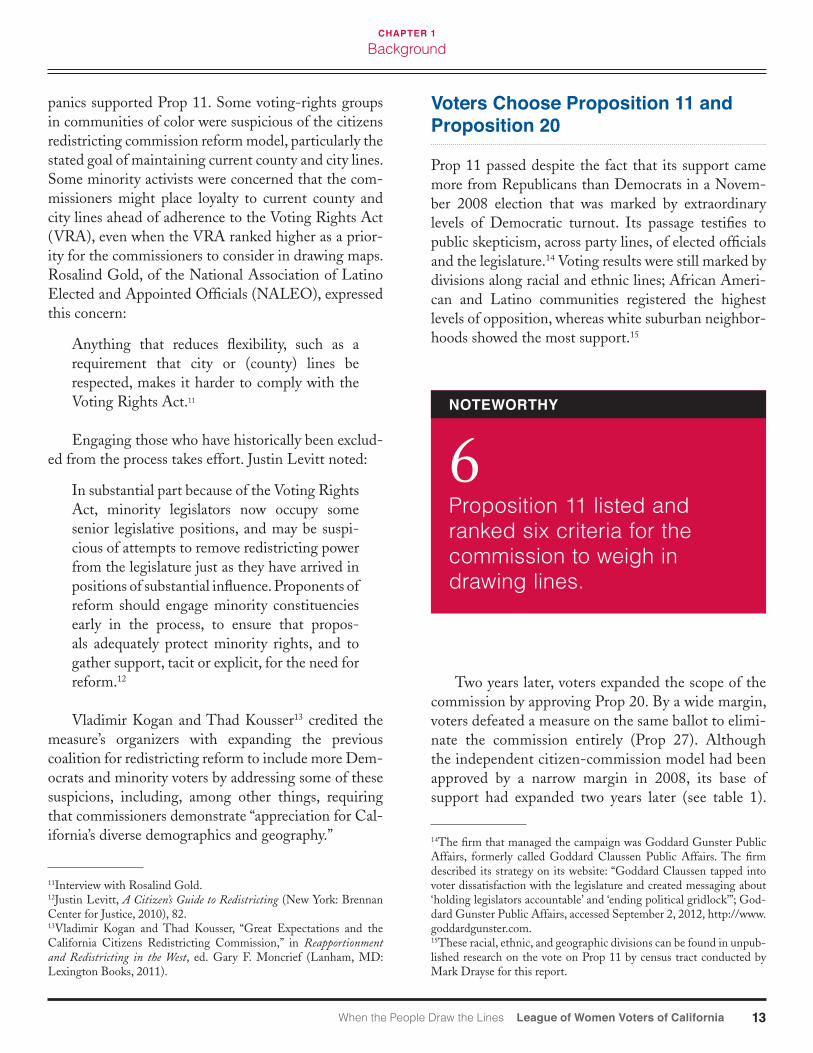
6Proposition 11 listed and ranked six criteria for the commission to weigh in drawing lines.
notEWorthY

14 League of Women Voters of California When the People Draw the Lines
ChAPtEr 1
Background
Election results show increasing support for redis-tricting from 2008 to 2010, with voters approving an expansion of the redistricting process by a 22-point margin in 2010.
Proposition 11 listed and ranked six criteria for the commission to weigh in drawing lines, with prominent
roles for geographical continuity, integrity, and com-pactness. The redistricting process must comply with federal, state, and local laws and the Federal Voting Rights Act and, when possible, senate and assembly districts are to be nested.
Proposition 20 enhanced the importance of COIs in the redistricting process beyond what was included in Prop 11, adding more detail about COIs and included wording, absent from Prop 11, that suggested keeping similar income groups together as much as possible (see sidebar on page 13). It also greatly increased the work-load of the commission, complicated the design of the process by adding the drawing of congressional districts to the scope of the commission’s work, and shortened its deadlines by one month. Although this time con-straint may have been designed to allow more time to defend the maps in court, it tightened an already-chal-lenging schedule. Without Prop 20, the original design of the commission might have faced fewer obstacles to timely planning, organization, and deliberation.
Proposition 20, which expanded redistricting to include federal congressional districts, emphasized communities of interest: groups within a geographi-cal area sharing common social and economic interests but specifically excluding incumbent or political-party interests.
A process originally designed for term-limited state offices now also had to deal with fifty-three high-ly visible congressional seats. Members of Congress, incumbents without term limits, might be expected to be more resistant to citizen redistricting than term-limited members of the legislature.
Proposition 11 drafters faced a key question in determining which agency would supervise the pro-cess of selecting commissioners. After polls showed which organizations and professions were most trusted for this role, the designers selected the Bureau of State Audits (see chapter 2).
Drafters of Prop 11 incorporated the influence of elected officials by allowing each of the “Big Four” (Speaker, Assembly Minority Leader, Senate President pro tem, and Senate Minority Leader) to strike two names from each party subpool (for a total of twenty-four strikes). The original list of qualified nominees was to be sixty in number. The strikes would reduce the group to thirty-six. Akin to a litigant’s peremp-
Proposition 11 Commission Criteria
Proposition 11 listed and ranked six criteria for the Commission to weigh in drawing lines, with a prominent role for maintaining Communities of Interest.
(1) Districts shall comply with the United States Constitution. Senate, Assembly, and State Board of Equalization districts shall have reasonably equal population with other districts for the same office, except where deviation is required to comply with the federal Voting Rights Act or allowable by law.
(2) Districts shall comply with the federal Voting Rights Act (42 U.S.C. Sec. 1971 and following).
(3) Districts shall be geographically contiguous.
(4) The geographic integrity of any city, county, city and county, neighborhood, or community of interest shall be respected to the extent possible without violating the requirements of any of the preceding subdivisions. Communities of interest shall not include relationships with political parties, incumbents, or political candidates.
(5) To the extent practicable, and where this does not conflict with the criteria above, districts shall be drawn to encourage geographical compactness such that nearby areas of population are not bypassed for more distant population.
(6) To the extent practicable, and where this does not conflict with the criteria above, each Senate district shall be comprised of two whole, complete, and adjacent Assembly districts.*
*Cal. Const. art. XXI, § 2 (after voter approval of Prop 11).

15When the People Draw the Lines League of Women Voters of California
ChAPtEr 1
Background
tory challenge to potential jurors, the strikes allowed legislative leaders to block a choice they considered damaging.
The law required that twenty of the sixty appli-cants be chosen from neither the Democratic nor the Republican party. The measure specifically required only nonmembership in either of the top two politi-cal parties. Thus, members of a third or fourth party, independents, and those registered as “decline to state” could qualify. Nothing in the statute suggested that these commissioners must be “centrist” or “moderate.” Conventional wisdom tends to assume that those who register outside the two parties occupy the ideological middle. In fact, such voters could be to the left of the Democrats or to the right of the Republicans.
Although Prop 11 devoted some attention to orga-nization, text on this topic was significantly less detailed and thorough than were the provisions for selecting commissioners. Proposition 11 laid out rules for the hiring, removal, and contracting of commission staff and consultants, including avoiding conflicts of inter-est. The Secretary of State oversees the process until the commission is prepared to take over. The majority vote for such decisions must be spread evenly among the three political subgroups on the commission (see sidebar).
After two years of detailed and careful selection, the commissioners would have only from January 12, 2011, to August 15, 2011, to organize themselves, select lead-ership, hire staff and consultants, educate themselves on redistricting and the VRA, hold public hearings, create maps, and build public confidence.
Conclusions
After a number of stalled efforts to reform Califor-nia’s redistricting process, civic groups came together to create Prop 11, which took redistricting out of the hands of legislators and placed it in the hands of citi-zens. Unlike a similar redistricting plan in Arizona, the California plan placed particular emphasis on removing the influence of incumbent legislators. Proposition 11 increased the importance of COIs and of geographical compactness in redistricting.
Though it initially enjoyed more support among
Republicans and white voters than among Democrats and communities of color, Prop 11 set the stage for broader support for redistricting reform and Prop 20, which expanded the Citizens Redistricting Commis-sion to include congressional as well as state legislative districts, passed by a comfortable margin in 2010. Moreover, a proposition to overturn the Citizens Redis-tricting Commission in the same election was defeated.
Although Prop 11 was carefully thought out in many of its details, particularly in regard to the pro-cess of choosing the commissioners, it provided less detail for some other aspects of the commission’s activity, particularly in the preparation and activity of the commission and in the timeframe allowed for the process.
Proposition 20 Defined Communities of interest in detail
The geographic integrity of any city, county, city and county, local neighborhood, or local community of interest shall be respected in a manner that minimizes their division to the extent possible without violating the requirements of any of the preceding subdivisions. A community of interest is a contiguous population which shares common social and economic interests that should be included within a single district for purposes of its effective and fair representation. Examples of such shared interests are those common to an urban area, a rural area, an industrial area, or an agricultural area, and those common areas in which the people share similar living standards, use the same transportation facilities, have similar work opportunities, or have access to the same media of communication relevant to the election process. Communities of interest shall not include relationships with political parties, incumbents, or political candidates.*
*Cal. Const. art. XXI, § 2, subd. (d)(4) (after voter approval of Prop 20).

16 League of Women Voters of California When the People Draw the Lines
ChAPtEr 2
Selecting the Commissioners
Proposition 11 identified the Bureau of State Audits (BSA) as a state agency with sufficient independent standing to lead the selection of commissioners. The BSA undertook a two-year process that involved the adoption of new regulations and a major statewide outreach program. More than 30,000 Californians applied for commission positions. By November 2010, the BSA had selected the first eight members, who in turn selected the remaining six by January 2011. The BSA’s selection process led to a diverse, capable, and deter-mined commission of fourteen members. Although the selection process was extremely thorough, it used up a significant block of time and money, leaving the commission to rush its process and to rely on private nonprofit groups for community outreach.
Phot
o C
ourte
sy o
f CA
Com
mon
Cau
se

17When the People Draw the Lines League of Women Voters of California
ChAPtEr 2
Selecting the Commissioners
An Agency to supervise the selection Process
The designers of Prop 11 had to designate an agency to lead the selection process. They considered information from opinion surveys in making their decision: judges polled surprisingly poorly, and elected officials drew the worst ratings. The most positive responses were for “independent auditors,” “professors and other academic experts on redistricting,” “members of city and county ethics commissions,” and the “California Fair Political Practices Commission.”1 These results led to the choice of the Bureau of State Audits. This small, often-over-looked state agency was equipped with a well-trained staff and had semi-independent status. The agency audits state and local agencies and programs at the request of the Joint Legislative Audit Committee and also conducts statutory audits of the financial condition of government agencies.
The position of California State Auditor is set forth in the California Government Code:
In order to be free of organizational impair-ments to independence, the bureau shall be independent of the executive branch and legis-lative control.…The head of the bureau is the State Auditor, who shall be appointed by the Governor from a list of three qualified individu-als nominated by the Joint Legislative Audit Committee by a vote of at least a majority of the committee membership from each house of the Legislature.…The State Auditor shall be chosen without reference to party affiliation and solely on the ground of fitness to perform the duties of the office. Prior to selection, the State Audi-tor shall possess a combination of education and experience in auditing and management neces-sary to perform the duties of the office.2
The BSA turned out to be a sound choice. The commissioner-selection process that the agency orga-nized and ran was orderly, efficient, transparent, and
1Interview with Kathay Feng. See also Lake Research Partners, “Sur-vey Findings on Redistricting Reform in California.”2Cal. Gov. Code § 8543.1–3.
effective. The BSA had little experience with a vis-ible statewide public role, but proceeding methodically and diligently, the agency designed and implemented a two-year process that yielded a capable commission. Although the law itself called for a one-year process of choosing commissioners, the actual selection effort took two years, including the development of regulations and identification, recruiting, and evaluation of the candi-dates for commission positions. As would be expected for a governmental agency implementing legislation, the BSA had to fill in details, such as defining the term “impartial” and measuring “diversity.” The agency pro-posed and sought comment on detailed regulations.
In the first iteration of proposed regulations, the BSA proposed requiring analytical and mapping skills, which are not widespread among Californians and which could potentially have limited the applicant pool to those with advanced technical experience. The leadership of the Tri-Minority Caucus3 in the state legislature sent a letter to the BSA suggesting that it redesign these requirements so that a wider commu-nity could participate.4 The limitation of commission positions to those with such expertise would have dis-advantaged a host of groups in the state well beyond communities of color. As a result of feedback from a variety of sources, the BSA did eventually revise these requirements so that formal mapping skills would not be required. Instead, the agency required a basic famil-iarity with maps.
The law also required the BSA to gather informa-tion about possible conflicts of interest. The intrusive nature of the application process (requiring disclosure of personal and family information for conflict-of-interest purposes5) may have served as a deterrent and limited the number of qualified applicants.6 Most like-ly, such concerns were relevant to all communities in the state. Astrid Garcia, of the National Association of Latino Elected and Appointed Officials (NALEO), noted that many potential Latino applicants had seri-
3A caucus of African Americans, Latinos, and Asian Americans.4Letter from Tri-Minority Caucus to the BSA, September 11, 2009. Correspondence cited in this report can generally be found with its author, unless otherwise indicated.5The BSA decided not to release family information in the public documents other than the names of family members, but the decision came too late to reach those who had stayed out of the process.6Interview with Nancy Ramirez.

18 League of Women Voters of California When the People Draw the Lines
ChAPtEr 2
Selecting the Commissioners
ous concerns about privacy.7 Deanna Kitamura, of the Asian Pacific American Legal Council, added:
We also found that at least within the Asian-American Pacific-Islander community, people were hesitant to apply because so much of the information was going to be public, and peo-ple were very hesitant to provide any personal information.8
the BsA Begins outreach
BSA staff members were surprised by their identifica-tion as the lead agency: “It came out of the blue. We had no idea.…It wasn’t necessarily considered the most desirable assignment to take on in the Sacramento world.”9 The agency began to plan for the task ahead as soon as the measure passed. California State Audi-tor Elaine Howle established a working team under the direction of chief counsel Sharon Reilly. The group included five professionals, three attorneys, the public-affairs chief, and project manager Dan Claypool (who later became executive director of the commission). The BSA had to propose and adopt regulations, estab-lish the recruitment process, and evaluate applications, leading to a final pool of sixty applicants and a random draw of the first eight commissioners.
A working group led by California Forward and including California Common Cause, the League of Women Voters of California, the National Association for the Advancement of Colored People (NAACP), the National Association of Latino Elected and Appoint-ed Officials (NALEO), the Asian Pacific American Legal Center (APALC), the Mexican American Legal Defense and Education Fund (MALDEF), the American Association of Retired Persons (AARP), the Central Coast Alliance United for a Sustainable Economy (CAUSE), and the Greenlining Institute monitored the agency’s work from the start, sending numerous comments and suggestions. California For-ward’s consultant organized conference calls and helped with drafting. This complex and unusual relationship
7Interview with Astrid Garcia.8Interview with Deanna Kitamura.9Interview with Steven Russo.
between a state agency and outside groups led to ques-tions of boundaries and responsibilities. The BSA staff made clear that the agency, not outside groups, would be in charge. The BSA staff communicated that “what-ever the proponents subjectively thought about how this was going to work, the decision making would be with us, because we felt that there was a reason why the voters approved us to be in charge of administering it as opposed to having interest groups in charge.”10 Over time, the relationship became a cooperative one, as the outside groups provided input and BSA staff members were generally responsive to suggestions.
The agency had to reach potential applicants in the most effective way possible. Mass mailing to each regis-tered voter would be prohibitively expensive. However, the BSA moved immediately to generate a grassroots email campaign that reached out to governments at all levels, to departments within the state government, and to nonprofit organizations, libraries, universities, and civic organizations. The statewide special elec-tion on May 19, 2009, provided a unique opportunity to inform California voters of the application process. The BSA placed a half-page notice at the end of the Official Voter Information Guide mailed to every Cali-fornia voter by the Secretary of State.11 The guide went to press on March 18, 2009, and was mailed to voters between April 9 and April 28, 2009.
Commissioner selection took a little over two years, from January of 2009 to February of 2011. The process involved establishing regulations for the process, con-ducting outreach, selecting a panel to review applicants, reviewing applications, interviewing candidates, and selecting candidates in two stages, allowing the first group to select the second (see Table 2).
In early 2009, the BSA sought bids for a media contract to publicize the selection process. The first Request for Proposal (RFP) was unsuccessful; the agen-cy believed that the specifications generated proposals that were difficult to evaluate and compare. Finally, on May 21, 2009, after a revised RFP was issued, the BSA awarded the contract to Ogilvy Public Relations
10Interview with Steven Russo.11The notice about Prop 11 ran on the second-to-last page, clearly vis-ible if a reader opened the back cover. It was also listed in the Table of Contents under “Information Pages,” along with other items such as how to become a poll worker or vote by mail.

19When the People Draw the Lines League of Women Voters of California
ChAPtEr 2
Selecting the Commissioners
Action or Event date(s)Interested Persons Hearings, held in Sacra-mento (2 meetings), San Diego, Fresno, Los Angeles, and San Francisco, to solicit ideas for draft regulations.
Jan. 26–Mar. 3, 2009
Request for Proposals (RFP) issued for Statewide Outreach Plan
Mar. 20–Apr. 15, 2009
Revised RFP out for Statewide Outreach Plan
Apr. 30–May 15, 2009
BSA issued Notice of Intent to Award to Ogilvy Public Relations Worldwide
May 21, 2009
Notice of Proposed Rulemaking published (with first draft of regulations)
Jul. 31, 2009
Public Hearing on Regulations and end of 45-day public comment period
Sept. 14, 2009
Notice of Modification to Text of Proposed Regulations published
Sept. 28, 2009
Meeting with Outreach Partners,* BSA, and Ogilvy in Sacramento and by conference call
Oct. 1, 2009
End of 15-day comment period for revised regulations
Oct. 13, 2009
Final Regulations Adopted and Submitted for federal Department of Justice (DOJ) preclear-ance
Oct. 19, 2009
Press Release announcing final regulations Oct. 20, 2009Wedrawthelines.ca.gov formally launched Nov. 12, 2009Selection of Applicant Review Panel (ARP) by random drawing
Nov. 16, 2009
Online Influencer Roundtable/Blogger Sum-mit
Dec. 10, 2009
RedistrictingCA Coalition conference in Bur-bank to kick off outreach
Dec. 15, 2009
Initial Applications accepted online Dec. 15, 2009–Feb. 16, 2010
Preclearance of first set of regulations Dec. 18, 2009Supplemental applications accepted online Feb. 17–Apr. 19,
2010First ARP meeting (and training of panel members via presentations)
Feb. 25, 2010
BSA holds webinars to assist with supple-mental application
Mar. 18, 26, and Apr. 7, 2010
Notice of Proposed Rulemaking published (with second set of regulations regarding first eight commissioners choosing final six com-missioners and several other items)
Apr. 16, 2010
Public hearing on (second set of) proposed regulations and end of 45-day public com-ment period.
Jun. 1, 2010
tABlE 2. selection Process Conducted by the Bureau of state Audits
*The term the BSA used to refer to outside groups that were active in providing input to the process and interested in promoting the applica-tion opportunity.
Action or Event date(s)Notice of Modification to Text of Proposed Regulations published
Aug. 9, 2010
End of 15-day comment period for revised regulations
Aug. 24, 2010
Second set of regulations adopted and filed with Office of Administrative Law (OAL)
Sept. 2, 2010
Second set of regulations submitted for federal DOJ preclearance
Sept. 10, 2010
Preclearance of second set of regulationsSecond ARP meeting Apr. 19, 2010Third ARP meeting Apr. 30, 2010Fourth ARP meeting (reduced pool of 4,546 applicants to 622)
Jun. 11, 2010
Fifth ARP meeting (reduced pool of 622 applicants to 314)
Jun. 30, 2010
Sixth ARP meeting (reduced pool of 314 applicants to 162 at start of meeting; further reduced to 120 by end of meeting; designed and adopted interview questions)
Jul. 19–21, 2010
Seventh ARP meeting during which ARP conducted 115 interviews
Aug. 6–Sept. 13, 2010
Final (Eighth) ARP meeting (reduced pool of 115 applicants to 60)
Sept. 22–23, 2010
Legislature strike process (reduced pool of 60 applicants to 36)
Sept. 29–Nov. 12, 2010
Selection of the first 8 commissioners in public drawing (out of 36 in pool)
Nov. 18, 2010
First 8 commissioners sworn in Nov. 30, 2010Training of first 8 commissioners Nov. 30 and Dec. 1,
2010First meeting reconvened and slate of 6 commissioners selected
Dec. 10, 2010
First meeting reconvened again and ap-proved slate of final 6 commissioners
Dec. 15, 2010
Hand over process to the Secretary of State
Between Dec. 15, 2010, and Jan. 12, 2011
First meetings of 14 commissioners Jan. 12–14, 20–21, and 26–28, 2011
5 of final 6 commissioners are sworn in Jan. 12, 2011Elaine Kuo, 1 of first 8 commissioners, resigns
Jan. 14, 2011
Maria Blanco is sworn in Jan. 20, 201113 commissioners vote to replace Elaine Kuo with Angelo Ancheta
Jan. 28, 2011
Angelo Ancheta sworn in and 14-member commission complete
Feb. 10, 2011
Second meeting of commission and first meeting of final 14 members
Feb. 10–12, 2011

20 League of Women Voters of California When the People Draw the Lines
ChAPtEr 2
Selecting the Commissioners
Worldwide. The BSA did not have the funds in hand to support this $1.3 million contract, however, and requested that the state legislative-oversight committee provide support. State funding was not forthcoming,12 and the agency eventually used its reserve fund for the outreach contract.
A well-regarded company, Ogilvy had previously conducted public-information campaigns for state agencies, including the Department of Transporta-tion (“Don’t Trash California”), the State Treasurer (“Buy California Bonds”), and the Office of Traffic Safety (“2008 Holiday DUI Enforcement Campaign”). Under the BSA’s direction, Ogilvy organized a broad publicity campaign and negotiated twice the number of radio spots per dollar compared to the going rate, allowing the BSA to conduct a more cost-effective campaign. BSA officials gave interviews to local and statewide media, prepared flyers and other documents, and assumed far more visibility than was normal for this low-profile agency.13 Staff members spoke at public events and actively sought out sites for presentations.
In its outreach effort, the BSA had to be conscious of the possible impact of Prop 209.14 Would Prop 209
12Letter from Elaine M. Howle, CPA and State Auditor, to Honorable Denise Moreno Ducheny, Chair, Joint Legislative Budget Committee (August 11, 2009).13Interview with Margarita Fernandez.14Prop 209, also known as the California Civil Rights Initiative, was passed in 1996, with 54.55 percent of the vote, and added Section 31 to Article 1 of the California Constitution. Art. 1, § 31. It reads: “The state shall not discriminate against, or grant preferential treatment to, any individual or group on the basis of race, sex, color, ethnicity, or na-tional origin in the operation of public employment, public education, or public contracting.”
tABlE 3. James irvine foundation grants for Commission selection Process
organization grant AmountAPALC $165,000CAUSE (Central Coast Alliance United for a Sustainable Economy)
$65,000
Los Angeles Urban League $50,000 NALEO Educational Fund $100,000 The Greenlining Institute $100,000California Common Cause* $250,000
allow the BSA to reach out in an active way to racial and ethnic minority communities? The BSA inter-preted Prop 11 to mean that the agency had to seek to contact all voters, given that the measure stated that the “State Auditor shall initiate an application process, open to all registered California voters in a manner that promotes a diverse and qualified applicant pool.” This principle guided the BSA’s efforts in its outreach.
The James Irvine Foundation, a private nonprofit grant-making foundation, supplemented the state’s public outreach and education efforts. Believing that the success of the redistricting process depended on broad and well-informed public participation, Irvine supported six nonprofit organizations in developing public education materials, conducting outreach, and training a diverse cross-section of Californians to apply to be members of the commission. Through these grants, Irvine sought to assure a fair, transparent, and well-informed redistricting process and increase the likelihood of establishing a diverse commission. As dis-cussed further in chapter 4, Irvine made a second round of grants to support public involvement in the mapping process once the commission was seated.
The Irvine Foundation gave a number of grants, most between $50,000 and $165,000, to several groups involved in the commissioner-selection process. A larger grant awarded to California Common Cause, for $250,000, covered both the selection and the delibera-tion phases (see Table 3).
These efforts were independent of the work of the BSA. As part of its outreach, the BSA remained in con-tact with the Irvine-funded groups along with the wide range of other organizations that were following the process, such as the Chamber of Commerce. Califor-nia Common Cause subgranted a portion of its Irvine funding to other organizations to support collaborative outreach strategies.15 In partnership with these organi-zations, California Common Cause hosted a conference in December 2009 to kick off the applicant-recruitment process and two conferences in 2010 to train organi-zations and individuals seeking to participate in the redistricting process. The collaborative group organized by California Common Cause also developed public-
15California Common Cause gave grants totaling $92,500 to APALC, the Center for Governmental Studies, the Institute for Governmental Studies, the LWV, MALDEF, the NAACP, NALEO, and the Rose Institute.
*The grant to California Common Cause supported work during both the commissioner selection and deliberation phases.

21When the People Draw the Lines League of Women Voters of California
ChAPtEr 2
Selecting the Commissioners
education materials concerning how the commission would work, how to construct useful testimony, and how to participate in deliberations. Finally, the groups estab-lished a collaborative website, redistrictingca.org, and organized social-media campaigns that supplemented public information provided by the commission.
With Ogilvy on board, the BSA arranged a meet-ing open to all interested organizations. The coalition of organizations included a broad array of groups, such as the League of Women Voters of California, the American Association of Retired Persons, the Cham-ber of Commerce, and a number of voting-rights organizations. The BSA was pursuing a broad rather than a targeted media strategy, and some of the groups urged more targeted approaches in minority commu-nities. Civil rights activists concerned about diversity in the process, in particular, feared that the BSA’s out-reach program might not reach minority communities.
the Application Process
The BSA developed a robust online application process using in-house staff and, in the service of transparency, providing real-time updates on application numbers with demographic breakdowns. Proposition 11 had established the following seven-step process for the selection of commissioners:16
n The BSA must initiate the application process by January 1, 2010 (or 2020, 2030, etc.).
n The BSA must remove applicants who have con-flicts of interest, as defined in the Code.17
n The BSA must form an Applicant Review Panel (ARP) of three qualified independent auditors em-ployed by the state.
n The ARP must then review applications and select sixty of the most qualified applicants based on “rel-evant analytical skills, ability to be impartial, and appreciation for California’s diverse demograph-ics and geography.” The sixty must include twenty
16Voters First Act, Proposition 11 (2008) (codified at Cal. Gov. Code § 8252).17See sidebar, supra, Chapter One, Cal. Gov. Code § 8252.
Democrats, twenty Republicans, and twenty regis-tered with neither of those two parties.
n The four leaders of the legislature may strike up to two applicants each, from each of the three pools of Democrats, Republicans, and others.
n The BSA must randomly draw eight names by No-vember 20, 2010 (2020, 2030, etc.).
n Those eight randomly selected commissioners must then select the remaining six from the appli-cant pool, with a requirement to ensure diversity including gender, racial, and ethnic factors.
Although the initial application phase attracted an impressive number of applicants, the BSA did not track how the applicants found out about the applica-tion process and therefore missed a chance to explicitly identify what types of outreach worked. In retrospect, the BSA could have added a question to the end of the application asking, “How did you learn about the Commission and this application?” or sent a follow-up email to each applicant asking for that information.
The first round of applicants provided evidence of both the success and the limitations of the outreach approach adopted by the BSA. More than 30,000 Californians submitted initial applications to be com-missioners. Of this group, nearly 25,000 met the basic criteria for further consideration. For a process consid-ered abstract and distant to most voters, the response was remarkable. The broad publicity process had cer-
tABlE 4. Commissioner Applications by gender and Ethnicity Compared to Population totals (Percent)
California Registered Voters, Nov 2008
Initial Applicants*
60 Finalists
Male 46.68 67.90 51.67
Female 53.32 32.10 48.33
White 59.01 71.18 33.33
Black 7.42 8.40 13.33
Asian 10.23 4.75 18.30
Latino 21.92 11.02 28.33
Other 1.42 4.65 6.71
*Bureau of State Audits.

22 League of Women Voters of California When the People Draw the Lines
ChAPtEr 2
Selecting the Commissioners
tainly worked far better than anticipated. Nevertheless, some conservatives were concerned that civil rights organizations were recruiting and “prepping” appli-cants. As a result of their complaints, the BSA initiated a series of webinars and workshops open to all to make application assistance widely available.18
Table 4 illustrates the distribution of applicants, both in the first round and in the supplemental appli-cations to follow, compared to a breakdown of voter registration. Comparison with voter registration rather than population is more useful because commissioners were drawn from the pool of the state’s registered voters. Initial applications for the commission did not match the demographics of the registered voting population: women, Asians, and Latinos were underrepresented. The finalists, however, moved closer to the proportions of the pool of registered voters.
BSA attorneys and staff assistants for each panel member supported the Applicant Review Panels. While continuing to conduct audits for the state, a BSA staff team hosted ARP meetings, organized applicant trav-el to Sacramento for interviews, analyzed and posted data about applicants, and conducted supplemental research for the ARP, the first eight commissioners, and the public. The ARP members received training in the requirements of the Voting Rights Act in order to understand the requirements that commissioners would face. The team members received this training in a timely manner, in contrast to the delay in such train-ing for the full commission (see chapter 3).
18Interviews with Deborah Howard and Tony Quinn. Quinn com-plained that some candidates were eliminated because of the search for diversity and blamed The James Irvine Foundation for this priority.
Bureau staff conducted investigations to verify information provided by applicants.19 Results of these investigations were posted on the commission’s web-site. The extensive and well-organized staff effort testified once again to the thoroughness of the design of Prop 11, to the preparation of the BSA, and to the fact that it was an established state agency with an infrastructure that was not available to the commis-sion itself.
deliberation and Process of Elimination
The ARP deliberated over the applications in a highly formal and transparent manner. All of the ARP meet-ings were held in public, including interviews with applicants, which were accessible not only to the public but also to legislative staffers who would be advising the leadership on their “strikes.”
The ARP members, however, remained isolated as individuals from public pressure. Their contact infor-mation was withheld from the public, and they stayed out of touch with each other while examining applicant files. All members were assigned assistants, who were directed not to be in contact with one another.
Each ARP member rated each application on an individual basis. These ratings were then shared in a public meeting with the other members of the panel. All decisions had to be unanimous. Of the 4,546 appli-cants who submitted full applications, including essays, references, and disclosure of financial relationships, the panel members voted independently and unanimously, prior to group deliberation, to eliminate 3,924, leaving 622 by June 11, 2010.20
As the pool shrank, every applicant received increased scrutiny. BSA staff thoroughly investigated applications to identify any potential conflicts or oth-er issues that might make applicants ineligible. The results of these inquiries were made available for public comment in writing or at ARP meetings. Combined
19See memorandum from Steven Benito Russo, Chief of Investigations for BSA, to the APR, September 21, 2010, describing the investiga-tion process.20Public meeting of the Board of State Auditors Applicant Review Panel, June 30, 2010, transcript.
The ARP deliberated over the applications in a highly formal and transparent manner.

23When the People Draw the Lines League of Women Voters of California
ChAPtEr 2
Selecting the Commissioners
with webcast interviews, this approach created an open interview and selection process. The public had numer-ous opportunities to weigh in, from the development of regulations to comments directed to the ARP about individual applicants. The BSA posted public com-ments on the Internet for public access.
The final pool was well qualified, reasonably diverse, and seemed to have avoided the egregious conflicts of interest that had been feared. There were no obvious party coalitions that would either dominate or block deliberation. As one observer commented regarding the detailed strictures against conflicts of interest, “The rules were insane, but they worked.”21
Although some feared that partisanship repre-sented the greatest potential obstacle to success in choosing the commissioners, the design of the Cali-fornia process provided some checks and balances. Unlike the model in Arizona in 2011, where questions about the possible partisan connections of the fifth
21Interview with Paul Mitchell.
“neutral” member had major consequences because of that person’s tie-breaker role, the California plan had some advantages. In particular, either party would have to control several commissioners in order to become a partisan blocking force.22
Meeting the Prop 11 requirement of diversity among commissioners, however, posed a challenge. Once the eight commissioners were chosen by random draw from among the qualified pool, Prop 11 con-nected their choices for the next six more specifically to diversity: “The six appointees shall be chosen to ensure the commission reflects this state’s diversity, including, but not limited to, racial, ethnic, geographic, and gen-der diversity. However, it is not intended that formulas or specific ratios be applied for this purpose. Applicants shall also be chosen based on relevant analytical skills and ability to be impartial.”23
The ARP considered diversity among other fac-tors in its recommendations on applications, in
22Cain, “Redistricting Commissions.”23Cal. Gov. Code § 8252 (g).
tABlE 5. the final 14 Commissioners
Name Party Selected/Random Draw Occupation CityVincent Barabba Republican Random Draw Business and Marketing Capitola
Cynthia Dai Democrat Random Draw CEO and Professor San Francisco
Stanley Forbes Affiliated with neither major party
Random Draw Bookstore Co-Owner Esparto
Connie Galambos Malloy
Affiliated with neither major party
Random Draw Urban Planning and Policy Development
Oakland
Elaine Kuo Democrat Random Draw (Resigned) Researcher Mountain View
Jeanne Raya Democrat Random Draw Lawyer; Risk Management San Gabriel
Jodie Filkins Webber Republican Random Draw Self-Employed Attorney Norco
Peter Yao Republican Random Draw Former Mayor; Engineer Claremont
Gabino Aguirre Democrat Selected Retired Teacher and School Principal
Santa Paula
Maria Blanco Democrat Selected Nonprofit Executive Los Angeles
Michelle R. DiGuilio Affiliated with neither major party
Selected Community Planning; Homemaker Stockton
Lilbert “Gil” R. Ontai Republican Selected Architect and Lecturer San Diego
M. Andre Parvenu Affiliated with neither major party
Selected Geographer and Urban Planner Culver City
Michael Ward Republican Selected Chiropractor and Polygrapher Anaheim
Angelo Ancheta Democrat Other (Selected by the com-mission to replace Elaine Kuo)
Law Professor San Francisco

24 League of Women Voters of California When the People Draw the Lines
ChAPtEr 2
Selecting the Commissioners
accordance with Prop 11.24 Ward Connerly later filed a lawsuit charging that Prop 11 itself violated Article 1, § 31, of the California Constitution because of its emphasis on racial, ethnic, and gender diversity in the selection of the six final commissioners.25 In an amicus brief, California Common Cause, the League of Women Voters of California, and the California NAACP responded that the courts had not equated the consideration of diversity with preferential treat-ment and that the goal of making the commission a representative body was not inconsistent with that of prohibiting racial discrimination or preference.26 On December 12, 2012, the Superior Court of California, in Sacramento, ruled in favor of the State of Califor-nia and against Ward Connerly. Judge Michael Kenny determined that the commissioners were “public offi-cers,” not public employees, and that therefore Prop 209 did not apply to the commission.27
the fourteen
After the legislative leaders made their strikes, the BSA conducted a carefully designed random drawing that yielded the first eight commissioners. That group would be required to select the remaining six commis-sioners from the existing pool. The final commission included members from a range of geographical regions and variety of backgrounds.
Conclusions
The BSA effectively carried out a difficult project in selecting the first eight commissioners and creating the
24Public meeting of the Bureau of State Audits Applicant Review Pan-el, June 30, 2010, transcript.25Jim Sanders, “State Discriminates in Choosing Redistricting Panel, Suit Argues,” CapitolAlert, Sacramento Bee, Mar. 23, 2012; Connerly v. California, No. 34-2011-80000966 (Cal. Super. Ct., Sacramento County 2011). 26Brief for California Common Cause, League of Women Voters of California, and California NAACP in Support of Demurrer, as Amic-us Curiae, Connerly v. California, No. 34-2011-80000966 (Cal. Super. Ct., Sacramento County 2011).27Superior Court of California, No. 34-2011-80000966-CU-WM-GDS. November 21, 2012.
pool from which the remaining six were drawn. In fact, the BSA and its Applicant Review Panel operated in a manner more typical of traditional citizen commissions than the redistricting commission itself. The BSA had sufficient time to develop regulations, to train its ARP members, to hear from the public, and to reach sound conclusions in a reasonable amount of time.
Although the BSA lacked the full budget its work required, and its professional staff worked long hours, the agency did have budget reserves sufficient to pay for its large media outreach contract. With bud-get and time likely to be major concerns in the next iteration, the time and resources for commissioner selection will likely be reduced. Regulations adopted at great length by the BSA in the first iteration will be in place and open to revision, saving considerable time and expense.
In relative terms, a $1.3 million contract to reach a state of 17.3 million registered voters is hardly expen-sive. But in the context of an overall redistricting budget of roughly $10 million and with the commission itself short of resources, the need for a comparable media contract for the next recruitment does not seem com-pelling. In the next iteration, other means are likely to be available to alert voters to the opportunity to apply to be on the commission. Outreach to potential appli-cants for commission positions should, for instance, draw on scheduled efforts by the U.S. Census Bureau to contact California adults.
The James Irvine Foundation provided major finan-cial support to fill a gap in the redistricting process. It is possible that the Irvine Foundation and other private funders will once again provide support for activities that may not receive governmental funding. However, there is no guarantee that this will occur, in whole or in part. As a result, new ways to partner with other governmental and community agencies to promote the opportunity to apply will be necessary.
The selection of commissioners stood as the cor-nerstone of the commission process. The very success of that effort testifies to the value of advance planning, sufficient time, and staff. Finding fourteen appropriate commissioners took the largest share of thought, time, and attention, whereas the work of the commission itself was compressed, resource limited, and difficult to organize (see chapter 3).

25When the People Draw the Lines League of Women Voters of California
ChAPtEr 3
Organizing the Commission
By the time the commission was seated in January 2011, two years had passed. The new state law directed the Secretary of State to take over from the BSA in November 2010 in order to get the commission up and running but provided little direction on how to carry out that responsibility. The commissioners had little guidance for their organiza-tional planning, and they improvised. Key tasks, such as training in the VRA and hiring VRA counsel, delayed the process. An ambitious schedule of public hearings drew sig-nificant public interest but consumed large blocks of commissioner and staff time. The major deliberative work of the commission was telescoped into a period of less than two months. The next commission needs more preplanning and organizational support in carrying out its obligations.
Cal
iforn
ia C
itize
ns R
edis
trict
ing
Com
mis
sion

26 League of Women Voters of California When the People Draw the Lines
ChAPtEr 3
Organizing the Commission
The commission had one primary if imposing duty: to draw the lines for 177 state and federal election dis-tricts. It had an extremely short period of time in which to carry out that task, a timeline made even tighter and more challenging by the passage of Prop 20 shortly before the seating of the commission. The commis-sioners could not easily rely on the previous district lines as their main foundation and template because of the required focus on Communities of Interest (COIs) instead of the traditional incumbent protection.
It would have taken a phenomenal organizational effort, planned well in advance and steadily executed, to make this task go smoothly. Such an undertaking, given adequate resources and planning, would have resembled the effort of the BSA to select commis-sioners, and even then, given the size of the state, the budget limitations, and the number of electoral dis-tricts, it would have been a mad rush to the finish line.
The designers worried first about overcoming the seemingly impossible odds of winning at the ballot box and then about keeping excessive incumbent influence out of the commissioner-selection process, promoting diversity, and encouraging transparency. Voters shared these concerns as well and so did not exert public pres-sure for greater organizational planning. It was difficult to foresee in any case how such a commission would be organized and run.
the role of the secretary of state
Any citizen commission, especially one with some members new to public service, needs help in devel-oping expectations about staff and consultants. A citizen commission can use its support network to make its work more efficient and to avoid becom-ing bogged down in administrative matters. Under Prop 11, the Secretary of State was to “provide sup-port functions to the commission until its staff and office [were] fully functional.” However, the civic coalition that created Prop 11 provided limited direc-tion on the nature of that support or how it would be implemented. The BSA did not fully elaborate on the Secretary of State’s role in its rulemaking pro-cess. After acknowledging that the function of the rulemaking process was “to provide guidance and
clarity,”1 the BSA provided that “[a]fter the 14 mem-bers of the commission have been selected, the [BSA] will cooperate with the commission and with the Sec-retary of State in order to facilitate the commission[’s] becoming fully functional.”2
The Secretary of State’s office produced a one-time report in September 2010, at the behest of the Cali-fornia state legislature, outlining the agency’s plan for fulfilling the Prop 11 mandate.3 The report outlined an “action plan” for how the BSA and the Secretary of State would coordinate their efforts:
The Secretary of State views November 2010, through February 2011, as the critical transi-tion period for the Commission. The Secretary of State plans to work closely with BSA to ensure transparency as well as consistency of information. To ensure this smooth transition, the Secretary of State and BSA have initiated monthly meetings to discuss activation issues. The key players will be the Secretary of State administrative managers and BSA’s legal team.4
1California Regulatory Law Bulletin, 2010-16 CRLB 153.2Cal. Code Regs. tit. 2, § 60861. (In their Notice of Proposed Regula-tions, the BSA noted: “The [Voters First] Act provides little guidance regarding how the final stage of the application process shall operate and how selected applicants will make the transition to a fully func-tional commission”; 2010-16 CRLB 153 ).3“Administrative Support Action Plan for the Citizens Redistricting Commission, State of California,” September 15, 2010, accessed Sep-tember 14, 2012, http://www.sos.ca.gov/admin/reports/2010/citizens-redistricting-action-plan.pdf.4Ibid.
177The commission had one primary if imposing duty: to draw the lines for 177 state and federal election districts.
notEWorthY

27When the People Draw the Lines League of Women Voters of California
ChAPtEr 3
Organizing the Commission
The Management Services Division for the Sec-retary of State assisted the commission in its initial organization. The Secretary of State’s team created job descriptions for key commission staff and placed them on the state website. The agency helped to organize the initial commission meetings and provided guidance to the commissioners in their early organizational deci-sions. Although the Secretary of State’s most visible period of involvement was between December 2010 and January 2011, the office had been at work for sev-eral months developing job descriptions and addressing logistical issues for the commission. Staff from the Sec-retary of State’s office worked with the state controller to ensure that the commission staff would be paid and that the commission would have a functioning bank account.
Replacing professional politicians in the redis-tricting process was the core of the reform. Replacing government support staff and providing an institutional base is a different matter. Citizen commissioners need the tools, the time, and the structure to make up for those gaps. Neither the BSA nor the Secretary of State had the requisite experience to provide such assistance, and in any case, both agencies were justifiably reluc-tant to intrude on the prerogatives of the commission. All parties involved were aware of the importance of preserving the commission’s independence. Although this care was important to the commission’s success, it also left the commission at times without essential guidance. As a result, the commissioners found ways to organize their own work.
In hindsight, the plan to hand off authority from the BSA, which had embraced its role and spent more than a year immersing itself in the process of select-ing redistricting commissioners, to an agency that had been less involved in the redistricting project was unlikely to lead to optimal results. The BSA was more familiar with the redistricting process and might have been in a better position to help the new commission get on its feet.
Ideally, the state agency that selects commission-ers should help organize the commission, providing logistical and other support to get the citizen body up and running.5 Any such agency will have to assist the
5The state legislature adopted a recommendation from the commission to follow this approach.
commission, as did the Secretary of State, to deal with state administrative procedures that can be extensive and cumbersome.
the Position of Executive director
For any commission, the process of choosing an exec-utive director is a key administrative decision. The executive director links staff and the commission and provides essential guidance to the commissioners. Under the supervision of the Department of Person-nel Administration, the Secretary of State’s office took the lead in recruiting candidates for the position of executive director,6 drafting a job description before the commissioners were appointed and circulating it on the network normally used to advertise state jobs and on the commission website. The job bulletin indicated that although applicants had to possess most of the follow-ing abilities, they were not required to have them all:
Knowledge of the organization and functions of California State Government including the organization and practices of the Legis-lature and the Executive Branch; principles, practices, and trends of public administration, organization, and management; techniques of organizing and motivating groups; pro-gram development and evaluation; methods of administrative problem solving; principles and practices of policy formulation and develop-ment; fundamentals of accounting, budgeting, and fiscal reporting; personnel management techniques; the State’s Equal Employment Opportunity Program.7
These requirements made the job less accessible to those outside Sacramento.8 The job search did not
6Interview with Dora Mejia.7Available at http://www.wedrawthelines.ca.gov/downloads/job_ opportunities/executive_director.pdf, accessed September 13, 2012.8Doug Johnson of the Rose Institute suggested to the commissioners in public testimony that the job description should extend beyond Sac-ramento: “It would be a symbolic step to get away from the Sacramen-to entities that you’re officially independent of, and it may also widen the pool of people who would be interested in being executive director, get you people who aren’t already in Sacramento, which by definition they are focused on the government as it is, and not so independent.”

28 League of Women Voters of California When the People Draw the Lines
ChAPtEr 3
Organizing the Commission
prioritize experience with guiding citizen commissions or elected boards. Retired city managers, chief admin-istrative officers, heads of government departments, or executive directors of boards and commissions at the state, county, and local levels would have constituted a rich pool of candidates who would have been famil-iar with how to guide a new commission with a short timeline.
After they took office, the commission narrowed the pool of applicants by adopting the tightest possible conflict-of-interest rule on staff and consultants, even though the law only required them to apply these rules “to the extent applicable.”9
On January 19, 2011, the commission chose as its executive director Dan Claypool, the project manag-er of the BSA team that had organized the selection process. Claypool brought to the commission a wide range of experience with state government and obvious familiarity with the commissioners through the selec-tion process. Claypool noted, though, that because of his role as a state employee, he had to overcome the commissioners’ suspicion of the government.10 He hired additional staff in the areas of communications and logistics.
Claypool navigated the major challenge of finding office space, first in the governor’s office and later in a different building. Underperforming computers and printers indicated a serious equipment problem; the
Commission meeting, January 12, 2011, transcript. All transcripts are available at http://wedrawthelines.ca.gov/transcripts.html.9Interview with Dora Mejia; Cal. Gov. Code § 8253 (a)(5).10Interview with Dan Claypool.
staff had to scrounge for trash cans. Commissioner Jeanne Raya felt that the commissioners were “nomads” without a real home and recalled that there were long delays in providing email and other communications.11
The next commission would benefit from the assistance of an official from a state agency who would be assigned to the commission to facilitate work with the state government and to help organize the com-mission until an executive director is hired. With the assistance of such an official, the commission would face less pressure in choosing an executive director, who could guide and support the commission’s work in light of experience with other commissions or elected bodies and could be selected from the broadest range of candidates.
the Commission Convenes
In their first formal meeting as a full commission on January 12, 2011, the commissioners indicated that they would not wait for staff to be hired before making important process decisions. They felt that time was pressing on them. As one commissioner said, “I am just thinking logistically, we have so much work to get done right now.…[T]he [c]lock is ticking”12 Commissioner Gil Ontai wondered, “How can we get it done?” The intense pressure of their timeline led commissioners into self-management. They were, at least in their own minds, on their own. Commissioner Michael Ward remembered, “I was expecting a formal handoff or redistricting training. How does a commission work? There was no real direction.”
Perhaps because they did not have a say in set-ting the criteria for key staff, the commissioners were determined to control the rest of the process. Though this sense of ownership by the commission helped the project succeed, it was risky to operate without an orga-nizational safety net below.
The commission quickly adopted a proposal to create subcommittees, although some commission-ers expressed doubts about the wisdom of that course.
11Unless otherwise indicated, all comments by commissioners are from the author’s interviews with them.12Commissioner Cynthia Dai, commission meeting, January 13, 2011, transcript.
At the beginning, the commissioners seemed to see themselves less as jurors than as civic leaders reaching out to
the community.

29When the People Draw the Lines League of Women Voters of California
ChAPtEr 3
Organizing the Commission
Commissioner Ward commented, “It seems to me that we’re just burdening ourselves logistically…to form a bunch of subcommittees if we’re going to follow the same process as we’re doing as a full committee.”13 Commissioner Maria Blanco asked, “What would the finance subcommittee do that can’t be done on the full commission?”14 But the majority moved ahead.
Whereas a committee on outreach added consider-able value in light of the shortage of funds for outreach, a committee on administration seemed likely to over-lap with activities that staff could more appropriately handle. The committee on outreach, though appeal-ing and popular among commission members, was a potential diversion from the main task at hand: delib-eration. One observer noted that at the beginning, the commissioners seemed to see themselves less as jurors than as civic leaders reaching out to the community.15
Commissioner Raya remembered it as “a heady time, still new and exciting. We had lots of enthusiasm. And at the beginning, we were impatient.”
At the same January 12 meeting, the commission-ers voted to have rotating chairs. A proposal that failed to be adopted would have created a three-part leader-ship team,16 one member from each major party and one unaligned. Those interviewed for this study praised the rotating chairs idea as a means of avoiding political attacks on the commission and of fostering unity among the commissioners. That model, however, also made it likely that staff would not have a consistent relationship with the commission’s leadership.
Commissioner Compensation
Proposition 11 provided a $300 per diem payment to commissioners for time “engaged in commission business.”17 For succeeding commissions, the rate of compensation is to be adjusted by the cumulative change in the California Consumer Price Index. The regulations adopted by the BSA provided further detail,
13Commission meeting, January 20, 2011, transcript.14Ibid.15Interview with Matt Rexroad.16Motion made by Commissioner Kuo, commission meeting, January 12, 2011, transcript.17Cal. Gov. Code, § 8253.5.
$300Proposition 11 provided a $300 per diem payment to commissioners for their work.
notEWorthY
specifying that this per diem rate applied to the first eight commissioners as they underwent training and then as they selected the next six commissioners.18 As the first eight commissioners prepared to convene for the first time, the BSA’s legal staff presented a memo-randum explaining these provisions.19
When the full commission convened on January 13, 2011, the members discussed the details of their com-pensation plan. Their focus was on two issues: how many hours would constitute a full workday and what activities would be designated as commission business. The commissioners largely drew on their own experi-ences, especially those who had worked in the private sector, to define “billable hours” and “workdays.” Some commissioners favored defining a workday as more than four hours. Ultimately, the commission decided on six hours. If a commissioner worked more than six hours in a single day, the compensation would remain $300. Any hours above that in one day would still qual-ify for $300.
The commissioners established a system by which they would record and report their hours on commis-sion business. Some hours would be for commission meetings, including public hearings. Others would be for “homework” done away from public meetings, including reviewing documents. (See chapter 7 for the overall amount spent on commissioner compensation.) The fourteen commissioners received a wide range of
18Cal. Code Regs. tit. 2, div. 10, ch. 1, sub. 3, § 60857.19“Guidance for the first eight members of the Citizens Redistricting Commission,” signed by Sharon Reilly (Chief Counsel) and Donna Neville (Associate Chief Counsel), http://wedrawthelines.ca.gov/downloads/legal_memo.pdf.

30 League of Women Voters of California When the People Draw the Lines
ChAPtEr 3
Organizing the Commission
compensation, with the highest amount nearly twice the lowest.20
Commissioners expected, correctly, that they would have an immense workload. They were also concerned that commissioners of moderate means would be unable to serve without adequate compensation, especially if they were limited in their ability to perform their regu-lar jobs.
The redistricting process would be extremely ardu-ous even under the best of circumstances. With the rushed calendar and the pressures of being the first citizens redistricting commission with high public expectations of accessibility, their time commitment would likely make service impossible without signifi-cant compensation. The commissioners also knew that different people would have different needs and con-straints (e.g., those with young children at home would have more constraints on their time).
The record does not indicate that commissioners received advice about how comparable public bod-ies deal with compensation. A wide range of examples can be found, from full-time bodies with salaries based on the assumption that the commissioner will hold no other employment, to moderate salaries that assume part-time but extensive work in a large metropolitan area, to commissioners who serve without pay, with reimbursement for expenses only, or with small per diems for attendance at formal meetings.21 A fixed level
20Commissioner Michael Ward received the largest amount ($68,400), and Commissioner Maria Blanco received the lowest ($35,100). Jim Sanders, “California Redistricting Commissioners Paid Varied Amounts for Work,” Sacramento Bee, June 13, 2012. Accessed on-line March 12, 2013, http://www.sacbee.com/2012/06/13/4557715/redistricting-commissioners-paid.html.21Examination of county grand juries, state commissions, city councils, state legislatures, local boards, and commissions did not reveal any that
of compensation or per diem based on formal, public meetings represent standard models, and the $300 per diem provided by Prop 11 fit within that latter model.
The amount and nature of compensation should be chosen with reference to comparable boards and commissions within and outside the state of Cali-fornia. Consistent with the general direction of this commission, the next commission should have a level of compensation that would allow people of moderate means the opportunity to serve on a part-time basis.
From the standpoint of transparency and account-ability, the plan for compensation should be set in advance and not by the commissioners themselves. Furthermore, if there is not a salary paid to commissioners, the per diem should cover work conducted in public or in closed sessions. In order to remain consistent with the law that established the commission, a compensation model should apply the $300 per diem to formal meetings and activities only. These meetings could include public hearings, deliberation meetings of the full commission, and committee meetings (including closed meetings). The records should be kept by state officials who are assigned to assist the commission. Although the overall level of compensation for the intense deliberation phase might be less than the first commission received, this plan would allow commissioners to continue to receive compensation after the main deliberation phase is over and throughout their ten-year term.
Preparing to Work As a Commission
The commissioners had to spend some time becoming a unified body. The method of selection had effectively created two commissions, the initial eight members chosen by random draw and the remaining six chosen by the first eight. The first group of commissioners met throughout December 2010 to select the next six. Commissioners Jodie Filkins Webber and Peter Yao noted that although the first eight had developed some real camaraderie, it took some time to incorporate the other commissioners.
Jurisdictions considering adopting versions of the citizen redistricting should select all commissioners at
followed the plan that was designed for this commission.
Commissioners expected, correctly,
that they would have an immense workload.

31When the People Draw the Lines League of Women Voters of California
The next commission should have maximum flexibility in contracting, especially in light of its
short period of operation.
ChAPtEr 3
Organizing the Commission
the same time rather than having one set of commis-sioners choose the others, in order to produce a more unified and cohesive group at the outset.
The commission held long, thoughtful discussions on administrative matters that seemed appropriate for staff input. Commissioner Cynthia Dai found it “frus-trating at times. There was lots of rambling, the blind leading the blind.” Meanwhile, the staff had to make sure that state regulations allowed the commission to get what it needed in order to operate. The staff operated under rigid state contracting rules that did not include “delegated authority” to make purchases. Commission-er Dai described the state’s contracting procedures as “opaque.” Commissioner Gabino Aguirre recalled that getting simple things done required agonizing quasi-diplomatic processes. The staff had to work diligently to get a quick response from state officials in charge of contracting. The slow process frustrated staff and com-missioners in light of the extremely short time span for the commission’s work.
The next commission should therefore have maxi-mum flexibility in contracting, especially in light of its short period of operation.
Critical decisions that should have been made quickly—such as hiring Voting Rights Act (VRA) counsel or obtaining VRA training for the full com-mission—were delayed and then delayed again. The transcripts reveal a skilled group of commissioners try-ing to run their own commission with rotating chairs, painfully aware of deadlines slipping and then fac-ing continuing unresolved problems. Commissioners seemed aware that some critical items were drifting but did not seem able to find a way to complete them.
Training in the VRA, a core aspect of the commis-
sion’s work, was delayed. The first eight commissioners received initial training in December 2010, but the next six did not. The six were encouraged to watch the video of the training the first eight received. Commis-sioner Angelo Ancheta, who joined the commission in early February, watched the training online and found that “it wasn’t quite where it needed to be, especially on the Voting Rights Act.” The full commission finally received training, but not until late March.
Controversy over the hiring of the line-drawing consulting firm Q222 added pressure to the commission. Two companies, Q2 and the Rose Institute, bid for the contract. Like Claypool, Q2 was familiar to the com-missioners; its managing partner, Karin Mac Donald, had briefed the commission in some of its early meet-ings and directed the Statewide Database.23 A majority of the commissioners believed that the Rose Institute did not meet the commission’s conflict-of-interest standards and found several key items missing or inad-equate in the organization’s application.24 Although Q2 had extensive experience drawing district lines for cities and other local bodies, the firm did not have statewide redistricting experience, and some commissioners were concerned that Q2 could not handle the massive Cali-fornia task alone.
22At the time the commission was formed, Q2 was a partnership be-tween Karin Mac Donald and Bruce Cain. During the redistricting process of the early 1980s, Cain had been a special consultant to the Assembly Elections and Reapportionment Committee in charge of technical services. After the 1991 redistricting, the California legis-lature decided to put the Statewide Database at UC Berkeley under Cain’s supervision. Although Cain had not drawn either state legisla-tive or congressional lines since 1982, he severed his partnership with Q2 when the firm was under consideration for a contract with the commission, to reinforce his pledge of noninvolvement in the 2011 redistricting.23“The Statewide Database emerged from a database that was origi-nally created for California’s State Assembly, to be used in the redis-tricting of 1981. … In 1993, the California Legislature voted to house the database permanently in a nonpartisan environment. The Institute of Governmental Studies (IGS) at U.C. Berkeley was selected. … In 2009, the Statewide Database moved to its new home in an off-campus building at Berkeley Law. The information in the Statewide Database is a public resource and available free of charge to anyone interested in the political and demographic make-up of the State of California,” http://statewidedatabase.org/about.html, accessed March 30, 2013.24An examination of the scoring sheet for the Rose Institute’s proposal revealed a significant number of items that reviewers considered unre-sponsive, including the lack of signatures from key members of the team (scoring sheet available at http://wedrawthelines.ca.gov/downloads/ march_documents/Rose_bid_evaluation_final.pdf, accessed August 27, 2012).

32 League of Women Voters of California When the People Draw the Lines
ChAPtEr 3
Organizing the Commission
Intimations of partisan favoritism ran rampant.25
Republicans had lobbied the commission in favor of the Rose Institute. They felt aggrieved that the commis-sion’s executive director was a Democrat (although only minimally active), that Q2’s principal was an indepen-
dent with ties to a former Democratic consultant, and that the commission had not hired a Republican firm as VRA counsel. The commission did not have the sup-port of a majority of the Republican members to select the VRA counsel favored by the Democratic and non-aligned members, an issue that was resolved when the Republican-supported firm withdrew.
Claypool’s role in the BSA selection process and his familiarity with state government had made him a natural choice for executive director. Similarly, not many bidders could meet the needs of the massive map-drawing job, and Q2 had extensive experience. The commission did achieve partisan balance by selecting VRA counsel with one Democratic and one Republi-can principal.26 Commissioner Blanco believed that the time constraints made it harder to look for alternate pools of expert talent.
Commissioner Ward favored an “in line review” of the work of the map-drawing team, a process that would bring in another line-drawing consultant to review and examine Q2’s work. Ward’s proposal reflected a fear that politically biased line drawing would skew the process. Although this concern was understandable, a
25A number of Republicans strongly favored Rose, and some argued that the commission applied the conflict-of-interest standards in a manner that disadvantaged Rose. Three Republican members of the commission opposed removing Rose from consideration.26After the withdrawal of the competing firm, the commission voted unanimously to retain international law firm Gibson, Dunn & Crutch-er, with Daniel M. Kolkey, a Republican and principal drafter of Prop 20, and George Brown, a Democrat, as principal attorneys.
doubled-up line-drawing process would have added to the immense time pressure on all participants.
A better plan for the next iteration would be to encourage bipartisan teams to apply, balanced by their competing political involvements. If the citizen redis-tricting model continues to work and creates a long-term market, firms may redesign their own organizations in order to qualify.27 In any case, a line-drawing team cannot easily change the outcome of a redistricting process. Commissioner Blanco thought in retrospect that the commission worried too much about what was essentially a technical task. In any case, the decisions on drawing the lines would be made by the appointed commissioners, not by staff or consultants.
These conflicts over hiring masked some underly-ing partisan and ideological differences in redistricting that do not simply disappear with the removal of incum-bent elected officials from control of the process. The larger disagreements revolve around how to apply the VRA and the model of COIs. These are not technical issues but political and philosophical ones, and they did emerge in the process of mapping in 2011 (see chapters 5–6).
Organizational decisions had real implications for the decision making of the commission. The commis-sion’s first maps were released on June 10. As indicated later in this report, some public reaction to the first set of maps was negative, in part because of deficiencies in responsiveness to the VRA. With more time and bet-ter organization, the commissioners would have more experience with the VRA and how it could be applied. Although there will inevitably be criticism of any draft map, the first release would have been less rushed and better prepared if more time and additional VRA train-ing had been provided.
role for the Commission in future redistricting
The Voters First Act established a decade-long role for the citizens commission: “The term of office of
27A similar dynamic has developed in public-opinion polling. As news-papers and other media outlets seek to obtain the services of unbiased but politically sophisticated polling firms, they have created and en-larged the market for teams of Democratic and Republican pollsters.
A better plan for the next iteration would
be to encourage bipartisan teams to apply.

33When the People Draw the Lines League of Women Voters of California
ChAPtEr 3
Organizing the Commission
each member of the commission expires upon the appointment of the first member of the succeeding commission.”28
In addition to drawing the lines, voters vested the commission with the authority to defend lawsuits that might be filed against the maps produced by the commission. However, this important role was large-ly completed by the end of 2012. State funding was largely eliminated, most staff were laid off, and the commission moved into a period of infrequent meet-ings in late 2012.
This report proposes that the current commission should help lay the groundwork for the next com-mission’s work. The next commission will need the opportunity to chart its own course, to make decisions about organization, leadership, and approach. But the existing commission should help fill the gap in prepara-tion that will precede the selection of state agencies and outside institutions to gather research and set the stage for the redistricting process.
Specific tasks could include identifying individuals and organizations capable of assisting the commission on a professional basis; exploring models of profession-al support, such as bipartisan consulting teams; helping begin the process of collecting data that the next com-mission will need; communicating with the media and others about the importance of citizen redistricting; and maintaining and expanding the written records and oral recollections of participants in the redistrict-ing process. In the broader sense, the 2011 commission should advocate for the independence and organiza-tional support necessary to make the next commission successful.
Conclusions
Ultimately, the commissioners had to decide how to deliberate, with limited guidance on how to proceed. Even with the major organizational problems noted here, they found a way to make reasonable decisions in a compressed time frame. They worked hard, with long hours of public hearings, committee meetings, and deliberations.
28Cal. Gov. Code § 8252.3.3, § 2(c)(4).
In order to be successful, a citizen commission must have a process that allows and encourages staff to assist and at times guide the commission in its process. Although staff must be careful not to intrude on policy decisions, the commission must entrust administrative tasks to the staff so that the commissioners can focus on their core responsibilities: drawing district boundaries.
The State Auditor, or a comparable organiza-tion such as the Legislative Analyst, should conduct the selection process in the next iteration; other states seeking to adopt the California model should identify an agency known for its impartiality and professional skill.
A full support system for the operation of the commission must be in place before the commission convenes, including guidance on selecting staff and consultants, advice on dealing with administrative matters, and information about how commissions allo-cate time and resources. This information should be provided by a single governmental agency or outside organization with relevant experience.
Compensation should be addressed before the commissioners take office. Compensation should be set with reference to comparable boards and commissions within and outside the state of California. Consistent with the general direction of this commission, the next commission should have a level of compensation that would allow people of moderate means the chance to serve.
Commissioners should establish the criteria and job descriptions for staff and consultants, through a public process, and make hiring decisions from the widest array of qualified applicants. New staff models should be explored, including bipartisan teams.
The state should assign a staff person to handle logistical matters for the commission. The commis-sion should cast a wide net for staff from both inside and outside the state government and with experience working with appointed or elected citizen bodies. The commissioners should delegate administrative tasks as much as possible to staff and consultants.

34 League of Women Voters of California When the People Draw the Lines
ChAPtEr 4
Outreach During the Deliberation Process
The commissioners made obtaining input from the public a high priority. In addition, they were advised that public input was the sole vehicle they could use for drawing lines around Communities of Interest (COIs). The commission undertook major efforts to reach the public, including hearings and other public events. The scale of input they received was staggering. For reasons of budget and time, the commission was unable to pursue a consulting contract for public outreach and depended on themselves, the staff, and the work of private nonprofit organizations.
Phot
o C
ourte
sy o
f CA
Com
mon
Cau
se

35When the People Draw the Lines League of Women Voters of California
ChAPtEr 4
Outreach During the Deliberation Process
The citizen commissioners prioritized soliciting, receiv-ing, and evaluating public input. They focused intensive-ly on outreach at their first meeting as a full commission on January 12, 2011. The committee on outreach drew the most volunteers among commission members. Com-missioner Michelle DiGuilio observed that “everybody wanted to be on the outreach committee.”
Voters expected that redistricting would move for-ward with transparency and significant public input. A 2007 survey found that “the most popular components of the initiative include taking politics out of the process and the requirement for more openness.”1 A transpar-ent process that engaged the public would be a stark contrast to previous, insider-dominated line drawings.
As the scope of the outreach became evident, and facing a deadline to complete the redistricting, the commissioners considered hiring a professional out-reach consultant. This outreach group might have helped facilitate the “translation” of the commission’s work to the public and helped to organize the public input into a form that was easily digestible by com-missioners and by members of the public. Sacramento State University’s Center for Collaborative Policy sub-mitted a proposal to provide a broad range of outreach services, with a price tag that exceeded $800,000.2
Commissioner Cynthia Dai noted that for the cost, the proposal added insufficient value beyond what the commissioners, staff, and consultants would have had to do anyway.
Commissioners resolved to conduct outreach on their own. The commission’s director of communi-cations, Rob Wilcox, coordinated the commission’s media effort. The line-drawing consultant firm Q2’s agreement required that the firm’s staff collect public input at the hearings for the use of commissioners.
The commission’s own outreach included speaking to the media and addressing public meetings, issu-ing press releases, holding public hearings, streaming
1“California Redistricting: A Report on the Survey Conducted by Lake Research Partners and the Tarrance Group,” based on a telephone sur-vey of 800 likely 2008 general election voters conducted between July 26 and August 2, 2007. The survey found that more than 60 percent of the voters attached great importance to an open process as a reason to support the ballot measure.2Staff discussion with commission found in transcript, “Combined Meeting of the Technical Advisory Committee and the Outreach Ad-visory Committee,” April 7, 2011.
several days in the life of a Commissioner: April 27–may 2, 2011 Jodie filkins Webber, Attorney
April 27Court appearance in Santa Ana at 8:30 a.m.Picked up commissioner Cynthia Dai at Long Beach
Airport at 11 a.m.Commission business meeting in Long Beach at 1:00 p.m.Commission public input hearing from 6 p.m. to
10 p.m. or soDrove home to Norco (meeting was within 70 miles, so no
reimbursement for hotel expenses)
April 28Court appearance in Pomona at 8:30 a.m.Commission business meeting in Los Angeles at 1 p.m.Commission public input hearing from 6 p.m. to 11:30 p.m.Drove home to Norco
April 29Drove from Norco to my office in OrangeDrove to San Gabriel at 3 p.m.Commission public input hearing in San Gabriel from
6 p.m. until?Drove home to Norco
April 30Drove to San Fernando for commission business meeting
at 10:00 a.m.Commission public input hearing from 2 p.m. to
6 p.m. or soStayed in Pasadena
may 1Drove from Pasadena to LancasterCommission business meeting at 10 a.m.Commission public input hearing from 2 p.m. to 5 p.m.Remained in Lancaster
may 2Took deposition of party in Lancaster (coordinated with
commission meeting in Lancaster) from 10 a.m. to 12 p.m.
Drove to Riverside for redistricting presentation to the Western Riverside Council of Governments at 3 p.m.
HOME EARLY before 5 p.m.!

36 League of Women Voters of California When the People Draw the Lines
ChAPtEr 4
Outreach During the Deliberation Process
deliberation meetings live on video, and providing a website that included commission records and docu-ments. The commission had inherited a website that was difficult to update, and some time passed before a more adaptable model could be implemented.
The commission summarized its overall approach:
All of the Commission’s public meetings were live-streamed, captured on video, and placed on the Commission’s website for public view-ing at any time. Stenographers were present at the Commission business meetings and meetings where instructions were provided to Q2 Data and Research, LLC, the company retained to implement the Commission’s direc-tions and to draw the draft districts and final maps. Transcripts of meetings were also placed on the Commission’s website. Finally, all of the completed documents prepared by the Com-mission and its staff, along with all documents presented to the Commission by the public and suitable for posting were posted to the Com-mission’s website for public review. 3
The broadest outreach challenge for the commis-sion was to obtain useful input from the public. Studies of public participation increasingly emphasize the delicate balance between obtaining maximum public input—especially from those individuals or groups not traditionally “wired” into the decision process—and absorbing useful information that decision makers might not otherwise receive:
Quantitative measures—how many “hits,” visi-tors, page views, comments, etc.—are seductive. They are easy to gather through online analytics tools, easy to present in attractive charts and tables, and easy to compare over time and across versions. Without doubt, such metrics can give designers useful information.…But if more is not the same as better, then success can’t be defined by numbers. 4
3State of California, Citizens Redistricting Commission, Final Report on 2011 Redistricting, August 15, 2011, pp. 3–5.4Cynthia R. Farina, Mary J. Newhart, Josiah Heidt, and Cornell eR-ulemaking Initiative, “Rulemaking vs. Democracy: Judging and Nudg-ing Public Participation that Counts,” Cornell e-Rulemaking Initiative
The commissioners sought to balance their desire to maximize useful public input with their commit-ment to hear all points of view. If people traveled from afar and had to wait a long time to speak, they were unlikely to welcome an extensive public educa-tion session on redistricting. Commissioner DiGuilio noted that in early hearings, presentations that delayed the start of public testimony annoyed members of the public. Lacking a significant outreach budget, the com-missioners struggled to reach their goal of explaining redistricting to a wider public. According to Commis-sioner Peter Yao, “We did not have any money to do any teaching or outreach of our own, so we just had to collect input. We were barely able to do it.”
Because the commissioners faced initial obstacles in building their staff and consultant teams and in getting the data they needed to start mapping, they decided to pursue aggressive outreach during the first few months. Although they felt an urgency to get started on the work of mapping, Q2 advised them that no real mapping work could begin until all the census data were received in
Publications, paper 3 (2012), http://scholarship.law.cornell.edu/ceri/3.
tABlE 6. Commissioners’ Public Appearances
Commissioner June 10, 2011, and Prior
June 11– August 15, 2011
Vincent Barabba 12 5Cynthia Dai 14 8
Stanley Forbes 19 6
Connie Galambos Malloy 12 4
Jeanne Raya 9 6Jodie Filkins Webber 15 3
Peter Yao 15 4Gabino Aguirre 7 1Maria Blanco 8 2Michelle R. DiGuilio 11 2Lilbert “Gil” R. Ontai 10 0M. Andre Parvenu 7 1Michael Ward 8 0Angelo Ancheta 8 3totals 155 45

37When the People Draw the Lines League of Women Voters of California
ChAPtEr 4
Outreach During the Deliberation Process
April. The schedule of hearings was front-loaded in part to advance the agonizingly slow process of getting the deliberations under way. Commissioner Stanley Forbes suggested holding roughly one hundred public hearings throughout the state before and after the release of draft maps. Commissioners backed off from this ambitious plan in the face of practical obstacles.
The commission held twenty-three public input hearings around the state before issuing a set of draft maps on June 10, 2011. Following a five-day public review period, the commission held eleven more pub-lic input hearings to collect reactions and comments about the initial draft maps.5 All commissioners were expected to attend these hearings, and Q2 collected and catalogued the public input.6 The hearings drew large audiences. The level of intensity surprised Com-missioner Gil Ontai, who recounted that “people came hundreds of miles, drove six to eight hours, and there were lots of presentations.”
During the peak of the commission’s work, in the spring of 2011, commissioners spent long days balanc-ing commission meetings and public hearings with the obligations of their own jobs.
Commissioners were willing to speak to the press and at community meetings and made a total of 245 public appearances from the beginning of the process to the end. Commissioners’ public appearances were as diverse as they were geographically scattered.7 After the release of the first maps on June 10, commissioners made the reasonable decision to spend the bulk of their time on mapping, and public appearances declined in
5Ibid.6Some commissioners carpooled across the state to the public hear-ings. Commissioner Ontai found these “adventures” to be an impor-tant bonding experience for the members.7These appearances included interviews and meetings with radio sta-tions and newspapers all across the state (e.g., KCBS Radio, KQED Public Radio, Indian Voices, Filipino News, India West, the Chico Enterprise Press, Oroville Mercury Register, Asian Journal, the San Diego Tribune, the Los Angeles Times, and the San Francisco Chronicle); speaking at Redistricting Conferences, at board meetings, and be-fore groups like the Long Beach Republican Women Federated, the Western Riverside Council of Governments’ Executive Committee in Riverside, and the Black Social Workers Association in Los Angeles; serving as panelists at events like the NALEO conference and another on ethnic media; and speaking at the opening of the Redistricting As-sistance Centers in Sacramento, San Diego, and Los Angeles. For a full list of the commissioners’ public appearances, see wedrawthelines.ca.gov/community.html, accessed January 10, 2013.
number. In the lead-up to the release of the first maps on June 10, commissioners made a total of 155 pub-lic appearances; after June 10, though, they decided to spend the bulk of their time on mapping, and public appearances declined to 45 (see table 6). The criticism the commission faced, first about the June 10 maps and then about the decision not to release the second-draft maps, may have made public appearances less appeal-ing as well.8
Most of the commissioners had little experience with public criticism. An experienced commissioner, Peter Yao, advised Jeanne Raya that criticism is normal for commissioners and told her not to worry about it.9
In releasing the draft maps on June 10, the commis-sion made its single most important outreach decision. No matter how many opportunities people have to speak at public meetings, or how many draft maps people or groups transmit to a commission, nothing generates real public input more than a concrete proposal. Com-missioners were ambivalent about releasing the maps, knowing they contained potential problems that had not been resolved. However, they put their reservations aside in order to move the process forward.10
8One observer suggested that the negative reaction to the first set of maps seemed to make commissioners a bit more reclusive than in the earlier days, when they mingled freely with the public in the manner of elected officials. (Matt Rexroad, interview).9Another commissioner, Gabino Aguirre, who had previously absorbed public criticism during his service as a city council member, noted that other commissioners showed more concern about it than he did.10Commissioner Maria Blanco was so concerned about some of the shortcomings of the maps in the area of voting rights that she consid-ered voting no. She ultimately voted to release the draft maps in order to help the commission stay on track.
245Commissioners made a total of 245 public appearances during the course of the process.
notEWorthY

38 League of Women Voters of California When the People Draw the Lines
ChAPtEr 4
Outreach During the Deliberation Process
With time short, the commissioners chose not to release a second set of draft maps in July but rather to conduct a series of “visualizations” one district at a time. The visualizations were maps of particular districts that the commissioners could adjust one at a time in public debate. They were presented at public, televised meet-ings of the commission held in Sacramento.
The visualizations simply reflected the actual decisions made by the commissioners. Members of the public could comment in real time, and they sent numerous emails during the examination of the visual-izations. The commissioners had the opportunity to see how the characteristics of an individual district could change based on different groupings of Communities of Interest.
Opinions about the visualizations varied widely. For those in the room, they provided an immediate and even dramatic way to understand the impact of chang-es to district lines. For those watching on television or unable to watch at all, the process could be distant and confusing.
As Rosalind Gold of NALEO pointed out:
If you’re not there in Sacramento, there’s no way to comment on a moving target. So they’re making changes, they’re mapping. There was not good video streaming or video access to those hearings. And plus you had to be watch-ing the hearings every minute to see what was going on with visualization.11
outreach by other organizations
The commission came to rely on outside organizations to bolster its public outreach. Voting-rights groups were already involved, having monitored the com-missioner-selection process. Civic organizations such as the League of Women Voters of California closely followed the deliberations and provided outreach mate-rials to the public to foster participation.
The James Irvine Foundation gave grants to ten organizations to increase public participation in the deliberation process. Irvine grantees undertook a num-
11Interview with Rosalind Gold.
ber of efforts designed to help the public provide useful input into the commission’s deliberations. For example, Irvine grantees did the following:
n Developed educational materials used by a wide range of organizations.
n Conducted outreach to inform the public of oppor-tunities to participate in the redistricting process.
n Trained thousands of Californians to provide pub-lic comment and map proposals to the commission.
n Collected regional public input and incorporated it into statewide map proposals shared with the com-mission.
n Operated six technical-assistance sites and a com-prehensive website that provided the public with in-person and online access to redistricting data and mapping software.
n Prepared legal briefs examining the effects of recent laws and rulings on the state’s redistricting process.
tABlE 7. James irvine foundation grants during deliberation Process
organization grant AmountAdvancement Project* $290,000Asian Pacific American Legal Center of Southern California (APALC)
$365,000
Central Coast Alliance United for a Sustainable Economy (CAUSE)
$150,000
California Common Cause**Community Coalition* (for the African American Redistricting Collaborative)
$190,000
Mexican American Legal Defense and Education Fund (MALDEF)
$150,000
National Association of Latino Elected and Appointed Officials (NALEO) Educational Fund
$225,000
San Diego Foundation for Change $100,000The Greenlining Institute $225,000University of California at Berkeley, Statewide Database*
$735,000
*Amount reflects the total of two grants made to this organization. **California Common Cause received a grant of $250,000 for work during both the commissioner selection and deliberation phases, ac-counted for in Table 3, page 20 of this report.

39When the People Draw the Lines League of Women Voters of California
ChAPtEr 4
Outreach During the Deliberation Process
Additionally, Irvine supported the drafting of this report in order to inform future redistricting efforts.
The James Irvine Foundation gave a number of grants, ranging from $100,000 to $735,000, to various groups working to increase public participation in the deliberation process.
For reasons of time and money, the commission had to rely on outside groups such as the Irvine-funded organizations to carry out much of its outreach program. And, at least in some cases, the commission used mate-rials created by the partners as their own handouts to the public. Commissioner Angelo Ancheta noted that it would have been difficult in any case for the commis-sion to “create an outreach infrastructure from scratch.”
The James Irvine Foundation provided grants total-ing $735,000 to UC Berkeley to establish Redistricting Assistance Sites (also called Technical Assistance Sites or Centers).12 The sites opened in March 2011. Direct-ed by the Redistricting Group at the UC Berkeley School of Law (affiliated with the Statewide Database) and directed by Karin Mac Donald’s Q2, sites opened in San Diego, Los Angeles, San Bernardino, Fresno, Sac-ramento, and Berkeley. The sites made computers and redistricting software (Maptitude for Redistricting) avail-able to the general public to develop map submissions or testimony for the commission during its deliberations.
Each site had one manager who was available to assist clients using the workstations either during drop-in hours or by appointment. Starting on July 12, 2011, the public could view the commission map visualiza-tions in detail at the redistricting sites. Each center was
12“Sites” and “Centers” are used interchangeably in this report.
12,746There were 12,746 visits to the ReDrawCA website in the peak three months of the process.
notEWorthY
equipped with two desktop computers with Maptitude for Redistricting installed, a laptop for the manager to communicate with and use in presentations, and an inkjet color printer.
The managers estimated that between fifteen and thirty maps (from one district to full statewide plans) developed at each site were submitted to the commission. Commission members spoke at some Irvine-funded workshops held at the centers, and they discussed the centers in press materials, on the website, and at multiple hearings.13
The centers experienced waves of traffic before deadlines for submission of testimony to the commis-sion. At the Berkeley center, clients including mappers for the California Conservative Action Group (CCAG), a local Tea Party group, and the Sierra Club worked on full redistricting plans to submit to the commission.
Another Irvine-supported project, ReDrawCA, provided the public with online access to the commis-sion’s maps and data. Operated by the Advancement Project, and supported by grants of $290,000 from The James Irvine Foundation, ReDrawCA allowed users to access up-to-date versions of the commission maps and to draw their own maps. The Advancement Project held a number of webinars and open office hours to promote ReDrawCA and provide technical training and support. The Advancement Project also shared ReDrawCA at the majority of the local redistricting hearings and pro-vided fliers to the commission. The program began on April 15, 2011, and over the next three months (in the thick of the map-drawing process), there were 12,746 visits to the ReDrawCA website. The redistricting commission also referred people to the ReDrawCA website, accounting for 1,216 visitors.14
An examination of the commission website15 indi-cates numerous examples of maps created through either the redistricting centers or ReDrawCA. Some of the maps were accompanied by cogent explanations of COIs.16
13One of the three “Helpful Links” on the commission website is about the centers: http://wedrawthelines.ca.gov/links.html, accessed August 25, 2012.14Data provided by Caitlin Flint, Advancement Project.15See “Meeting Handouts,” accessed August 25, 2012, http://wedraw thelines.ca.gov/meeting_handouts.html.16One example is an argument for coastal districts, including maps, submitted by the Sierra Club.

40 League of Women Voters of California When the People Draw the Lines
ChAPtEr 4
Outreach During the Deliberation Process
Although these resources helped some members of the public to participate, they were not a sufficient replacement for technological tools the commission itself could have provided. Because the commission did not create and host an online mapping tool on its own website, many members of the public likely did not know how to access such a tool. Also, some members of the public complained that the commission did not provide easy and immediate access to data files neces-sary to provide thorough map proposals, analysis, and testimony.
Outside groups and individuals followed the devel-opment of the commission’s maps with great interest. These mappers, though, had difficulty getting per-mission to access the commission’s data, known as “shapefiles,” which were required to build the maps.17 Shapefiles showed the precise boundaries of the com-mission’s drafts and with mapping software could be overlaid on various levels of data to let the public assess the legal compliance and political impact of the maps. The legal team that advised the commission raised concerns about releasing this information because of its possible impact on litigation.18 Eventually, though belatedly, portions of the information became available to those outside the commission.
Intense public interest in the work of the com-mission created a demand for up-to-date maps that reflected decisions as they happened. In particular, many observers wanted to know what the political implications of line-drawing would be. Several web-
17Interview with Paul Mitchell.18Because these concerns were expressed in closed sessions, it is dif-ficult to assess the merit of this advice.
sites became popular because, unlike the commission itself, they included political data that would allow an assessment of who gained and who lost from the pro-posed lines. One advantage these websites possessed was the ability to display “political data” such as party registration and voting patterns. In pursuit of Prop 11’s mandate to avoid “favoring or discriminating against [a] candidate or political party,” the commission decid-ed not to explore such data.19
A future commission would be well served by releasing the technical data that would allow others to draw maps, even if those maps include political data that the commission itself chooses not to consider.
Clearly the commission had an unusual relation-ship with outside organizations. The commission could not control the outside groups, which were directly accountable to their own constituencies and in some cases to The James Irvine Foundation. Neither the groups nor the Irvine Foundation could tell the com-mission what to do, beyond offering advice.20 Generally, though, the commissioners considered the work of the outside partners to be indispensable, since the commis-sion was unable, for reasons of time and money, to fund its own outreach program.
The budget of the next commission should include sufficient funds to provide user-friendly tools and tech-nology that give the public thorough access to data and proposals and easy opportunities to provide effective testimony and proposed maps.
Absorbing Public input
The work of the commission generated far more public interest and input than anyone had imagined. Summaries by the commission indicated the follow-ing inventory of public comments: a total of 34 public hearings; more than 70 deliberation meetings; meet-ings and hearings in 32 cities and 23 counties; more than 2,700 speakers at hearings; and written submis-
19Redistricting websites like redistrictingpartners.org (Paul Mitchell) or mpimaps.com (Matt Rexroad) received considerable traffic. Re-DrawCA was able to display maps that included more data than the commission maps.20Some Republicans who followed the process complained that Irvine was pushing the commission too far in the pursuit of diversity.
The work of the commission generated far more public interest and input than anyone
had imagined.

41When the People Draw the Lines League of Women Voters of California
ChAPtEr 4
Outreach During the Deliberation Process
sions from more than 2,000 organizations and more than 20,000 individuals.
A large volume of public input bolstered the com-mission’s credibility. As with the more than 30,000 people who initially sought commission positions, the level of interest itself became a factor in evaluating the commission’s work.
The scale of public input both pleased and chal-lenged the commissioners. Commissioner Raya said that the scope of public comment was both “won-derful and terrible;…emails were pinging all day.” Commissioner Andre Parvenu remembered, “We were inundated day and night with email, faxes, maps.” Commissioner Ancheta praised the heavy emphasis on input but found it difficult to process the information, especially as the process moved into mapping. Some public hearings went on until late at night, so that com-missioners could hear all the members of the public who attended.
In the early days, the professional standing of the commissioners took a blow in the eyes of experienced observers in the audience who thought the commis-sioners did not know who was behind the apparently spontaneous comments of presenters. Some suspected that public speakers were agents of incumbent elected officials. There was nothing in the process to prevent a politician from encouraging a friend or ally to seek to persuade the commission to take favorable actions while masking the source of the input. Others felt that “the squeaky wheel got the grease.”21 By the end of the process, considerable disagreement arose over the extent to which these efforts were successful (see chap-ter 8). Undoubtedly, some were. However, a number of elected officials found themselves in unfamiliar districts in which they had difficulty winning.
Commissioners indicated in interviews that they were more aware of the nature of these comments than was widely assumed. But certainly for some who were less familiar with the dynamics of public hearings, it was a challenge to weigh the public comments. Com-missioner Parvenu recalled that for less experienced commissioners like himself, evaluating the testimony became much easier as time passed.
21Interview with Tony Quinn.
When commissioners did try to publicly demon-strate that they understood who was speaking, they ran into accusations of insensitivity. It was a no-win situation. Commissioners were justifiably concerned that confrontational questions from commissioners could create a chilling effect on members of the public who wished to comment. When Commissioner Jodie Filkins Webber challenged the testimony of speakers from South Los Angeles for apparently being recruited by an elected official, she was criticized by other com-missioners and by members of the public.
The commission grappled with the challenge of absorbing, weighing, and evaluating the immense quantity of public input. Commissioners, staff, and consultants—already facing an unrealistically tight schedule with limited resources—fought an uphill battle to keep up with public comment and to pro-vide current information to the public. They needed to absorb the input, but in attempting to do so they risked taking valuable time from the task of drawing the lines.
Q2 staff had been attending public hearings, col-lecting data on public comment, and trying to keep the commissioners informed. A group of Q2 personnel separate from the actual mappers had the responsibility of compiling public input.
The COI testimony from the public hearings in April and May critically informed the drawing of the June 10 first-draft maps. Because commissioners had been advised by Q2 that public input was to be the sole source of information in defining COIs, they had to seek clues in the public comment. The question became how to weigh testimony. Although the commissioners
20,000Individuals submitted more than 20,000 written comments to the commission.
notEWorthY

42 League of Women Voters of California When the People Draw the Lines
ChAPtEr 4
Outreach During the Deliberation Process
became extremely conversant with the various commu-nities of the state, they still struggled with the mountain of public testimony collected during those hearings, at regular commission meetings, and by e-mail.
The commission had authorized Q2 to create an input database from the start of the process, but that task demanded more staff in light of the short timeline and the massive volume of public input. On June 9, a day before releasing the first-draft maps, the commis-sion discussed authorizing Q2 to hire additional staff to create a database of COI testimony. Commissioner DiGuilio noted that “the part of tracking our COI, the basis for our decisions…has not been resolved as of yet.”22 The exhaustive COI database released on July 7 ran to 1,431 pages. Commissioners were eventually able to search the database by keywords, but the pub-lic had more difficulty with gaining access to usable information.23
With more than 20,000 communications, includ-ing emails, commissioners found their own ways to weigh and evaluate them. One commissioner consid-ered maps submitted to the commission to be useless without knowing the assumptions that went into them. Another preferred the emails to the public hearings. Commissioner Raya noted that maps from local busi-ness associations and cities were especially effective.
22Commission meeting, June 9, 2011, transcript.23According to Karin Mac Donald, Q2 assigned one team member to each meeting to summarize public comment on a spreadsheet. The comments received numeric codes. The public hearing database had 2,365 comments, of which 1,385 addressed COIs. Other public com-ments were entered into the database. Q2 gave the commissioners an Excel file that was searchable as a PDF. The files were not formatted for the public to be able to search the database.
Commissioner Vincent Barabba recalled that he had an internal “filter” system that helped him make sense of the testimony and the other input. His first filter was to avoid being too moved by “obvious spe-cial interests.” After that, he found the most useful input to come from some of the best-organized eco-nomic groups, such as business organizations in the San Fernando Valley in Los Angeles, and groups from some ethnic communities, such as in Los Angeles’s Koreatown. With regard to the maps that came into the commission, Barabba considered the Asian Pacif-ic American Legal Center to be extremely effective, because its team clearly understood the mission of the commission and the constraints the members faced. The value of other maps depended on whether they were accompanied by rationales consistent with the legal requirements of redistricting.
Commissioner Dai said that she would routinely scroll through the emails on her phone, quickly dismiss the repetitive ones (“100 that all looked alike”), and then read the ones that seemed more individual.
Before the first round of draft maps were released on June 10, African American, Latino, and Asian American groups had submitted their own maps. Fol-lowing the controversy over the first set of draft maps, the three communities came together to create a set of “unity maps” that were useful to the commission in its final deliberations.
Commissioners eventually decided to create two-person committees within each of the seven regions of the state to evaluate the public input. Each committee would include one person familiar with the region and another who was not.
Conclusions
One of the commission’s greatest strengths was its com-mitment to encouraging and absorbing public input. Starting late, with limited resources, the commission aggressively sought to generate public comments. The commissioners attained an extraordinary degree of out-reach despite immense time pressure.
However, there were inevitable gaps because the commission did not have professional assistance to plan and implement their community outreach efforts.
One of the commission’s greatest strengths
was its commitment to encouraging and
absorbing public input.

43When the People Draw the Lines League of Women Voters of California
ChAPtEr 4
Outreach During the Deliberation Process
Their main job was to draw the lines in light of pub-lic input. With resources and time in short supply, the commission depended on outside groups for some core elements of their outreach. At times, the interested public had difficulty connecting to the technical work that the commission was conducting.
The commission struggled to absorb public input in the manner that would be most useful to its delibera-tions—suggestions for COIs within the constitutional framework that bound the commission’s decisions.
The next commission would be well advised to emulate this commission’s goal of widespread pub-lic participation. The commission though, must have greater assistance to reach its outreach goals. In the next iteration of the redistricting process, the bud-get should include sufficient funding for a consultant whose main task is to collect and analyze public input to the commission and to provide user-friendly tools and technology that give the public thorough access to data and proposals and easy opportunities to provide effective testimony and proposed maps. Furthermore, with more time to deliberate, the next commission can work more closely with outside groups from all points of view to coordinate online information and other methods for the public to access the commission’s work.
As will be seen in the following chapters, demo-graphic, economic, and other data gathered prior to receiving testimony might have relieved the commis-sion of some of the burden of basing decisions largely on public comment, susceptible as it could be to influ-ence from the political world.

44 League of Women Voters of California When the People Draw the Lines
ChAPtEr 5
Mapping
The commission was scrupulous in attempting to create maps around the mandated ranked criteria. Communities of Interest (COIs) were high in the rankings. The mapping process was built around a first set of draft maps, a set of visualizations of districts, and a final set of maps. The commissioners were advised that public input was the sole means of assessing COIs. For that reason and because of the press of time, they did not have data that could have helped them weigh the public input regarding the nature of vari-ous communities. In the next iteration, the commission should have early access to data about potential districts that is independent of the public input.
Phot
o C
ourte
sy o
f CA
Com
mon
Cau
se

45When the People Draw the Lines League of Women Voters of California
ChAPtEr 5
Mapping
The commission conducted the bulk of the map-ping in a two-month period between June 10, when it released the first set of maps, and the end of July. The districts were to be drawn in perhaps the most geo-graphically diverse state in the nation. No district could be drawn in isolation, and even a small change in the boundary of one district could affect several districts in a series of population switches and rotations. Before the commission submitted the final maps to the pub-lic on August 15, 2011, the districts had gone through multiple revisions.
In the end, despite numerous challenges and constraints, the commission addressed the six consti-tutional criteria, while obtaining considerable public input. However, important lessons can be learned from this inaugural effort. The mapping process should begin earlier. Demographic and other data should be used to complement public testimony. A more coherent and accessible database of public testimony should be created. Time and budget should be allocated to allow for more effective tracking of revisions.
overview of the mapping Process
The U.S. Census Bureau released redistricting data for California on March 8, 2011. As a result of the late hiring of a mapping consultant (on March 19), the delay in completing Q2’s contract until April, and the scheduling of public input hearings in April and May, mapping did not begin until late May. The bulk of the mapping took place in a two-month period between late May and late July.
Districts were built starting with the largest units (counties or cities) and working down to census blocks when cities or counties had to be split. Throughout the mapping process, most of the discussion focused on counties, cities, and neighborhoods.
Q2 divided California into nine regions distribut-ed among four mappers, each responsible for drawing assembly, senate, and congressional districts in his or her region. Q2 summarized the public comments for each of the nine regions, from which the commission identi-fied “design principles” or general mapping directions for Q2. Q2 and the commission consulted with VRA counsel regarding areas where districts should be drawn
to protect opportunities for minority communities. The commission outlined the process by which Q2
would create the first maps on May 5.1 The commission instructed Q2 to draw congressional districts with equal populations (within 1 percent of the ideal population of 702,905). Assembly and senate districts could deviate no more than 5 percent from their ideal populations of 465,674 and 931,349, respectively. The commission then indicated that compliance with the VRA would be the next priority. After that, city and county lines would guide the mapping, modified by COIs.
As Q2 drew the maps, commissioners issued direc-tives. Q2 staff would then present a proposed district to the commission and briefly describe why they drew it that way. VRA counsel advised the commissioners and Q2. Given the high priority of the VRA criterion in California redistricting, counsel advised the commis-sion to draw VRA districts first. These districts became important building blocks for the maps. (See chapter 6 on the Voting Rights Act.)
The first districts slated for drawing were sev-eral “VRA districts,” including the four Section 5 counties, and areas with significant minority popula-tions. Section 5 of the VRA, which is described more fully in the next chapter, concerns counties in which minority communities have historically suffered dis-crimination. They are protected from “retrogression” by the U.S. Department of Justice, which must approve any maps involving these jurisdictions. These districts were important building blocks for the district maps. Some districts, such as the Merced and Kings Section 5 districts, were established early in the process and influenced the drawing of adjacent districts. For exam-ple, Commissioner Cynthia Dai described the Merced congressional district as “an immovable puzzle piece.”2
Map 1 shows that the June 10 lines were not sub-stantially changed in the final maps for three of the four districts.
In a number of cases, the commission responded to public input by creating “hard lines” for Q2 to follow. At one point, the commission created visualizations of districts that would have crossed the Golden Gate Bridge. But after substantial public input, the commis-
1“Principles for Drawing Preliminary Maps,” commission document dated May 5, 2011.2Commission meeting, June 29, 2011, transcript.

46 League of Women Voters of California When the People Draw the Lines
ChAPtEr 5
Mapping
sion decided not to cross the bridge, which affected the drawing of districts throughout the Bay Area and Northern California. Commissioner Stanley Forbes recalled intense public comment from residents of Marin County highlighting the COIs that were on each side of the bridge. Other hard boundaries includ-ed the Monterey–San Luis Obispo and Kern–San Luis Obispo county borders and the Coachella Valley area between Riverside and Imperial counties.
In general, VRA counsel advised the commission to draw minority-majority districts in areas where a minority group was concentrated. However, at the same time, counsel advised the commission not to create districts with high concentrations of an ethnic group (more than 65 to 70 percent of the Citizen Voting Age Population, or CVAP), because then its representa-tion would likely be weaker in adjacent districts (an approach known as “packing”). The commission even-tually attempted to create minority districts with about 50- to 55-percent representation by a minority group, although many of the initial draft maps and some final maps had higher ethnic concentrations.
the June 10 draft maps
The process of creating the first-draft maps released on June 10 was rushed. Although the commissioners knew that the June 10 maps represented only a first draft, most saw no alternative to releasing them. Something had to be put out in public.
The draft maps generated significant opposition from Latino voting-rights organizations, which com-plained that too few districts had been devised in which Latinos would be able to exert influence commensurate with their growing population.
In any case, the June 10 draft maps usefully focused public input. With actual maps to which they could react, members of the public could offer concrete pro-posals to keep or amend the proposed lines.
With a plan on the table and the public showing greater interest, the commission entered the critical period of its work: drawing of the final maps. The com-mission and Q2 embarked on an intense period of mapping from June 24 to July 28. This four-week period constituted the heart of the citizen redistricting process.
CD 3
CD 16
CD 21
CD 20
Legend
10 June Districts
Final Districts
mAP 1: section 5 Congressional districts
The pressures of responding to the mountain of public testimony and the promise to respect the inter-ests of diverse entities forced the commissioners to make changes to their process. They decided to create “working visualizations” rather than the complete set of second-draft maps that they had originally prom-ised to release on July 14.3 This decision reflected the late start to the mapping process and the lack of time to complete a full set of second-draft maps. Although the visualizations allowed the commission to finish its work in a timely manner, some members of the pub-lic complained that this process was difficult to follow without being in the room.
The commissioners also decided to divide the state among pairs of commissioners responsible for absorb-ing the voluminous public testimony for each area. As
3Unlike the final maps due on August 15, these second-draft maps were a promise by the commission not required by law.

47When the People Draw the Lines League of Women Voters of California
ChAPtEr 5
Mapping
Commissioner Michelle DiGuilio stated at the June 23 meeting:
We, as commissioners, are still responsible for looking at other areas outside our region, what we’re trying to do is add one extra layer, which is to have in-depth coverage by pairings of commissioners.4
Case study: los Angeles County Congressional districts
A detailed examination of the drawing of congressional districts in metropolitan Los Angeles reveals the chal-lenges of creating congressional districts in a sprawling and diverse urban region consisting of eighty-eight incorporated cities and numerous unincorporated com-munities. Commissioner Forbes believed, in retrospect, that the four Section 5 counties posed less complicated challenges than Southern California and that begin-ning public hearings with the complex, multiethnic Los Angeles region would have been a better approach.
san fernando Valley (Cd 29 and Cd 30)The drawing of two congressional districts in the San Fernando Valley was marked by substantial consen-sus. The valley is a geographically distinct part of Los Angeles. Physically, it is a large inland basin surrounded by mountains. The “Valley” grew rapidly after World War II as suburban subdivisions and factories replaced farm fields. Since the 1960s, the San Fernando Valley has experienced an influx of Latinos into working-class districts along the industrial corridors in the eastern valley.
Latinos activists had protested the 2001 redis-tricting, which created two neighboring congressional districts in the valley that protected white incumbents (Howard Berman and Brad Sherman) who might oth-erwise have faced challenges from Latino candidates. The citizen commission, charged with drawing lines not bound by incumbent self-interest, would be closely watched in the valley.
4Commission meeting, June 23, 2011, transcript.
San Fernando Valley East (CD 29) was the first district drawn in the region, based on COI testimony, and the mandate under Section 2 of the Voting Rights Act to draw districts, where possible, in which minor-ity communities could have an opportunity to elect candidates of their choice. This district was 51 percent Latino, and it also reflected the recommendation fre-quently made in public testimony to use the 405 (San Diego) Freeway as a dividing line between the eastern and western parts of the valley.5
Beyond building this new district, the commis-sioners responded to consistent public testimony from individuals and organizations to follow the geo-graphical boundaries of the valley. The commissioners maintained COIs and neighborhood-council6 bound-aries in dividing the East San Fernando Valley (CD 29) and West San Fernando Valley (CD 30). For example, Mulholland Drive along the crest of the Santa Monica Mountains and Hollywood Hills separates CD 30 from CD 33 to the south. Commissioners also referred to maps submitted by the Valley Industry and Commerce Association (VICA) in drawing the district boundaries.
In maps presented by Q2 to the commission on June 1, the valley was split among three districts that went beyond its borders. In addition to San Fernan-do Valley East, parts of the valley were included in the Antelope–Santa Clarita and San Fernando Valley West–East Ventura County districts. The latter district extended from the Ventura–Los Angeles county-line beach area through the western San Fernando Valley to the Hollywood Hills.
The June 10 maps created a more compact San Fer-nando Valley West district. This was based on the desire of Thousand Oaks residents to keep their city intact in at least one level of districts. At the June 7 meet-ing, where the commission gave final directions to Q2 for the first-draft maps, Commissioner Dai requested that Thousand Oaks be kept whole in a congressional district. To accomplish this, the mappers rotated popu-
5“Full Commission Business Meeting,” Norco City Council Cham-bers, Norco, California, May 5, 2011, transcript.6In 1999, a charter revision in Los Angeles established a system of ad-visory neighborhood councils. More than ninety were in place during the redistricting process, covering most of the city. The boundaries of neighborhood councils were established by those groups that applied for neighborhood council status, based on criteria that resembled com-munities of interest.

48 League of Women Voters of California When the People Draw the Lines
ChAPtEr 5
Mapping
lation among three districts. Thousand Oaks was moved entirely into the East Ventura County district, along with Agoura Hills and Westlake Village. The West San Fernando Valley added the communities of Granada Hills and Porter Ranch, plus a portion of the city of Santa Clarita. Although this change required splitting Santa Clarita, it united West Valley communities and respected the desire of valley residents to maintain the area’s integrity as much as possible. It also responded to the wishes of the Conejo Valley cities (Thousand Oaks, Westlake Village, Agoura Hills) to be together. These maps solidified the concept of two San Fernando Val-ley districts, including a majority Latino district in the eastern half of the valley.
In the July 8 maps, the East San Fernando Valley district gained Van Nuys, Valley Glen, and North Hol-lywood and lost the foothill communities of Shadow Hills and La Tuna Canyon. With minor boundary changes, this revised district would be maintained in the final map and remained a majority Latino district.
mAP 2: san fernando Valley Cds
Santa Clarita
Los Angeles
Legend
10 June Districts
CD 29:East San Fernando Valley
CD 30:West San Fernando Valley
The West San Fernando Valley district experienced subsequent revisions to compensate for changes made in adjacent districts. In the July 8 map, Reseda, the south-ern part of Santa Clarita, and Calabasas were moved to adjacent districts. To add population, the district was extended south to include Bel Air and Beverly Hills. At the July 9 meeting, some commissioners expressed concern that residents in the wealthy Westside neigh-borhoods might dominate politics in the West San Fernando Valley district. They directed Q2 to shift Bev-erly Hills and Bel Air south to the Westside district.
For the final maps, Mulholland Drive was main-tained as a dividing line between the San Fernando Valley and the Westside of Los Angeles. To compen-sate for the removal of Beverly Hills and Bel Air, the West San Fernando Valley district was extended east along the Ventura Boulevard corridor to take in Enci-no, Valley Glen, and North Hollywood.
This would be one of the easiest and least contro-versial areas to map. The San Fernando Valley districts respected the boundaries of the valley to a significant degree and reflected the ethnic geography of the valley by creating a Latino-majority district in the eastern half of the valley. These districts are a very good example of commissioners following the constitutional criteria and ignoring political partisanship and incumbency in drawing maps. For example, two Democratic incum-bents found themselves competing against each other7
for the new CD 30 seat in 2012. Map 2 shows the bor-ders of the June 10 districts, compared to the final lines.
Westside los Angeles, Culver City– Crenshaw, and south Bay (Congressional districts 33, 43, and 47) South Los Angeles, by contrast, emerged as one of the most controversial elements of the congressional redistricting. For some years, African Americans had represented three congressional districts in South Los Angeles, despite nonmajority African American popu-lations.
With the African American share of the local population in long-term decline, the commission-ers initially believed that creating at least one African
7Congressman Brad Sherman defeated Congressman Howard Berman for this seat.

49When the People Draw the Lines League of Women Voters of California
mAP 3: Western lA County Cds–June 10 maps
Culver City
BeverlyHills
Santa Monica
Westchester
LAXInglewood
Hawthorne
Gardena
Torrance
Palos Verdes Peninsula
BeachCities
BaldwinHills
Legend
Culver CityCrenshaw
Palos Verdes Beach Citiest
West Los AngelesDowntown
InglewoodSouth LA
HawthorneGardenaCompton
ChAPtEr 5
Mapping
American majority district would be favored by the African American community. An early set of maps, presented to the commission on May 28, created a Cren-shaw-Inglewood district that was 59 percent African American and 29 percent Latino. This district included the city of Inglewood and most of the neighborhoods of South Los Angeles. However, some commissioners expressed concern that this involved packing African Americans into one district. This would make adjacent districts less favorable than before to African American constituencies.
These concerns were addressed in the June 10 maps, which created three districts in the southwest region of Los Angeles County in which African Americans represented 21–22 percent of the total population (and between 30 and 40 percent of the estimated CVAP). As shown in Map 3, these districts included Culver City–Crenshaw, Inglewood–South Los Angeles, and Hawthorne-Gardena-Compton. In addition, a long coastal district connected Santa Monica, the airport area, the beach cities, and the Palos Verdes peninsula. The West Los Angeles–Downtown district stretched from Malibu to Downtown Los Angeles. This elon-gated district combined disparate neighborhoods, from the affluent Beverly Hills and Bel Air to the immi-grant, working-class neighborhoods Westlake and Pico-Union.
The commission received intense feedback on the June 10 maps. Q2 presented a new set of congressional districts on July 1. The new West Los Angeles–Down-town district was now much more compact and oriented toward the Westside. The district now included Santa Monica, Marina del Rey, and Del Rey from the Palos Verdes district, all middle-class white communities. It combined most of the Culver City–Crenshaw district, including Culver City, Baldwin Hills, Crenshaw, and Mid-City, without downtown neighborhoods. The densely populated neighborhoods close to Downtown Los Angeles, including Hollywood, Koreatown, and Pico-Union, were removed. This revision did a better job than the earlier version of reflecting the east-west social and economic divide in Los Angeles.
To the south, the Inglewood–South Gate district was reconfigured in order to keep the airport and air-port-adjacent communities intact, grouping many of the South Bay cities together and keeping Torrance
mostly intact. The beach cities were connected with the Palos Verdes Peninsula, both ports, Wilmington, and most of Long Beach.
Q2 presented another set of revised maps to the commission on July 9. The Inglewood-based district was again completely revised. The Baldwin Hills–Crenshaw and adjacent South Los Angeles districts were added and most of Gardena and Torrance, communities with small African American populations, were removed. This reflected two directions from July 1: to keep the airport communities together and to connect Inglewood with the Baldwin Hills area. The airport communities (e.g. Westchester, El Segundo, and Hawthorne) repre-sented an economic and political COI. The airport is a source of jobs, as well as a focus of neighborhood con-cerns regarding airport expansion and noise. Inglewood and Baldwin Hills are an example of a cultural COI, with significant African American populations.
The July 14 maps returned to the concept of two interior districts to the east of the coastal district, as

50 League of Women Voters of California When the People Draw the Lines
ChAPtEr 5
Mapping
presented in the June 30 maps. The Culver City–Cren-shaw district included most of Westside Los Angeles, Mid-City, and the South Los Angeles neighborhoods surrounding Baldwin Hills. An Inglewood-Torrance district was based on the Inglewood–South Gate ( July 1) district, including Inglewood, Hawthorne, Gardena, Torrance, and adjacent cities and communities. This established the basis for the three Westside–South Bay congressional districts.
Differences within the commission on South Los Angeles came to a head at a dramatic July 24 meeting, when the concept of three coastal districts was back on the table (see Map 4). In this iteration, the northern district comprised Westside Los Angeles, Santa Mon-ica, and Malibu. The central district would include the airport, Culver City, Inglewood, and most of South Los Angeles. The southern district would cover the South Bay cities. The divisions of the Westside and South Bay were removed. The Westside Los Angeles neighborhoods were united with Santa Monica, Ven-ice, and Malibu. Torrance stayed whole, and the South Bay cities were combined in one district. This decision reflected testimony from South Bay cities hoping to be united in one district.
The proposal met with strong opposition from the African American community. Some commission-ers argued that the South Bay district combined very different COIs—higher-income neighborhoods along the coast and lower-income, working-class neighbor-hoods in the interior. Furthermore, African Americans would be packed into one central district, in which they represented 51 percent of the CVAP, though African Americans had previously had success electing can-didates of their choice in less concentrated districts. Commissioners Andre Parvenu and Connie Galambos Malloy stated that they would vote against any map including this option; because they were not aligned with either party, their opposition would essentially block final approval.8 A majority of the commission-ers shared their concerns, and they decided to keep the long coastal district and two interior districts in the southwest region of Los Angeles County.
In the final map (see Map 5) the opportunity for
8With four members, the nonaligned members had to generate three votes for a majority.
African Americans to continue to influence three congressional districts was preserved.9 The black com-munity wanted to maintain three districts in which they were a significant minority. Their concerns were satis-fied by the final maps, which created one coastal district and three interior districts where African-Americans were a significant minority
the maps and the Criteria
This examination of the mapping process found that the commission was ultimately successful in attempting to meet the six constitutional criteria for redistricting. The main weakness of the process was that in deter-mining COIs, the commission relied exclusively on
9Although all three African American members of Congress ran for reelection under the new lines, only two of the three (Maxine Waters and Karen Bass) were reelected, while Laura Richardson was defeated by Janice Hahn.
mAP 4: Western lA County Cds–July 24 option
CulverCity
BeverlyHills
Santa Monica
Westchester
LAXInglewood
Hawthorne
Gardena
Torrance
Palos Verdes Peninsula
BeachCities
BaldwinHills
Legend
South Bay district
Culver CityInglewoodWestchester district
Santa MonicaWest LA district

51When the People Draw the Lines League of Women Voters of California
ChAPtEr 5
Mapping
public testimony, rather than supplementing that sub-jective data with other types of data not derived from public input.
Population Equality (Criterion #1)Until the Supreme Court intervened in the 1960s, congressional districts were drawn without regard for population disparity. At one time, the vote of one Cali-fornian was worth as much as 422 times the vote of another.10 A series of court cases beginning in 1962 brought an end to this practice and gradually moved the nation toward “one person, one vote” districting. Although the Supreme Court has avoided defining “one person, one vote” in a way that imposes too exacting a mathematical standard, equal-population districts are now regarded as a constitutional mandate.11 States have been granted somewhat more latitude than the federal government in drawing assembly and senate districts and are only required to show “substantial equality of population.”12
The redistricting software, Maptitude for Redis-tricting, facilitates the creation of districts with equal or nearly equal populations. The software allowed mappers to adjust district boundaries to meet the population-equality requirement. However, any change made to one district affects surrounding districts. This required sometimes complex and time-consuming rotations of population between districts to achieve population equality in all districts.
10Levitt, Citizen’s Guide to Redistricting.11See Reynolds v. Sims, 377 U.S. 533, 577 (1964) (“the Equal Protec-tion Clause requires that a State make an honest and good faith effort to construct districts, in both houses of its legislature, as nearly of equal population as is practicable. We realize that it is a practical impossi-bility to arrange legislative districts so that each one has an identical number of residents, or citizens, or voters. Mathematical exactness or precision is hardly a workable constitutional requirement”); and Brown v. Thomson, 462 U.S. 835, 842 (1983) (“We have recognized that some deviations from population equality may be necessary to permit the States to pursue other legitimate objectives such as ‘maintain[ing] the integrity of various political subdivisions’ and ‘provid[ing] for com-pact districts of contiguous territory.’”).12Reynolds, 377 U.S., at 579 (“So long as the divergences from a strict population standard are based on legitimate considerations incident to the effectuation of a rational state policy, some deviations from the equal-population principle are constitutionally permissible with re-spect to the apportionment of seats in either or both of the two houses of a bicameral state legislature.”).
The commission’s decisions about population deviation shifted over time, as indicated in chapter 6. Nonetheless, for the final maps, the commission direct-ed Q2 to draw districts with a total deviation from the ideal population of less than 1 percent. In the adopted commission maps, the average deviation of assembly districts was 0.51 percent, and the average deviation of senate districts was 0.45 percent.13
the VrA and minority representation (Criterion #2)An evaluation of the VRA process as it applied to the commission’s work appears in chapter 6.
geographic Contiguity (Criterion #3)This straightforward criterion meets the basic defini-tion of a formal region as a bounded territory created for a specific purpose. All of the districts are geographi-cally contiguous.
13CRC Final Report, p. 11.
CulverCity
BeverlyHills
Santa Monica
Westchester
LAXInglewood
Hawthorne
Gardena
Torrance
Palos Verdes Peninsula
BeachCities
BaldwinHills
Legend
CD 43:InglewoodTorrance
CD 37:Culver CityCrenshaw
CD 33:Santa Monica MountainsSouth Bay
mAP 5: Western lA County Cds–final maps

52 League of Women Voters of California When the People Draw the Lines
ChAPtEr 5
Mapping
geographic integrity of Communities of interest (part of Criterion #4)The most challenging aspect of the redistricting pro-cess was the COI criterion. No agreed-upon definition exists for Communities of Interest (COIs), and the commissioners had to create their own framework. Much of the commission’s effort focused on gather-ing public testimony to identify COIs. Proposition 20 defined a COI as:
a contiguous population which shares common social and economic interests that should be included within a single district for purposes of effective and fair representation.14
By this definition, a COI is geographically contig-uous.15 This precludes consideration of nongeographic communities (women, for example) and of “relation-ships with political parties, incumbents, or political candidates.”16 The community is unified by “shared social and economic interests,” examples of which “are those common to areas in which the people share similar living standards, use the same transportation facilities, have similar work opportunities, or have access to the same media of communication relevant to the election process.”17 Such interests can be determined, in part, by using social and economic data. Shared living stan-dards can be captured by income data, and similar work opportunities can be identified with data on education, income, and occupation. These data can supplement the collection of public input to identify communities.
The commission used a flexible concept of a geo-graphic community in a number of cases to support the creation of a district. For example, the long coastal districts in Northern California (Assembly District
14Cal. Const. art. XXI, § 2, subd. (d)(4) (emphasis added).15In fact, the California Supreme Court has used the phrase together with “geographical integrity”: “and respect for geographical integrity and community of interests. … Compactness does not refer to geo-metric shapes but to the ability of citizens to relate to each other and their representatives. …[I]t speaks to relationships that are facilitat-ed by shared interests and by membership in a political community, including a county or city.” Wilson v. Eu, 1 Cal. 4th 707, 719 (Cal. 1992). The court suggests not that the terms are interchangeable but rather that they are inextricably linked, with “community of interest” adding a “functional” component to “compactness”; Wilson,1 Cal. 4th 707, at 761–63.16Cal. Const. art. XXI, § 2, subd. (d)(4).17Ibid.
2, Senate District 2, and Congressional District 2), and the long mountain districts in the Sierra Nevada (Assembly District 5, Senate District 8, and Congres-sional District 4) were each based on the concept of a common community or regional culture related to the natural environment. The wine country of Napa and Sonoma counties was also recognized as a regional community. The commission broke new ground by defining LGBT communities, if geographically coher-ent, as a community of interest.
The population-equality requirement made city and county splits inevitable. All cities with populations larger than the required district population had to be split, some among several districts. The commission tried to minimize splits and documented those splits it implemented. When available, the commission relied on neighborhood boundary lines provided by local gov-ernments or organizations.18 For example, ninety-five neighborhood councils across the city of Los Angeles maintain established boundaries that were used in draw-ing districts.19 In San Francisco, the commission used boundaries provided by the Council of Asian Pacific Americans for Fair Representation (CAPAFR). The split of the city of Fremont used South Bay Coalition lines. However, most cities do not have such divisions, either formal or informal.
The commission worked hard to define COIs through various forms of public input, including public hearings. Although this process provided vital informa-tion for the commission, the subjective data could, in the next iteration, be supplemented with other types of data. Commissioner Jeanne Raya noted that some data beyond the public hearings would have been very helpful. Commissioner Michael Ward commented: “I had expected to apply objective criteria, and then use COI testimony.” However, there was little time and few resources available to develop such data, and pro-ducing it in the middle of the deliberations might have derailed the process.
In the January 28, 2011, meeting, Q2’s Karin Mac Donald noted that Government Code 8253 (7) required the commission to “receive public input” before drawing any maps. In the March 24 meeting,
18In some cases, the official neighborhood boundaries are disputed or in conflict.19See http://done.lacity.org, accessed August 25, 2012.

53When the People Draw the Lines League of Women Voters of California
data sources Available to the Commission: U.s. Census (ACs)
3-year data Released in the October following the end of every 3-year period. (e.g., data for 2017–19 is released in October 2020)
5-year data
Released in the December following the end of every 5-year period. (e.g., data for 2015–19 is released in December 2020)
ChAPtEr 5
Mapping
the commissioners heard a presentation on VRA and COI issues by Ana Henderson of the UC Berkeley Warren Institute of Law and Social Policy. In discuss-ing COIs, Henderson told the commission that “the best source of information about community of interest is people who live in and work with communities.…This is the criterion where the commission most needs to hear from the public.”20
For future commissions, with more time to plan in advance, additional data might reduce some of the burden of analyzing public testimony. For example, the American Community Survey of the U.S. Census provides estimates of social and economic informa-tion. Commissioner Vincent Barabba, former head of the U.S. Census, noted that though such data would be preliminary, it could allow the commission to begin drafting geographic parameters for future mapping. Although these data portray broader areas than the block level necessary for actual mapping, they can be useful as a foundation. If past practice is continued, data gathered mid- and late decade will be useful to the commission.
Three- and five-year census data are based on roll-ing samples and cover broader areas than necessary for mapping, which could allow the commission to begin provisional drafting before the full census data is avail-able (see sidebar).
Additional data would also allow the commission to avoid the appearance or reality of being manipulated by elected officials and candidates, who might well send surrogates to make a case for communities of interest that mask a political agenda.
Determination of COIs ultimately required judg-ment calls by the commission. For example, the city of Davis is a university town located west of Sacra-mento. The June 10 maps placed Davis in the same area as Sacramento, based on perceptions of common interest. Members of the Davis community protested that they preferred to be included with surrounding areas other than Sacramento. Commissioner Forbes, a community leader in Davis, said that he favored the connection to Sacramento but that he and the commis-sion deferred to what they perceived to be community sentiment. Although there was significant testimony
20Commission meeting, March 24, 2011, transcript.
by local elected officials in Davis in support of keeping Davis and Sacramento separate, incumbent members of the assembly and senate also had a direct stake in the outcome. The June 10 maps would have placed three Democratic members of the assembly in the same district. The result was a victory both for local elected officials and community activists and for the legislators and their supporters who feared a major restructuring of their Sacramento- and Davis-based districts.21
geographic Compactness (Criterion #5)According to article XXI of the California Constitu-tion, electoral districts “need to encourage geographical compactness” and not bypass nearby populations for populations further away, as long as this does not con-flict with higher-level criteria.22 Any districts that are not compact need to be justified based on the higher-level criteria. In their September 16, 2011, submission to the Supreme Court of California defending the com-mission’s redistricting plan, the commission’s attorneys argued that courts and states have rejected “a purely geometric conception of compactness.”23 Districts are
21Jim Sanders, “Davis-Sacramento Marriage Is Off in New Political Maps,” Modesto Bee, July 14, 2011. Accessed online March 10, 2013, http://www.modbee.com/2011/07/14/1774196_davis-sacramento-marriage-is-off.html.22Cal. Const. art. XXI, § 2, subd. (d)(5). 23From the “Consolidated Preliminary Opposition to Petitions for Writ of Mandamus or Prohibition,” p. 44, Vandermost v. Bowen, 53 Cal. 4th 421 (Cal. 2012), quoting Wilson, 1 Cal. 4th 707, at 719 (here, the court is quoting and endorsing the rationale of the special masters, as captured in their comprehensive “Report and Recommendations,” set forth in appendix 1 to the opinion).

54 League of Women Voters of California When the People Draw the Lines
ChAPtEr 5
Mapping
considered compact if they are functionally integrated and residents have shared interests.
Although compactness is a lower-priority cri-terion, together with contiguity it is the most visual characteristic of a district. At a glance, districts that do not appear compact raise suspicions of gerrymander-ing—the creation of spatially contiguous but utterly convoluted districts for political purposes. As a result, the commission hoped to create compact districts to the extent feasible. Commissioners would often refer to the “eye test” when reviewing draft districts and make sure that any oddly shaped districts could be justified based on the higher-level criteria. The “eye test” may be common, and appealing to commissioners, but it does not fulfill the requirements of the state constitu-tion. The constitutional test depends on where people actually live. Often, city boundaries meander, and cities look like gerrymanders themselves; districts that follow city lines may, for example, have arms that stick out or other strange features.
For example, the following congressional districts are elongated: CD 2 (North Coast), CD 4 (Sierra Nevada), CD 8 (Eastern Sierra and San Bernardino County), CD 21 (Kings County), and CD 33 (Coastal Los Angeles). In most of these districts, the elongat-ed shape reflects a COI: the coastal communities of Northern California (CD2), the Sierra Nevada and Tahoe Basin (CD 4), the Santa Monica Mountains and coastal communities of metropolitan Los Angeles (CD 33), and the sparsely populated desert and basin com-munities in Inyo, Mono, and San Bernardino counties (CD 8). The “Kern curl” drawn in each district incorpo-rating Kings County was necessary in order to capture population in Bakersfield and maintain the benchmark minority voting populations in any Kings County dis-trict, as required by VRA Section 5.
City boundaries meander and cities
look like gerrymanders themselves.
nesting (Criterion #6)The California Constitution states that to the extent possible, the eighty assembly districts should be nest-ed in the forty senate districts, which in turn should be nested in the four Board of Equalization districts. Nesting is the lowest-order criterion for a good reason: it is very difficult to combine districts without violating higher-order criteria based on the VRA, respecting city and county boundaries, and representing COIs.
At the June 1 meeting, Q2 illustrated this dilemma for the commission by presenting a perfectly nested senate district map, based on the draft assembly dis-tricts. Q2 pointed out that the Section 5 districts (those including Kings, Merced, Monterey, and Yuba coun-ties) could not be perfectly nested without running afoul of the VRA requirement to maintain minority voting strength. However, in each case two assembly districts could be nested, after which the boundaries could be adjusted to meet Section 5 requirements. The same procedure was used for Section 2 districts, where the commission wanted to maintain ethnic voting strength. Q2 described the procedure as “blending”—nesting two assembly districts, then adjusting the boundaries to better satisfy the higher-order criteria, thus creating partially nested districts. Of course, drawing a blended district forced each surrounding district to be blended as well, greatly reducing the number of senate dis-tricts that could be created from the perfect nesting of two assembly districts. The end result largely, though incompletely, satisfied the nesting criterion. Although only three senate districts were created by the complete nesting of two assembly districts, all forty senate dis-tricts were between 65- and 100-percent nested.24
Conclusions
The mapping process was compressed into a tight four-month timeframe. Had the mapping team been hired in January, they would have had at least two more months to collect public testimony and supplemental data in preparation for the map drawing, which began
24CRC Final Report, p. 25.

55When the People Draw the Lines League of Women Voters of California
ChAPtEr 5
Mapping
in March with the release of census data.25 In the next redistricting process, the mapping team and VRA counsel should be hired earlier. Better yet, the line-drawing consultants could be hired in 2020, allowing ample time for the collection and evaluation of social and economic data, the collection of public testimony, and the drawing of draft maps.
The sheer volume of COI testimony made it diffi-cult to determine its validity, catalogue it, and prioritize its use in the redistricting process. Public testimony should be gathered and collated in a more effective way. The commission needs to develop a systematic method for identifying the specific COI testimony relied upon in the creation of each district. In addition, before the commission convenes, demographic and geographic data should be collected to supplement public hear-ings for the purpose of assessing COIs. Such materials, including information about industry and commerce, and urbanization and suburbanization, are available before the release of the full census.
Prior to the mapping process, the commission should collect a systematic series of data sets and maps for key socioeconomic variables for the population, including educational attainment, income, industry, and occupation. These could be based on the five-year American Community Survey samples conducted prior to the decennial census (e.g., 2005–9), although census data can be used as they are made available. Spatial sta-tistics can be used to identify areas based on different socioeconomic characteristics (e.g., income, education, industry, etc.). This data would complement public tes-timony gathered for the identification of COIs. Also, information should be collected from local and regional agencies (e.g., planning, water, energy) to support the determination of communities with shared interests.
Other boundary files are useful for the mapping process. These include neighborhood boundaries (such as the neighborhood-council borders in the city of Los Angeles), service districts, watersheds, councils of government, and so on. Before the mapping process begins, the commission and its mapping team should collect these supplementary boundary files to assist in determining the need for city and county splits.
25Pub. L. 94-171, 89 Stat. 1023 (1975) (codified as amended at 13 U.S.C. § 141[c]).
The selection of the mapping consultant and the relationship between the commission and the map-ping team are critical to the success of the redistricting process. In 2011, the commission hired an experienced and responsive team. Q2 followed commission direc-tions to draw and revise maps. They were skilled in using the redistricting software, creating districts based on the parameters given by the commission, present-ing options to the commission, and outlining possible impacts of a given change on adjacent districts.
Q2’s associated staff members also spent a great deal of time and energy staffing public input hearings, summarizing public input, and creating a database of public testimony. Q2’s four mappers were stretched to their limits in June and July, putting in long hours at night and over the weekends. Although this is part and parcel of the intense, compressed redistricting pro-cess, a better-funded mapping team could employ one or two additional mappers to spread the workload. In addition, a separate consulting team should be respon-sible for collecting and organizing public input.
Some commissioners preferred to see a map show-ing the changes made in a revised district, instead of comparing two sets of maps. With more resources, the mapping team could devote staff to preparing map revisions showing the changes made between drafts. It would be helpful to create reports for each subre-gion or county (e.g., southwest Los Angeles County or Orange County), showing the series of district maps created through successive revisions and documenting the specific reasons why a given district was built or revised. Though large numbers of maps would tax even a larger line-drawing team, a technical report for each district—outlining design principles, decisions, public input, and revisions—would be helpful.

56 League of Women Voters of California When the People Draw the Lines
ChAPtEr 6
The Voting Rights Act
Compliance with the federal Voting Rights Act (VRA) was one of the commission’s highest constitutional obligations, and delayed VRA training for commissioners placed them at a disadvantage. Despite these obstacles, the commission ultimately followed a process that respected the VRA. At times there was a lack of clarity about whether to use voting-age population or citizen voting-age population. With greater access to a broader range of data at an earlier stage, the next commission should be able to continue to respond effectively to the VRA.
Phot
o C
ourte
sy o
f CA
Com
mon
Cau
se
57When the People Draw the Lines League of Women Voters of California
ChAPtEr 6
The Voting Rights Act
the federal Voting rights Act
The landmark 1965 federal Voting Rights Act is a powerful defense against tactics that effectively disen-franchise minority groups. Drawing from the language of the Fifteenth Amendment, the VRA prohibits all states and “political subdivisions” from applying any “voting qualification or prerequisite to voting or stan-dard, practice, or procedure…in a manner which results in a denial or abridgement of the right of any citizen of the United States to vote on account of race or color.”1
Under the VRA, a violation is established if, “based on the totality of circumstances, it is shown that the political processes leading to nomination or election in the State or political subdivision are not equally open to participation by members” of a protected class. Liability exists under the VRA when the members of a protected class “have less opportunity than other members of the electorate to participate in the political process and to elect representatives of their choice.” The VRA pro-tects opportunities for racial and language minorities to achieve equitable political power where conditions would otherwise threaten that ability.
Two provisions of the VRA are relevant to redis-tricting: Sections 2 and 5. The U.S. Supreme Court set out the standard for the evaluation of Section 2 claims in Thornburg v. Gingles.2 Under the Gingles test, a violation of the VRA will only be found if (1) the voting-eligible minority group is “sufficiently large” to constitute more than half of the number required for an appropriately sized district; (2) the minority group is sufficiently “geographically compact” that it would naturally fall within a single district; (3) the minority group is “politically cohesive,” such that its interests are united and distinctive; and (4) racially polarized bloc voting demonstrably impedes the minority group’s abil-
1Voting Rights Act of 1965, 42 U.S.C. § 1973 (1965) (Pub. L. 89-110, Aug. 6, 1965, 79 Stat. 437). California also has its own state Voting Rights Act (CVRA), passed in 2002, which provides additional pro-tection for minority groups whose votes are effectively diluted through the political process but who are too geographically dispersed to fall under the protection of the federal VRA. The CVRA applies specifi-cally to at-large (local) elections, and, for that reason, it was not a con-sideration in the commission’s redistricting process. Cal. Elec. Code §§ 14025–32.2Thornburg v. Gingles, 478 U.S. 30 (1986); see also Bartlett v. Strick-land, 556 U.S. 1 (2009).
ity to have their preferred candidate prevail. Once these threshold factors are met, the court will then evaluate the “totality of circumstances” surrounding the claim. Here, the court will consider everything from the racial content of political campaigns to the minority group’s particular history of facing official discrimination.3
Section 5 of the VRA provides special protection for certain “covered jurisdictions.” Covered jurisdic-tions were identified in the period between 1964 and 1972, based on a specific formula that took into account the use of voting “test[s] or device[s],” along with voter registration and participation, as a percent-age of the voting-age population (VAP).4 Some states are covered in their entirety under Section 5.5 At the time of the California redistricting, four California counties were covered under Section 5: Kings, Merced, Monterey, and Yuba.6 In three of the four Section 5 counties in California, their inclusion has to do with a historical circumstance: the presence of military bases that distorted the minority composition of the voting population.7
In those covered jurisdictions, a state may not implement any voting-related change without first obtaining “either judicial or administrative approval of the change, to ensure that it does not have the purpose or effect of denying or abridging the right to vote on account of race, color, or language minority.”8 A Sec-tion 5 analysis involves a determination of whether the
3Gingles, 478 U.S., at 36 (these additional factors were adopted by the court from the Senate Judiciary Committee Report on the 1982 amendments to the Voting Rights Act and are known as the “Senate Factors”; S. Rep. No. 97-417, 97th Cong. (1982).4U.S. Department of Justice, accessed September 2, 2012, http://www.justice.gov/crt/about/vot/sec_5/about.php.5Covered states are Alabama, Alaska, Arizona, Georgia, Louisiana, Mississippi, South Carolina, Texas, and Virginia. As a covered state, the entire Arizona redistricting process had to be evaluated under Sec-tion 5.6Monterey and Yuba counties have been covered since 1968; Kings and Merced counties have been included since 1972; U.S. Department of Justice, accessed September 2, 2012, http://www.justice.gov/crt/about/vot/sec_5/covered.php. As of July 31, 2012, after years of litigation and campaigning, Merced is no longer under Section 5 scrutiny; see Capitol Alert, Sacramento Bee, July 31, 2012, http://blogs.sacbee.com/capitolalertlatest/2012/07/merced-county-released-from-voting-rights-act-scrutiny.html.7The largely minority military population in these counties was includ-ed in the census and therefore in the VAP, even though they typically register and vote in their home states.8Vandermost, 53 Cal. 4th 421, at 479.

58 League of Women Voters of California When the People Draw the Lines
ChAPtEr 6
The Voting Rights Act
proposed change will lead to a “retrogression in the [existing] position of racial [or language] minorities with respect to their effective exercise of the electoral franchise.”9 Section 5 holds up a jurisdiction’s existing plan as a “benchmark,” against which any proposed change must be measured. The authority for Section 5 clearance is vested primarily in the U.S. Department of Justice.10
Redistricting in light of the VRA has been chal-lenged in court, with opponents arguing that the practice of drawing district lines with race as the predominant consideration violates the equal protection clause of the Fourteenth Amendment.11 However, the Supreme Court has consistently rejected that argument, holding that where the state is able to provide strong evidence that the Gingles conditions exist, the state has suffi-ciently compelling reason to allow racial considerations to predominate in the drawing of district lines—as long as they do so no more than is “reasonably necessary” to comply with the VRA.12 The court’s interpretation is consistent with the VRA’s fundamental purpose: rec-tifying electoral practices and procedures that result in the “denial or abridgement of the right of any citizen to vote on account of race or color.”13
9Vandermost, 53 Cal. 4th 421, at 481.10Or in a three-judge court of the U.S. District Court for the District of Columbia.11See Bush v. Vera, 517 U.S. 952 (1996).12Vera, 517 U.S., at 977.13Voting Rights Act of 1965.
Compliance with Sections 2 and 5 requires care-ful attention to both minority demographics and political data. This presented a real challenge to the commissioners, who chose to interpret their mandate to neither favor nor discriminate on political grounds to keep them “blind” to the political consequences of map drawing. The VRA required the commission to consider whether racial polarization in voting created conditions that affected the ability of minority groups to elect members of their choice to office. In other words, the commissioners ignored political data in the case of incumbents or political parties, but at the same time were required by the VRA to have at least some understanding of how voting behavior restricts oppor-tunities for minority influence.
the Commission and its Process
The commission consisted of individuals with the ability to negotiate these straits carefully. Commission-ers were professionally accomplished, educated, and thoughtful; several had particularly relevant experience, including backgrounds in the social sciences and in city, community, and regional planning.
The commissioners evaluated and retained legal counsel and mapping consultants with substantial expertise but did not defer blindly to them. Meeting transcripts indicate that the commissioners carefully probed the issues relevant to VRA compliance. Com-missioners received and gave consideration to voting-rights groups, some of which received funding from The James Irvine Foundation (an example being the Asian Pacific American Legal Center).
Commissioners offered sophisticated pushback to the advice of counsel and consultants, testing not only the definitions of terms and the reliability of data but also the degree of ambiguity inherent in the law and the extent to which their consultants’ advice revealed preferences but not requirements. At times, discus-sion between VRA counsel and some commissioners became charged. According to Commissioner Maria Blanco, some commissioners disagreed strongly with the early advice given by their VRA counsel, feeling that it relied too heavily on the lesser criterion of “com-pactness.”
Compliance with Sections 2 and 5 requires careful attention to both minority demographics
and political data.

59When the People Draw the Lines League of Women Voters of California
ChAPtEr 6
The Voting Rights Act
training and data delays
Even with their level of experience and education, the commission would have benefited from earlier training in the nuances of the VRA, which would have leveled the field between those commissioners who knew the VRA well and those who did not. The need for such training was recognized early on but was long deferred. The first group of eight commissioners received some VRA training, and the next six members were encour-aged to view the video record of the training. The first meaningful training for the full commission occurred on March 24. The training reviewed the relevant legal requirements, as the commission requested, but did not suggest how the commission should structure its work so as to ensure compliance—neither the data the com-mission should seek nor the process it should pursue. The first hints of such advice had to wait until April 28, more than a month later.
Several factors appeared to delay any detailed train-ing. The commission tentatively scheduled an initial training session for February 25, but the presenter was unavailable. The plan to delegate the training to VRA counsel meant that the time required to hire counsel delayed training as well. Ultimately, the commission had to wait until late April to get its first formal instruction on how it should go about ensuring VRA compliance. Perhaps not surprisingly, the June 10 maps were criticized for inadequate attention to the VRA.
The commission also ran into delays in acquir-ing related data. Estimated demographic data from the census were available in late 2010 and early 2011; though not perfect, this data would have allowed the commission to focus in a preliminary way on areas of particular concern and thus would have allowed them to start their work earlier.
Polarized voting analysis refers to studies of the impact of group voting patterns on the opportunities for minority communities to elect candidates of their choice. Such research is vital to ensuring that district maps comply with the VRA. Election data—particu-larly local voting patterns by race and ethnicity, gleaned from careful statistical analysis of precinct-by-precinct election results over multiple cycles—are required to assess VRA compliance. Without understanding local voting patterns, it is very difficult to tell whether minor-
ity communities’ practical ability to elect candidates of choice has been impaired for VRA purposes. Without such information, it is equally difficult to tell whether new district lines preserve or restore such opportunity. The census does not provide this information, and the Statewide Database, which otherwise served as Cali-fornia’s central repository of redistricting information, collected only portions of the required information.14
Polarized voting analysis was not obtained until very late in the process. The commissioners understood that they should begin gathering polarized voting data from “day one.” Yet the contracting process for a con-sultant to collect and analyze this data began only on April 27. The consultant began work by June 16, even before the contract was completely finalized, but this was still an exceptionally late start. Not until June 24 did the commission start getting hints of the results of the analysis; the results in Los Angeles—neces-sarily incomplete due to the rush of time—were not formalized until July 13, at which point just sixteen days remained in the map-drawing process, making it exceedingly difficult to change course if necessary or to test the near-final drafts to ensure that they complied with the VRA. Even if the commission had contracted immediately for this research, extending it to the full statewide range would have been difficult due to time and funding limitations.
The absence of this data created difficulties in ensur-ing compliance with the VRA. Drawing districts where race or ethnicity outweighs all other considerations is constitutional only as long as doing so is “reasonably necessary” to achieve VRA compliance. In order to pre-cisely assess potential VRA liability, the commission needed voting data, such as historical minority support for preferred candidates in various regions of the state and the extent to which majority preferences regularly coalesced against those candidates.
Similarly, voting data are essential to an accurate determination of whether the proposed new districts would effectively restore minority influence to VRA-
14The Statewide Database collected some statewide voting data for use in polarization studies but lacked the most critical information—namely, data from legislative primaries (which is most useful in a state like California with polarized partisan pockets) and data from local elections. More important, the database was not equipped to analyze the raw data to assess the degree of racial polarization.

60 League of Women Voters of California When the People Draw the Lines
ChAPtEr 6
The Voting Rights Act
compliant conditions. In the absence of this data, the commissioners did what they could. For example, they began in the right place by asking their mapping con-sultant to begin in counties covered by Section 5 of the VRA, with instructions to provide summaries of available options. The commissioners then asked the consultant to identify sizable and geographically com-pact minority groups that could potentially implicate Section 2 of the VRA.
Without the data to accurately assess the VRA factors, the commission attempted to draw districts in pockets with large minority populations around nonra-cial criteria, acknowledging race and ethnicity but not allowing either to drive the district boundaries. When such districts actually provide minority communities with an effective opportunity to elect candidates of choice, there is no concern with such a practice. But when such districts do not do so, and voting patterns implicate the VRA, compliance requires an adjustment.
To be clear, these serious process difficulties do not mean that the commission produced noncompliant final maps. In general, the commissioners recognized, quite early, that drafts would change substantially with better data, and they strove to accommodate changes that were recognized as necessary; but the process was made unnecessarily difficult by the delay in receiving the data.
The commission attempted to substitute public input from local communities for data that had not yet arrived. The commission carefully considered local tes-timony, for example, concerning the electoral success of the African American community in Los Angeles and
the functional compactness of the Latino community in Anaheim and Santa Ana. However, when the rel-evant data finally started to come in and VRA liability became apparent, data proxies were appropriately dis-carded.
The commission also struggled with how to use the data it did receive. In determining whether districts actually provided minority communities with “effective exercise of the electoral franchise,” the commission at times focused, based in part on counsel’s advice, on the demographics of the voting-age population. Demo-graphics reveal how many adults can be found in the district but without attention to citizenship (especially in a state like California, with many noncitizens) may give a limited view of the political potential of repre-sentation.
In contrast, the Department of Justice, in its guide to redistricting under the VRA, stresses registration rates and turnout.15 Such electoral factors would have been especially helpful in illuminating VRA liability in those districts in which minority communities were teetering at the threshold of 50 percent of the district’s Citizen Voting Age Population (CVAP).16
In order to ensure compliance with the VRA, future commissions must focus on ensuring effective exercise of the franchise by minority populations. This requires an emphasis on eligible citizens (Citizen Voting Age Population) rather than merely voting-age population (VAP). The commission will require analysis of polar-ization, registration rates, and past turnout in order to gauge whether particular districts actually afford a pragmatic “opportunity” or “ability” to elect candidates of choice.
Finally, the issue of population disparity was knot-ty. Electoral districts must be equal in population. And yet some “disparity” from perfect equality is inevita-ble. As described above, the Supreme Court has held that states have somewhat more flexibility in drawing
15Department of Justice, Guidance Concerning Redistricting under Sec-tion 5 of the Voting Rights Act, 76 FR 7470-01 (2011) (although the specific focus of this guide is on Section 5 compliance, the analysis is also helpful for Section 2 purposes). 16By the same token, it is possible that past voting data would indicate that districts below the 50-percent threshold do offer a meaningful opportunity to elect candidates of choice. The point is not that the resulting districts did not comply with the VRA but rather that the commission could not be sure whether they complied or not.
2%The commission eventually approved a standard permitting a total deviation of no more than 2%.
notEWorthY
61When the People Draw the Lines League of Women Voters of California
ChAPtEr 6
The Voting Rights Act
assembly and senate districts and are only required to show “substantial equality of population” compared to the requirements for drawing congressional districts.
Flexibility in how far districts can deviate from perfect population equality means ambiguity for those tasked with drawing the lines. The commission strug-gled to adopt a consistent standard. VRA counsel first recommended that districts deviate no more than 2 percent, even when drawing for purposes of the VRA.17 On the same day, the commission left itself a more flex-ible standard for preliminary drafts: as little deviation as possible, but up to ±5 percent deviation from the ide-al, with an explanation of any deviation over 2 percent. On May 27, the commission revised its standards with respect to preliminary drafts: as little deviation as pos-sible for the preliminary drafts, up to a total of 5 percent deviation. However, the same day, it adopted a much more restrictive standard for the final maps: no more than 1 percent total deviation, including districts drawn for purposes of the VRA. On June 16, it asked Q2 to flag deviations over 1 percent that would aid compli-ance with the VRA. But two weeks later, it rejected the attempt to effectuate any deviation over 1 percent total. Finally, on July 3, the commission approved a standard permitting a total deviation of no more than 2 percent, with greater deviation permitted where required to comply with the VRA.
Technically, this final standard should in no way have impaired compliance with the VRA, because exceptions to the restrictive general standard are expressly authorized where the VRA makes the excep-tions necessary. However, for the entire critical drafting
17Commission Meeting, April 28, 2011, transcript.
period of June, the commission operated under a dif-ferent standard: no more than 1 percent total deviation, VRA obligation or not. Commissioners communicated this standard firmly to the mapping consultants. And despite the commission’s belated request to flag dis-tricts for which greater population deviations would aid compliance with the VRA, it is not clear that any such deviations were identified. (It is, of course, possible that no such configurations existed.)
Conclusions The commission’s work begins with the commissioners. The commissioners were adept at technical and legal analysis and were savvy consumers of technical and legal advice, with the will and ability to push back when appropriate. They also benefitted from having several individuals among them with experience and expertise in applying the VRA to redistricting problems.
Despite the problems associated with late training and the lack of timely data, the commission effectively pursued a process that gave appropriate attention to the VRA. Although the courts are the ultimate arbiters regarding whether the final maps were in legal compli-ance, the evidence of the commission’s work and the lack of successful legal challenges suggests that the commission was successful.
The late arrival of electoral data, and the limited analysis of that data due to its late assembly, became significant impediments. In addition to data present-ly collected by the Statewide Database, a designated organization or team should collect the data needed for a full racially polarized voting analysis well before the commission assembles.
At the very least, substantial portions of the data collection can be completed in the years before the commission takes office. Because of its significant research potential, this project might attract outside support from private foundations and other agencies that support demographic and electoral study.
Many of the process concerns above come back to extreme time pressure. Some of that pressure can be alle-viated if a body prepares logistically for the commission before it forms, so that commissioners need not build an agency from the ground up once they are appointed.
Many of the process concerns above
come back to extreme time pressure.

62 League of Women Voters of California When the People Draw the Lines
ChAPtEr 6
The Voting Rights Act
There are also other means to save time. A first effort to gather citizen input concerning COIs can be moved earlier in the process. Data can be collected and analyzed earlier. Commissioners can also begin drawing tentative districts eligible for VRA protection earlier, using estimated data released by the census for the prior year. As a result of the imprecision of these estimates, districts built upon them will have to be revised; however, commissioners can develop familiar-ity with the trickiest issues by using preliminary data to flesh out options. Doing so carries the risk that com-missioners will become attached to configurations that will have to change once better data arrives. But with constant reminders about the tentative status of the initial options, this “practice” should help reveal diffi-culties that this commission discovered only belatedly, as well as tradeoffs that this commission never had the chance to consider fully in the pressure of late July.
VRA training was on this commission’s wish list for months before it was carried out. Future commissions should ensure that they receive such training much earlier. Moreover, future commissions should ask for a step-by-step recommendation for how they should go about redistricting, including incremental data to be gathered, decisions to be made, and the realistic dura-tion of each step along the way. Many groups around the state have experience drawing legally compliant dis-tricts—and, of course, this commission could now itself produce an enormously helpful step-by-step guide.
This commission was wise to begin in areas with substantial minority populations, out of concern for VRA compliance. And it is reasonable to begin in those areas by testing to see whether race-neutral principles provide political opportunity for minority groups—as long as there is a firm, shared commitment to override those race-neutral principles if it becomes clear that the VRA requires such action. Districts must be drawn and reviewed for VRA compliance early, before the formu-lation of adjacent districts and well before the release of any districts as drafts to the public.
Assuming no change in the California Constitution, future commissions should adopt this commission’s final approach to population disparity in regard to the VRA. That does not mean adopting the same final deviations in the districts produced; rather, it means having the same commitment to looking beyond any
artificial threshold in order to ensure compliance with the VRA. Future commissions must be sure to care-fully investigate deviations beyond the norm, in order to make sure that an artificial threshold does not fore-close avenues of compliance not otherwise apparent in an unduly restrictive regime.
63When the People Draw the Lines League of Women Voters of California
ChAPtEr 7
Timeline and Budget
The bulk of the redistricting calendar and a major share of the budget went toward the selection process. The recommendations in this report suggest a different timeline for the next iteration of citizens redistricting. The process should begin earlier and there should be considerably more attention and budget devoted to preparing the commission for its task of deliberation. Though the overall budget for the 2010–12 redistricting was reason-able, adjustments should be made to increase resources for commission outreach and for preparation of the commission. Less money and time are needed to recruit applicants for commission positions.
Phot
o C
ourte
sy o
f CA
Com
mon
Cau
se

64 League of Women Voters of California When the People Draw the Lines
ChAPtEr 7
Timeline and Budget
timeline
The commission process devoted considerably more attention to the selection of commissioners than to the preparation and deliberations of the commission. As a result, commissioners felt compelled to take a greater role in the operations of the commission than they might otherwise have done.
The timeline for the first iteration devoted the most calendar time to selection of commissioners. The BSA began its efforts on commissioner selection in January 2009, and the first commissioners were seat-ed in December 2010. The first ten months of that nearly two-year period involved the development of regulations for the selection process. The Secretary of State’s office entered the picture in the spring of 2010, but its public work in helping the commission get off the ground organizationally occupied less than two months. The commission’s core deliberations occupied eight months, substantially less than half the time spent on commissioner selection.
This report proposes a timeline for the next com-mission that reduces the time devoted to commissioner selection, increases the time allocated to commission preparation, allows for the collection of data on COIs separate from public hearings, and extends the commis-sion’s deliberation period. The next commission should have more time to do its work,1 with the commission in place at least five months earlier in the process than was the 2011 commission. The proposed timeline divides the phases nearly evenly and allows more time for the commission’s deliberations.
Budget Priorities
Proposition 11 required the state of California to pro-vide funds for the citizen redistricting process “sufficient to meet the estimated expenses…in implementing the redistricting process required by this act for a three-year period, including, but not limited to, adequate funding for a statewide outreach program to solicit broad public participation in the redistricting process.”
1This report concurs with the commission’s recommendation for an additional six months for its deliberations, an extension that the legis-lature shortened to four and a half months. Even the approved exten-sion will be a major help.
Components by Phase Percent of state funding
Selection of Commissioners 4,028,726 38.6Transition Process to Commission
125,000 1.2
Commission Cost (Deliberation)
2,966,274 28.4
Commission Cost (Post-deliberation)†
3,329,728 31.9‡
Total State Funding 10,449,728selected Commission Cost itemsLine Drawers (Q2) 592,466Legal
Gibson Dunn & Crutcher 1,098,697Morrison & Foerster§ 705,394Meeting Costs 307,712Commissioner Compensation
718,200
Commissioner Travel 264,176
tABlE 8: Proposed timeline Breakdown for 2021 redistricting Process
monthsSelection of Commissioners 12Preparation of Commission 13Commission Deliberations* 13Post-mapping Wind-down 12Totals 50
*From seating of the commission in August 2020 until completion of the final maps in August 2021.
*See http://wedrawthelines.ca.gov/downloads/meeting_handouts_062 012/handouts_20120607_crc_finalcosts_draft.pdf, accessed August 25, 2012.**This amount includes the grants listed in the report along with two grants to UC Berkeley to prepare memoranda to inform the commis-sion on VRA matters.†This amount includes litigation costs.‡Percentages do not add up to 100 percent due to rounding.§Morrison & Foerster was brought in by the commission to work with Gibson Dunn & Crutcher on the litigation.
declaration of Cost Estimates by the Commission*State Funding $10,449,728The James Irvine Foundation 3,466,560**
tABlE 9. Budget for redistricting Process
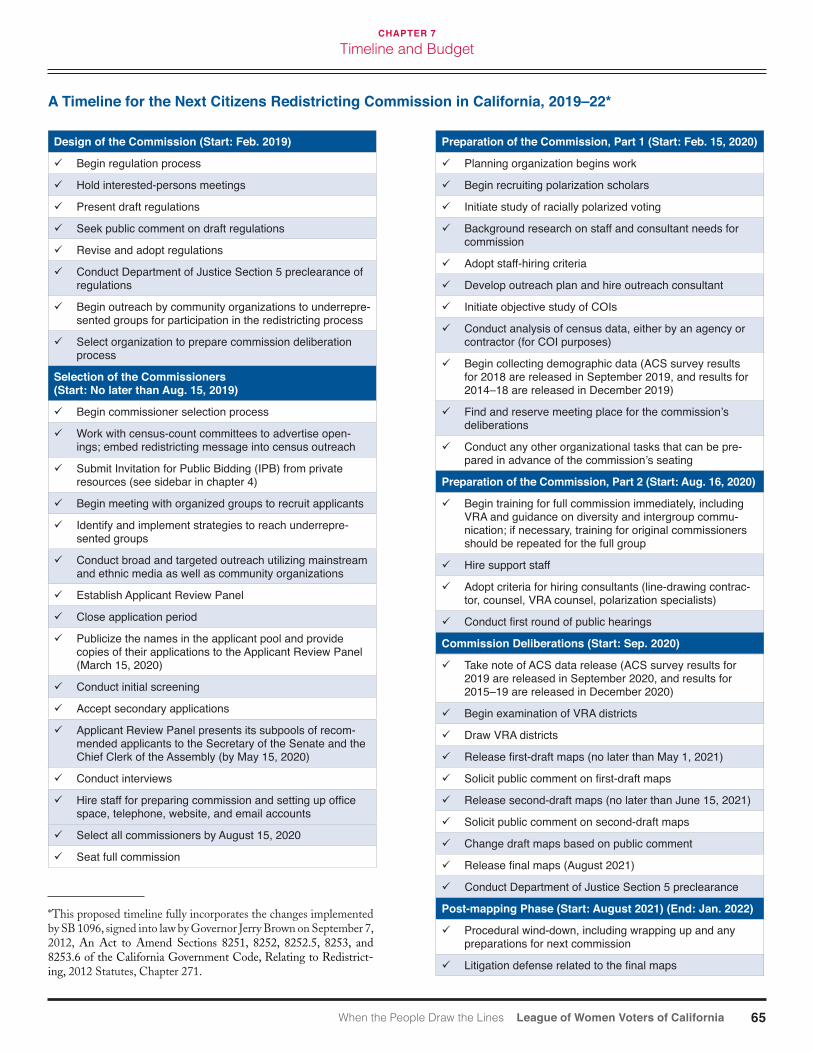
65When the People Draw the Lines League of Women Voters of California
ChAPtEr 7
Timeline and Budget
design of the Commission (start: feb. 2019)
Begin regulation process
Hold interested-persons meetings
Present draft regulations
Seek public comment on draft regulations
Revise and adopt regulations
Conduct Department of Justice Section 5 preclearance of regulations
Begin outreach by community organizations to underrepre-sented groups for participation in the redistricting process
Select organization to prepare commission deliberation process
selection of the Commissioners (start: no later than Aug. 15, 2019)
Begin commissioner selection process
Work with census-count committees to advertise open-ings; embed redistricting message into census outreach
Submit Invitation for Public Bidding (IPB) from private resources (see sidebar in chapter 4)
Begin meeting with organized groups to recruit applicants
Identify and implement strategies to reach underrepre-sented groups
Conduct broad and targeted outreach utilizing mainstream and ethnic media as well as community organizations
Establish Applicant Review Panel
Close application period
Publicize the names in the applicant pool and provide copies of their applications to the Applicant Review Panel (March 15, 2020)
Conduct initial screening
Accept secondary applications
Applicant Review Panel presents its subpools of recom-mended applicants to the Secretary of the Senate and the Chief Clerk of the Assembly (by May 15, 2020)
Conduct interviews
Hire staff for preparing commission and setting up office space, telephone, website, and email accounts
Select all commissioners by August 15, 2020
Seat full commission
Preparation of the Commission, Part 1 (start: feb. 15, 2020)
Planning organization begins work
Begin recruiting polarization scholars
Initiate study of racially polarized voting
Background research on staff and consultant needs for commission
Adopt staff-hiring criteria
Develop outreach plan and hire outreach consultant
Initiate objective study of COIs
Conduct analysis of census data, either by an agency or contractor (for COI purposes)
Begin collecting demographic data (ACS survey results for 2018 are released in September 2019, and results for 2014–18 are released in December 2019)
Find and reserve meeting place for the commission’s deliberations
Conduct any other organizational tasks that can be pre-pared in advance of the commission’s seating
Preparation of the Commission, Part 2 (start: Aug. 16, 2020)
Begin training for full commission immediately, including VRA and guidance on diversity and intergroup commu-nication; if necessary, training for original commissioners should be repeated for the full group
Hire support staff
Adopt criteria for hiring consultants (line-drawing contrac-tor, counsel, VRA counsel, polarization specialists)
Conduct first round of public hearings
Commission deliberations (start: sep. 2020)
Take note of ACS data release (ACS survey results for 2019 are released in September 2020, and results for 2015–19 are released in December 2020)
Begin examination of VRA districts
Draw VRA districts
Release first-draft maps (no later than May 1, 2021)
Solicit public comment on first-draft maps
Release second-draft maps (no later than June 15, 2021)
Solicit public comment on second-draft maps
Change draft maps based on public comment
Release final maps (August 2021)
Conduct Department of Justice Section 5 preclearance
Post-mapping Phase (start: August 2021) (End: Jan. 2022)
Procedural wind-down, including wrapping up and any preparations for next commission
Litigation defense related to the final maps
A timeline for the next Citizens redistricting Commission in California, 2019–22*
*This proposed timeline fully incorporates the changes implemented by SB 1096, signed into law by Governor Jerry Brown on September 7, 2012, An Act to Amend Sections 8251, 8252, 8252.5, 8253, and 8253.6 of the California Government Code, Relating to Redistrict-ing, 2012 Statutes, Chapter 271.

66 League of Women Voters of California When the People Draw the Lines
ChAPtEr 7
Timeline and Budget
Section 8253.6 of the state constitution (as amend-ed by Prop 11) requires that the appropriation must be equal to or larger than two baseline amounts: $3 million “or the amount expended…in the immediately preced-ing redistricting process…adjusted by the cumulative change in the California Consumer Price Index.” The budget estimate of $3 million proved far too low, espe-cially once the voters added congressional redistricting to the commission’s charge. The number had been cho-sen to match the Legislative Analyst’s estimate of costs for the unsuccessful 2005 redistricting ballot measure.2
The law mandates that the budget level for the subsequent redistricting be built on the foundation of actual expenditures on the previous round. In order to ascertain the projected amount for the next round of redistricting, the cost of the 2011 model provides a baseline. Thus there are serious budget implications to any assessment of the real cost of the 2011 process.
Upon completion of its work, the commission determined that the state’s final cost for the redistrict-ing process had been more than $10 million. The state government largely provided the funds required to com-plete the commission’s work, based on a series of budget requests put together by the commission staff. The com-mission noted that The James Irvine Foundation sup-port for outreach amounted to more than $3 million.3
A comparison to Arizona’s citizen redistricting process suggests that the overall budget of the Cali-fornia process was reasonable, although this report suggests that the priorities within that budget should be changed for the next iteration.
In Arizona, the Independent Redistricting Com-mission (IRC) was formed following the passage of a ballot measure (Prop 106) in 2000. The Arizona Con-stitution as amended by Prop 106 requires that “the legislature shall make the necessary appropriations by a majority vote” for redistricting expenses.4 The leg-islature appropriated $6 million for the commission
2Email communication from Kathay Feng.3Though the commission’s report indicates that the outreach work conducted by The James Irvine Foundation was “required by the Con-stitution,” this does not mean that the foundation had to perform it. It does suggest that the budgets for future commissions should include some of the functions mentioned in the constitution that the founda-tion performed.4Arizona Fiscal Year 2012 Appropriations Report, p. 136, http://www.azleg.gov/jlbc/12app/irc.pdf.
in fiscal year 2001. The commission then received an additional $4,203,000 from the general fund in fiscal year 2004 to cover the costs of ten years of litigation.5 The total appropriation was $10,203,000.6 The IRC spent slowly in its first year and then accelerated. Its heaviest expenditures came in fiscal years 2002–4. Over the course of its nine-year cycle, the commission spent $9,554,100. Spending for California’s and Arizona’s redistricting was comparable, but given California’s significantly larger size, the cost was far lower when measured as cost per congressional district.
For the 2011 Arizona redistricting process, the state provided somewhat less funding than the preced-ing round had received. For fiscal year 2011, the state included only $500,000 in the budget, considering that the first year would have less activity than the previous cycle. For fiscal year 2012, a sum of $3,000,000 was authorized.7 Partisan conflict over redistricting was sub-stantially greater in 2011 than in the 2001 redistricting
5Ibid., p. 215.6Information on the Arizona redistricting budget was generously pro-vided by Raymond F. Blandine, Commission Executive Director, and Kristina Gomez, Deputy Executive Director.7Arizona Fiscal Year 2012 Appropriations Report, p. 136.
tABlE 10. spending on first-time independent Commissions in California and Arizona
California (2009–12)
Arizona (2001–10)
Government $10,449,728 $10,203,000 (authorized)
Private (The James Irvine Foundation)*
$3,466,560 no private funding
Total $13,763,053 $9,554,100 (spent)
Population (2010) 37,253,956 6,392,017Congressional Seats (2012)
53 9
Spending Per Congressio-nal Seat (public)
$152,953 $1,061,567
*The James Irvine Foundation made grants totaling $3,548,325 regarding redistricting. Of this amount, $388,325 was for research and evaluation regarding redistricting. For this study, I have sub-tracted the latter amount because it was not for duties related to the operation of the commission. The majority of the funds were to supplement the outreach program of the BSA and the commission, obligations included in Prop 11.

67When the People Draw the Lines League of Women Voters of California
ChAPtEr 7
Timeline and Budget
cycle. Disputes arose over the funding of the commis-sion, and money had to be allocated for legal defense against lawsuits by the state attorney general regarding open-meeting laws. In March 2012, the Arizona com-mission threatened to take legal action against the state if it did not provide the funding required to defend the commission against challenges to its chairperson by the governor and the legislature.8
The composition of expenditures differed between the two states. For example, Arizona provided no com-pensation for commissioners other than reimbursement for direct expenses. For the second iteration in Arizona, the line-drawing contract was larger than that allocat-ed to Q2 in California, despite the much-larger scope of the mapping process in California. Arizona’s line-drawing firm, Strategic Telemetry, received $682,450 for work in a one-year period from July 2011 through June 2012. Since commissioners were appointed in Arizona from a list of nominees, rather than through the extensive process of vetting as in California, the front-end costs of selecting commissioners were some-what lower.
Preparing the Next Round’s Budget
The 2011 California redistricting process had to be invented from scratch; budget decisions were made in light of the requirements of Prop 11 and the extreme press of time on the commission itself. With the ben-efits of hindsight and foresight, planners can realign some expenditures for the next iteration. Though the state constitution now sets the level of state support as equal to that of the previous redistricting, adjusted by the cost of living, the next California commission will certainly need a careful justification of all expenditures.
The 2011 commission proposed that the next round of redistricting budget for the four and a half addition-al months that the legislature granted in response to the commission request for an extra six months. The commission estimated that this extra time would cost
8Christopher Conover, “Senate Gives Redistricting Commission One Dollar,” Arizona Public Media, March 7, 2012, https://www.azpm.org/p/indepth/2012/3/7/93-senate-gives-redistricting-commission-one-dollar/.
$1,017,103.9 A careful examination of the needs of the next commission may lead to adjustments in that esti-mate if the scope of work is spread out over a longer period of time.
Because the State Auditor already has regulations in place, less time and expense should be devoted to the selection process. A BSA contract for a general outreach effort for commissioner selection is not neces-sary. The language of Prop 11 seems to suggest that the outreach priority should be with the commission itself: “adequate funding for a statewide outreach program to solicit broad public participation in the redistricting pro-cess” (emphasis added).
The next time around, organized groups are likely to generate a great deal of the publicity, encouraging people to apply for commissioner positions. In addition, with time to plan in advance, the state can publicize the availability of positions through voting materials sent to all registered voters in scheduled elections. The out-reach conducted by the U.S. Census may be helpful as well. In this way, some funds can be reserved for the commission’s own outreach and to replace some of The James Irvine Foundation funds dedicated to the 2011 process.
More money should be allocated to obtaining data that can assist the commission, including data on COIs and polarized voting analyses.
The commissioners arguably worked nearly full time from February through August. A better-orga-nized deliberation process, with greater use of staff, might require fewer commissioner meetings, especially of committees, and less involvement by commissioners in administrative matters. The same level of commis-sioner compensation spread over ten years would allow the commissioners to assist the next citizen body with-out suffering undue financial hardship.
Commissioner travel costs can be reduced by con-ducting hearings differently, for example, by using distance technology and not requiring all commis-sioners to attend all hearings. (Arizona used a similar model of commissioner division of labor.)10 This plan might also reduce the overall cost of public meetings.
9See http://wedrawthelines.ca.gov/downloads/meeting_handouts_062 012/handouts_20120607_crc_finalcosts_draft.pdf, accessed August 25, 2012. 10Interview with Jennifer Steen, Arizona State University.

68 League of Women Voters of California When the People Draw the Lines
ChAPtEr 7
Timeline and Budget
Clearly there are difficulties with this approach if it reduces the ability of the commission to maintain close contact with the public. However, new technologies are likely to help bridge the gap between commissioners and the public.
Conclusions
Time pressure was a key issue in the 2011 redistricting process. Too much time went to the commissioner-selection process. In the next round, more time should be devoted to preparing the commission for their delib-erations and to the deliberation process itself. Because the first commission established certain aspects of the process, and the BSA now has regulations for commis-sioner selection in place, this should not be difficult to implement.
Likewise, less of the budget, especially for outreach, should be devoted to recruiting and selection of com-missioners, and more should go to the commission’s work.
Though the 2011 commission cost far more than the initial $3 million assessment, comparison with Arizona’s redistricting process suggests that commis-sion costs were reasonable. Addressing the types of staffing issues cited earlier in this report, and relying more on technology, might reduce the number of meet-ings needed and the travel required for commissioners, thereby bringing certain costs down.

69When the People Draw the Lines League of Women Voters of California
ChAPtEr 8
Assessments and Looking to the Future
The California citizen redistricting process was largely successful in meeting the man-dated goals of a nonpartisan and transparent process, with a level of incumbent influence that was considerably lower than in previous redistricting efforts. The final maps survived legal challenge, and the commission’s work was regarded positively by a majority of the voters. In 2012, the first test of the commission’s maps provided evidence that the new district lines caused significant turnover in elected offices. However, to succeed in the next iteration, the commission will have to have more time, be better supported and orga-nized, and obtain access to a wider range of demographic and economic data.
Cal
iforn
ia C
itize
ns R
edis
trict
ing
Com
mis
sion

70 League of Women Voters of California When the People Draw the Lines
ChAPtEr 8
Assessments and Looking to the Future
Overall, the California citizen redistricting process was a success. Although there were flaws in the design and execution of the plan, future efforts can build on the foundation it created and implemented. Those who developed the new redistricting program first won an uphill election and then saw their program imple-mented. They had devoted great attention to detailing how commissioners were selected, and the care paid off. The process of selecting commissioners was conducted in public view, with clear guidelines and with careful direction from the State Auditor. The decision to lodge the selection process in the hands of a nonpartisan office somewhat shielded from political control turned out to be wise one. An aggressive campaign, both by the audi-tor and by outside organizations, led more than 30,000 Californians to apply to become commissioners.
Detailed criteria reduced some of the potential for conflicts of interest within the commissioner pool. Incumbent elected officials had little influence over the selection of commissioners, except for the ability to eliminate names near the end of the process. The “striking” provision was a useful tool to make certain that problematic commissioners did not make it past the BSA’s filters.
The selected commissioners were a diverse group, some with extensive experience in public life and oth-ers new to such challenges. There were problems in dividing the selection process into two phases, one to select the first eight and one to allow the first group to choose the last six. The commission’s formation in two separate parts added to the time required to cre-ate a cohesive group and VRA training was truncated between the two sets of commissioners. But when they came together for their first formal meetings in January 2011, the commissioners were enthusiastic and ener-getic about the task ahead.
Although the commissioners believed strongly in public input, they were surprised and at times over-whelmed by the volume of public comment that they received. Attendance at public hearings was greater than expected, and the massive amount of email they received represented a challenge for each commissioner.
Despite a calendar that was highly unrealistic given the scope of the task, the commission completed its work on time, issuing a first set of draft maps on June 10 and its final maps by the mandated date of August 15, 2011.
The work of the commission earned majority votes from all three required groups of commissioners: Dem-ocrats, Republicans, and those not aligned with either major party. The commission was required by law to have votes on substantive matters with separate majori-ties of the five Republicans, the five Democrats, and the four nonaligned commissioners. Two Republican com-missioners voted against all or part of the final product. Republican Commissioner Michael Ward voted no on all the maps, indicating that his objections were to a process he considered partisan and insufficiently transparent. He indicated, however, that he opposed a subsequent ballot measure sponsored by Republican activists seeking to invalidate the state senate maps. Another Republican commissioner, Jodie Filkins Web-ber, voted against only the congressional maps.
The maps survived strenuous legal challenges in state and federal courts with no adverse judicial deci-sions. In a unanimous 7–0 decision upholding the state senate maps, the California Supreme Court noted, “Not only do the Commission-certified Senate districts appear to comply with all of the constitutionally-man-dated criteria set forth in California Constitution, article XXI, the Commission-certified Senate districts also are a product of what generally appears to have been an open, transparent and nonpartisan redistricting process as called for by the current provisions of article XXI.”1 The United States District Court also dismissed a legal challenge to the commission’s maps.
Voters responded positively to the work of the com-mission. The Field Organization tested public opinion
1Vandermost, 53 Cal. 4th 421, 484 (2012).
2 to 1Among voters familiar with the commission’s work, approval outweighed disapproval by nearly 2 to 1.
notEWorthY

71When the People Draw the Lines League of Women Voters of California
ChAPtEr 8
Assessments and Looking to the Future
on a measure targeted for the November 2012 ballot to overturn the state senate maps. One-third of Califor-nia’s voters were familiar with the commission’s work, and of those who were aware, approval outweighed disapproval by nearly 2 to 1. Among all voters, only 29 percent supported overturning the state-senate lines drawn by the commission.2
The commission’s open process was a significant improvement over previous California redistricting efforts, which were dominated by insiders and opaque to the public. In a comparative study of transparency of state governing processes in which the state received a B- overall, the citizen redistricting process received an A, with a score of 100 percent.3
This study mainly focuses on the process of design-ing and implementing the redistricting commission. Others have explored the mapping process in greater detail, comparing the results to the criteria embod-ied in the state constitution by Props 11 and 20. Two independent studies conducted for this report4 demon-strated that the commission was effective in following accepted techniques and processes in mapping (see chapter 5) and in following a decision-making process that generally met accepted standards for address-ing VRA issues (see chapter 6). A study conducted by Nicholas Stephanopoulus found that the final maps generally respected COIs.5
Vladimir Kogan and Eric McGhee concluded that the commission achieved the main substantive goals of Prop 11.6 Specifically, they determined that the com-mission had made a significant improvement over the 2001 redistricting plan according to Prop 11’s criteria. Furthermore, they found important improvements between the June 10 and August maps, in areas such as minority access to representation. Kogan and McGhee also found that “the 2011 commission plans represented a modest improvement on the 2001 legislative redis-tricting in terms of preserving the integrity of existing
2Field Poll, Release #2389, September 22, 2011.3Center for Public Integrity, accessed August 25, 2012, http://www.stateintegrity.org/california_survey_redistricting. 4Conducted by Mark Drayse and Justin Levitt, respectively.5Nicholas O. Stephanopoulos, “Communities and the Commission,” Stanford Law and Policy Review 23 (2012): 19.6Vladimir Kogan and Eric McGhee, “Redistricting California: An Evaluation of the Citizens Commission’s Final Plans,” California Jour-nal of Politics and Policy 4 (2012): 35–36.
communities.” The commission drew more compact districts than had the legislature ten years before. The commission reached a nearly perfect level of nesting in its June maps, but adjustments to achieve other man-dated goals reduced nesting somewhat; nevertheless, it remained at a higher level than in 2001.
the 2012 Elections and Citizen redistricting
In 2012, the work of the commission received a signifi-cant, real-world test, with primary and general elections for Congress and for the state legislature. The simul-taneous presence of a second reform—the top-two primary—complicates assessments of the indepen-dent impact of the citizen redistricting process.7 A study commissioned by the Public Policy Institute of California (PPIC) examined the impact of both elec-toral reforms.8 Though the top-two primary created the most remarkable changes, the authors concluded that “the new districts also altered the electoral land-scape, leading many incumbents to pass on reelection, forcing others to introduce themselves to unfamil-iar voters, and increasing the number of competitive races overall.” When a redistricting process is not built around the electoral interests of incumbents, the pos-sibility of competitive races increases simply because incumbency reduces competition: “The state now has 38 new assemblymembers, 9 new state senators, and 14 new members of Congress.”9
Overall, the citizen redistricting achieved a goal that was not in the law itself but that was consistent with its spirit: shaking up the incumbent-centered world of California politics. Though Democrats scored big wins in the November elections, the road was tougher for incumbents of both parties. Some incumbents chose not to run for reelection under the new district lines
7The top-two primary system, adopted by California voters in 2010, replaced the traditional party primaries with open primaries. The top two candidates were to face off in the general election, even if they were of the same party and even if one candidate received a majority of all votes cast in the primary election.8Eric McGhee and Daniel Krimm, California’s New Electoral Reforms: The Fall Election (Public Policy Institute of California, 2012).9Ibid.

72 League of Women Voters of California When the People Draw the Lines
ChAPtEr 8
Assessments and Looking to the Future
or were forced to run in districts where their political bases were considerably weaker.
Democratic Congressman Henry Waxman faced reelection in an altered district that was less Democrat-ic, and he ended up with one of the toughest battles of his career.
Another Democratic Congressman, Howard Ber-man, the leader of past Democratic redistricting efforts in California, was forced into a largely unfamiliar district in which he lost by a large margin to his Demo-cratic colleague Brad Sherman.
A study by the Brennan Center for Justice found that the California maps reduced safe congressional seats by nine. The study noted that Elton Gallegy, a Repub-lican member of Congress, retired rather than run in a district that moved from formerly Republican to Demo-cratic. In a neighboring district formerly considered safe, Democrat Lois Capps found herself in a competitive race against a Republican, Abel Maldonado.10
Among other changes, the new maps created the state’s first Asian American majority electoral district, the 49th assembly district in the West San Gabriel Valley.
In December, 2011, the New York–based inves-tigative organization ProPublica released a report11 charging that California’s congressional Democrats had formed a secret working group of members and con-sultants that managed to subvert the process in order to keep their incumbents safe. Though ProPublica has a reputation for sound investigative journalism, there were significant problems with its redistricting report. Among these were errors of fact suggesting that the authors were not well informed about the commission, including the report’s assertion (corrected in a later ver-sion) that the commissioners worked without pay and the uncorrected comment that the commission held no
10Sundeep Iyer and Keesha Gaskins, Redistricting and Congressional Control: A First Look (Brennan Center for Justice, New York University School of Law, 2012).11Olga Pierce and Jeff Larson, “How Democrats Fooled California’s Redistricting Commission,” December 21, 2011, accessed September 3, 2012, http://www.propublica.org/article/how-democrats-fooled-californias-redistricting-commission. See also Olga Pierce et al., “An-swering Your Questions on Our California Redistricting Story,” De-cember 23, 2011, accessed September 3, 2012, http://www.propublica.org/article/answering-your-questions-on-our-california-redistricting-story.
public hearings after the release of the June 10 maps.12
Although the authors made a strong case that con-gressional Democrats tried to influence the process, the report presented less compelling evidence that congressional Democrats as a whole had successfully influenced the commission. Undoubtedly, there were some Democrats and some Republicans who managed to win advantages in the process by using “stand-ins” purporting to represent community sentiment but who in reality acted to protect their political interests. But the authors of the widely circulated article ignored substantial evidence that broader demographic and electoral trends explained much of the Democratic suc-cess in the 2012 elections.
An analysis of partisan outcomes suggested that Democrats did indeed make improvements in their posi-tion in congressional seats that were greater than those they gained in the assembly and senate.13 However, the same study argued that the reason for this difference was that in 2001 the incumbent-protection plan disad-vantaged Democratic prospects in congressional races in order to protect incumbents to a much greater degree than in assembly and senate races. The 2011 congres-sional maps were considerably more competitive than in 2001 but in a manner that allowed Democratic gains based on growth in populations favorable to Democrats to be more useful to party candidates.
looking to the future
Though California’s first effort at citizen-led redistrict-ing followed a process that was at times rough around the edges, it more than met the Voters First Act’s goals of transparency and fairness. Those who designed the
12Online responses by the authors to questions raised by the public about the report revealed other problems. In one follow-up response, the authors suggested that the commission had favored one Democrat-ic congressman, Brad Sherman, over another, Howard Berman, be-cause Sherman had hired a firm associated with a Democratic political consultant. The problem with this interpretation is that virtually the entire Democratic congressional delegation had endorsed Berman over Sherman. If the Democratic congressional delegation were gaming the system for an ally, it would have been for Berman, not Sherman. While Sherman might well have worked hard and successfully to get the best possible district for himself, this would not have been the preferred outcome for the bulk of the Democratic delegation.13Kogan and McGhee, “Redistricting California,” 35–36.

73When the People Draw the Lines League of Women Voters of California
ChAPtEr 8
Assessments and Looking to the Future
citizen redistricting process were real pioneers, both in winning an electoral victory that had eluded previ-ous reform efforts and in creating and monitoring the process their campaign had created. Citizens seeking to adopt similar reforms in their states or communi-ties would be well served to learn from this experience, from what worked and from what needs improvement.
The commission received the benefit of the doubt as a rookie operation with a widely popular goal of enhancing citizen control over a redistricting process long dominated by elected officials. The commission’s massive outreach demonstrated a remarkable appetite for public comment. Its sincere pursuit of transparency, though not always perfect, earned it more leeway with the public.
But in ten years, the citizen redistricting process will not benefit from first-time status. Its work will be more carefully watched and criticized. Political forces that were baffled, angered, quietly involved, or gen-erally thrown on the defensive will be much better prepared to exercise influence. Even with its flaws, the ProPublica report highlighted what might be a more realistic fear for the next redistricting: that one or both major political parties or leading politicians in either party may find ways to bend the commission to its will.
There is reason for concern about the next round. In Arizona, the first citizen redistricting proceeded in relative peace. Lawsuits were filed and fought, but the process stayed relatively free of political pyrotech-nics. The second iteration in 2011 proved far more contentious. When the commission hired a mapping-consulting firm, the state attorney general sued on the grounds that the commission had violated open-meet-ing laws. The tie-breaking chairperson was impeached by the legislature and then reinstated by a state court.14
In Los Angeles, a new city charter in 1999 created an advisory citizen commission for the city’s redistrict-ing. Whereas it had a calm first run in 2001, its tenure a decade later was marked by allegations of political interference from key political leaders and by serious
14According to Bruce Cain, “Entering the 2011 redistricting, there were two possibilities: that the AIRC would build on its reasonable success in 2001, or that with experience and knowledge of the process under their belt, the parties and political players would game the sys-tem more effectively. The answer, unfortunately, turned out to be the latter”; Cain, “Redistricting Commissions,” 125.
community conflict over how the lines were drawn.15
Reforms to enhance citizen power over redistrict-ing will confront a more organized environment the second time around. Interest groups will have an incen-tive to become involved early and often. Organized public input is likely to be far more sophisticated and widespread. Gamesmanship and artful lobbying among candidates, the political parties, interest groups, and others are likely to mark the next round. The political parties will have plenty of time to plan. This shift will have to be anticipated, recognized, and built into the process.
There will likely be much greater interest in who becomes a commissioner, not just as a type of lottery for individuals but as a proxy for groups. With the impor-tance of COIs, cities and counties will want to ensure that they have a sympathetic voice on the commission. The original design of the commission assumed that commissioners would be independent, even as mem-bers of a political party. If either or both major political parties groom successful candidates for commission positions, they could create a voting faction on the commission. Either major party may succeed in creat-ing a blocking minority of three votes that could hold substantive decisions hostage.
To successfully confront what will likely be a more sophisticated, better prepared, and more organized set of interested parties, the commission will need to be equally prepared and organized. There will be something lost as well as gained in this transition. The first commission had a pioneering spirit, as the commissioners essen-
15David Zahniser, “Wesson Denies Newly Drawn Council Districts Are Payback,” Los Angeles Times, Feb. 17, 2012, http://articles.latimes.com/2012/feb/17/local/la-me-city-redistricting-20120217.
Those who designed the citizen redistricting
process were real pioneers.

74 League of Women Voters of California When the People Draw the Lines
ChAPtEr 8
Assessments and Looking to the Future
tially invented their paths to final maps by creating an agency from scratch. The strong personal bond among the commissioners and their high level of morale in tough circumstances will not easily be reproduced the next time. But though the experience will be different for the next group, it can be equally successful if it is built on sound planning and careful execution. The next commission will be less freewheeling and more structured. But it will also be better able to anticipate and interpret the myriad political and organizational challenges thrown its way.
Protection against political interference in the next cycle will require a data-driven, professional, well-managed process that moves in a stepwise manner from selection of commissioners, to training and planning, to public hearings, to drawing of maps, and, finally, to adjustments of maps.
No matter how well armed a citizens commission is with “objective” data, however, redistricting has many subjective elements open to partisan or ideological dis-agreement. Nothing in redistricting is free of these debates, from the interpretation of the VRA to the val-ue of keeping municipal and county boundaries intact. If the next commissioners know that every decision—from hiring staff and consultants to choosing where and how to run meetings—may activate such political disagreements, they will be prepared not to eliminate all political differences but to reduce the undue influ-ence of incumbency in redistricting and the appearance of bias in the process.
In order for Californians to view citizen redistrict-ing as an effective mechanism, the process will need to prove itself again after the 2020 Census. Commission-ers will need to maintain independence and ownership but simultaneously draw from a stronger base of profes-sional support. The designers of the citizen redistricting process assumed that a long and careful search would result in the selection of independent commission-ers free of the influence of incumbent politicians or political parties. In large part, the outcome of this first citizen redistricting process validated this assumption. However, this faith will not suffice for a long-term, institutionalized model of citizen redistricting.
Compare this to the design of a citizen jury. A network of institutional forces assists and guides the jurors so that they can devote their attention to hear-
ing the evidence and deliberating toward a verdict. No such luxury awaited California’s first crop of redistrict-ing commissioners. Upon their arrival, commissioners found little in place to guide their work. The eight commissioners selected by random draw had to choose the next six. They also had to select an executive direc-tor, VRA counsel, and a line-drawing consultant.
Decisions had already been made before they took office that constrained their choices. And the time-line was witheringly tight, as the full commission took office on January 12, 2011, and final maps were due on August 15, 2011. (The designers of Prop 11 had given them until September, but Prop 20, passed in 2010, tightened the deadline to August.) Highly motivated commissioners, staff, and consultants worked over-time to make the process work. They made mistakes and then fixed them, fell behind and then caught up by dint of extra hours and goodwill. Without significant correction to these aspects of the process, the citizen redistricting model will be in trouble in ten years.
The citizen redistricting process delivered much more than might have been expected from a group of civic activists contending at the ballot and amateur citizens with a short timeline, a limited budget, and insufficient training. At times, the process seemed in serious trouble; and yet, at the end of the day, the com-mission largely succeeded in its mandated goals. The lessons of their experience will need to be adapted for those who next accept the obligation to draw the lines.

75When the People Draw the Lines League of Women Voters of California
APPEndix 1
List of Interviewees
Gabino Aguirre, CommissionerAngelo Ancheta, CommissionerVincent Barabba, CommissionerMaria Blanco, CommissionerBruce Cain, University of California, BerkeleyChris Carson, League of Women Voters of CaliforniaDan Claypool, Commission Executive DirectorCynthia Dai, CommissionerMichelle R. DiGuilio, CommissionerKathay Feng, California Common CauseMargarita Fernandez, Bureau of State AuditsJodie Filkins Webber, CommissionerStanley Forbes, CommissionerConnie Galambos Malloy, CommissionerAstrid Garcia, National Association of
Latino Elected and Appointed OfficialsBonnie Glaser, Berkeley Law Center for
Research and Administration, UC Berkeley Rosalind Gold, National Association of
Latino Elected and Appointed OfficialsMarqueece Harris-Dawson, Community CoalitionCatherine Hazelton, The James Irvine FoundationAna Henderson, Warren Institute of Law
and Social Policy, UC Berkeley Deborah Howard, Consultant to California
Chamber of CommerceDeanna Kitamura, Asian Pacific American
Legal CouncilErica Teasley Linnick, African American
Redistricting Collaborative
Karin Mac Donald, Q2, Statewide DatabaseDora Mejia, Secretary of State’s OfficePaul Mitchell, Redistricting ConsultantSteven Ochoa, Mexican American Legal Defense
and Education FundLilbert “Gil” R. Ontai, CommissionerM. Andre Parvenu, CommissionerTony Quinn, CommentatorNancy Ramirez, Mexican American Legal Defense
and Education FundJeanne Raya, CommissionerSharon Reilly, Chief Legal Counsel,
Bureau of State AuditsMatt Rexroad, Redistricting ConsultantMichelle Romero, Greenlining InstituteSteven Russo, Chief Investigator,
Bureau of State AuditsTrudy Schafer, League of Women Voters of CaliforniaAdam Sonenshein, Los Angeles Universal PreschoolJennifer Steen, Arizona State UniversityTunua Thrash, West Angeles Community
Development Corporation and Greenlining Institute
Paul Turner, West Angeles Community Development Corporation and City of Los Angeles Ethics Commission
Michael Ward, CommissionerRob Wilcox, Commission Communications DirectorPeter Yao, Commissioner

76 League of Women Voters of California When the People Draw the Lines
APPEndix 2
Research Team Biographies
Author
raphael J. sonenshein, Ph.d., is the Executive Director of the Edmund G. “Pat” Brown Institute for Public Affairs at California State University, Los Angeles. Previously, he was Chair of the Division of Politics, Administration, and Justice at CSU Fuller-ton where he taught political science for 29 years. He received his B.A. in public policy from Princeton, and his M.A. and Ph.D. in political science from Yale. His book Politics in Black and White: Race and Power in Los Angeles (Princeton University Press, 1993) received the 1994 Ralph J. Bunche Award from the American Political Science Association as the best political sci-ence book of the year on ethnic and cultural pluralism.
Between 1997 and 1999, Dr. Sonenshein served as Executive Director of the City of Los Angeles (Appoint-ed) Charter Reform Commission. His book, The City at Stake: Secession, Reform, and the Battle for Los Angeles, was published in 2004 by Princeton University Press. He has since advised charter reforms in Glendale, Bur-bank, Culver City, and Huntington Beach, and served as Executive Director of the Los Angeles Neighbor-hood Council Review Commission. The League of Women Voters of Los Angeles published his third book, Los Angeles: Structure of a City Government, in 2006. He served for 18 months as a Fellow of the John Randolph Haynes and Dora Haynes Foundation.
At CSUF, Dr. Sonenshein was named Best Educa-tor by Associated Students and Distinguished Faculty Member by the School of Humanities and Social Sci-ences. In 2005, Dr. Sonenshein received a $20,000 Wang Family Excellence Award for statewide faculty. In 2006, he was named the first winner of the campus wide Carol Barnes Award for Teaching Excellence. He was one of two co-winners of $25,000 awards from the John Randolph Haynes and Dora Haynes Foundation
of the first and only Haynes Research Impact Awards. In 2012, Dr. Sonenshein received the Harry Scoville Award for Academic Excellence from the Southern California chapter of the American Society of Public Administrators.
He was selected as the fall 2008 Fulbright Toc-queville Distinguished Chair in American Studies at the University of Paris 8. His current research, with CSUF geographer Mark Drayse, supported by the Russell Sage Foundation, explores the prospects for African American-Latino coalitions in Los Angeles.
research Consultants
melina Abdullah, Ph.d. (community organizations and public access) is Acting Chair and Associate Pro-fessor of Pan-African Studies at California State University, Los Angeles. She earned her Ph.D. and M.A. from the University of Southern California in Political Science and her B.A. from Howard University in African American Studies.
Dr. Abdullah’s research focuses on power allocation and societal transformation. She has authored several articles and book chapters, including “The Emergence of a Black Feminist Leadership Model,” “Hip Hop as Political Expression,” “Self-Defined Leadership Among Black Women,” “Capitalistic Hands around My Throat: Corporate Control and the Erosion of Hip Hop’s Womanist Roots,” “Pushing and Pull-ing Towards Coalition: African Americans and the Election of Antonio Villaraigosa,” and “Towards a Womanist Leadership Praxis: Electoral/Grassroots Alliances in Black California.”
Dr. Abdullah is currently working on her first book, Move the Crowd: Hip Hop and Political Mobilization.Mark Drayse, Ph.D. (mapping process)is a Professor

77When the People Draw the Lines League of Women Voters of California
of Geography at California State University, Fuller-ton, where he has taught since 2001. Professor Drayse received his B.A. in geography from Clark University, his M.A. in geography from the University of Toronto, and his Ph.D. in geography from UCLA. Dr. Drayse’s current research is focused on globalization and region-al economic change in North America, and challenges of economic development in southern Africa. He is collaborating with Raphael Sonenshein on an analysis of urban political coalitions in an age of immigration, focusing on Los Angeles.
Bonnie glaser, Ph.d. (technology and public involve-ment) is a Research Specialist at the UC Berkeley Law Center for Research and Administration. Dr. Glaser holds a masters degree in public health and Ph.D. in political science, both from UC Berkeley. For the past five years, Glaser coordinated and conducted elec-tion administration research projects on the topics of poll worker training and performance, local election office operations, polling place voting and voting-by-mail, uniformed and overseas voters, and on-line voter registration. In 2010 and 2011, she managed a multi-pronged outreach and education project aimed at increasing the number of people actively involved with and informed about redistricting in California.
Justin levitt, Jd/mPA (Voting Rights Issues) is a national expert on the law of democracy. He gradu-ated magna cum laude with a law degree and a masters degree in public administration from Harvard Univer-sity, where he was an articles editor for the Harvard Law Review. Levitt has testified before committees of the U.S. Senate, the U.S. Civil Rights Commission, several state legislative bodies, and both federal and state courts. His research has been published in top-tier law reviews and peer-reviewed journals and has been cited extensively in the media and the courts, including the U.S. Supreme Court; he also maintains All About Redistricting (redistricting.lls.edu), a website devoted to redistricting law nationwide. Levitt has worked at several civil rights and civil liberties non-profits, and served in various capacities for several presidential campaigns, including as the National Vot-er Protection Counsel in 2008, helping to run an effort ensuring that tens of millions of citizens could vote
and have those votes counted. He was a law clerk to Judge Stephen Reinhardt of the U.S. Court of Appeals for the Ninth Circuit.
research Associate
nedda Black, Jd, msW received her J.D. from U.C. Hastings College of the Law, her M.S.W. from New York University, and her B.A. in Political Science from California State University, Fullerton. While at Hast-ings, she received Outstanding Achievement in Pro Bono and Outstanding Volunteer in Public Service awards, and was a Board of Directors Scholar for the California Bar Foundation. She was a staff editor for the Hastings Women’s Law Journal and Managing Director for Homeless Legal Services. She has been employed as a Graduate Research Fellow for several Hastings faculty.

League of Women Voters of California, 1107 Ninth Street, Suite 300 Sacramento, CA 95814-3608
(888) 870-VOTE (8683)lwvc.org