where does mentoring matter most? teachers’ …
TRANSCRIPT

St. John's University St. John's University
St. John's Scholar St. John's Scholar
Theses and Dissertations
2020
WHERE DOES MENTORING MATTER MOST? TEACHERS’ WHERE DOES MENTORING MATTER MOST? TEACHERS’
PERCEPTIONS OF BEING MENTORED DURING THEIR FIRST YEAR PERCEPTIONS OF BEING MENTORED DURING THEIR FIRST YEAR
OF TEACHING AND THE CORRELATION OF THOSE PERCEPTIONS OF TEACHING AND THE CORRELATION OF THOSE PERCEPTIONS
WITH JOB SATISFACTION AMONG ECONOMICALLY DIVERSE WITH JOB SATISFACTION AMONG ECONOMICALLY DIVERSE
SCHOOLS SCHOOLS
: Zachary Stephen Boyt
Follow this and additional works at: https://scholar.stjohns.edu/theses_dissertations

WHERE DOES MENTORING MATTER MOST?
TEACHERS’ PERCEPTIONS OF BEING MENTORED DURING THEIR FIRST
YEAR OF TEACHING AND THE CORRELATION OF THOSE PERCEPTIONS
WITH JOB SATISFACTION AMONG ECONOMICALLY DIVERSE SCHOOLS
A dissertation submitted in partial fulfillment
of the requirements for the degree of
DOCTOR OF EDUCATION
to the faculty of the
DEPARTMENT OF ADMINISTRATIVE AND INSTRUCTIONAL LEADERSHIP
of
THE SCHOOL OF EDUCATION
at
ST. JOHN'S UNIVERSITY
New York
by
Zachary Boyt
Date Submitted ___3/17/2020__ Date Approved____3/17/2020_____
___________________________ ______________________________
Zachary Boyt Dr. Stephen Kotok

© Copyright by Zachary Boyt 2020
All Rights Reserved

ABSTRACT
WHERE DOES MENTORING MATTER MOST?
TEACHERS’ PERCEPTIONS OF BEING MENTORED DURING THEIR FIRST
YEAR OF TEACHING AND THE CORRELATION OF THOSE PERCEPTIONS
WITH JOB SATISFACTION AMONG ECONOMICALLY DIVERSE SCHOOLS
Zachary Boyt
In this quantitative study, the researcher explored the relationships between new
teacher mentoring and job satisfaction. Although many studies have been conducted on
the link between new teacher mentoring and job satisfaction, there exists little research on
whether or not there are specific mentoring activities that correlate more strongly with
job satisfaction. In addition to filling that gap in the research, this study examined the
extent to which job satisfaction is correlated with both mentoring activities and the
mentoring relationship. Over 600 teachers across nine districts plus a regional center on
Long Island were surveyed. The schools surveyed had varying percentages of
economically disadvantaged students.
Using both Seligman’s (1972) theory of learned helplessness and Ingersoll and
Strong’s (2011) theory of teacher development as frameworks, this study developed an
understanding of the frequency of specific activities in which mentors and mentees
engage and if said activities correlate with job satisfaction. The results in this study
indicated few significant differences in mentor-mentee activities across varying degrees
of economically disadvantaged schools. Moreover, the study found that the following
three activities had the strongest correlation with job satisfaction among early-career
teachers: understanding the school’s evaluation process, time management, and

understanding of curriculum. Finally, it was determined that, in general, the strength of
the mentor-mentee relationship is more strongly correlated with job satisfaction than any
of the specific activities in which mentors and mentees engage. The results could help
inform both mentors and trainers of mentors, and the recommendations that were made
are intended to build confidence and optimism in new teachers, thus potentially leading to
higher teacher retention, and, ultimately, improved student outcomes.

ii
DEDICATION
To my dad, Joseph Boyt, who helped to instill an inquisitive mind in me, and to
my brother, Alex Boyt, who constantly reminds me, “There’s more ahead of you than
you could know of now.” You continue to live in me.

iii
ACKNOWLEDGEMENTS
I have so many to thank for bringing me to this point on my journey. First, to my
mentor, Dr. Stephen Kotok, there is no way I can thank you enough for your perspective,
guidance, and support. You embody the best qualities of a mentor. To the other members
of my committee, Drs. Elizabeth Gil and Mary Ellen Freeley, thank you for your candor,
expertise, and positivity. I definitely had an all-star team guiding me!
To the staff at Great Neck North Middle School, particularly Dr. Gerald Cozine,
Nancy Gunning, Jennifer Andersen, Debbie Klig, and Lisa DiNatale, thank you for your
empathy, support, and curiosity. To my students, thank you for your unwavering
encouragement, always asking about how my writing was going. I truly have the best job
in the world.
To my cohort at St. John’s University, especially Katie Duggan, Linda Harris, and
Tracey Segal, thank you for always pushing me to do better work than I thought possible.
To the authors and superintendents that granted me permission to adapt and
conduct the survey, thank you for supporting work that I hope you find meaningful. I
appreciate your desire to find ways to improve your teacher development programs.
To my valued mentors (both formal and informal), Craig Garber, Richie
DiPasqua, Robert Chambers, Dr. Joanna Miller, and Dr. Anael Alston (who also
connected me to potential participants in the study), thank you for being you.
To my brother, Aaron Boyt, thank you for being the best brother I could ask for. I
could always count on you when dealing with my frustrations in this process; I appreciate
you always asking me if I needed a soda or something nice to eat when I was getting
antsy. You mean more than you know, Crazy Man.

iv
Finally, thank you to my original mentor, my mother, Margaret Boyt, who has
been with me every step of the way. You have made so much possible, not just for our
family, but for thousands upon thousands of students, parents, and teachers. I love you.

v
TABLE OF CONTENTS
DEDICATION .................................................................................................................... ii
ACKNOWLEDGEMENTS ............................................................................................... iii
LIST OF TABLES ........................................................................................................... viii
LIST OF FIGURES ........................................................................................................... ix
CHAPTER 1 ....................................................................................................................... 1
Introduction ..................................................................................................................... 1
Purpose of the Study ....................................................................................................... 2
Theoretical Framework ................................................................................................... 3
Significance of the Study ................................................................................................ 5
Connection with St. John’s Mission ................................................................................ 6
Research Questions ......................................................................................................... 7
Null Hypotheses .............................................................................................................. 7
Alternative Hypotheses ................................................................................................... 8
Research Design and Data Analysis................................................................................ 8
Sample/Participants ....................................................................................................... 10
Instruments .................................................................................................................... 10
Procedures/Interventions ............................................................................................... 12
Definitions of Terms ..................................................................................................... 13
CHAPTER 2 ..................................................................................................................... 16
Review of Related Research ......................................................................................... 16
Theoretical Frameworks ................................................................................................ 16
Literature Review: A Brief History of Mentoring ........................................................ 21
Mentoring in Education in General ............................................................................... 22
Mentoring in New York State Education ...................................................................... 24
The Early-Career Teacher Experience .......................................................................... 26
Why Is Mentoring Beneficial? ...................................................................................... 29
Suggested Mentoring Practices ..................................................................................... 30
Challenges and Drawbacks to Mentoring ..................................................................... 33
Summary ....................................................................................................................... 35
Gaps in the Research ..................................................................................................... 35
CHAPTER 3 ..................................................................................................................... 37

vi
Methodology ................................................................................................................. 37
Research Questions ....................................................................................................... 37
Null Hypotheses ............................................................................................................ 37
Alternative Hypotheses ................................................................................................. 38
Research Design and Data Analysis.............................................................................. 38
Sample/Participants ....................................................................................................... 40
Instruments .................................................................................................................... 41
Procedures/Interventions ............................................................................................... 45
CHAPTER 4 ..................................................................................................................... 49
Results ........................................................................................................................... 49
Research Questions ....................................................................................................... 49
Null Hypotheses ............................................................................................................ 49
Alternative Hypotheses ................................................................................................. 50
Research Question 1 ...................................................................................................... 50
Research Question 2 ...................................................................................................... 69
Research Question 3 ...................................................................................................... 71
Summary ....................................................................................................................... 78
CHAPTER 5 ..................................................................................................................... 80
Discussion ..................................................................................................................... 80
Implications of Findings................................................................................................ 80
Ancillary Findings ......................................................................................................... 83
Relationship to Prior Research ...................................................................................... 83
Limitations of the Study ................................................................................................ 85
Recommendations for Future Practice .......................................................................... 86
Recommendations for Future Research ........................................................................ 87
Conclusion ..................................................................................................................... 88
APPENDIX A ................................................................................................................... 90
Institutional Research Board Approval ......................................................................... 90
APPENDIX B ................................................................................................................... 92
Survey............................................................................................................................ 92
APPENDIX C ................................................................................................................. 100
Letter to Superintendents ............................................................................................ 100
APPENDIX D ................................................................................................................. 102

vii
Letter to Participants ................................................................................................... 102
REFERENCES ............................................................................................................... 104

viii
LIST OF TABLES
Table 3.1 Demographic Information of Participants ........................................................ 48
Table 4.1 Descriptive Statistics for Dependent Variables by Group – Very Low to
Moderate .......................................................................................................................... 51
Table 4.2 Descriptive Statistics for Dependent Variables – High, Very High, and Early-
Career ................................................................................................................................ 52
Table 4.3 One-Way ANOVA Results for All Teachers ................................................... 57
Table 4.4 One-Way ANOVA Results for Early-Career Teachers .................................... 63
Table 4.5 Correlations with Job Satisfaction for Independent Variables – Early-Career
Teachers ............................................................................................................................ 70
Table 4.6 Correlations with Job Satisfaction for Mentoring Relationship – Early-Career
Teachers ............................................................................................................................ 73
Table 4.7 Correlations with Job Satisfaction – Disaggregated by Percentage of
Economically Dasadvantaged Students ............................................................................ 76
Table 5.1 Comparison of Four Weakest Correlations of Mentor Relationship and Four
Strongest Mentoring Activities with Job Satisfaction among Early-Career Teachers ..... 82

ix
LIST OF FIGURES
Figure 2.1 Theory of New Teacher Development ............................................................ 20
Figure 2.2 Theory of Teacher Development, Learned Helplessness, and Optimism ....... 21

1
CHAPTER 1
Introduction
The percentage of teachers leaving the profession year after year is shocking and
staggering. Over the past thirty years, anywhere between nine and 11% of teachers leave
the profession within a year of their start date (Ingersoll, 2018). Additionally, almost half
(44.1%) of all teachers leave within five years (Ingersoll, 2018). To combat this, New
York State has implemented and mandated a new teacher mentoring program with the
aim of keeping quality teachers in the profession.
New York State requires that teachers are to receive one year of mentoring to earn
their professional certification, and this requirement was implemented in 2004 after
piloting programs throughout various districts across the state during the late 1980s and
early 1990s to help new teachers learn a new set of skills while adapting to a new
profession (NYSED, 2012). Unfortunately, there is often a lack of communication
between the new teacher and the mentor (Benson-Jaja, 2010). Furthermore, schools will
often select a mentor for a new teacher out of convenience, rather than basing it on the
specific needs of the teacher (Smith, 2009). Moreover, while there are a variety of
different activities that count toward mentoring hours, such as co-teaching, co-planning,
and observations, mentoring activities are also chosen out of convenience, not based on
the needs of the new teacher (Smith, 2009). The process is even more difficult in high-
need schools, where attrition rates are higher than their lower-need counterparts, due to
poor working conditions, lack of resources, and the stress of working with students and
families who pose a wide range of needs (Darling-Hammond, 2003).

2
In summary, although mentoring would seem like a feasible solution to a pressing
and enduring educational problem, there are still gaps and inconsistencies in many
mentoring programs; although almost 80% of first-year teachers report having a mentor
(BTLS, 2008), the teacher attrition rate has remained relatively consistent (Ingersoll,
2018) with 19% of teachers stating that they leave the profession due to stress, pressure,
and burnout (Phi Delta Kappan, 2019).
Purpose of the Study
Rowley (1999) wrote that there is a need to identify and prepare quality mentors.
He writes that a good mentor is committed to the role, accepting of the new teacher,
skilled at providing correct and appropriate supports, adept at various interpersonal
contexts, maintains a love of lifelong learning, and consistently exudes confidence and
optimism. Still, a mentor should also be aware of the specific mentoring activities that are
most strongly associated with positive responses from the new teachers they serve
(Rowley, 1999).
The purpose of this study was to examine the specific mentoring activities that
new teachers perceive as effective. At the same time, the study analyzed the differences
in mentoring practices perceived by new teachers as effective across districts of varying
percentages of economically disadvantaged students, defined by the New York State
Department of Education as any student who participates in, or in a family that
participates in, at least one economic assistance program, such as Social Security
Insurance, Food Stamps, free and reduced-price lunch at school, or the Home Energy
Assistance Program (NYSED, 2019). Finally, this study determined the degree to which
teacher satisfaction is correlated with both mentor activities and mentor-mentee

3
relationship. In other words, the study determined whether or not the strength of the
mentor-mentee relationship is more highly correlated with job satisfaction than the
specific activities in which the mentor and mentee engage.
Using a survey adapted from Gordon’s (2000) Helping Beginning Teachers
Succeed, Berk’s (2005) Mentorship Effectiveness Scale, and Hinshaw and Atwood’s
(1982) Anticipated Turnover Scale, the researcher ran both correlational analyses and
multiple one-way ANOVA tests to complete this quantitative examination.
Theoretical Framework
In this study, two frameworks were used in tandem as a means to support the
research. The first and older theory is Martin Seligman’s theory of learned helplessness
(1972). The second, more contemporary theory is the theory of new teacher development
(Ingersoll & Strong, 2011). These two theories will be discussed in greater detail in
chapter two.
Learned Helplessness. In his theory of learned helplessness, Seligman (1972)
posits that helplessness is actually a learned behavior; when animals fail at something
over and over and over again, and it feels like the circumstances are beyond their control,
they give up more easily. He first performed experiments on dogs and found that when
dogs kept getting shocked, they eventually stopped trying to get out of a cage, even when
the shocker was turned off. In essence, they learned to be helpless. His book Learned
Helplessness and Depression on Animals and Men (1976), as well as many other works
of his, explains this in great detail.
Conversely, Seligman further explains that the one way to alleviate learned
helpless is through learned optimism. By encouraging people to focus on the positive,
4
they are less likely to immediately default to the belief that they are unable to do
something. His book Learned Optimism (1991) explains how individuals’ focus on either
the pessimistic or the optimistic can absorb their emotions in all aspects of life for better
or for worse. In his book Flourish (2013), Seligman delves into five major facets of
positive psychology that play a crucial role in happiness. The first facet is positive
emotion, which includes pleasant states involving enjoying one’s self in the moment. The
second facet is engagement, which is being completely absorbed in a task. The third facet
is meaning, which gives the beholder a sense of belonging. The fourth facet is
accomplishment, which is feelings of success and achievement. The final facet, positive
relationship building, involves a vibrant social life in both personal and professional
settings.
Seligman’s theory connects to new teacher mentoring in a variety of ways. First,
it connects to the phenomenon of almost half of teachers leaving the profession within
five years. It is plausible to think that there is some connection between such a high
attrition rate and the theory of learned helplessness. Second, it would seem as though a
successful mentor-mentee relationship would be predicated upon fostering learned
optimism. Chhauger, Rose, and Joseph (2017) found that higher levels of optimism
predict higher levels of physical, cognitive, and emotional engagement. Thus, if a
mentor-mentee relationship between a veteran teacher and a first-year teacher fosters
optimism, then that teacher may more likely be committed to continued work.
Theory of New Teacher Development. Ingersoll and Strong (2011) created a
model that illustrates how preparation of teachers leads to student success. This model
views teachers as human capital. By retaining the human capital, ultimately, the growth

5
and academic learning of students would be improved (Ingersoll & Strong, 2011). The
model contends that schools must develop preservice preparation programs for teachers,
commonly known as new teacher induction. Often within this this induction program is
mentoring (McBride, 2012). Successful induction leads to improved classroom teaching
practices, which, in turn, leads to higher teacher retention, and, ultimately, to the to the
goal of improved student learning and growth in schools.
The theory of new teacher development connects to the researcher’s study
because it suggests that without a proper mentoring program, teachers will not grow,
teachers will not stay, and, as a result, students will not learn. By looking at the ways in
which mentors conduct activities most strongly tied to job satisfaction, insight could be
gained on which strategies mentors could use to increase job satisfaction and, ultimately,
lead to greater student success.
The two theories connect because helplessness could be the disruptor between
successful induction and improved practices. First-year teachers may feel properly
trained during their preservice training and have a false sense of confidence when
beginning in the profession. However, when first-year teachers are forced to endure all
of the unexpected elements of first-year teaching, they may give up and leave the
profession forever without the proper professional, social, and emotional support. As a
result, this could deny underserved students potentially successful teachers.
Significance of the Study
Although much research exists in the field of new-teacher mentoring, there exists
very little on whether or not any differences in mentoring practices exist when comparing
high-need districts to their more affluent counterparts. The research is particularly

6
important in the professional growth of teachers, students, and school and district leaders.
It ultimately addresses Professional Standard for Educational Leadership #6 (2015),
which states, “Effective educational leaders develop the professional capacity and
practice of school personnel to promote each student’s academic success and well-being.”
The research extends knowledge in the area by not only looking at whether or not
mentoring differences exist across schools of varying percentages of economically
disadvantaged students (as there may not be a single panacea to help all new teachers
succeed, regardless of the school in which they teach), but it also determines whether or
not the quality of the mentor-mentee relationship has a stronger connection with job
satisfaction than the activities in which mentors and mentees engage. The results could be
used to give teachers, their mentors, and school leaders a better sense of what mentors
and mentees should be doing together during their year of mandated collaboration.
Connection with St. John’s Mission
St. John’s University, a Vincentian University, models itself after the tenets of St.
Vincent de Paul, a champion of equity and service to the underprivileged. As such, much
of the academic work completed at the university focuses on social justice. This
dissertation is no exception.
As stated previously, nearly half of all teachers leave the profession within five
years of their hiring date (Ingersoll, 2018). This is not only a social issue, but also a civil
rights issue. Students in lower income communities are more likely to be students of
color; America’s racial and ethnic minorities comprise a disproportionately large
population Americans living in poverty (US Department of Education, 2000). In addition
to being subjected to challenging financial circumstances, economically disadvantaged

7
students must also deal with significant educational challenges, in part because they are
stuck in an endless revolving door of teachers with little to no experience (Falk, 2012). It
is the aim of this study that its results expose mentors to engaging practices with mentees
in order to keep them in the classrooms, particularly in high-need schools. This may help
solve some of the problems of educational inequity, thus furthering the mission of the
university.
Research Questions
The purpose of this study was to determine the specific activities in which new
teacher mentors and their mentees engage and if these specific activities have any effect
on mentees’ perceptions of their job. As such, three questions were answered:
1. To what degree do mentoring activities differ in schools with higher percentages
of economically disadvantaged students?
2. To what extent is there a correlation between specific mentoring practices and
early-career teachers’ job satisfaction?
3. To what extent is teacher satisfaction correlated with mentor activities and mentor
relationship? Does this correlation vary by percentage of economically
disadvantaged students?
Null Hypotheses
H0 #1: There are no significant differences in mentoring activities in districts with higher
numbers of economically disadvantaged students.
H0 #2: There is no correlation between specific mentoring practices and early-career
teachers’ job satisfaction.

8
H0 #3: Neither specific mentoring activities nor the quality of the relationship between
the mentor and the mentee will be more strongly correlated with job satisfaction.
Alternative Hypotheses
H1 #1: There are significant differences in mentoring activities in districts with higher
numbers of economically disadvantaged students.
H1 #2: There is a correlation between specific mentoring practices and early-career
teachers’ job satisfaction.
H1 #3: Specific mentoring activities and/or the quality of the relationship between the
mentor and the mentee will be more strongly correlated with job satisfaction.
Research Design and Data Analysis
This study was quantitative. The research design utilized was a survey design.
The reason this was appropriate, according to Vogt et. al. (2012), is because, “you can
expect respondents to give you reliable information; you know how you will use the
answers; and you can expect an adequate response rate” (p.16).
To answer the first research question regarding the degree to which mentoring
activities differ in schools with higher percentages of economically disadvantaged
students, 36 one-way ANOVA tests were conducted to determine significant differences
among each independent group. In this case, the dependent variable was time spent
engaged in each of the 18 mentoring activities mentioned in the survey, and the
independent variable was categories of economically disadvantaged students: 0-20%
economically disadvantaged (very low economically disadvantaged), 20-40%
economically disadvantaged (low economically disadvantaged), 40-60% economically

9
disadvantaged (moderate economically disadvantaged), 60-80% economically
disadvantaged (high economically disadvantaged), and 80-100% economically
disadvantaged (very high economically disadvantaged). The first 18 ANOVAs run
involved all teachers surveyed, while the second 18 ANOVAs run involved early-career
teachers.
To answer the second research question regarding extent to which there is a
correlation between specific mentoring practices and early-career teachers’ job
satisfaction, a bivariate correlational analysis was run to determine if any specific
mentoring activities were significantly correlated with job satisfaction, and, if so, which
specific activities had the strongest correlation. In the definition of terms later in this
chapter, job satisfaction is defined by participants’ composite scores on the Anticipated
Turnover Scale, scores which range from 8 (lowest possible job satisfaction) to 38
(highest possible job satisfaction.)
To answer the third research question regarding the extent to which teacher
satisfaction is correlated with mentor activities and the mentor-mentee relationship, once
again, a bivariate correlational analysis was run to determine if the mentor-mentee
relationship has a stronger correlation with job satisfaction than the specific activities in
which mentors and mentees engage. Additionally, a bivariate correlational analysis was
run separately to determine whether or not mentoring activities’ and/or the mentor-
mentee relationship’s correlation with job satisfaction remains consistent across schools
with varying percentages of economically disadvantaged students.
To ensure validity and reliability of the study, participants’ answers to surveys
were both anonymous and confidential. Additionally, it was assumed that participants

10
who work in any type of school would be equally likely to answer the questions on the
survey, regardless of the percentage of economically disadvantaged students. It was
further assumed that people with all strengths of opinions would answer the questions,
not just those who are highly passionate either way about their experiences. Finally, it
was assumed that all teachers in this survey have a valid recollection of their mentoring
experiences, even if it was completed years ago.
Sample/Participants
The sample in this survey consisted of 651 teachers, including 111 early-career
teachers across nine school districts and one regional support center in Long Island. The
reason for this was twofold. First, as stated in the introduction, nearly half of teachers in
urban areas leave the profession within their first five years (Ingersoll, 2018). Second,
given the recency effect (Jones & Goetthals, 1972), it was more likely that teachers would
have a more vivid recollection of their mentoring experiences within their first five years
of teaching. However, all teachers from each school were invited to take the survey, as
looking at data from more veteran teachers indicated the extent to which they still value
the mentoring they received many years after the fact.
Instruments
There were three surveys adapted into a single survey in this study. The first
survey was adapted from Gordon’s (2000) How to Help Beginning Teachers Succeed and
was further adapted to one part of the Survey for Mentor Program Participants utilized in
Watson’s (2012) Analysis of New York State Mentoring Programs. The first purpose of
this instrument was to determine if a new teacher was mentored. If so, the survey’s

11
second purpose was to identify which beginning teacher needs were best met by their
program’s components. The specific areas of need represent all seven areas supported by
the California Beginning Teacher Project (2006) as beginning teachers’ seven major
needs: systematic needs, parental needs, resource needs, emotional needs, managerial
needs, instructional needs, and disciplinary needs.
The second survey was an adaptation of the Mentorship Effectiveness Scale.
Originally authored by Berk, Berg, Mortimer, Walton-Moss, and Yeo in 2005, it was also
utilized in Morina’s (2012) Mentoring and Retention in First-Year Teachers: A Mixed
Methods Study. The Mentorship Effectiveness Scale contains a Likert scale consisting of
12 items, using a six-point continuum (Berk, et al., 2005). This was used to measure the
strength of the relationship between the mentor and mentee, from the perspective of the
mentee.
The third survey was an adaptation of the Anticipated Turnover Scale (ATS),
originally authored by Hinshaw and Atwood in 1982, and also utilized in Morina’s
(2012) Mentoring and Retention in First-Year Teachers: A Mixed Methods Study. The
Anticipated Turnover Scale also consists of eight items rated on a six- point Likert scale.
The Anticipated Turnover Scale was chosen to measure the influence on teacher retention
because it was originally developed to measure retention in nursing, which, like teaching,
has one of the highest turnover rates among all professions (Hinshaw & Atwood, 1982).
The survey was piloted by the researcher during the summer of 2019. During the
pilot, the researcher found in a correlational analysis that the top three mentor-mentee
activities most associated with teacher job satisfaction, according to these results, were
mentee observing mentor teach (r = .37), mentee observing other teachers teach (r = .32),

12
and mentor and mentee attending professional development together (r = .23). However,
the sample size was limited (n = 36), so the researcher decided to distribute the survey on
a larger scale for this research project to increase statistical power and to decrease the
likelihood of a Type II error. Additionally, the researcher received permission from all
three groups of authors to adapt and to use their survey, as well as permission to
distribute the survey electronically.
To further ensure validity and reliability of the study, participants’ answers to
surveys were both anonymous and confidential. Additionally, it was assumed that those
who answered the questions in the survey were the actual teachers to whom the survey
was sent, as opposed to a friend or a relative who had access to the email. It was further
assumed that people with all strengths of opinions answered the questions, not just those
who are highly passionate either way about their experiences. Finally, it was assumed
that all teachers in this survey had a valid recollection of their perceptions of mentoring
experiences, even if it was completed years ago.
Procedures/Interventions
After approval from the dissertation committee, the researcher sought approval to
conduct research from three entities: the original authors of the survey instruments, St.
John’s Independent Review Board, and each individual school district’s superintendent.
While waiting for approval, the researcher used BEDS data from NYSED (2019) to
create a document stating the percentage of students in a school who are considered
economically disadvantaged. For example, if School A had 15 students listed as
economically disadvantaged and 85 students listed as not economically disadvantaged
then, on the form the researcher creates, the percent of economically disadvantaged

13
students in School A would be 15%. The researcher would then use this data to inform
the search for an appropriate number of schools in each category. After receiving
approval from each district’s superintendent, the researcher requested that the
superintendent forward the survey to all teachers in the district. Although it may seem
that this was done for the sake of efficiency, the true motivation behind this decision was
so that the survey would be sent by a known entity, as opposed to a stranger asking
participants to click on an unknown link.
Schools were divided into five categories: 0-20% economically disadvantaged,
20-40% economically disadvantaged, 40-60% economically disadvantaged, 60-80%
economically disadvantaged, and 80-100% economically disadvantaged. There was a
near equal number of schools in each category. If a teacher was unsure of the percentage
of students in their school who are economically disadvantaged, the list of schools with
estimated percentages of economically disadvantaged students was included as an
attachment. Every single public school in Nassau and Suffolk County was included on
the attachment, so participants wouldn’t know exactly which other schools were
surveyed. Teachers were given three weeks to complete the survey, and reminder emails
were sent out each week. The survey was sent via Survey Monkey. Once all data were
collected, they were then transferred to SPSS, cleaned, and analyzed.
Definitions of Terms
• mentor: For the purposes of this study, a mentor is any current or former teacher
who provided formal mentoring to a first-year teacher, who is now currently
teaching in a K-12 public school district in Long Island, over the course of that
year.
14
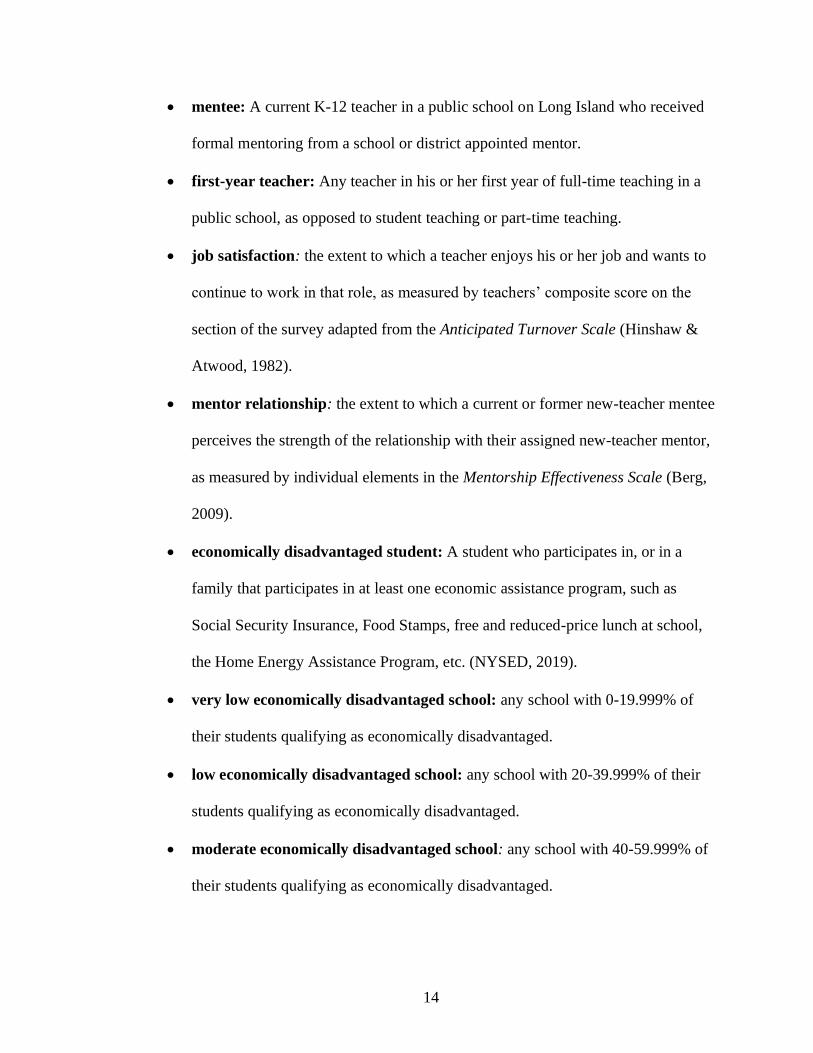
• mentee: A current K-12 teacher in a public school on Long Island who received
formal mentoring from a school or district appointed mentor.
• first-year teacher: Any teacher in his or her first year of full-time teaching in a
public school, as opposed to student teaching or part-time teaching.
• job satisfaction: the extent to which a teacher enjoys his or her job and wants to
continue to work in that role, as measured by teachers’ composite score on the
section of the survey adapted from the Anticipated Turnover Scale (Hinshaw &
Atwood, 1982).
• mentor relationship: the extent to which a current or former new-teacher mentee
perceives the strength of the relationship with their assigned new-teacher mentor,
as measured by individual elements in the Mentorship Effectiveness Scale (Berg,
2009).
• economically disadvantaged student: A student who participates in, or in a
family that participates in at least one economic assistance program, such as
Social Security Insurance, Food Stamps, free and reduced-price lunch at school,
the Home Energy Assistance Program, etc. (NYSED, 2019).
• very low economically disadvantaged school: any school with 0-19.999% of
their students qualifying as economically disadvantaged.
• low economically disadvantaged school: any school with 20-39.999% of their
students qualifying as economically disadvantaged.
• moderate economically disadvantaged school: any school with 40-59.999% of
their students qualifying as economically disadvantaged.

15
• high economically disadvantaged school: any school with 60-79.999% of their
students qualifying as economically disadvantaged.
• very high economically disadvantaged school: any school with 80-99.999% of
their students qualifying as economically disadvantaged.
• early-career teacher: a teacher who has been teaching full time for fewer than
five years.
• composite relationship score: the extent to which a mentee perceives the
effectiveness of the relationship of the mentor, as measured by the sum of
elements in the Mentorship Effectiveness Scale (Berg, 2009).

16
CHAPTER 2
Review of Related Research
This chapter will explain how much attention has been paid to mentoring in
education over the years. It will delve into the legal aspects of mentoring in New York
State, while also discussing the efficacy of mentoring. It will also dive into the challenges
of mentoring new teachers. All of this will be set against two theoretical lenses:
Seligman’s theories of learned helplessness and learned optimism, as well as Ingersoll
and Strong’s theory of teacher induction.
Theoretical Frameworks
As mentioned earlier, two theoretical frameworks guided this research: the
theories of “learned helplessness/learned optimism” and the “theory of new teacher
development.”
Learned Helplessness. In his theory of learned helplessness, Seligman (1972)
posits that helplessness is actually a learned behavior; when animals fail at something
over and over and over again, and it feels like the circumstances are beyond their control,
they give up more easily. Having an interest in clinical depression, Seligman first
performed experiments on dogs. He separated the dogs into three groups. The first group
featured dogs in harnesses that didn’t get shocked. The second group of dogs were placed
in harnesses and shocked, but they were given a lever to push that would end the shock.
The third group was set up similarly to group two, but the lever they could press did not
stop the shock; thus they were not able to escape the shock. Afterward, each of the dogs
was placed in a cage in which it could be shocked, but the shock could be avoided by
moving to the other side of the cage. Seligman found that the dogs in the first two groups

17
were able to escape the shock in the cage, but the dogs in group three failed to even try to
move to the other side of the cage, even when he turned off the shocker. In essence, they
learned to be helpless.
Seligman has written volumes on this theory, including Learned Helplessness and
Depression on Animals and Men (1976) and Helplessness (1975), which discussed how
there exists a perception that behavior fails to influence future events. Learned
Helplessness: A Theory for the Age of Personal Control (1993), discusses the negative
effects that occur when people feel that everything in their lives is beyond their personal
control; Helplessness: On Depression, Development, and Death (1992) discusses how
anxiety, depression, and giving up often grow out of a sense of helplessness generated by
external stimuli perceived to be beyond the victims’ control.
There have been many articles indicating that students, particularly in low-income
neighborhoods, suffer from learned helplessness (Strauss, 2013; Catapano, 2014; Gordon
and Gordan, 2006). Additionally, Gordon and Gordon (2006) found that learned
helplessness negatively affects three aspects of an individual’s cognitive and behavioral
functioning. The first aspect is motivational, in which students fail to make efforts
because they feel that circumstances are beyond their control. The second aspect is
cognitive, which is the notion that failure is inevitable. The third aspect is emotional,
which involves students starting to see themselves in a worse light, leading to depression
and self-esteem issues.
Although much literature exists on alleviating learned helplessness in students,
there is no literature discussing learned helplessness in teachers. Finley (2018) found that
teachers report symptoms of depression and shame. Stapleton (2019) found that 18% of

18
teacher respondents to an anonymous survey had symptoms of depression, 62% met
criteria for an anxiety diagnosis, and nearly 20% had severe anxiety, higher than national
averages. This seems to suggest that something about being in the teaching profession
leads to higher rates of anxiety, depression, and low self-esteem. Additionally, research
suggests that the phenomenon of teacher burnout is actually work-induced depression
(Diaz, 2018).
A number of studies on learned helplessness have been conducted in a variety of
disciplines. Bahadir-Yilmaz (2015) found that there was no significant difference of
levels of learned helplessness among first-year nursing students compared to students in
the final year of the program, as measured by the Learned Helplessness Scale (Quinless
and Nelson, 1988). Additionally, Stoeffler (2019) found that the learned helplessness
theory offers insights and perspective to improve practice in social work.
Conversely, Seligman (2006) further explains that the one way to alleviate learned
helpless is through learned optimism. By encouraging people to focus on the positive,
they are less likely to immediately default to the belief that they are unable to do
something. His book Learned Optimism (2006) explains how focus on either the
pessimistic or optimistic can absorb emotions in all aspects of life for better or for worse.
In his book Flourish (2013), Seligman delves into five major facets of positive
psychology that play a crucial role in happiness. The first facet is positive emotion, which
includes pleasant feelings. The second facet is engagement, which is being completely
absorbed in a task. The third facet is meaning, which gives the beholder a sense of
belonging. The fourth facet is accomplishment, which includes feelings of success and

19
achievement. The final facet is positive relationship building, which is a vibrant social
life in both personal and professional settings.
Seligman’s theory connects to new teacher mentoring in a variety of ways. First,
it connects to the phenomenon of almost half of teachers leaving the profession within
five years (Ingersoll, 2018). It is plausible to think that there is some connection between
such a high attrition rate, above-average depression and anxiety rates in teachers, and the
theory of learned helplessness. Second, it would seem as though a successful mentor-
mentee relationship would be predicated upon fostering learned optimism. As stated
previously, Chhauger, Rose, and Joseph (2017) found that higher levels of optimism
predict higher levels of physical, cognitive, and emotional engagement. Thus, if a
mentor-mentee relationship between a veteran teacher and a first-year teacher fosters
optimism, then that teacher may more likely be committed to continued work. The use of
the learned helplessness framework is novel because, although research in anxiety and
depression in teachers exists, and much research exists in learned helplessness in students
exists, previous research hasn’t linked learned helplessness to anxiety and depression in
teachers. Although learned helplessness could be a contributing factor, more research is
necessary in this area.
Theory of New Teacher Development. As stated in chapter one, Ingersoll and Strong
(2011) created a model that illustrates how preparation of teachers leads to student
success. This model views teachers as human capital. By retaining quality human capital,
the ultimate result would be greater student academic learning and growth. (Ingersoll and
Strong, 2011). The model contends that schools must develop preservice preparation
programs for teachers. Within this preparation program is new teacher induction; one

20
component of which is mentoring (McBride, 2012). Successful induction leads to
improved classroom teaching practices, which, in turn, would lead to higher teacher
retention, and, ultimately, to improved student learning and growth. This is illustrated
below in Figure 1 and is consistent with the findings of Stanulis and Floden (2009). They
found that mentor preparation led to stronger mentees, which led to better classroom
management, stronger instruction, and, ultimately, improved student outcomes.
Figure 2.1. Theory of New Teacher Development
The theory connects to the researcher’s study because it suggests that without a
proper mentoring program, teachers will not grow; teachers will not stay, and, as a result,
students will not learn. By looking at the means by which mentors conduct activities are
most strongly tied to job satisfaction, insight could be gained regarding strategies mentors
could use to increase job satisfaction, which would ultimately lead to greater student
success.
The two theories can be seen in conjunction with each other because, as
previously mentioned, learned helplessness in teachers can be viewed as a deterrent to
improvements in teaching. If new teachers perceive that negative aspects of their job are
beyond their control, they might start to feel disillusioned, exhibit symptoms of mental
illness, and, ultimately, leave the profession, thus leaving students with a revolving door

21
of teachers whose well-beings are compromised. Conversely, if teachers are conditioned
to be more optimistic, as many of the aforementioned mentoring activities may foster
optimism, their performance may improve, leading to improved student learning and
growth. Figure 2 on the next page illustrates this.
Essentially, as Ingersoll and Strong (2011) suggested, a strong mentoring program
will lead to stronger improvements in instruction and in student success. At the same
time, since the research suggests that quality mentoring is correlated to job satisfaction, it
could also be a factor in the alleviation of helplessness, anxiety, and depression in
teachers, thus fostering teachers that are stronger and healthier in mind.
Figure 2.2. Theory of Teacher Development, Learned Helplessness, and Optimism
Literature Review: A Brief History of Mentoring
The word mentor is rooted in antiquity. It comes from The Odyssey, from the
name Mentor, who served as a teacher to Telemachus Odysseus’ son (Shea, 1997). Shea
also explains that this practice has existed throughout ancient Greece, with noteworthy

22
examples being Plato mentoring Socrates and Freud mentoring Jung. Over the years,
people have the sense that a mentor is a wise friend, teacher, and advisor (Hussung,
2015).
Mentoring was adopted in many other professions before making its way into
education. Richardson (2003) found that mentoring became a conventional phase of
induction to one’s workplace, and it eventually became accepted as a common practice in
many professions. It may have been some type of brief induction over a few days, or the
mentorship may have been more structured, lasting over the course of many years.
Richardson (2003) further notes that formal professional mentorships first appeared in
medicine, law, and divinity programs, but, until at least the 1980s, there lacked formal
mentoring programs for teachers. Often, schools only had informal mentorships, in which
experienced teachers spontaneously aided new teachers in the spirit of being helpful.
Until the requirement of mentoring programs became law in various states, the only
orientation teachers received was for their benefits program (Richardson, 2003). As
shown in the literature, other lines of employment have had either formal or informal
mentoring programs for years, so it makes sense that a more formal mentoring practice
made its way into public education.
Mentoring in Education in General
Much research has been done in the discipline of mentoring within a school
setting. Ingersoll and Kralik (2004) stated that new teacher induction programs which
included a mentoring component began to emerge in the United States during the mid
1980s. Scott (2008) also found that a need for a statewide mentoring program was
identified around that time. Barrera (2008) examined the relationship between perceived

23
educational support needs of practicing educators, as well as the use of important
characteristics and practices associated with successful mentoring and induction
programs.
Mignott (2011) found that teachers’ engagement in their mentoring program had a
strong correlation with their success. She also found a statistically significant correlation
between mentoring, student success, and a more positive teacher outlook. Furthermore,
she found that mentoring led to more positive student learning experiences. Her study
concluded that a significant percentage of teachers perceived their positive mentoring
experience as a significant part of their career in teaching. Similarly, Stanilus’ (2009)
findings indicated that the improvement in the beginning teachers' state test scores from
fall to spring was greater for a group that received mentoring than for the control group of
new teachers.
In an extensive study conducted by the New Teacher Center (Goldrick, 2016),
nine policy recommendations were made with regard to the development of new-teacher
mentoring programs. The first recommendation was that all new teachers receive two
years of mentoring. The second recommendation was that states should require a rigorous
process for mentor selection with ample time for training. The third recommendation was
to provide release time for mentors and mentees to collaborate. This recommendation
echoes Fiemen-Nemser’s (1996) finding that time must be built into the mentor’s and
mentee’s schedules to meet, to collaborate, and to discuss pedagogical issues. The fourth
recommendation was to reduce teaching time for new teachers so that they have time for
observation and feedback. The fifth recommendation was for states to create mentoring
program standards. The sixth recommendation was for appropriate funding for induction

24
programs. The seventh recommendation was for educators to complete an induction
program in order to receive proper teaching certification. The eighth recommendation
was that states consistently evaluate their induction programs. The final recommendation
was for states to adopt formal standards for teaching and learning conditions. It should be
noted, however, that no recommendation was made as to the activities in which mentors
and mentees should engage other than observation and reflection.
Furthermore, Fiemen-Nemser (1996) identified mentoring in education as a
means of overall school reform. As such, it must be supported by a professional culture in
schools that values the process, supports inquiry and collaboration, and possesses a
thorough understanding of the learning process. Furthermore, the NEA (2002) suggested
that if a well-designed mentoring program is implemented, it will not only improve
teacher effectiveness, it will also decrease teacher turnover rates. These ideas reflect
some of the recommendations for New York State public school districts discussed in the
next section of this chapter.
Mentoring in New York State Education
According to the NYSED website, a teacher with an Initial Certificate must
accrue 175 hours of professional development in order to receive their professional
certification. A year of mentoring as a new teacher must be included as part of these
hours, but the number of hours each district and city offer is up to them, as long as they
are logged and those records are kept for seven years (NYSED, 2012). New York City,
for example, requires a minimum of 40 hours allocated to mentoring activities (Nobel,
2018).

25
In the 1980s, the New York City Department of Education also developed a
mentoring program called the Retired Teachers as Mentors Program (NYCRTMP). This
program provided about 70 hours of contact time between a retired teacher, who served
as a mentor, and a first-year teacher. This contact time was broken up over a period of
one year (Crown, 2009).
Although new-teacher mentoring programs had been piloted in New York State
since the 1980s, it was not until 2004 that the New York State education commissioner’s
law required all teachers to receive a year of mentoring in their first year of teaching
(NYSED, 2012). New teachers could be assigned a mentor who was either school-based
or district-based. Mentoring programs are required as part of the district’s professional
development plan and are to be developed in conjunction with the union’s collective
bargaining agreement (NYSUT, 2012). Andrews and Quinn (2005) found that it didn’t
matter whether a new teacher was assigned a new mentor from the school or the district;
it mattered simply that they were assigned a mentor.
Boyer, et al. (2004) developed a rationale as to why New York’s teachers should
be mentored. First and foremost, they say, mentoring provides new teachers with
encouragement and support. Second, mentoring provides the new teacher with valuable
information regarding the school’s culture and community. Third, mentoring helps to
build cultural understanding between students and families. Finally, mentoring provides
mentees the opportunity to reflect on their practice. This not only provides support for
fledgling teachers, but it also provides a sense of satisfaction in the mentors.
The New York State Education Department (2010) stated that there are 11 aspects
in the implementation of a quality mentoring program. The first aspect is that a mentoring

26
program should have a statement of purpose. The second aspect is that there should be a
decision-making mentor committee formed. The third aspect is that the mentor should
provide the mentee guidance and support. The fourth aspect is that there should be a
formal mentor selection process. The fifth aspect is that all mentors should experience
formal training. The sixth aspect is that mentor-mentee activities should be consistent
with the goals of the mentoring program. The seventh aspect is that appropriate time,
including before, during, or after school, should be allotted for mentor-mentee activities
to occur. The eighth aspect is that districts may negotiate with local teachers’ unions in
forming mentor-mentee pairings. The ninth aspect is that there should be options for full-
time and part-time teachers, as even part-time teachers may accrue service time in their
tenure area. The tenth aspect is developing a quality evaluation system to determine the
effectiveness of the mentoring program. The final aspect is developing an operational
budget for all supported expenditures.
According to NYSUT (2011), successful district-based mentoring programs are
created in collaboration between district and union employees, with implementation of
the program being consistent with each district’s collective bargaining agreement. The
mentoring program must be a part of each district’s official professional development
plan. Additionally, the mentoring experience must be confidential. No part of the
mentoring process should be used in the evaluation process for the first-year teacher, and
the mentor should not disclose any information.
The Early-Career Teacher Experience
The first year of any profession is like no other, and teaching is no different. Moir
(1992) most famously articulated this in her model entitled Phases of First Year

27
Teaching. She posits that first-year teachers begin in the Anticipation Stage, which is an
optimistic time before they actually set foot in a classroom. They feel ready to make a
difference. Next is the Survival Stage, in which those teachers feel overwhelmed by
everything. This leads into the Disillusionment Stage, in which they feel nothing they are
doing is having an impact, and, as a result, feel disheartened. The final stages are the
Rejuvenation Stage and the Reflection Stage, in which the teachers start to, once again,
feel better about what they did and reflect on the changes they will make next year to
ensure that their instruction will be more effective (Moir, 1992).
Wong and Wong (1998) articulate what a new teacher must do in their seminal
work The First Days of School. They note that there are three characteristics of an
effective teacher. First, an effective teacher has exemplary classroom management skills.
Second, the teacher focuses on mastery. Finally, the teacher maintains positive
expectations in order to ensure and maximize student success. The authors offer dozens
of strategies on how to embody those characteristics, such as standing at the door to greet
students, creating seating charts, and writing frequent letters home to parents (Wong and
Wong, 1998).
All of these suggestions may seem overwhelming to the new teacher. As a first-
year teacher, Jones (2012) wrote an article for Educational Leadership on what a good
mentor must do for a new teacher. He stated that a mentor should constantly be prepared,
make workloads manageable, create a community of practice, and offer to coteach. This
is a reflection of the overwhelming reality of a first-year teacher (Jones, 2012).
This is of note because, often, the paradigm in education is that first-year teachers
must focus solely on classroom management, yet this is problematic in the sense that

28
students need to be well educated in addition to being well managed (Rutherford, 2002).
In essence, with all that new teachers have to focus on, such as controlling a class,
learning the school, and remembering names, they must still focus on the goal of
providing young people a quality educational experience. Saphier (1997) and Marzano,
et. al. (2001) offer suggestions for how teachers of any part in their career can improve
instruction. Their works are often given to new teachers, which may be an information
overload.
To combat this overload, a number of educators have offered school-wide
solutions. Robbins (2015) writes about how leaders should build a school-based culture
focused on collaboration and learning through peer coaching. Danielson (2009) suggests
constantly holding rewarding professional conversations, thereby promoting a positive
environment of inquiry and support. Liesfield and Miller (2005), with help from
StrengthsFinder (Rath, 2007), suggest creating a community of leveraging teachers’
strengths, as opposed to overly focusing on their deficiencies. Martin, Buelow, and
Hoffman (2015) completed a qualitative study on what new teachers felt they needed the
most in terms of support. The results indicated that the support that teachers most valued
was having a mentor. The teachers felt that the mentor should be someone with whom
they have a strong and trusting relationship. Furthermore, the study indicated that
teachers felt they needed more structured professional development. Essentially, the
middle school teachers craved a more structured induction program. The literature
supports the notion that it takes a village to raise a new teacher.

29
Why Is Mentoring Beneficial?
The Journal EL, formerly known as Educational Leadership, among other
publications, has published numerous articles on why mentoring new teachers is one of
the best sources of professional development a teacher can receive. Holloway (2001)
wrote about how mentoring programs have a positive effect on first-year teachers, while
also having a positive effect on the mentors too.
Rockoff (2004) posited that when mentees have school-based mentors, rather than
district-based mentors, there are higher rates of retention. This suggests that school-
specific knowledge may be an important skill for mentors to possess. Additionally, he
discovered evidence that students of teachers who received mentoring showed higher
gains in both reading and math. This aligns with Ingersoll and Strong’s (2011) theory of
teacher development which will be presented later in this chapter.
Drago-Severson (2009) writes that mentoring is one of the four major pillars of
practice for adult growth. She notes how mentoring is a relationship that evolves over
time, and, although mentees are in various stages of their adult development, there are a
variety of ways in which mentors can approach working with a mentee based on the state
of adult development at which they currently lay.
Ronfeldt and McQueen (2017) utilized data from two surveys to determine
whether or not new teacher induction programs have any correlation with a lower
likelihood of teacher attrition and migration. To determine who received more supports,
they ran a series of two-level multilevel logistic regression. They did the same thing to
determine if teachers who received more supports were less likely to migrate schools or
leave the profession altogether. They found that being involved in a new-teacher

30
induction program led to lower levels of both teacher attrition and migration. That is, not
only are teachers more likely to stay in the profession, they are less likely to transfer
schools, with the exception being black teachers. Additionally, it found that of six major
induction supports identified, a mentoring program had the second highest correlation to
retention with supportive communication being the highest (Ronfeldt & McQueen, 2017).
However, this study did not focus on the specific supports in induction, nor did it focus
on specific mentoring practices.
Suggested Mentoring Practices
A wealth of books and articles discussing best mentoring practices exists;
however, none of these pieces of literature examines the extent to which these practices
correlate to job satisfaction. Grossman and Davis (2012) found that just as teachers must
differentiate their instruction, mentors must tailor their expertise to meet the individual
needs of new teachers. They suggest a balance of both instructional content and
emotional needs.
Lipton and Wellman (2003) suggest building a learning-focused relationship by
fully paying attention to the mentee, responding with empathy, creating a space that is
safe, reviewing all necessary schedules, offering a wealth of resources, and providing any
necessary information about which new teachers may not be aware. Additionally, Drago-
Severson (2009) posits that mentoring is a means for accessing new information, sharing
advice on adjusting to new roles, facilitating learning, furthering a school’s mission,
tapping both emotional and logistical support, and discovering creative strategies. She
notes that all of these accomplishments help both the mentor and the mentee.

31
In a document that the National Education Association (1999) released, an
emphasis is placed on the confidential nature of the mentor-mentee relationship, echoing
the aforementioned prioritization of confidentiality from NYSUT (2012). Given that
mentoring has a peer-to-peer dynamic, it is deemed vital that there is trust in the
relationship so that inadequacies as a teacher can be discussed (NEA, 1999).
Rowley (1999) wrote about how there is a need to identify and prepare quality
mentors. He writes that a good mentor is committed to the role, accepting of the new
teacher, skilled at providing correct and appropriate supports, adept at various
interpersonal contexts, maintains a love of lifelong learning, and consistently exudes
confidence and optimism. Similarly, Clark (2001) found that effective mentoring focuses
on teacher development, includes regular, differentiated interactions focused on guiding,
offers constant professional development for the mentor, contains positive interactions,
and offers personal and professional rewards to both the mentor and the mentee.
Rutherford (2005) suggested that mentors and mentees collaboratively set up a
calendar, keeping in mind Moir’s (1992) Phases of First Year Teaching, and dividing the
calendar into six sections: Personal, which focuses on work-life balance; Professional,
which focuses on professional development opportunities; Curriculum, Instruction, and
Assessment, which includes readable resources; Organizational Systems, which deals
with grading and record keeping; Students, which focuses on building relationships and
learning capacity of students; and Colleagues, which is about building relationships with
other adults in the building. Rutherford also suggested using sentence stems to guide
discussion.

32
Gardinier and Wisling (2018) recommend four practical strategies to build a high-
quality program for mentoring. First, they suggest that mentors set clear expectations.
Second, they recommend internal mentors, as opposed to mentors who are hired from
outside the school building. Third, they suggest having new mentors also get mentored.
Finally, they recommend putting the relationship first and consistently tending to it.
Boreen et.al. (2009) suggest that mentors focus on the following four questions to
make beginning teachers feel more welcome in their new position:
• How can I help the new teacher learn about the culture of this school?
• How can I assist the new teacher in developing rapport with students?
• What suggestions can I make and what approaches can I model for proactive
classroom management?
• What strategies can I suggest to help the new teacher win the respect of students
and colleagues? (p.26)
The New Teacher Center (2018) discusses three approaches a mentor should
consider when providing differentiated coaching with a new teacher mentee. The first is
the instructive approach. In the instructive approach, the activities are mentor-directed.
The mentor provides the mentee with direct strategies to succeed in the profession, such
as pedagogical suggestions and directions for following district requirements. Next is the
collaborative approach. In the collaborative approach, both the mentor and the mentee
identify problems, formulate conclusions, and construct material as equally as possible.
Although the mentor guides all discussions, the mentor does so without giving directives.
Last is the facilitative approach. In this approach, as expected by its name, the mentor
facilitates the mentee’s thinking and takes a Socrative method to solving problems. At

33
this stage, the new teacher is doing most of the directing; as such, they are the main
contributor to their own development. In essence, this series of approaches operates on a
continuum that moves from least autonomous to most autonomous.
Similarly, Lipton and Wellman (2003) state that there are three Cs in the
continuum of mentor-mentee interactions: consulting, collaborating, and coaching.
Consulting, much like the aforementioned instructive approach in the New Teacher
Center’s (2016) model, is mentor-directed, providing the mentee with necessary
instruction and resources. Collaborating, much like the aforementioned collaborative
approach in the New Teacher Center’s (2016) model, involves the mentor and mentee co-
developing materials while building a collegial relationship. The final stage in the
continuum is coaching. Much like the aforementioned facilitative approach in the New
Teacher Center’s (2016) model, the coaching phase promotes self-directed learning in the
new teacher.
Gordon (2000) created a needs assessment for beginning teachers, which has been
adapted for the survey used in this study. In this assessment, he lists 25 activities in which
mentors and mentees could engage, including communicating with various stakeholders,
completing paperwork, planning instruction, deepening understanding of curriculum, and
time management.
Challenges and Drawbacks to Mentoring
Given all the red tape that exists in any public service, it in no surprise that there
are hindrances in mentoring public school teachers. Cartolano (2006) found that a
particular district on Long Island, in spite of its three-year new teacher induction
program, ranked 19th out of 22 in retention rates, which led the researcher to conclude

34
that the mentoring program in this anonymous district had no impact on new teacher
retention.
Oftentimes schools will select a mentor for a new teacher out of convenience,
rather than basing it on the specific needs of the teacher (Benson-Jaja, 2010). Building on
this idea, it was found that mentoring activities are also often chosen out of convenience
instead of basing them on the needs of the new teacher (Hill-Carter, 2010). Additionally,
Worthy (2005) found that the mentoring process could be complex and haphazard; if the
selection process is too haphazard, then it will not provide mentees with the support and
training that they need. Feiman-Nemser (2012) wrote about how teacher induction does
little more than ease teachers into their new roles, as opposed to welcoming them into a
professional community. However, Bieler (2012) found that experienced teachers need to
help craft a learning community with new teachers by building ideas, navigating
curriculum, grading together, disciplining together, and observing and reflecting together.
Fay (2018) found that millennials value relationships, and, as such, having
relationships with school leaders is important. In Fay’s study, most millennials indicated
that they didn’t feel that they had a personal relationship with their mentor. Wider (2012)
revealed that mentoring programs did not improve teacher retention. Although the
program met teachers’ emotional needs, they did not show evidence of improved teacher
retention. In essence, Fay concluded that districts should include providing research-
based evidence to enhance mentoring programs in high-need districts.
Although one immediate goal of mentoring is to increase teacher job satisfaction
and retention, the ultimate goal is to increase student achievement, which will be
discussed in the theoretical framework (Ingersoll & Strong, 2011). Rockoff (2004)

35
conducted a study in New York City through which he compared test scores of
inexperienced teachers who received mentoring with those of more experienced teachers
who had not received mentoring. The study found no significant differences in
standardized test scores between those who had received the mentoring and those who
had not (Rockoff, 2004).
In a conversation with Linda Darling-Hammond (Scherer, 2012), she articulated
how great schools that support new teachers do so by constant collaboration, but many
schools may not take the risk because of the challenges it poses, such as reorganizing the
schedule. Ultimately, despite all of the recommended activities that exist, schools may
not be able to utilize the activities due to the preestablished systems that neglect to
promote teacher collaboration.
Summary
The available research, including journal articles, books, and websites, articulates
favorable viewpoints of mentoring. Generally speaking, mentoring has been shown to
have positive effects on teacher retention and student outcomes. However, not all
literature reached similar conclusions, as a small minority of research suggests that
mentoring had no effect on teacher retention.
Gaps in the Research
All of this literature suggests that although there is a tremendous amount of
variety in both the quantity and quality of new teacher mentoring, there is a lack of
quantitative data that suggest which specific mentoring practices are perceived as most
effective, whether or not mentoring activities and mentor-mentee relationship correlate to

36
job satisfaction, and whether or not that efficacy is consistent across districts of varying
percentages of economically disadvantaged students. This study aimed to fill those gaps.

37
CHAPTER 3
Methodology
This chapter describes the methods and procedures employed in this study. The
research questions, research design sample, data collection procedures, instruments, and
methods for data analysis are presented.
Research Questions
As stated previously, the purpose of this study was to determine the specific
activities in which new teacher mentors and their mentees engage, and if these specific
activities have an effect on mentees’ perceptions of their job. As such, the researcher
developed a methodology and followed through on that methodology so that three
research questions could be answered:
1. To what degree do mentoring activities differ in schools with higher percentages
of economically disadvantaged students?
2. To what extent is there a correlation between specific mentoring practices and
new teachers’ job satisfaction?
3. To what extent is teacher satisfaction correlated with mentor activities and mentor
relationship? Does this correlation vary by percentage of economically
disadvantaged students?
Null Hypotheses
H0 #1: There are no significant differences in mentoring activities in districts with higher
numbers of economically disadvantaged students.

38
H0 #2: There is no correlation between specific mentoring practices and new teachers’
job satisfaction.
H0 #3: Neither specific mentoring activities nor the quality of the relationship between
the mentor and the mentee will be more strongly correlated with job satisfaction.
Alternative Hypotheses
H1 #1: There are significant differences in mentoring activities in districts with higher
numbers of economically disadvantaged students.
H1 #2: There is a correlation between specific mentoring practices and new teachers’ job
satisfaction.
H1 #3: Specific mentoring activities and/or the quality of the relationship between the
mentor and the mentee will be more strongly correlated with job satisfaction.
Research Design and Data Analysis
This study was quantitative. The researchher utilized a survey design to answer
the research questions. A survey design was deemed appropriate for this study because
the data were obtained directly, the researcher expected the answers to be reliable, and
the researcher knew how he planned to quantitatively analyze the answers (Vogt, et.al.,
2012). As stated previously, to answer the first research question regarding the degree to
which mentoring activities differ in schools with higher percentages of economically
disadvantaged students, 36 one-way ANOVAs were run to determine significant
differences among each independent group. In this study, the dependent variable was
time spent engaged in mentoring activities, and the independent variable was categories
of economically disadvantaged students: very low economically disadvantaged (0-20%

39
economically disadvantaged,) low economically disadvantaged (20-40% economically
disadvantaged,) medium economically disadvantaged (40-60% economically
disadvantaged,) high economically disadvantaged (60-80% economically disadvantaged,)
and very high economically disadvantaged (80-100% economically disadvantaged.) The
first 18 ANOVAs ran utilized all teachers who participated in the study, while the second
18 ANOVAs ran utilized only early-career teachers.
As stated earlier in the study, to answer the second research question regarding
the extent to which there is a correlation between specific mentoring practices and new
teachers’ job satisfaction and desire to remain in their school, the researcher ran a
bivariate correlational analysis, which determined which specific mentoring activities had
the strongest correlation to job satisfaction. Scores in job satisfaction from participants
ranged from a lowest possible job satisfaction of 8 to a highest possible job satisfaction of
48.
To answer the third research question regarding the extent to which teacher
satisfaction is correlated with mentor activities and mentor relationship, once again, a
bivariate correlational analysis was run to determine which elements, if any, in mentor
relationship have a stronger correlation with job satisfaction than do the specific activities
in which mentors and mentees engage. Additionally, a bivariate correlational analysis
was run separately to determine whether or not mentoring activities and the mentor and
mentee relationship’s correlation with job satisfaction remain consistent across schools
with varying percentages of economically disadvantaged students. Moreover, a
composite mentoring relationship score was calculated by taking the sum of each of the

40
components of the mentoring relationship section of the survey, resulting in a composite
score of 12 to 72 for each participant.
Sample/Participants
Convenience sampling was used in this study. Convenience sampling was
appropriate because it was determined that the group being sampled could reasonably be
used to answer the research questions (Vogt, et.al., 2012). The researcher contacted a
colleague in the state commissioner’s office, who put him in contact with the
superintendent of a regional office. In addition to granting permission for teachers at the
satellite school to participate in the survey, the superintendent of the regional office also
agreed to distribute the survey to superintendents who utilize the district offices, ensuring
that more teachers from a wide variety of districts would have the opportunity to take the
survey.
The sample in this survey included 651 teachers across nine school districts on
Long Island, including 40 teachers at the regional site. The primary focus of the study
was early-career teachers. The reason for this was twofold. First, as stated in the
introduction, nearly half of teachers in urban areas leave the profession within their first
five years (Ingersoll, 2018), so this research targeted the needs of teachers in the early
stages of their careers. Second, given the recency effect (Jones & Goetthals, 1972), it is
more likely that teachers would have a more vivid recollection of their mentoring
experiences within their first five years of teaching.
Although the focus of the study was on early-career teachers, the decision was
made to survey all teachers, as a larger data could disaggregated for percentage of
economically disadvantaged students. A request for permission to survey teachers in

41
various districts was sent to 50 superintendents across Long Island. Of the 50 requests,
nine plus the regional site granted permission, four denied permission, and 36 never
replied.
Instruments
Three surveys were adapted into a single survey for this study (see Appendix B).
The first survey was adapted from Gordon’s (2000) How to Help Beginning Teachers
Succeed and was further adapted to one part of the Survey for Mentor Program
Participants utilized in Watson’s (2012) Analysis of New York State Mentoring
Programs. The first purpose of this instrument was to determine if a new teacher was
mentored. If so, the survey’s second purpose was to identify which beginning teacher
needs were best met by their program’s components.
According to Watson, to increase validity, the instrument was first administered
electronically to members of the Capital Area Assistant Superintendents’ Group for
feedback and reflection. This group is comprised of assistant superintendents and
administrators for instruction working within the Capital District area in New York State.
The members of this group are administrators who are responsible for the development,
coordination, and evaluation of mentoring programs. According to Watson, “Their
insight into the survey instrument contributed valuable information to the revision of
survey items including the addition of open-ended items and a more refined rating scale.
All recommendations for changes were considered and, where appropriate, changes were
made to the survey instrument” (p.38).
The second survey was an adaptation of the Mentorship Effectiveness Scale.
Originally authored by Berk, Berg, Mortimer, Walton-Moss, and Yeo in 2005, it was also

42
utilized in Morina’s (2012) Mentoring and Retention in First-Year Teachers: A Mixed
Methods Study. The Mentorship Effectiveness Scale contains a Likert scale consisting of
12 items, using a six-point continuum (Berk, et al., 2005). This was used to measure the
strength of the relationship between the mentor and the mentee, from the perspective of
the mentee. Morina (2012) calculated a Cronbach's alpha coefficient to assess the internal
reliability of the Mentorship Effectiveness Scale as it applies to teachers. According to
Morina, “The Mentorship Effectiveness Scale was reviewed by experts in new teacher
mentoring to assess its validity for use with teachers.” (p. 56).
The third survey is an adaptation of the Anticipated Turnover Scale (ATS),
originally authored by Hinshaw and Atwood in 1982, utilized in Morina’s (2012)
Mentoring and Retention in First-Year Teachers: A Mixed Methods Study. The
Anticipated Turnover Scale also consists of 12 items rated on a seven-point Likert scale.
The Anticipated Turnover Scale was chosen to measure the influence on teacher retention
because it was originally developed to measure retention in nursing, which, like teaching,
has one of the highest turnover rates among all professions (Hinshaw & Atwood, 1982,
1984). In terms of the ATS’s validity and reliability, according to Morina, “(The authors)
used Cronbach‘s alpha coefficient to estimate internal consistency; standardized alpha
was .84…Principal components factor analysis and predictive modeling techniques were
used to estimate construct validity… The resultant total model was 72.6% accurate in
predicting persons who stayed with the organization and those who left. Consequently,
anticipated turnover is a valid and reliable measure of employee retention” (p. 57).
The reason that the researcher gave one abbreviated survey, as opposed to all three
surveys as a whole, is because it was decided that there was a greater likelihood that

43
teachers, given their lack of free time, would complete an abbreviated survey. This took,
on average, fewer than five minutes, as opposed to each of the three surveys, which could
take close to an hour.
The survey consisted of four parts. The first part consisted of demographic
information, including the participants’ gender, the level at which the participants
currently taught, the number of years teaching, the percentage of students at the
participants’ school who qualify as economically disadvantaged (broken down into the
five aforementioned categories), and whether or not the participant received a mentor in
their first year of teaching. For the third question, involving the number of years the
participant had taught overall, the decision was made to create three categories:1-5 years,
6-16 years, and more than 16 years. The first category was created to be the main target
of the survey, as 50% of all teachers leave the profession within five years (Ingersoll,
2018). The reason for the second category was because, as mentioned previously, the
New York State education regulation which required all first-year teachers to receive a
mentor took effect for the 2004-2005 school year (NYSED, 2012), so, at the time of the
survey’s distribution, those who received mentoring in the first year it was required and
have stayed a teacher would be in their 16th year of teaching.
The second part of the survey was the adaptation of Gordon’s (2000) survey. The
third part of the survey was the adaptation of the Mentorship Effectiveness Scale (Berk,
2005). The final part of the survey was the Anticipated Turnover Scale (Hinshaw &
Atwood, 1982). The anonymity of the survey enhanced the validity of the survey, as
teachers were more likely to answer honestly since their responses would be anonymous,
confidential, and via the internet (Rutledge, 2015).

44
The survey was piloted by the researcher during the summer of 2019, in a
doctoral research independent study seminar. The pilot study was completed with
participants in an anonymous district-wide summer program, with teachers from various
grade levels and districts participating in the study. During the pilot, the researcher found
in a correlational analysis that the top three mentor-mentee activities most associated with
teacher job satisfaction, according to these results, were mentee observing and reflecting
on the mentor’s instruction (r = .37), mentor and mentee observing and reflecting on
other teachers’ instruction (r = .32), and mentor and mentee attending professional
development together (r = .22) However, this study did not account for a variation of
economically disadvantaged students. Additionally, the sample size was limited (n = 36),
so the researcher decided to distribute the survey on a larger scale in various districts to
increase statistical power and to decrease the likelihood of the Type II error.
To further ensure validity and reliability of the study, participants’ answers to
surveys were both anonymous and confidential. Additionally, it is assumed that those
who answered the questions in the survey were the actual teachers to whom the survey
was sent, as opposed to a friend or a relative who had access to the email. It is further
assumed that people with all strengths of opinions answered the questions, not just those
who are highly passionate either way about their experiences. Finally, it is assumed that
those who completed the survey maintain vivid recollections of their mentoring
experiences, even though mentoring may have been completed more than one year in the
past.

45
Procedures/Interventions
The researcher first sought approval for research via a proposal defense to his
dissertation committee. After receiving approval, the researcher sought further approval
to conduct research from three entities. First, he received approval from the authors of the
original survey instruments. Dr. Stephen P. Gordon, author of the needs assessment in
How to Help Beginning Teachers Succeed (2000), gave permission, but, because the
copyright was held by the Association for Supervision and Curriculum Development
(ASCD), the researcher sought and received permission from ASCD, as well. The
researcher also received approval from Dr. Ron Berk to adapt his Mentoring
Effectiveness Scale (2005). On an interesting note, in addition to his permission, Dr. Berk
sent the researcher a plethora of articles on utilizing humor in research, in an attempt to
ease the arduousness of the writing process. At the time of this writing, the efficacy of
these articles is still inconclusive. Finally, the researcher received approval from Drs.
Hinshaw and Atwood to use their Anticipated Turnover Scale (1982).
Second, the researcher sought approval to conduct research from St. John’s
University’s Independent Review Board. The proposal was approved with exempt status,
as the study involved no known risks to participants. See Appendix A for a copy of the
Independent Review Board approval.
While waiting for approval, the researcher used BEDS data from NYSED (2019)
to create a document stating the percentage of students in a school who are considered
economically disadvantaged. BEDS data was publicly available on The New York State
Education Department’s website. Their Economically Disadvantaged spreadsheet
displayed two values for every school in the state: the number of economically

46
disadvantaged students and the number of non-economically disadvantaged students.
However, the data set did not include the percentage of economically disadvantaged
students. To create the list of the percentage of economically disadvantaged students at
each school, the researcher took the number of economically disadvantaged students and
divided that value by the total number of students (sum of economically disadvantaged
and not economically disadvantaged) at the school. For example, if a school had 240
economically disadvantaged students and 260 students who were not economically
disadvantaged, the percent of economically disadvantaged students would be 240 divided
by 500, or 48%. Every single public school in Nassau County and Suffolk County was
included on the attachment, even though only a small percentage of schools in Nassau
and Suffolk were given the survey. The researcher chose to include all schools on the
document to help preserve participants’ anonymity.
Third, the researcher sought approval from each school district’s superintendent
by sending 50 individual emails to various superintendents across Nassau and Suffolk
Counties, including three regional support centers. Of the 50 superintendents, ten
approved, six declined, and 34 did not respond to the request. For the superintendents that
approved, a protocol was established. The researcher sent the survey directly to the
superintendent to forward to their teachers. This approach was taken due to the fact that
emails sent from someone directly in the district, as opposed to a mass email from outside
the district, would not appear in teachers’ spam folders, thus increasing the likelihood of
teacher responses. A link to the survey was embedded in the email. The email reminded
participants that the survey was anonymous, confidential, and that their IP addresses
would not be collected. Additionally, the email stated that teachers would be given three

47
weeks to complete the survey. Reminder emails were sent each week on Sunday evenings
by the researcher to the superintendents to forward to their teachers. Finally, the email
informed superintendents that upon successful completion of the study, they would be
sent an executive summary of both the major findings and the recommendations, which
could be shared with those responsible for supervising the districts’ new-teacher
mentoring program.
For the pilot study conducted in the summer of 2019, the survey was sent via
Google Forms. However, Google Forms contains a variety of data privacy issues
(Stewart, 2018), so the recommendation was made by the researcher’s dissertation
committee that the researcher use a different survey software. As a result, the researcher
built the survey using Qualtrics.
After rebuilding the survey with Qualtrics, the researcher had colleagues test the
survey on various devices. Although the survey worked on PC, Mac, Android, iPad, and
Chromebook, there was an issue with the survey on iPhones. The links embedded in the
survey, which take participants to pages that list the percentage of economically
disadvantaged students in their respective schools, did not work on iPhones with the most
current iOS operating system. After contacting Qualtrics for customer support, it was
determined that it was an iOS issue and that an iOS update would possibly remedy the
situation. The most recent update was downloadable three weeks before the survey was
administered. Unfortunately, the update failed to remedy this technical issue, so the
decision was made to rebuild the survey using another software.
The survey was rebuilt a second and final time using Survey Monkey. The format
remained the same, and, once again, the researcher had colleagues test the survey for both

48
functionality and user-friendliness on all commonly used, potential devices: PC, Mac,
iPhone, Android, iPad, and Chromebook. The researcher also included people outside of
the field of education who would be able to provide feedback on the user experience. At
last, the embedded links worked on all devices, and the user feedback offered to the
researcher was positive. So, it was determined that the third version of the survey would
be the one sent to participants.
As previously stated, data were collected over a period of three weeks. Table 3.1
below displays the demographic information of the participants. Once all data were
collected, they were transferred to SPSS, cleaned, and analyses were run. The results are
discussed in the next chapter.
Table 3.1
Demographic Information of Participants
Years
Taught
1-5 6-16 >16 Total
Percentage of Economically
Disadvantaged Students
Very Low 42 105 136 283
Low 44 72 146 262
Medium 9 10 41 60
High 6 6 9 21
Very High 10 9 6 25
Total 111 202 338 651

49
CHAPTER 4
Results
Research Questions
As stated previously, the purpose of this study was to determine the specific
activities in which new teacher mentors and their mentees engage and if these specific
activities have any impact on mentees’ perceptions of their job. As such, the researcher
developed a methodology and followed through on that methodology so that three
research questions could be answered:
1. To what degree do mentoring activities differ in schools with higher percentages
of economically disadvantaged students?
2. To what extent is there a correlation between specific mentoring practices and
early-career teachers’ job satisfaction?
3. To what extent is teacher satisfaction correlated with mentor activities and mentor
relationship? Does this correlation vary by percentage of economically
disadvantaged students?
Null Hypotheses
H0 #1: There are no significant differences in mentoring activities in districts with higher
numbers of economically disadvantaged students.
H0 #2: There is no correlation between specific mentoring practices and early-career
teachers’ job satisfaction.
H0 #3: Neither specific mentoring activities nor the quality of the relationship between
the mentor and the mentee will be more strongly correlated with job satisfaction

50
Alternative Hypotheses
H1 #1: There are significant differences in mentoring activities in districts with higher
numbers of economically disadvantaged students.
H1 #2: There is a correlation between specific mentoring practices and early-career
teachers’ job satisfaction.
H1 #3: Specific mentoring activities and/or the quality of the relationship between the
mentor and the mentee will be more strongly correlated with job satisfaction.
Research Question 1: To what degree do mentoring activities differ in schools with
higher percentages of economically disadvantaged students?
Thirty-six One-Way Analyses of Variance (ANOVAs) were performed in order to
determine if there were significant differences among the five groups, ranging from very
low to very high economically disadvantaged, on the eighteen dependent variables, which
were the mentoring activities. Two samples were used: the full sample, regardless of
number of years of experience, and the subsample of early-career teachers. Tables 4.1
and 4.2 display the descriptive statistics of the dependent variables by group.
For the first sample, all teachers, ANOVAs revealed significant differences
between the following five dependent variables among the five groups: Communicating
with Parents, F(4,335)= 2.48, p= .044; Understanding the School’s Evaluation Process,
F(4,335)= 3.49, p= .008; Dealing with Stress F(4,335)= 3.47, p= .009; Becoming Aware
of Special Benefits/Services Provided by the School District, F(4,335)= 3.60, p= .007;
and Completing Paperwork, F(4,335)= 4.00, p= .004. The null hypotheses were rejected
in these variables.

51
Table 4.1
Descriptive Statistics for Dependent Variables by Group – Very Low to Moderate
Very Low Low Moderate
M SD M SD M SD
Understanding of
Curriculum
2.99 1.20 2.96 1.20 2.62 1.20
Time Management 2.82 1.17 2.84 1.23 3.14 1.11
Observing/Reflecting
on Another Teacher’s
Instruction
2.48 1.16 2.35 1.16 2.57 1.24
Observing/Reflecting
on Mentor’s
Instruction
2.38 1.11 2.43 1.21 2.62 1.37
Observing/Reflecting
on My Own
Instruction
3.06 1.11 3.31 1.31 3.19 1.28
Co-Planning
Lessons/Units and
Assessments
2.48 1.34 2.57 1.38 2.38 1.28
Organizing and
Managing Classroom
2.59 1.18 2.81 1.34 2.86 1.39
Communicating with
Parents
2.40 1.09 2.63 1.18 2.57 1.08
Communicating with
Other Teachers
2.77 1.22 2.94 1.31 3.00 1.55
Communicating with
Administration
2.58 1.11 2.64 1.14 2.71 1.06
Discussing
Appropriate Strategies
for Students with
Special Needs (i.e.
IEPs, ENLs, etc.)
2.68 1.20 2.75 1.23 2.86 1.28
(Table 4.1 continues)

52
(Table 4.1 continued)
Using a Variety of
Teaching Methods
2.88 1.19 2.99 1.23 3.14 1.46
Administering
Standardized Tests
1.81 .962 2.03 1.05 2.24 1.14
Attending
Meetings/Professional
Development
Together
2.35 1.05 2.60 1.03 2.67 1.39
Understanding the
School’s Evaluation
Process
2.39 1.11 2.60 1.03 2.86 1.24
Dealing with Stress 2.26 1.26 2.64 1.36 2.95 1.50
Becoming Aware of
Special
Benefits/Services
Provided by the
School District
2.13 1.11 2.34 1.12 2.71 1.39
Completing
Paperwork
2.47 1.08 2.78 1.12 3.00 1.23
Note. M = Mean; SD = Standard Deviation.
Table 4.2
Descriptive Statistics for Dependent Variables – High, Very High, and Early-Career
High Very High Early-Career
Teachers
M SD M SD M SD
Understanding of
Curriculum
2.38 1.04 2.62 1.26 3.06 1.13
Time Management 2.46 1.27 2.62 1.61 2.99 1.19
Observing/Reflecting
on Another Teacher’s
Instruction
2.46 1.33 2.23 1.42 2.60 1.10
(Table 4.2 continues)

53
(Table 4.2 continued)
Observing/Reflecting
on Mentor’s
Instruction
2.08 1.32 2.00 1.47 2.51 1.14
Observing/Reflecting
on My Own
Instruction
3.15 1.28 3.00 1.35 3.27 1.18
Co-Planning
Lessons/Units and
Assessments
1.69 0.86 2.23 1.36 2.57 1.33
Organizing and
Managing Classroom
2.54 1.26 2.23 1.42 2.98 1.17
Communicating with
Parents
1.77 1.17 2.08 1.12 2.72 1.12
Communicating with
Other Teachers
2.38 1.04 2.69 1.44 3.06 1.23
Communicating with
Administration
2.08 0.86 2.23 1.17 2.83 1.01
Discussing
Appropriate Strategies
for Students with
Special Needs (i.e.
IEPs, ENLs, etc.)
2.62 1.04 2.69 1.25 2.99 1.07
Using a Variety of
Teaching Methods
3.00 1.41 2.69 1.25 3.14 1.19
Administering
Standardized Tests
1.62 0.65 1.85 0.69 2.01 1.02
Attending
Meetings/Professional
Development Together
2.00 0.71 2.23 0.93 2.56 1.03
Understanding the
School’s Evaluation
Process
1.62 0.77 2.31 1.11 2.77 1.10
Dealing with Stress 1.69 0.95 2.23 1.59 2.89 1.35
(Table 4.2 continues)

54
(Table 4.2 continued)
Becoming Aware of
Special
Benefits/Services
Provided by the School
District
1.46 0.78 1.77 1.17 2.52 1.15
Completing Paperwork 1.77 1.67 2.38 1.26 2.81 1.03
Note. M = Mean; SD = Standard Deviation.
However, ANOVAs revealed no significant difference between the following 13
dependent variables among the five groups: Understanding of Curriculum, F(4,335)=
1.36, p= .247; Time Management, F(4,335)= .76, p= .553; Observing/Reflecting on
Another Teacher’s Instruction, F(4,335)= .41, p= .804; Observing/Reflecting on
Mentor’s Instruction, F(4,335)= .82, p= .516; Observing/Reflecting on My Own
Instruction, F(4,335)= .78, p= .536; Co-Planning Lessons/Units/Assessments, F(4,335)=
1.40, p= .235; Organizing and Managing Classroom, F(4,335)= 1.11, p= .353;
Communicating with Other Teachers, F(4,335)= .86, p= .486; Communicating with
Administration F(4,335)= 1.16, p= .326; Discussing Appropriate Strategies for Students
with Special Needs, F(4,335)= .15, p= .962; Using a Variety of Teaching Methods,
F(4,335)= .41, p= .799; Administering Standardized Tests, F(4,335)= 1.76, p= .137; and
Attending Meetings/Professional Development Together, F(4,335)= 1.95, p= .101. The
null hypotheses were retained in these variables (See Table 4.3).
Because the ANOVAs led to a significant difference in group means on five of
the dependent variables, a post hoc Tukey analysis was conducted to investigate which of
the means were different among the five groups. Regarding communicating with parents,
the analysis revealed no significant differences among the five groups. Regarding
understanding the school’s evaluation process, the analysis revealed that participants in

55
the group of high percentage of economically disadvantaged students differed from both
moderate percentage of economically disadvantaged students (mean difference = 1.21, p
= .010) and low percentage of economically disadvantaged students (mean difference =
0.98, p = .016). Regarding dealing with stress, the analysis revealed no significant
differences among the five groups. Regarding becoming aware of special benefits and
services provided by the school district, the analysis revealed that participants in the
group of high percentage of economically disadvantaged students differed from the group
of moderate percentage of economically disadvantaged students (mean difference = 1.25,
p = .015). Finally, regarding completing paperwork, the analysis revealed that
participants in the group of high percentage of economically disadvantaged students
differed from both moderate percentage of economically disadvantaged students (mean
difference = 1.01, p = .018) and low percentage of economically disadvantaged students
(mean difference = 1.23, p = .017).
For the second sample, early-career teachers, ANOVAs revealed significant
difference of the following three dependent variables among the five groups:
Observing/Reflecting on Mentor’s Instruction, F(4,83)= 3.18, p= .018; Becoming Aware
of Special Benefits/Services Provided by the School District, F(4,83)= 2.89, p= .027; and
Completing Paperwork, F(4,83)= 3.20, p= .017. The null hypotheses were rejected in
these variables.
ANOVAs revealed no significant difference between the following 15 dependent
variables among the five groups: Understanding of Curriculum, F(4,83)= 1.96, p= .108;
Time Management, F(4,83)= 1.44, p= .228; Observing/Reflecting on Another Teacher’s
Instruction, F(4,83)= 1.78, p= .140; Observing/Reflecting on my Own Instruction,

56
F(4,83)= .78, p= .536; Co-Planning Lessons/Units/Assessments, F(4,83)= 1.68, p= .162;
Organizing and Managing Classroom, F(4,83)= 2.02, p= .100; Communicating with
Parents, F(4,83)= 2.42, p= .055; Communicating with Other Teachers, F(4,83)= 1.27, p=
.287; Communicating with Administration F(4,83)= 1.23, p= .303; Discussing
Appropriate Strategies for Students with Special Needs, F(4,83)= .70, p= .597; Using a
Variety of Teaching Methods, F(4,83)= .85, p= .500; Administering Standardized Tests,
F(4,83)= 2.25, p= .070; Attending Meetings/Professional Development Together,
F(4,83)= 1.80, p= .137; Understanding the School’s Evaluation Process, F(4,83)= 1.71,
p= .156; and Dealing with Stress F(4,83)= 1.66, p= .166. The null hypotheses were
retained in these variables (See Table 4.4).
Because the ANOVAs led to significant differences in group means on three of
the dependent variables, a post hoc Tukey analysis was conducted to investigate which of
the means were different among the five groups. Regarding observing and reflecting on
the mentor’s instruction, the analysis revealed that participants in the group of very high
percentage of economically disadvantaged students differed from low percentage of
economically disadvantaged students (mean difference = 1.55, p = .028). Regarding
becoming aware of special benefits and services provided by the school district, the
analysis revealed that participants in the group of very high percentage of economically
disadvantaged students differed from the group of moderate percentage of economically
disadvantaged students (mean difference = 1.68, p = .017); the low percentage of
economically disadvantaged students (mean difference = 1.50, p = .044); and the very
low percentage of economically disadvantaged students (mean difference = 1.68, p =
.017).

57
Table 4.3
One-Way ANOVA Results for All Teachers
(Table 4.3 continues)
DV1: Understanding of Curriculum
Source Sum of Squares df Mean Square F Sig
Between Groups 7.80 4 1.95 .14 .247
Within Groups 479.90 335 1.43
Total 487.70 339
DV2: Time Management
Source Sum of Squares df Mean Square F Sig
Between Groups 4.45 4 1.11 .76 .553
Within Groups 491.66 335 1.47
Total 496.11 339
DV3: Observing/Reflecting on Another Teacher’s Instruction
Source Sum of Squares df Mean Square F Sig
Between Groups 2.26 4 .56 .41 .804
Within Groups 464.91 335 1.39
Total 467.16 339
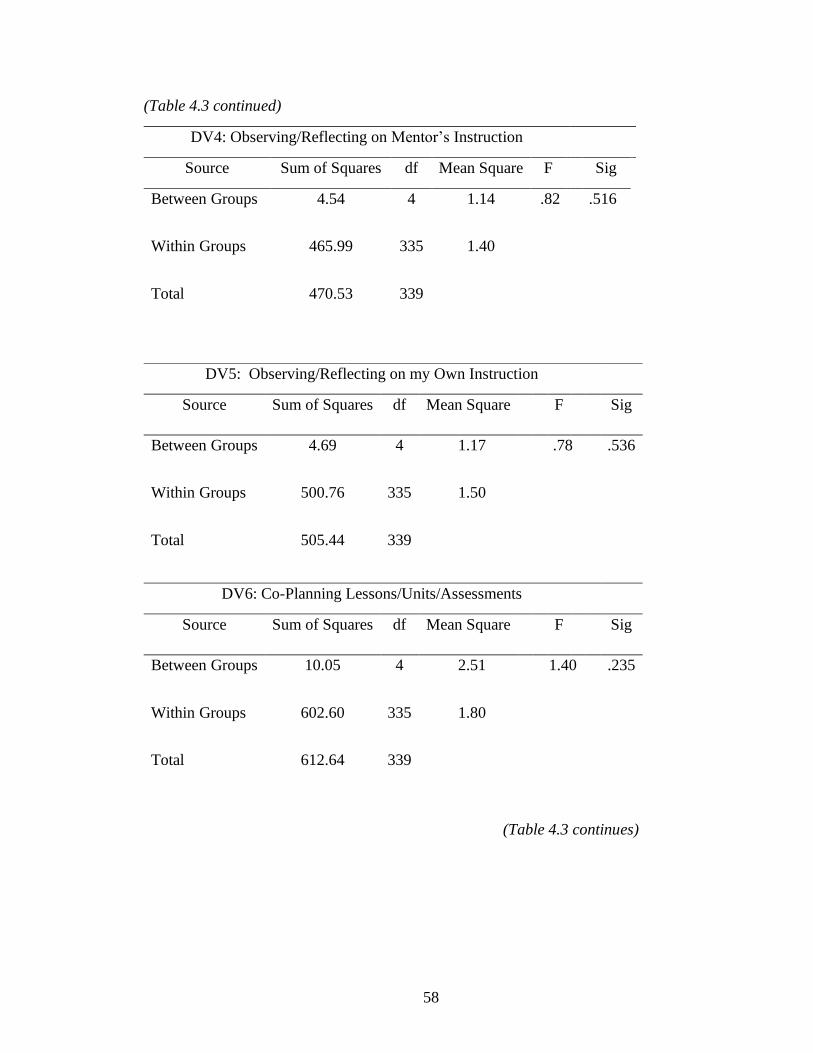
58
(Table 4.3 continued)
(Table 4.3 continues)
DV4: Observing/Reflecting on Mentor’s Instruction
Source Sum of Squares df Mean Square F Sig
Between Groups 4.54 4 1.14 .82 .516
Within Groups 465.99 335 1.40
Total 470.53 339
DV5: Observing/Reflecting on my Own Instruction
Source Sum of Squares df Mean Square F Sig
Between Groups 4.69 4 1.17 .78 .536
Within Groups 500.76 335 1.50
Total 505.44 339
DV6: Co-Planning Lessons/Units/Assessments
Source Sum of Squares df Mean Square F Sig
Between Groups 10.05 4 2.51 1.40 .235
Within Groups 602.60 335 1.80
Total 612.64 339

59
(Table 4.3 continued)
(Table 4.3 continues)
DV7: Organizing and Managing Classroom
Source Sum of Squares df Mean Square F Sig
Between Groups 7.18 4 1.80 1.11 .353
Within Groups 542.87 335 1.62
Total 550.06 339
DV8: Communicating with Parents
Source Sum of Squares df Mean Square F Sig
Between Groups 12.62 4 3.16 2.48 .044
Within Groups 425.96 335 1.27
Total 438.58 339
DV9: Communicating with Other Teachers
Source Sum of Squares df Mean Square F Sig
Between Groups 5.69 4 1.42 .86 .486
Within Groups 551.76 335 1.65
Total 557.44 339

60
(Table 4.3 continued)
(Table 4.3 continues)
DV10: Communicating with Administration
Source Sum of Squares df Mean Square F Sig
Between Groups 5.77 4 1.44 1.16 .326
Within Groups 414.93 335 1.24
Total 420.69 339
DV11: Discussing Appropriate Teaching Strategies
Source Sum of Squares df Mean Square F Sig
Between Groups .89 4 .22 .15 .962
Within Groups 494.43 335 1.48
Total 495.32 339
DV12: Using a Variety of Teaching Methods
Source Sum of Squares df Mean Square F Sig
Between Groups 2.53 4 .63 .41 .799
Within Groups 514.04 335 1.53
Total 516.58 339

61
(Table 4.3 continued)
(Table 4.3 continues)
DV13: Administering Standardized Tests
Source Sum of Squares df Mean Square F Sig
Between Groups 6.90 4 1.72 1.76 .137
Within Groups 328.80 335 1.53
Total 516.58 339
DV14: Attending Meetings/PD Together
Source Sum of Squares df Mean Square F Sig
Between Groups 8.66 4 2.17 1.95 .101
Within Groups 371.49 335 1.11
Total 380.15 339
DV15: Understanding the School’s Evaluation Process
Source Sum of Squares df Mean Square F Sig
Between Groups 16.16 4 4.04 3.49 .008
Within Groups 388.48 335 1.16
Total 404.64 339

62
(Table 4.3 continued)
DV16: Dealing with Stress
Source Sum of Squares df Mean Square F Sig
Between Groups 24.40 4 6.01 3.46 .009
Within Groups 581.26 335 1.74
Total 605.31 339
DV17: Becoming Aware of District Benefits/Services
Source Sum of Squares df Mean Square F Sig
Between Groups 18.24 4 4.56 3.60 .007
Within Groups 423.94 335 1.27
Total 442.17 339
DV18: Completing Paperwork
Source Sum of Squares df Mean Square F Sig
Between Groups 19.95 4 4.99 3.99 .004
Within Groups 418.23 335 1.25
Total 438.17 339

63
Table 4.4
One-Way ANOVA Results for Early-Career Teachers
(Table 4.4 continues)
DV1: Understanding of Curriculum
Source Sum of Squares df Mean Square F Sig
Between Groups 9.57 4 2.39 1.96 .108
Within Groups 101.14 83 1.22
Total 110.71 87
DV2: Time Management
Source Sum of Squares df Mean Square F Sig
Between Groups 7.98 4 1.99 1.44 .228
Within Groups 115.01 83 1.39
Total 122.99 87
DV3: Observing/Reflecting on Another Teacher’s Instruction
Source Sum of Squares df Mean Square F Sig
Between Groups 8.32 4 2.07 1.78 .140
Within Groups 96.76 83 1.17
Total 111.98 87

64
(Table 4.4 continued)
(Table 4.4 continues)
DV4: Observing/Reflecting on Mentor’s Instruction
Source Sum of Squares df Mean Square F Sig
Between Groups 14.87 4 3.72 3.18 .018
Within Groups 97.12 83 1.17
Total 111.99 87
DV5: Observing/Reflecting on my Own Instruction
Source Sum of Squares df Mean Square F Sig
Between Groups 6.51 4 1.63 1.18 .328
Within Groups 114.94 83 1.39
Total 121.46 87
DV6: Co-Planning Lessons/Units/Assessments
Source Sum of Squares df Mean Square F Sig
Between Groups 11.51 4 2.87 1.68 .162
Within Groups 142.07 83 1.71
Total 153.59 87

65
(Table 4.4 continued)
(Table 4.4 continues)
DV7: Organizing and Managing Classroom
Source Sum of Squares df Mean Square F Sig
Between Groups 10.61 4 2.65 2.02 .100
Within Groups 109.33 83 1.31
Total 119.95 87
DV8: Communicating with Parents
Source Sum of Squares df Mean Square F Sig
Between Groups 11.47 4 2.86 2.42 .055
Within Groups 98.42 83 1.18
Total 109.89 87
DV9: Communicating with Other Teachers
Source Sum of Squares df Mean Square F Sig
Between Groups 7.55 4 1.89 1.27 .287
Within Groups 123.16 83 1.48
Total 130.72 87

66
(Table 4.4 continued)
(Table 4.4 continues)
DV10: Communicating with Administration
Source Sum of Squares df Mean Square F Sig
Between Groups 4.97 4 1.24 1.23 .303
Within Groups 83.48 83 1.01
Total 88.44 87
DV11: Discussing Appropriate Teaching Strategies
Source Sum of Squares df Mean Square F Sig
Between Groups 3.21 4 .80 .70 .597
Within Groups 95.78 83 1.15
Total 98.99 87
DV12: Using a Variety of Teaching Methods
Source Sum of Squares df Mean Square F Sig
Between Groups 4.79 4 1.19 .85 .500
Within Groups 117.57 83 1.41
Total 122.36 87

67
(Table 4.4 continued)
(Table 4.4 continues)
DV13: Administering Standardized Tests
Source Sum of Squares df Mean Square F Sig
Between Groups 8.91 4 2.23 2.25 .070
Within Groups 82.08 83 .99
Total
90.99 87
DV14: Attending Meetings/PD Together
Source Sum of Squares df Mean Square F Sig
Between Groups 7.32 4 1.83 1.80 .137
Within Groups 84.40 83 1.02
Total 91.72 87
DV15: Understanding the School’s Evaluation Process
Source Sum of Squares df Mean Square F Sig
Between Groups 8.01 4 2.00 1.71 .156
Within Groups 97.44 83 1.17
Total 105.46 87

68
(Table 4.4 continued)
DV16: Dealing with Stress
Source Sum of Squares df Mean Square F Sig
Between Groups 11.79 4 2.94 1.66 .166
Within Groups 147.07 83 1.77
Total 158.86 87
DV17: Becoming Aware of District Benefits/Services
Source Sum of Squares df Mean Square F Sig
Between Groups 14.18 4 3.55 2.89 .027
Within Groups 101.77 83 1.22
Total 115.95 87
DV18: Completing Paperwork
Source Sum of Squares df Mean Square F Sig
Between Groups 12.27 4 3.06 3.21 .017
Within Groups 79.43 83 .95
Total 91.71 87

69
Research Question 2: To what extent is there a correlation between specific mentoring
practices and early-career teachers’ job satisfaction?
Eighteen Pearson’s Correlations were run to determine if any of the 18
independent variables, meaning the 18 mentoring activities, were correlated with job
satisfaction of early-career teachers. Results indicated significant positive correlations
with job satisfaction among the following 16 independent variables in order from
strongest significant positive correlation to weakest significant positive correlation:
Understanding the School’s Evaluation Process, r(84)= .36, p= .001; Time Management,
r(84)= .35, p= .001; Understanding of Curriculum, r(84)= .34, p= .001;
Observing/Reflecting on Mentor’s Instruction, r(84)= .33, p= .002; Observing/Reflecting
on my Own Instruction, r(84)= .32, p= .003; Completing Paperwork, r(86)= .31, p= .003;
Using a Variety of Teaching Methods, r(84)= .30, p= .005; Discussing Appropriate
Strategies for Students with Special Needs, r(84)= .30, p= .005; Dealing with Stress
r(86)= .29, p= .006; Co-Planning Lessons/Units/Assessments, r(84)= .27, p= .011;
Becoming Aware of Special Benefits/Services Provided by the School District, r(84)=
.27, p= .012; Organizing and Managing Classroom, r(84)= .27, p=.013; Communicating
with Parents, r(84)= .25, p= .019; Observing/Reflecting on Another Teacher’s
Instruction, r(84)= .25, p= .023; Communicating with Administration r(84)= .24, p=
.026; and Attending Meetings/Professional Development Together, r(84)= .24, p= .026.
The null hypotheses were rejected in these variables.
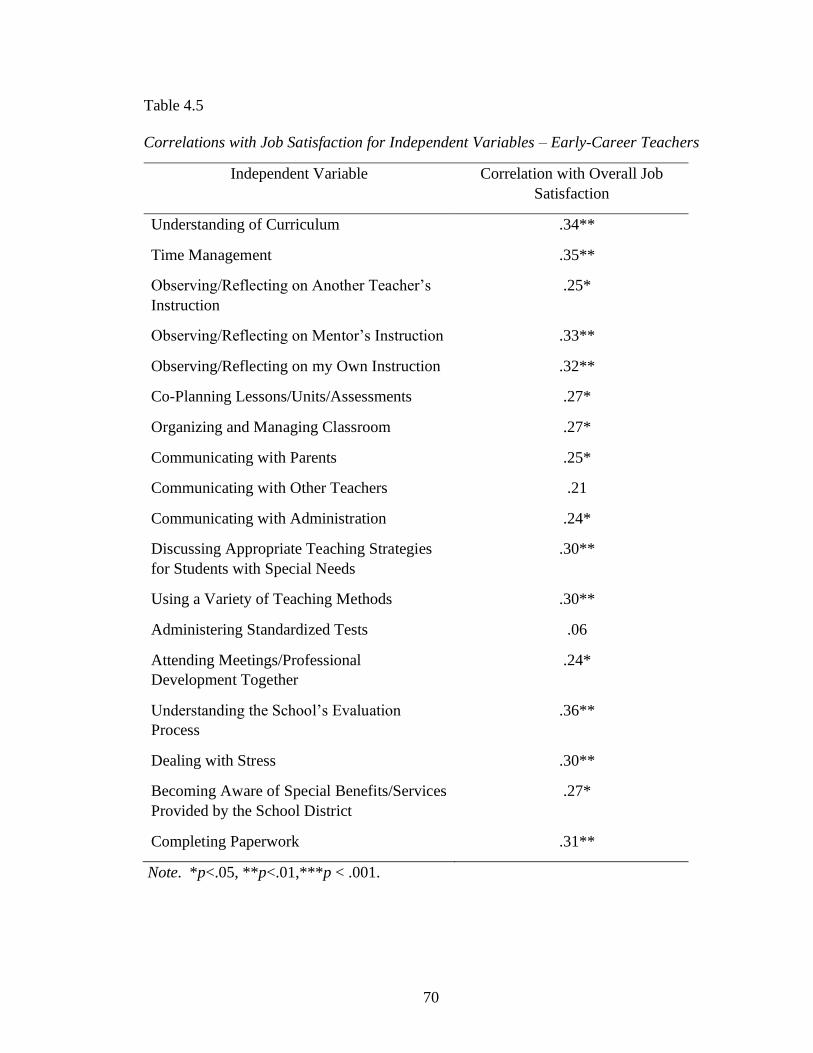
70
Table 4.5
Correlations with Job Satisfaction for Independent Variables – Early-Career Teachers
Independent Variable Correlation with Overall Job
Satisfaction
Understanding of Curriculum .34**
Time Management .35**
Observing/Reflecting on Another Teacher’s
Instruction
.25*
Observing/Reflecting on Mentor’s Instruction .33**
Observing/Reflecting on my Own Instruction .32**
Co-Planning Lessons/Units/Assessments .27*
Organizing and Managing Classroom .27*
Communicating with Parents .25*
Communicating with Other Teachers .21
Communicating with Administration .24*
Discussing Appropriate Teaching Strategies
for Students with Special Needs
.30**
Using a Variety of Teaching Methods .30**
Administering Standardized Tests .06
Attending Meetings/Professional
Development Together
.24*
Understanding the School’s Evaluation
Process
.36**
Dealing with Stress .30**
Becoming Aware of Special Benefits/Services
Provided by the School District
.27*
Completing Paperwork .31**
Note. *p<.05, **p<.01,***p < .001.

71
Results indicated no significant positive correlation with job satisfaction among
the following two independent variables: Communicating with Other Teachers, r(86)=
.21, p= .055; and Administering Standardized Tests, r(84)= .06, p= .570; the null
hypotheses were retained in these variables (See Table 4.5).
Research Question 3: To what extent is teacher satisfaction correlated with mentor
activities and mentor relationship? Does this correlation vary by percentage of
economically disadvantaged students?
In analyzing early-career teachers, 13 Pearson’s Correlations were run to
determine if any of the 12 independent variables, meaning the 12 aspects of mentoring
relationship and composite mentoring relationship, were correlated with job satisfaction,
and whether or not those correlations were stronger than the independent variables in
mentoring activities. Results indicated strong positive correlation in all 13 aspects of
relationship: My mentor was accessible, r(84)= .48, p < .001; My mentor demonstrated
professional integrity, r(84)= ..52, p < .001; My mentor demonstrated content expertise in
my area of need, r(84)= .38, p < .001; My mentor was approachable, r(84)= .53, p <
.001; My mentor was supportive and encouraging, r(84)= .59, p < .001; My mentor
provided constructive and useful critiques of my work, r(86)= .58, p < .001; My mentor
motivated me on how to improve my work product, r(84)= .55, p < .001; My mentor was
useful in providing direction in professional issues, r(84)= .57, p < .001; My mentor
answered my questions satisfactorily, r(84)= .52, p < .001; My mentor acknowledged my
contributions appropriately, r(84)= .51, p < .001; My mentor suggested appropriate
resources, r(84)= .47, p < .001; My mentor challenged me to extend my abilities, r(84)=
.54, p < .001; and composite mentoring relationship, r(84)= .58, p < .001. It should be

72
noted that all correlations for mentor relationship were statistically significant at the .001
level and that all correlations for the independent variables for mentoring relationship
were stronger than any of the correlations for the independent variables for mentoring
activities (See Table 4.6). The null hypothesis was rejected. Quality of the mentor-mentee
relationship more strongly correlated with job satisfaction than with any mentor-mentee
activity for early-career teachers.
In a Pearson’s correlational analysis of all teachers surveyed, the mentoring
activity most strongly correlated to job satisfaction was Understanding of Curriculum,
r(324)= .22, p < .001; the second strongest activity most strongly correlated with job
satisfaction was Co-Planning Lessons/Units/Assessments, r(324)= .15, p = .008. Upon a
further correlational analysis of all teachers surveyed, six of the 12 aspects of mentoring
relationship were more strongly correlated with job satisfaction than Understanding of
Curriculum: My mentor was accessible, r(324)= .23, p < .001; My mentor demonstrated
professional integrity, r(324)= .24, p < .001; My mentor was approachable, r(324)= .23, p
< .001; My mentor was supportive and encouraging, r(324)= .26, p < .001; My mentor
motivated me on how to improve my work product, r(324)= .23, p < .001; and My
mentor was useful in providing direction in professional issues, r(324)= .23, p < .001.
Additionally, the correlation of composite mentoring relationship score with job
satisfaction, r(324)= .25, p < .001 was stronger than with the correlation between
Understanding of Curriculum and job satisfaction.

73
Table 4.6
Correlations with Job Satisfaction for Mentoring Relationship – Early-Career Teachers
Independent Variable Correlation with Overall Job
Satisfaction
My mentor was accessible. .48***
My mentor demonstrated professional
integrity
.52***
My mentor demonstrated content expertise in
my area of need.
.38***
My mentor was approachable. .53***
My mentor was supportive and encouraging. .59***
My mentor provided constructive and useful
critiques of my work.
.58***
My mentor motivated me to improve my
work product.
.55***
My mentor was useful in providing direction
on professional issues.
.57***
My mentor answered my questions
satisfactorily.
.52***
My mentor acknowledged my contributions
appropriately.
.51***
My mentor suggested appropriate resources. .47***
My mentor challenged me to extend my
abilities.
.54***
Composite Relationship .58***
_____________________________________________________________________
Note. *p<.05, **p<.01, ***p < .001.
The other six aspects of mentoring relationship were more strongly correlated
with job satisfaction than Co-Planning Lessons/Units/Assessments: My mentor
demonstrated content expertise in my area of need, r(324)= .17, p = .002; My mentor

74
provided constructive and useful critiques of my work, r(324)= .20, p < .001;My mentor
answered my questions satisfactorily, r(324)= .19, p = .001; My mentor acknowledged
my contributions appropriately, r(324)= .21, p < .001; My mentor suggested appropriate
resources, r(324)= .20, p < .001; and my mentor challenged me to extend my abilities,
r(324)= .20, p < .001; and composite mentoring relationship, r(84)= .58, p < .001. Results
indicated a stronger significant correlation with job satisfaction and the mentoring
relationship than with mentoring activities for all teachers, and, once again the null
hypothesis was rejected. The quality of the mentor-mentee relationship more strongly
correlated with job satisfaction for all teachers.
After disaggregating the data for percentage of economically disadvantaged
students, Pearson’s correlational analyses determined other noteworthy correlations.
From the group with a very low percentage of economically disadvantaged students,
compositive relationship was not statistically significant with job satisfaction r(252)= .02,
p = .810. Eight elements of mentoring activities were more strongly positively correlated
with job satisfaction than with composite mentoring relationship: Understanding of
Curriculum, r(252)= .26, p = .001; Time Management, r(252) = .08, p = .332;
Observing/Reflecting on my Own Instruction, r(252)= .16, p = .001; Co-Planning
Lessons/Units/Assessments, r(252)= .153, p = .06; Organizing and Managing Classroom,
r(252)= .09, p = .294; Communicating with Other Teachers, r(252)= .02, p = .776, Using
a Variety of Teaching Methods, r(252)= .09, p = .268; and Dealing with Stress r(252)=
.05, p = .541.
From the group with a low percentage of economically disadvantaged students,
composite relationship was statistically significant in relation to job satisfaction r(126) =

75
.33, p < .001. All 18 mentoring activities were more weakly correlated with job
satisfaction than composite relationship, with the strongest of those elements being
Observing/Reflecting on Mentor’s Instruction, r(126) = .21, p = .017.
From the group with a medium percentage of economically disadvantaged
students, composite relationship was statistically significant in relation to job satisfaction
r(18) = .51, p = .021. Five mentoring activities were more strongly correlated with job
satisfaction than was composite relationship: Co-Planning Lessons/Units/Assessments,
r(18) = .60, p = .005; Organizing and Managing Classroom, r(18) = .61, p = .004;
Communicating with Parents, r(18) = .54, p = .015; Administering Standardized Tests,
r(18) = .57, p = .005; and Understanding the School’s Evaluation Process, r(18) = .52,
p = .019.
From the group with a high percentage of economically disadvantaged students,
composite relationship was not statistically significant in relation to job satisfaction r(11)
= .46, p = .115. Two mentoring activities were more strongly positively correlated with
job satisfaction than was composite relationship, although neither were a statistically
significant correlations: Observing/Reflecting on Another Teacher’s Instruction, r(11) =
.51, p = .076; and Observing/Reflecting on Mentor’s Instruction, r(11) = .49, p = .091.
Finally, from the group with a very high percentage of economically
disadvantaged students, composite relationship was not statistically significant in relation
to job satisfaction r(11) = .32, p = .280. However, only one mentoring activity was more
strongly positively correlated with job satisfaction than was composite relationship;
although the correlation was also not statistically significant: Observing/Reflecting on
Another Teacher’s Instruction, r(11) = .43, p = .141 (See table 4.7).

76
Table 4.7
Correlations with Job Satisfaction – Disaggregated by Percentage of Economically
Disadvantaged Students
All Very
Low
Low Mod. High Very
High
Understanding of
Curriculum
.22*** .26** .18* .48* .28 -.25
Time Management .14* .08 .14 .45* .42 -.02
Observing/Reflecting on
Another Teacher’s
Instruction
.12* -.03 .11 .51* .51 .43
Observing/Reflecting on
Mentor’s Instruction
.14* -.02 .21* .28 .48 .15
Observing/Reflecting on my
Own Instruction
.14* .16* .17 .18 .01 -.07
Co-Planning
Lessons/Units/Assessments
.15** .15 .08 .60** .06 .13
Organizing and Managing
Classroom
.12* .09 .12 .61** -.11 -.16
Communicating with
Parents
.03 -.07 .06 .54* -.26 .03
Communicating with Other
Teachers
.09 .02 .14 .50* -.22 -.04
Communicating with
Administration
.02 -.01 .08 .30 -.56* -.18
Discussing Appropriate
Teaching Strategies for
Students with Special Needs
.07 -.04 .15 .42 -.06 .13
Using a Variety of Teaching
Methods
.12* .09 .14 .51* -.17 -.14
Administering Standardized
Tests
.01 -.06 -.03 .57** .19 .14
(Table 4.7 continues)

77
(Table 4.7 continued)
Attending
Meetings/Professional
Development Together
.08 -.07 .16 .50* -.02 .09
Understanding the School’s
Evaluation Process
.08 -.05 .15 .52 .06 .03
Dealing with Stress .08 .05 .14 .34 -.13 -.08
Becoming Aware of Special
Benefits/Services Provided
by the School District
.03 -.10 .11 .47* -.34 -.15
Completing Paperwork .04 -.01 .03 .40 .17 -.06
My mentor was accessible. .23*** .03 .33** .35 .46 .14
My mentor demonstrated
professional integrity
.24*** .05 .32** .40 .48 .25
My mentor demonstrated
content expertise in my area
of need.
.17** .11 .16 .59** .27 -.05
My mentor was
approachable.
.23*** .01 .30** .29 .74** .28
My mentor was supportive
and encouraging.
.26*** -.05 .35** .25 .70** .51
My mentor provided
constructive and useful
critiques of my work.
.20** .04 .23* .57** .36 .30
My mentor motivated me to
improve my work product.
.23*** .04 .29** .61** .32 .34
My mentor was useful in
providing direction on
professional issues.
.23*** .00 .35** .41 .37 .42
My mentor answered my
questions satisfactorily.
.19** -.11 .38** .33 .43 .08
(Table 4.7 continues)

78
(Table 4.7 continued)
My mentor acknowledged
my contributions
appropriately.
.21** .01 .28** .22 .43 .37
My mentor suggested
appropriate resources.
.20** -.01 .31** .57** .43 .26
My mentor challenged me
to extend my abilities.
.20** .03 .30** .48* .09 .32
Composite Relationship .25*** .02 .33*** .51* .46 .32
Note. *p<.05, **p<.01, ***p < .001.
Summary
This chapter analyzed research data obtained through nine K-12 school districts
and one regional site across Long Island, with schools consisting of various percentages
of economically disadvantaged students. The results were compiled from 651 responses
generated from the survey sent to K-12 teachers across Long Island. The data were
analyzed to determine whether there were significant differences in mentoring activities
among the five groups of varying economically disadvantaged students. Most of the
dependent variables indicated no significant differences in mentoring activities among the
five groups; although there were significant differences between two or three groups in
eight of the 36 dependent variables.
After Pearson’s correlational analyses were conducted, it was determined that
there were a number of mentor-mentee activities that had a statistically significant
positive correlation with job satisfaction for early-career teachers, with the top three
being understanding the school’s evaluation process, time management, and
understanding of curriculum. However, after another Pearson’s correlational analysis was
79
run, it was determined that all aspects of mentoring relationships had stronger positive
correlations with job satisfaction than did mentor-mentee activities among early career
teachers.
This result remained consistent for all teachers surveyed; mentoring relationship
had a stronger positive correlation with job satisfaction than did any mentor-mentee
activities. Moreover, when disaggregated for percentage of economically disadvantaged
students, composite mentoring relationship was still more highly correlated with job
satisfaction than most of the mentor-mentee activities, the one exception being the group
with a very low percentage of economically disadvantaged students. The next chapter
will discuss the potential implications of these findings.
80
CHAPTER 5
Discussion
The purpose of this study was twofold: first, it aimed to add to the existing body
of literature on mentoring for early-career teachers; second, it aimed to provide data-
driven suggestions to schools and school districts to improve and enhance their
mentoring programs. The researcher gathered participants in this study using
convenience sampling. Participants were recruited via approval from various school
superintendents in November and December of 2019, and participants took the survey
in January of 2020. After data were collected, the researcher used SPSS to perform
various quantitative analyses of both descriptive and inferential statistics. After running
the analyses, the researcher arrived at the conclusions and implications explained on the
following pages.
Implications of Findings
The first research question addressed the degree to which mentoring activities
differ in schools with higher percentages of economically disadvantaged students. The
results of the ANOVAs indicated only five significant differences out of a possible 180.
These results suggested that activities in which mentors and mentees engage were
consistent across varying degrees of economically disadvantaged students. Although
much literature suggests that mentors should engage in a wide variety of activities with
their mentees (Lipton & Wellman, 2003), the data collected suggested that this was not
happening. Moreover, although understanding the school’s evaluation process was, by
far, the activity most strongly correlated with job satisfaction among early-career
teachers, this activity was in the bottom half of frequency of occurrence. The most

81
commonly occurring mentor-mentee activity, the mentor observing the mentee teach
and reflect on instruction, was less strongly correlated with job satisfaction than was the
mentee watching the mentor teach.
The second research question examined the extent to which there is a correlation
between specific mentoring practices and early-career teachers’ job satisfaction. When
examined in conjunction with the first question, the results suggested that although
some mentor-mentee activities were more strongly correlated with job satisfaction than
were others, these activities were not conducted with the same frequency as were
activities with a weaker correlation with job satisfaction. Essentially, when examining
the data from both research questions in conjunction with each other, the activities with
the strongest correlation with job satisfaction were, generally, not the activities in
which mentors and mentees engage, and this was consistent across all degrees of
economically disadvantaged schools.
The third research question examined the extent to which teacher satisfaction
correlated with mentor activities and the mentor relationship as well as whether or not
this correlation varied by percentage of economically disadvantaged students. Results
showed that, in almost all instances, with the exception of schools with a low
percentage of economically disadvantaged students, the strength of the mentor-mentee
relationship was generally stronger than was any specific activity in which mentors and
mentees engaged. Since a strong mentor-mentee relationship had a strong correlation
with job satisfaction, these results suggested a need for the mentor-mentee relationship
to have primacy when designing a school’s new teacher development program.

82
Table 5.1
Comparison of Four Weakest Correlations of Mentor Relationship and Four Strongest
Mentoring Activities with Job Satisfaction among Early-Career Teachers
Independent
Variable –
Relationship
Correlation with
Overall Job
Satisfaction
Independent
Variable-
Activity
Correlation with
Overall Job
Satisfaction
My mentor
demonstrated
content expertise.
.38*** Understanding
the School’s
Evaluation
Process
.36**
My mentor
suggested
appropriate
resources.
.47*** Time
Management
.35**
My mentor was
accessible
.48*** Understanding of
Curriculum
.34**
Composite
Relationship Score
.58*** Observing and
Reflecting on
Mentor’s
Instruction
.33**
Note. *p<.05, **p<.01,***p < .001.
Finally, as mentioned in the previous chapter, when examining the survey results
for early-career teachers, all aspects of mentor-mentee relationship had a stronger
correlation with job satisfaction than all mentor-mentee activities. Table 5.1 above
illustrates this. These results suggest that the strength of the mentor-mentee relationship
has a stronger correlation with job satisfaction than any of the activities in which
mentors and mentees engage.

83
Ancillary Findings
After the researcher ran the numbers to answer his research questions, he also
conducted a number of other inferential statistical analyses out of curiosity. Upon
conducting an independent samples t-test, the researcher found that only 87% of early-
career teachers received a mentor, in spite of new-teacher mentoring becoming
mandatory through a 2004 regulation (NYSED, 2004). T-test results indicated a
statistically significant difference in composite job satisfaction between early-career
teachers who were mentored (mean = 38.90, SD = 7.09) and those who were not
mentored (mean = 31.88, SD = 8.41), t(97) = 3.26, p = .002. The results suggested that
early-career teachers who were mentored were significantly more satisfied with their job
when compared to those who were not mentored.
Relationship to Prior Research
Upon completion of the study, the researcher noted a number of findings that
connect with the existing body of research, literature on effective mentoring practices,
and the theoretical frameworks guiding this study.
An appropriate place to begin this discussion is with the suggested mentoring
practices from pages 9-12. The results of this study, specifically, the fact that the mentor-
mentee relationship was more strongly correlated with job satisfaction and the fact that
understanding of curriculum was the mentoring activity most strongly correlated with job
satisfaction among early-career teachers, aligned with Grossman and Davis’ (2012)
findings that to meet the individual needs of new teachers, mentors must balance both
instructional content and emotional needs. Furthermore, the findings of this study also

84
build upon Weisling and Gardiner’s (2018) recommendation that, in mentoring, the
relationship should be put first. Finally, the findings of this study echo the NEA’s (1999)
findings that trust must be built in the mentor-mentee relationship, as the results of this
study indicated a significant positive correlation between the mentor’s perceived personal
integrity and job satisfaction.
The results of this study also connect to the work done by the New Teacher
Center (2018). As discussed in Chapter 2, their work focuses on three approaches to
mentoring: instructive, collaborative, and facilitative. Activities that lend themselves to
each of the three approaches (for example, co-planning would fall into the collaborative
category) were present in the significant findings. This suggests that no singular
repertoire that mentors should focus on more with their mentees exists. All three
approaches have value.
Finally, the results connect to both the theory of teacher development (Ingersoll &
Strong, 2011) and Seligman’s theories of learned helplessness (1972) and learned
optimism (1991). As explained in Chapter 2, Ingersoll & Strong discuss how a quality
mentoring program will lead to improved practice and teacher retention. The data
collected and analyzed supports this theory. However, it is important to note that the
results of this study only show a correlation between quality mentoring and job
satisfaction; the study did not examine whether or not mentoring was a direct cause of job
satisfaction.
The questions posed in the final section of the survey were indicative of
participants’ views on their jobs. It would stand to reason that the more satisfied a teacher
is with their job, the more optimistic they are in their position, and the less likely they

85
would be to leave the profession. The facets mentioned in the mentoring relationship
section of the survey help to foster optimism, which could explain why elements of the
mentoring relationship were more strongly correlated with job satisfaction than were any
of the prescribed mentor-mentee activities. Fostering optimism likely leads to happier,
healthier teachers, which can, ultimately, lead to more improved student outcomes.
Limitations of the Study
One major limitation of the study was the limited sample size, particularly in
areas with a high or very high percentage of economically disadvantaged students.
Limited sample size decreases statistical power and could have led to type-II errors
(Coladarci, et.al., 2008), which might have been why so many of the null hypotheses
were retained. Additionally, this might have also had an effect on the lack of significance
from the correlation coefficients from the categories with higher percentages of
economically disadvantaged students.
A second limitation of the study was that it only focused on nine districts on Long
Island and one regional support center. Although the nine districts had varying degrees of
economically disadvantaged students, none of the districts were rural, and, as such, these
results could not be generalized to a rural population. Furthermore, the economic
standings of the districts might have been a confounding variable. Teachers could be
satisfied not because of their mentoring, but because of the quality of support they
received from parents, school administrators, district administrators, the teachers’ union,
and the human resource department.
Finally, a third limitation of the study was that the instrument used to collect data
was a survey. Since the survey required teachers to recall their perceptions of both the

86
quality and the quantity of mentoring experiences that might have occurred many years
ago, there is the possibility that these perceptions had become skewed or confabulated
with the passage of time.
Recommendations for Future Practice
Upon arriving at the conclusions listed above, the researcher contacted all
participating district superintendents to provide them with an executive summary of the
key findings of the study, as well as with recommendations for future practice to enhance
the mentoring programs at their schools, with the aim of building capacity in early-career
teachers, which could, ultimately, lead to improved student outcomes. The
recommendations are listed in order of importance.
First and foremost, schools, districts, and/or unions should mindfully choose
mentors for new-teacher mentees that possess acumen in building relationships with
people; this would assist the mentee in fostering relationships with not just the mentor,
but with all stakeholders in the school. Since the research suggested that, in general, the
strength of the mentor-mentee relationship was more strongly correlated with job
satisfaction than with any specific activity in which mentors and mentees engaged,
schools and school districts should act to employ mentors who are known for the
connections they make with people.
Next, schools and school districts should, when possible, select mentors who both
work in the same building as the mentee and teach in the same subject area as the mentee.
The results of the survey indicated that the mentor-mentee activities most strongly
correlated with job satisfaction were understanding the school’s evaluation process, time
management, curriculum planning, and observing the mentor teach. If a new teacher’s

87
mentor were in the same subject area and effective, that mentor would be able to address
all of those activities.
Finally, schools and school districts should act to design programs and activities
that foster growth in the mentor-mentee relationship, such as monthly luncheons, team-
building activities, and professional development. Doing so would provide more time for
mentors and mentees to use meaningful activities to build a connection.
As mentioned in chapter two, districts are required by law to have a mentoring
program as part of their professional development plan, and this plan must be created in
collaboration with the teachers’ union (NYSUT, 2012). If both mentor and mentee
development are already required components of a district’s professional development
plan, it follows that the results in chapter four would be beneficial to the development of
both mentors and mentees. As such, the researcher sent out an executive summary of the
key results and recommendations to the superintendents of each of the districts that
participated in this study, encouraging them to forward this information to colleagues.
Furthermore, at the time of this writing, the researcher received an invitation to deliver
professional development for mentors in his district’s mentor training program, thereby
potentially enhancing both mentor and mentee development.
Recommendations for Future Research
After reviewing the literature, conducting the study, drawing conclusions, and
making recommendations for improvement in mentoring programs, the researcher
identified further gaps in the literature, which will be addressed below with
recommendations for future studies.

88
First, the researcher recommends that a qualitative study be conducted with new-
teacher mentors and mentees to better understand the nuances of the mentor-mentee
relationship. Bogdan and Bilken (2016) posit that qualitative studies provide more
context in a naturalistic setting. Educational researchers may be able to gather further
insight to the mentoring process through interviews and observations of new teachers and
their mentors.
Second, the researcher recommends that studies be conducted on informal
mentors, the veteran teachers without a formal title who serve as guides and friends for
first-year teachers who may not have a positive relationship with their assigned mentor. It
might be interesting and beneficial if relationships with informal mentors are more
strongly correlated with job satisfaction than is the relationship with the formal mentor.
Finally, the researcher recommends that the study be replicated in urban districts,
such as the New York City Department of Education. Since the researcher conducted the
study on Long Island, an additional replicative study is recommended to examine the
correlation of mentoring with job satisfaction in urban districts. With attrition rates being
50% higher in Title I schools (Carver-Thomas & Darling-Hammond, 2017) when
compared with their suburban counterparts, it may be of value to know how strongly
mentor-mentee activities and mentor-mentee relationship are correlated with job
satisfaction in these areas of highest need.
Conclusion
While this study was conducted in a scientifically ethical fashion, it was fueled by
the researcher’s frustrations with new teacher development, in particular his own negative
experiences being mentored in his first year. Although a significant amount of research

89
and literature exist on the benefits of new-teacher mentoring, as well as on best practices
for new teacher-mentoring, and a substantial amount of funding is allocated for new-
teacher mentoring in all districts in New York State, the findings of this study suggested
that the research, literature, and best practices are largely ignored. This needs to change.
Where does mentoring matter most? It matters everywhere. However, it is the way in
which new teachers are mentored that will ultimately determine their approach to this
relentlessly challenging profession, thereby either enhancing or diminishing the quality of
students’ education.

90
APPENDIX A
Institutional Research Board Approval
Federal Wide Assurance: FWA00009066
Nov 14, 2019 3:31 PM EST
PI: Zachary Boyt
CO-PI: Stephen Kotok
Dept: Ed Admin & Instruc Leadership
Re Initial - IRB-FY2020-225 WHERE DOES MENTORING MATTER MOST?
TEACHERS’ PERCEPTIONS OF THEIR FIRST-YEAR MENTORING
EXPERIENCES AND THEIR EFFECT ON JOB SATISFACTION AMONG
ECONOMICALLY DIVERSE SCHOOLS
Dear Zachary Boyt:
The St John's University Institutional Review Board has rendered the decision below
for WHERE DOES MENTORING MATTER MOST? TEACHERS’ PERCEPTIONS
OF THEIR FIRST-YEAR MENTORING EXPERIENCES AND THEIR EFFECT ON
JOB SATISFACTION AMONG ECONOMICALLY DIVERSE SCHOOLS.
Decision: Exempt
PLEASE NOTE: If you have collected any data prior to this approval date, the data
needs to be discarded.
Selected Category: Category 1. Research, conducted in established or commonly
accepted educational settings, that specifically involves normal educational practices
that are not likely to adversely impact students’ opportunity to learn required
educational content or the assessment of educators who provide instruction. This
includes most research on regular and special education instructional strategies, and
research on the effectiveness of or the comparison among instructional techniques,
curricula, or classroom management methods.
Sincerely,
Raymond DiGiuseppe, PhD, ABPP
Chair, Institutional Review Board

91
Professor of Psychology
Marie Nitopi, Ed.D.
IRB Coordinator

92
APPENDIX B
Survey
Where Does Mentoring Matter Most?
THANK YOU FOR TAKING THIS BRIEF (5 TO 7 MINUTE) SURVEY ON YOUR EXPERIENCES OF
BEING MENTORED. PLEASE ANSWER ALL QUESTIONS TO THE BEST OF YOUR RECOLLECTION.
REMEMBER THAT ALL RESPONSES ARE BOTH ANONYMOUS AND CONFIDENTIAL!
SECTION 1 OF 4: BACKGROUND
What is your Gender?
o Male
o Female
o Other
At what level do you currently teach during the regular school year? Check all that apply.
▢ Elementary School
▢ Middle School
▢ High School

93
How many years have you been teaching overall? Include this year.
o 1 to 5 Years
o 5 to 16 Years
o More than 16 Years
What percentage of students at your school are economically disadvantaged? REFER TO THE
ATTACHED DOCUMENTS BELOW IF YOU ARE UNSURE. Districts in each county are alphabetical,
and to ensure your responses remain anonymous, every school in every district has been listed!
NASSAU COUNTY Percent Economically Disadvantaged 2019
SUFFOLK COUNTY Percent Economically Disadvantaged 2019
o 0 to 19.999 percent
o 20 to 39.999 percent
o 40 to 59.999 percent
o 60 to 79.999 percent
o 80 to 99.999 percent
As a first-year teacher, did you receive a formal mentor?
o Yes
o No

94
SECTION 2 OF 4: MENTORING ACTIVITIES
(Adapted from How to Help Beginning Teachers Succeed (2nd Edition) by Stephen P Gordon.
Copyright 2000, ASCD. Used with permission.)
To what extent would you say you engaged in the following activities with your mentors? Think
only of your experience with your mentor during your first year of teaching.
Never
Once or
Twice
Ever
Once or
Twice A
Month
Once Or
Twice A
Week
Daily or
Almost
Daily
Understanding of
Curriculum o o o o o
Time Management o o o o o
Observing/Reflecting on
another teacher's
instruction o o o o o
Observing/Reflecting on
Mentor's instruction o o o o o
Observing/Reflecting on
my own instruction o o o o o
Co-planning
lessons/units/assessments o o o o o
Organizing and Managing
Classroom o o o o o
Communicating with
Parents o o o o o

95
Communicating with Other
Teachers o o o o o
Communicating with
Administration o o o o o
Discussing appropriate
teaching strategies for
students with special
needs (IEPs ENLs, etc.)
o o o o o
Using a variety of teaching
methods o o o o o
Administering
Standardized Tests o o o o o
Attending
Meetings/Professional
Development Together o o o o o
Understanding the
School's Evaluation
Process o o o o o
Dealing with Stress o o o o o
Becoming Aware of
Special Benefits/Services
Provided by the School
District
o o o o o
Completing Paperwork o o o o o

96
SECTION 3 OF 4: MENTORING RELATIONSHIP
(Adapted from Mentorship Effectiveness Scale (reformatted 8/13/09) by Ron Berk. Copyright
2002 Johns Hopkins School of Nursing. Used with permission.)
To what extent would you agree with the following statements?
Strongly
Disagree
Disa-
gree
Slightly
Disagree
Slightly
Agree Agree
Strongly
Agree
My mentor was
accessible. o o o o o o
My mentor
demonstrated
professional
integrity.
o o o o o o
My mentor
demonstrated
content expertise
in my area of
need.
o o o o o o
My mentor was
approachable. o o o o o o
My mentor was
supportive and
encouraging. o o o o o o

97
My mentor
provided
constructive and
useful critiques of
my work.
o o o o o o
My mentor
motivated me to
improve my work
product.
o o o o o o
My mentor was
useful in providing
direction on
professional
issues (e.g.
networking).
o o o o o o
My mentor
answered my
questions
satisfactorily (e.g.
clear, timely,
comprehensive).
o o o o o o
My mentor
acknowledged my
contributions
appropriately.
o o o o o o
My mentor
suggested
appropriate
resources.
o o o o o o

98
SECTION 4 OF 4: JOB SATISFACTION
(Adapted from Anticipated Turnover Scale by Jan Atwood and Ada Sue Hinshaw. Copyright
1984. Used with permission.)
To what extent would you agree with the following statements?
Strongly
Disagree Disagree
Somewhat
disagree
Somewhat
agree Agree
Strongly
agree
I plan to stay
in this
position for at
least another
three years.
o o o o o o
If I were to
get a similar
job offer from
another
school/district,
I would take
it.
o o o o o o
My mentor
challenged me to
extend my abilities
(risk taking, trying
new things, etc.
o o o o o o

99
If I were to get
another job offer
in another field, I
would take it.
o o o o o o
I wouldn't want
to work
anywhere else. o o o o o o
I could spend
my entire career
working in my
current full-time
position in my
current school.
o o o o o o
If I could go
back to my
college days, I
would have
chosen a
different career
route.
o o o o o o
Deciding to stay
or leave my
position is not a
critical issue for
me at this point
in time.
o o o o o o
I plan to teach
until I retire. o o o o o o

100
APPENDIX C
Letter to Superintendents
CONSENT LETTER
December 1, 2019
Dear Superintendent,
Hope all is well so far this school year. My name is Zach Boyt, and I am a
doctoral candidate at St. John’s University in the Department of Administrative and
Instructional Leadership. I invite your teachers to participate in a research study entitled
“Where Does Mentoring Matter Most?” My faculty sponsor is Dr. Stephen Kotok of the
Department of Administrative and Instructional Leadership. The purpose of the research
is to collect perspectives on the mentoring process as a new teacher as well as their
current job satisfaction.
Participation in this research project is completely voluntary. Teachers may
decline altogether or choose not to answer any questions they don’t wish to answer.
There are no known risks to participation beyond those encountered in everyday life.
Their responses will remain confidential and anonymous.
I know your teachers’ time is precious. There are never enough hours in a day. As
such, the survey should only take approximately ten minutes to complete. The results of
the survey could be used to inform mentors on the most effective practices to use with the
new teachers they are mentoring.
To provide me consent to contact your teachers to participate in this brief but
important survey, please reply to this email with your approval.
If you have any further questions, do not hesitate to email me. For questions about
your teachers’ rights as a research participant, you may contact the University’s Human
Subjects Review Board, St. John’s University, at 718-990-1440. I thank you in advance
for both your cooperation and your support of my academic endeavors.

101
All the best,
Zachary Boyt
Doctoral Candidate
Department of Administrative and Instructional Leadership
St. John’s University

102
APPENDIX D
Letter to Participants
CONSENT FORM
January 6, 2020
Dear Teachers,
Hope all is well so far this school year. My name is Zach Boyt, and I am currently
a doctoral candidate at St. John’s University in the Department of Administrative and
Instructional Leadership. I invite you to participate in a research study entitled “Where
Does Mentoring Matter Most?” My faculty sponsor is Dr. Stephen Kotok, of the
Department of Administrative and Instructional Leadership. The purpose of the research
is to collect your perspective on the mentoring process as a new teacher (if you were
mentored), as well as your current job satisfaction. The questionnaire in the link below
has been designed to collect information on this.
Your participation in this research project is completely voluntary. You may
decline altogether or choose not to answer any questions you don’t wish to answer. There
are no known risks to participation beyond those encountered in everyday life. Your
responses will remain confidential (only I will see the results) and anonymous (aside
from you, no one, including myself, will know your specific answers). Although you will
not be compensated for your efforts, just ten minutes of your time commitment will
contribute greatly to mentoring research, so that improvements could be made to new-
teacher mentoring programs.
By agreeing to participate in this project, you agree to answer the questions in the
questionnaire to the best of your ability. It should take approximately ten minutes to
complete. Please click on the link to the survey below, and complete the survey by
Saturday, January 25th, 2020 at noon.
Here is the link:
Again, all responses are confidential and anonymous. If you have any further
questions, do not hesitate to email me. For questions about your rights as a research

103
participant, you may contact the University’s Human Subjects Review Board, St. John’s
University, at 718-990-1440. I thank you in advance for both your cooperation and your
support of my academic endeavors.
All the best,
Zachary Boyt
Doctoral Candidate
Department of Administrative and Instructional Leadership
St. John’s University

104
REFERENCES
Andrews, B.D., & Quinn, R. J. (2005). The effects of mentoring on first-year teachers'
perceptions of support received. The Clearing House, 78(3), 110-116
Bahadir-Yilmaz, E., Aydin-Pekdemir, E., Atamer, B., Cakmak, B., Celebi, Y., Iyim, G.,
& Kabak, K. (2015). A comparison of learned helplessness levels of first-year and
final-year turkish nursing students. Asian Journal of Nursing Education and
Research, 5(4), 531-536.
Barrera, A. (2008). The incidence and influence of mentorship in the professional
development of first year teachers in public schools (Doctoral dissertation).
Retrieved from ProQuest Dissertations & Theses Global. (Order No. 3332676).
Benson-Jaja, L. (2010). Evaluation of the impact of effective mentoring on teacher
retention (Doctoral dissertation). Retrieved from ProQuest Central Essentials;
ProQuest Dissertations & Theses Global; Social Science Premium Collection.
(Order No. 3463468).
Berk, R., Berg, J., Mortimer, R., Walton-Moss., B., & Yeo, T. (2005). Measuring the
effectiveness of faculty mentoring relationships. Academic Medicine, 80(1), 66-
71.
Bieler, D. (2012). What new teachers want from colleagues. Educational Leadership
69(8), 46-49.
Bogdan, R.C., & Bilken, S.K. (2016). Qualitative research for education, fifth edition.
New York: Pearson.
Boreen, J., Johnson, M.K., Niday, D., Potts, J. (2009). Mentoring beginning teachers,
second edition. Portland: Stenhouse Publishing.
Boyer, I. Maney, B., Kamler, B., & Comber, B. (2004). Reciprocal mentoring across
generations: Sustaining professional development for English teachers. English
Teaching: Practice and Critique. 3.
Cartolano, G. M. (2006). An evaluation of a long island district's new teacher induction
program as perceived by beginning teachers (Doctoral dissertation). Retrieved
from ProQuest Dissertations & Theses A&I; ProQuest Dissertations & Theses
Global. (Order No. 3225127).
Carver-Thomas, D., & Darling-Hammond, L. (2017). Teacher turnover: Why it matters
and what we can do aboutiIt. Retrieved from
https://learningpolicyinstitute.org/sites/default/files/product-
files/Teacher_Turnover_REPORT.pdf
Catapano, J. (2014). Learned helplessness, and how we can overcome it. Retrieved from
https://www.teachhub.com/learned-helplessness-and-how-we-can-overcome-it

105
Chhauger, R., Rose, E.L., & Joseph, T. (2017). Role of Self-efficacy, Optimism and Job
Engagement in Positive Change: Evidence from the Middle East. The Journal for
Decision Makers 43(4), 222-235. Retrieved from
https://doi.org/10.1177%2F0256090918819396
Clark, F.T. (2001). The Best Practices of Mentors. Classroom Leadership 4(8).
Coladarci, C., Cobb, D.C., Minium, E.W., and Clarke, R.B. (2008). Fundamentals of
statistical reasoning in education, fifth edition. Hoboken: Wiley.
Cort, R., et.al, (2004). Keeping quality teachers: The art of retaining general and special
education teachers. Retrieved from
http://www.p12.nysed.gov/specialed/publications/persprep/qualityteachers/intro.p
df
Crown, K. M. (2009). Do interactions between mentors and mentees decrease levels of
new teacher attrition? (Doctoral dissertation). Retrieved from ProQuest Central;
ProQuest Dissertations & Theses A&I; ProQuest Dissertations & Theses Global;
Social Science Premium Collection. (Order No. 3340918).
Danielson, C. (2009). Talk about teaching! Leading professional conversations.
Thousand Oaks: Corwin Press.
Darling-Hammond, L. (2007). Recruiting and retaining teachers: What matters most and
what can government do? Forum for Education. Retrieved from
http://www.forumforeducation.org/ about/index.php?item=334&page=30
Davis, E., & Grossman, P. (2012). Mentoring That Fits. Educational Leadership 69(8),
54-57.
Diaz, C.I. (2018). The Truth About Teacher Burnout: It’s Work Induced Depression.
Psych Learning Curve. American Psychological Association. Retrieved from
http://psychlearningcurve.org/the-truth-about-teacher-burnout/
Drago-Severson, E. (2009). Leading adult learning: Supporting adult development in our
schools. Thousand Oaks, Calif: Corwin.
Fay, E. (2018). Millennial teachers' perceptions of the role of principals in new teacher
induction (Doctoral dissertation). Retrieved from ProQuest Dissertations &
Theses Global. (Order No. 10815710).
Falk, B. (2012). Ending the revolving door of teachers entering and leaving the teaching
profession. The New Educator, 8.
Feiman-Nemser, S. (1996). Teacher mentoring: A critical review. Washington, DC:
ERIC Clearinghouse on Teaching and Teacher Education.
Feiman-Nesmer, S. (2012). Beyond solo teaching. Educational Leadership 69(8), 10-16.

106
Finley, T. (2018). Teaching with Depression. Edutopia. Retrieved from
https://www.edutopia.org/article/teaching-depression
Gardinier, W., & Weisling, N. (2018). Making mentoring work. Phi Delta Kappan,
99(6).
Goldrick, L. (2016). Support from the start: A 50-state review of policies on new
educator induction and mentoring. Santa Cruz: The New Teacher Center.
Retrieved from https://newteachercenter.org/wp-
content/uploads/2016CompleteReportStatePolicies.pdf
Gordon, S.P. & Maxey, S. (2000). Helping beginning teachers succeed, 2nd Edition.
Alexandria: Association for Supervision and Curriculum Development.
Gordon, R., & Gordon, M. (2006). The turned-off child: Learned helplessness and school
failure. Salt Lake City: American Book Publishing.
Hinshaw, A., & Atwood, J. (1982). Anticipated turnover: A preventive approach.
Western Journal of Nursing Research, 4(3), 54-55.
Holloway, J.H. (2001). Research link/: The benefits of mentoring. Educational
Leadership 58(8), 85-86.
Hussung, T. (2015). The Benefits of Mentoring in Business. Concordia University News
Updates. Retrieved from https://online.csp.edu/blog/business/the-benefits-of-
mentoring-in-business
Ingersoll, R. M. (2012). Beginning teacher induction: What the data tell us. Phi Delta
Kappan, 93(8), 47.
Ingersoll, R.M. (2018). Seven Trends: The Transformation of the Teaching Force –
Updated October 2018. CPRE Research Reports. Retrieved from
https://repository.upenn.edu/cpre_researchreports/108
Ingersoll, R. M., & Kralik, J. (2004). The impact of mentoring on teacher retention: What
the research says. Education Commission of the States: Research Review-
Teaching Quality. Denver, CO: Education Commission of the States
Ingersoll, R. M., & Strong, M. (2011). The impact of induction and mentoring programs
for beginning teachers: A critical review of the research. Review of Educational
Research, 81(2), 201-233.
Jones, B.K. (2012). A New Teacher’s Plea. Educational Leadership 69(8), 74-77.
Jones, E. E., & Goethals, G. R. (1972). Order effects in impression formation: Attribution
context and the nature of the entity. Attribution: Perceiving the causes of
behavior, 27-46. Morristown, NJ: General Learning Press.
Liesfield, R. (2005). Teach with your strengths: How great teachers inspire their
students. New York: Gallup Press.

107
Lipton, L, & Wellman, B. (2003). Mentoring matters: A practical guide to learning-
focused relationships, second edition. Sherman: Mira Via.
Martin, K. L., Buelow, S. M., & Hoffman, J. T. (2015). New teacher induction: Support
that impacts beginning middle-level educators. Middle School Journal, 47(1), 4-
12.
Marzano, R. J., Pickering, D., & Pollock, J. E. (2001). Classroom instruction that works:
Research-based strategies for increasing student achievement. Alexandria, Va:
Association for Supervision and Curriculum Development.
Mignott, N. N. (2011). The relationship between teacher retention and mentoring
received. (Doctoral dissertation). Retrieved from ProQuest Dissertations & Theses
A&I; ProQuest Dissertations & Theses Global (Order No. 3469585).
Moir, E. (1992). Phases of First Year Teaching – Attitudes Toward Teaching. Santa
Cruz: New Teacher Center
Morina, S.F. (2012). Mentoring and retention in first-year teachers: A mixed-methods
study (Doctoral dissertation). Retrieved from ProQuest Central; ProQuest
Dissertations & Theses Global.
National Foundation for Improvement of Education. (1999). Creating a Teacher
Mentoring Program. Retrieved from https://www.neafoundation.org/wp-
content/uploads/2017/08/NEA-Creating_Teacher_Mentoring.pdf
National Policy Board for Educational Administration (2015). Professional Standards for
Educational Leaders 2015. Retrieved from http://www.npbea.org/wp-
content/uploads/2017/06/Professional-Standards-for-Educational-
Leaders_2015.pdf
New York State Education Department. (2012). Guidelines for Implementing District –
Based Teacher Mentoring Programs. Retrieved from
http://www.highered.nysed.gov/tcert/resteachers/guidemenprog.html#two
New York State Education Department. (2019). Glossary of Terms – Report Card Data.
Retrieved from https://data.nysed.gov/glossary.php?report=reportcards
New Teacher Center. (2020). Conceptual frame for differentiated coaching. Retrieved
from https://newteachercenter.instructure.com/courses/249/pages/conceptual-
frame-for-differentiated-coaching?module_item_id=4685
Nobel, R. (2018). Mentors motivate, advise, and support. New York Teacher, 60(1).
Retrieved from https://www.uft.org/news/new-teachers/mentors-motivate-advise-
and-support
NYSUT (2012). District-based teacher mentoring programs.
http://www.nysut.org/~/media/files/nysut/resources/2014/march/factsheet_115_di
strictbasedteachermentoring.pdf
108
Phi Delta Kappan. (2019). Frustration in the schools. Retrieved from
https://pdkpoll.org/results
Rath, T. (2007). Strengths finder 2.0. New York: Gallup Press.
Richardson, M. K. (2003). Mentoring and keeping new teachers (Doctoral dissertation).
Retrieved from ProQuest Dissertations & Theses A&I; ProQuest Dissertations &
Theses Global. (Order No. 3090953).
Robbins, P. (2015). Peer Coaching: To Enrich Professional Culture, School Culture, and
Student Learning. Alexandria, Va: Association for Supervision and Curriculum
Development.
Rockoff, J. E. (2004). Essays on the finance and production of public education.
Retrieved from ProQuest Central.
Ronfeldt, M., &, McQueen, K. (2017). Does new teacher induction actually improve
retention? Journal of Teacher Education, 68 (4).
Rowley, J.B. (1999). The good mentor. Educational Leadership 56(8), 20-22.
Rutherford, P. (2002). Why didn’t I learn this in college? Alexandria, Va: Just ASK
Publications.
Rutherford, P. (2005). The 21st Century Mentor’s Handbook: Creating A Culture for
Learing. Alexandria: Just ASK Publications.
Scherer, M. (2012). The Challenges of Supporting New Teachers: A Conversation with
Linda Darling-Hammond. Educational Leadership 69(8), 18-23.
Scott, D. G. (2008). Retention of early career teachers engaged in Missouri's career
education mentoring program (Doctoral dissertation). Retrieved from ProQuest
Central; ProQuest Dissertations & Theses A&I; ProQuest Dissertations & Theses
Global; Social Science Premium Collection (Order No. 3374921).
Seligman, M.E.P. (1972). Learned helplessness. Annual Review of Medicine 23(1), 407-
412.
Seligman, M.E.P. (1976). Learned helplessness and depression on animals and men.
Morristown: General Learning Press.
Seligman, M. E. P. (1991). Learned optimism: How to change your mind and your life.
New York: Vintage Books.
Seligman, M. E. P. (2013). Flourish: A visionary new understanding of happiness and
well-being. New York: Vintage Books.
Smith, L. (2009). Mentors and mentees perceptions on a system-wide mandated
mentoring program for first-year teachers. (Doctoral dissertation). Retrieved from
ProQuest Central Essentials; ProQuest Dissertations & Theses Global; Social
Science Premium Collection. (Order No. 3390593).

109
Stanulis, R. N., & Floden, R. E. (2009). Intensive mentoring as a way to help beginning
teachers develop balanced instruction. Journal of Teacher Education, 60(2), 112-
122.
Stapleton, P. (2019). Teachers are more depressed and anxious than the average
Australian. The Conversation. Retrieved from
http://theconversation.com/teachers-are-more-depressed-and-anxious-than-the-
average-australian-117267
Stoeffler, S. W. (2019). Social work and poverty: A critical examination of intersecting
theories. Social Development Issues, 41(2), 21-32.
Strauss, V. (2013) Teacher: What I can’t do for students. The Washington Post,
November 8th, 2013.
Vogt, W.P., et. al. (2012). When to use what research design. New York: Guilford.
Watson, D. M. (2012). An analysis of New York state teacher mentoring programs:
Identifying components that meet teacher needs and change practice (Doctoral
dissertation). Retrieved from ProQuest Central; ProQuest Dissertations & Theses
Global. (Order No. 3539436).
Wider, B. S. (2012). The impact of mentoring programs on teachers in urban middle
schools (Doctoral dissertation). Retrieved from ProQuest Dissertations & Theses
Global. (Order No. 3544457).
Wong, H. K., & Wong, R. T. (1998). The First Days of School: How to Be an Effective
Teacher. Mountain View: Harry K. Wong Publications.
Worthy, J. (2005). It didn’t have to be so hard: The first years of teaching in an urban
school. International Journal of Qualitative Studies in Education, 18, 379-398.

Vita
Name Zachary Boyt
Baccalaureate Degree Bachelor of Fine Arts, New York
University, New York, NY
Major: Cinema Studies
Date Graduated August 2004
Other Degrees and Certificates
Date Graduated
Date Graduated
Master of Science, City College of New
York, New York, NY
Major: Secondary Mathematics Education
August 2007
Master of Education, Teachers College,
Columbia University, New York, NY
Major: Educational Leadership
August 2012